Abstract
In order to improve the Cu/Cu joint quality, the bottom Cu sheet surface to be welded was dampened by a drop of absolute ethyl alcohol before the welding. Then, the ultrasonic spot welding (USW) was utilized to join a 0.5 mm thick Cu sheet to a 1.0 mm thick Cu sheet. The results demonstrated that, due to the action of the alcohol, obvious changes of the welding interface temperature, effective thickness, bond density, interface microstructure, joint resistance, micro-hardness, lap shear strength and fracture mode occurred in comparison with the joint without alcohol. Discontinuous dynamic recrystallization took place at the welding interface and facilitated the migration of grain boundaries across the contact interface, leading to the formation of the metallurgical bonding between the two Cu sheets.
1. Introduction
Lithium-ion batteries, having the excellent merits of long service life, high energy density and light weight, are widely used in the electric vehicle to make the environment better and cleaner [1]. In order to satisfy the requirement of large-scale energy storage, a great number of cells are inevitably connected to form a module, and a battery pack consists of plenty of such modules. Thus, numerous connections of the busbar and tab, with an overlap configuration, are required. Copper, having excellent electrical and thermal conductivities, suitable corrosion resistance and mechanical strength, can be utilized for the bus-bar and battery tab [2]. Ultrasonic spot welding (USW) is an appropriate method to carry out the needed connections mentioned above. Generally, battery packs used in electric vehicles should undergo complex working conditions, such as intensive vibrations, extreme differences in temperature, and possess a high power [3]. Meanwhile, to improve the use efficiency of lithium-ion batteries, the energy loss should be as little as possible when the current passes through the joints. The higher electrical resistance in a battery pack will result in a lower power efficiency and capability [4]. Therefore, bus-bar to tab joints possessing a high mechanical strength and low electrical resistance are of a vital importance for the proper functioning of lithium-ion batteries.
A number of works were carried out to investigate the mechanical and electrical properties of USWed joints. Dhara et al. [5] studied the influence of welding pressure, vibration amplitude and welding time on the mechanical properties and microstructure of USWed joints of multi-layered Al tabs to Cu bus-bar and demonstrated that the welding mechanisms were the wave-like material flow, interfacial material mixing and formation of micro-joints. Das et al. [6] studied the effects of welding parameters on the mechanical strength of joints and process robustness for USW of three 0.3-mm Al sheets to a single 1.0-mm copper sheet. The sensitivity and relationship between the welding parameters and the joint quality were obtained based on the developed response surfaces. Lee et al. [7] investigated the correlation between the welding signal features, welding process conditions and joint quality for the USW of the 1.0-mm nickel-plated Cu sheet to a 0.4-mm Cu sheet. A reliable online quality monitoring in the joining of lithium-ion batteries has been obtained, depending on the characteristic option and early diagnosis. Lee et al. [8] identified the correlation between the weld properties and physical weld attributes based on the characterization of the Vickers hardness, scanning electronic microscopy and optical images and performed a classification of the weld quality. Lee et al. [9] demonstrated that the distance of relative motion between the two sheets to be welded was critical to the generation of the frictional heat at the faying interface. A coarse-knurled anvil was demonstrated to be beneficial for enhancing the bond density and mechanical properties of the welding interface and to have the advantage of a long lifetime. Ma et al. [10] studied the effect of the welding process parameters on the displacement signal and established an interrelationship between the plastic deformation, vertical displacement and joint quality. Li et al. [11] investigated the formation mechanism of an USWed joint of two Sn-coated T2 Cu plates and demonstrated the phenomenon of an enhanced element diffusion at the welding interface. Moreover, grain refinement in Cu6Sn5, Cu3Sn, and Cu phases was observed near the wave-like areas. The wave-like (swirl) pattern was induced by the uneven interface stress distribution and the cavitation effect in the liquid Sn phase. Ma et al. [12] investigated the influence of the shear strain, strain rate and heat due to plastic deformation on the joint quality and recrystallization. Reducing the micro-asperity size on Cu sheets was conductive to the generation of the low strain rate and the high shear strain, resulting in an enlargement of recrystallization areas. Das et al. [4] reported electrical and thermal properties of USWed joints of 0.3-mm Al/nickel-coated Cu sheets to 1.0-mm Cu sheets. A theoretical model was developed to analyze the property of the battery pack. Shin et al. [13] analyzed the influence of lap-joint configurations on the electrical resistance and mechanical properties of USWed multiple Cu-Al layers. In the case of the multilayered similar joints of Cu, thick Cu as the bottom sheet close to the anvil side could reduce the joint electrical resistance. Das et al. [14] investigated the electrical contact resistance and corresponding temperature rise profiles for the USWed joints of Cu to Al sheets with varying thicknesses and demonstrated that increasing the sheet thickness could reduce the change of the electrical resistance. The average increased temperature or electrical resistance for the 0.3 mm Al sheet was 60% higher than that for the 0.3 mm nickel-coated Cu sheet. Based on the results mentioned above, it is effective to further improve the joint quality through enhancing the effective thickness and bond areas at the welding interface.
How to simultaneously improve the effective thickness and bond areas at the welding interface is a matter of significant importance. USW is a solid-state process, which produces interface joining through the simultaneous action of high-frequency reciprocating shear vibrations and appropriate clamping pressure [15]. The relative motion between the top and bottom sheets is driven by the sonotrode tip. It is critical to the generation of the friction and deformation heat and ultrasonic softening effect, and consequently the joint interface formation. However, during USW, the relative motion will also occur at the interface of the sonotrode tip/top sheet [16]. This lowers the driving effect of the sonotrode tip on the top sheet, leads to the generation of the friction heat and ultrasonic softening and consequently the thin effective thickness and the weak welding interface bonding [17]. Therefore, changing the friction conditions between the top sheet and the bottom sheet is an effective method.
It was reported that alcohol possessing polarized terminals can physically adsorb to the inert metal surface, leading to the excellent lubricating action [18,19]. At the same time, alcohol is a volatile component. It will not remain at the welding interface by the end of USW. Therefore, in this study, ethanol is used in the hope to improve the conditions at the top/bottom sheets interface and correspondingly enhance the joint quality. Based on a comprehensive analysis of the mechanical and electrical behaviors and corresponding mechanisms of the formation of USWed Cu/Cu joints, it will be possible to understand why the joint strength and electrical resistance are different when welding with and without alcohol.
2. Experimental Work
2.1. Base Materials and Welding Condition
Each joint contained one 0.5 mm thickness pure Cu sheet (Cu-0.001Bi-0.002Sb-0.001As-0.005Fe-0.005Pb-0.005S, wt.%) as the top specimen and one 1.00 mm thickness sheet of the same composition at the bottom. All sheets had the dimensions of 25 mm × 100 mm. The schematic diagram of USW and weld lap configuration were reported in our previous study [20]. For the lap configuration, 25 mm overlap of Cu and Cu sheets was set. During ultrasonic spot welding, the 0.5 mm thickness Cu sheet, as the top sheet, was placed directly below the sonotrode tip. The 1.0 mm thickness Cu sheet, as the bottom sheet, was placed directly on the anvil. The relative motion between the two Cu sheets was driven by the sonotrode tip. The surfaces of the original Cu sheets were polished by 800 # sand paper, and then cleaned with alcohol. Before the welding, the Cu sheet surface to be welded was wet with 0.2 mL absolute ethyl alcohol. An Ultrasonic Expert BWX-D2042 welder having a frequency of 20 kHz was employed to join the Cu sheets. The vibration direction of the sonotrode tip was parallel to the shorter side of the Cu sheet. Sonotrode tip of the size 8.8 mm × 7 mm was used [20]. Welding pressures of 0.45 MPa and 0.55 MPa were selected as input variables, while the welding time and vibration amplitude were kept constant at 0.6 s and 50%, respectively. The typical weld zone is shown in Figure 1a. Valley and peak regions existed at the weld zone cross section, and the corresponding diagrammatic drawing is given in Figure 1b. Peak region was directly below the sonotrode tip peak, and the valley region was directly below the sonotrode tip valley. The effective thickness (Figure 1b) was defined as the minimum thickness of the top Cu sheet of the Cu/Cu joint with or without alcohol at each welding pressure. The bond density for the joints at different values of the welding pressure was evaluated by identifying the welded and unwelded regions at the weld interface through optical microscope images and calculating the proportion of the bonded portion projected onto the horizontal line to the entire weld zone width.

Figure 1.
Diagrammatic drawings of the weld zone of Cu/Cu joint (a) and its partial cross section (b).
2.2. Macro-/Microstructure Characterization
Optical microscope Olympus GX 53 (Olympus (China) Co., Ltd., Beijing, China) and scanning electron microscope (SEM) Tescan VEGA3 LMU (Tesken (China) Co., Ltd., Shanghai, China) were utilized to characterize the microstructure and fracture morphology. Based on the results of optical microscopic observations of the cross sections of the weld zone, a representative region at the welding interface was cut by the focused ion beam (ZEISS (China) Co., Ltd., Shanghai, China) and characterized using transmission electron microscope (Talos (China) Co., Ltd., Shanghai, China) for further studies on the mechanism of the joint interface formation.
2.3. Mechanical Property, Temperature and Electric Resistance Characterization
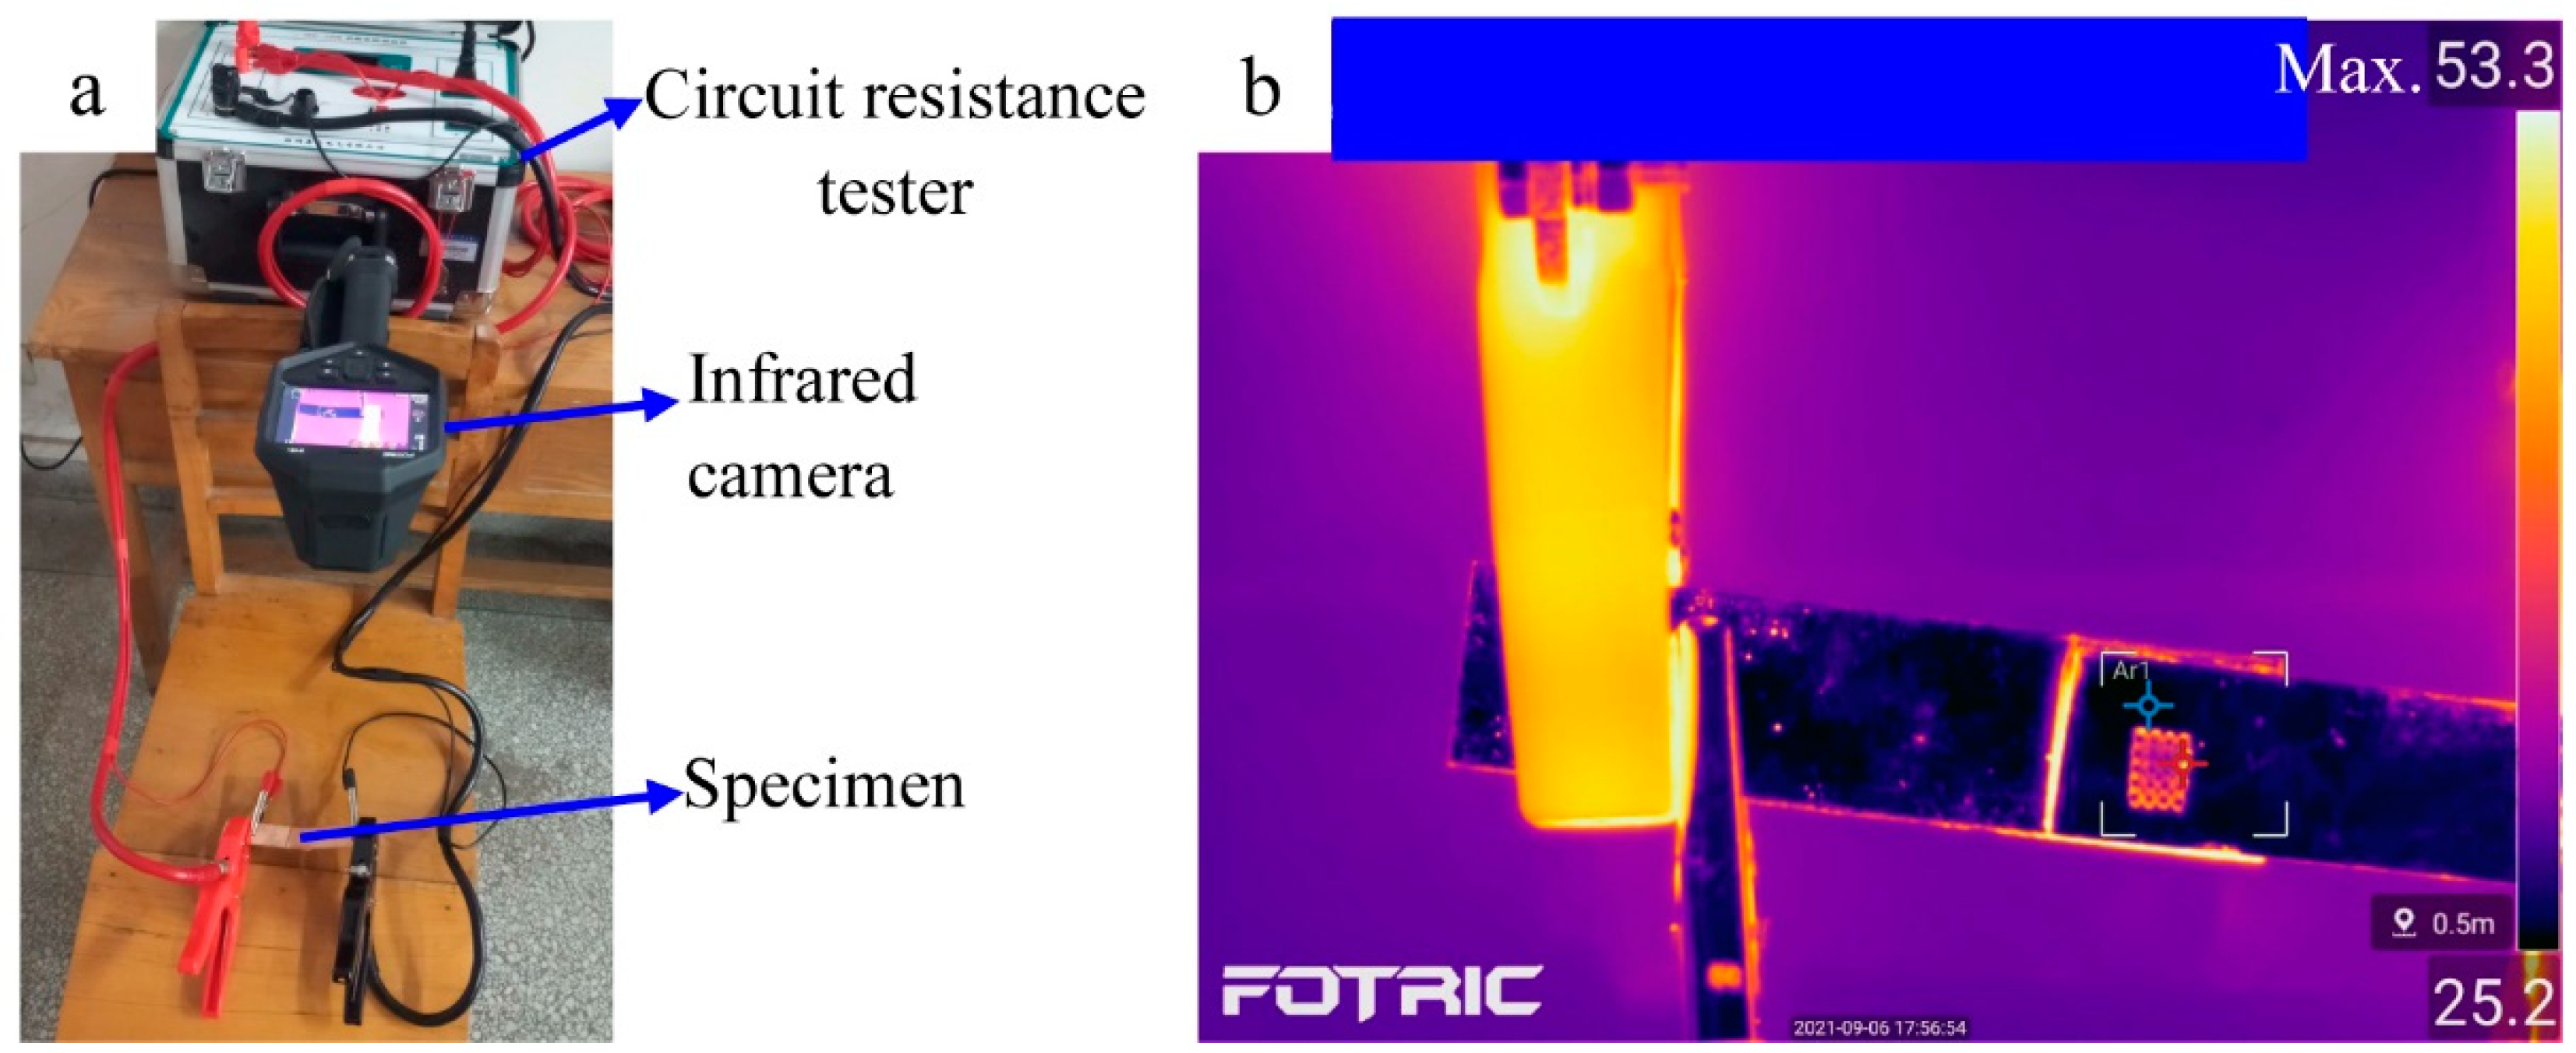
The joint strength was measured employing a universal tester (Suzhou Jiada CNC stretching Machinery Co., Ltd., Suzhou, China) in a 1 mm/min transverse speed at room temperature [20]. For each welding pressure, five joints were fabricated for tensile tests. The welding interface temperature was measured using a sacrificial 0.127 mm diameter K-type thermocouple placed in the precisely drilled channel on the bottom sheet, to contact the center of the weld zone. The position for the thermocouple detection was near the region below the sonotrode tip peak as close as possible [20]. A constant current of 200 amperes passed the joints for 60 s, and the resulting joint electrical resistance was measured employing a JBHL-200B loop resistance tester (Yangzhou Jiabao Electric Co., Ltd., Yangzhou, China). The corresponding temperature of the weld zone was tested by the Fortric-348X infrared camera (Shanghai Reimage Electromechanical Technology Co., Ltd., Shanghai, China). The image of the measuring joint resistance and its corresponding temperature, and the typical temperature distribution at the weld zone obtained from the infrared thermal picture, are represented on Figure 2. Four-wire Kelvin method was employed for the measurement of the joint electrical resistance. To enhance the measurement accuracy of the electrical resistance, an insulation paper was placed in the area outside the weld zone in the lap region. The measurement location was identified, and the schematic illustration of the joint electrical resistance measurement was shown in Figure 3.

Figure 2.
Image of the measuring joint resistance and its corresponding temperature (a), and the typical temperature distribution at the weld zone obtained from the infrared thermal image (b).

Figure 3.
Schematic illustration of the joint electrical resistance measurement.
3. Results and Discussion
3.1. Welding Interface Temperature
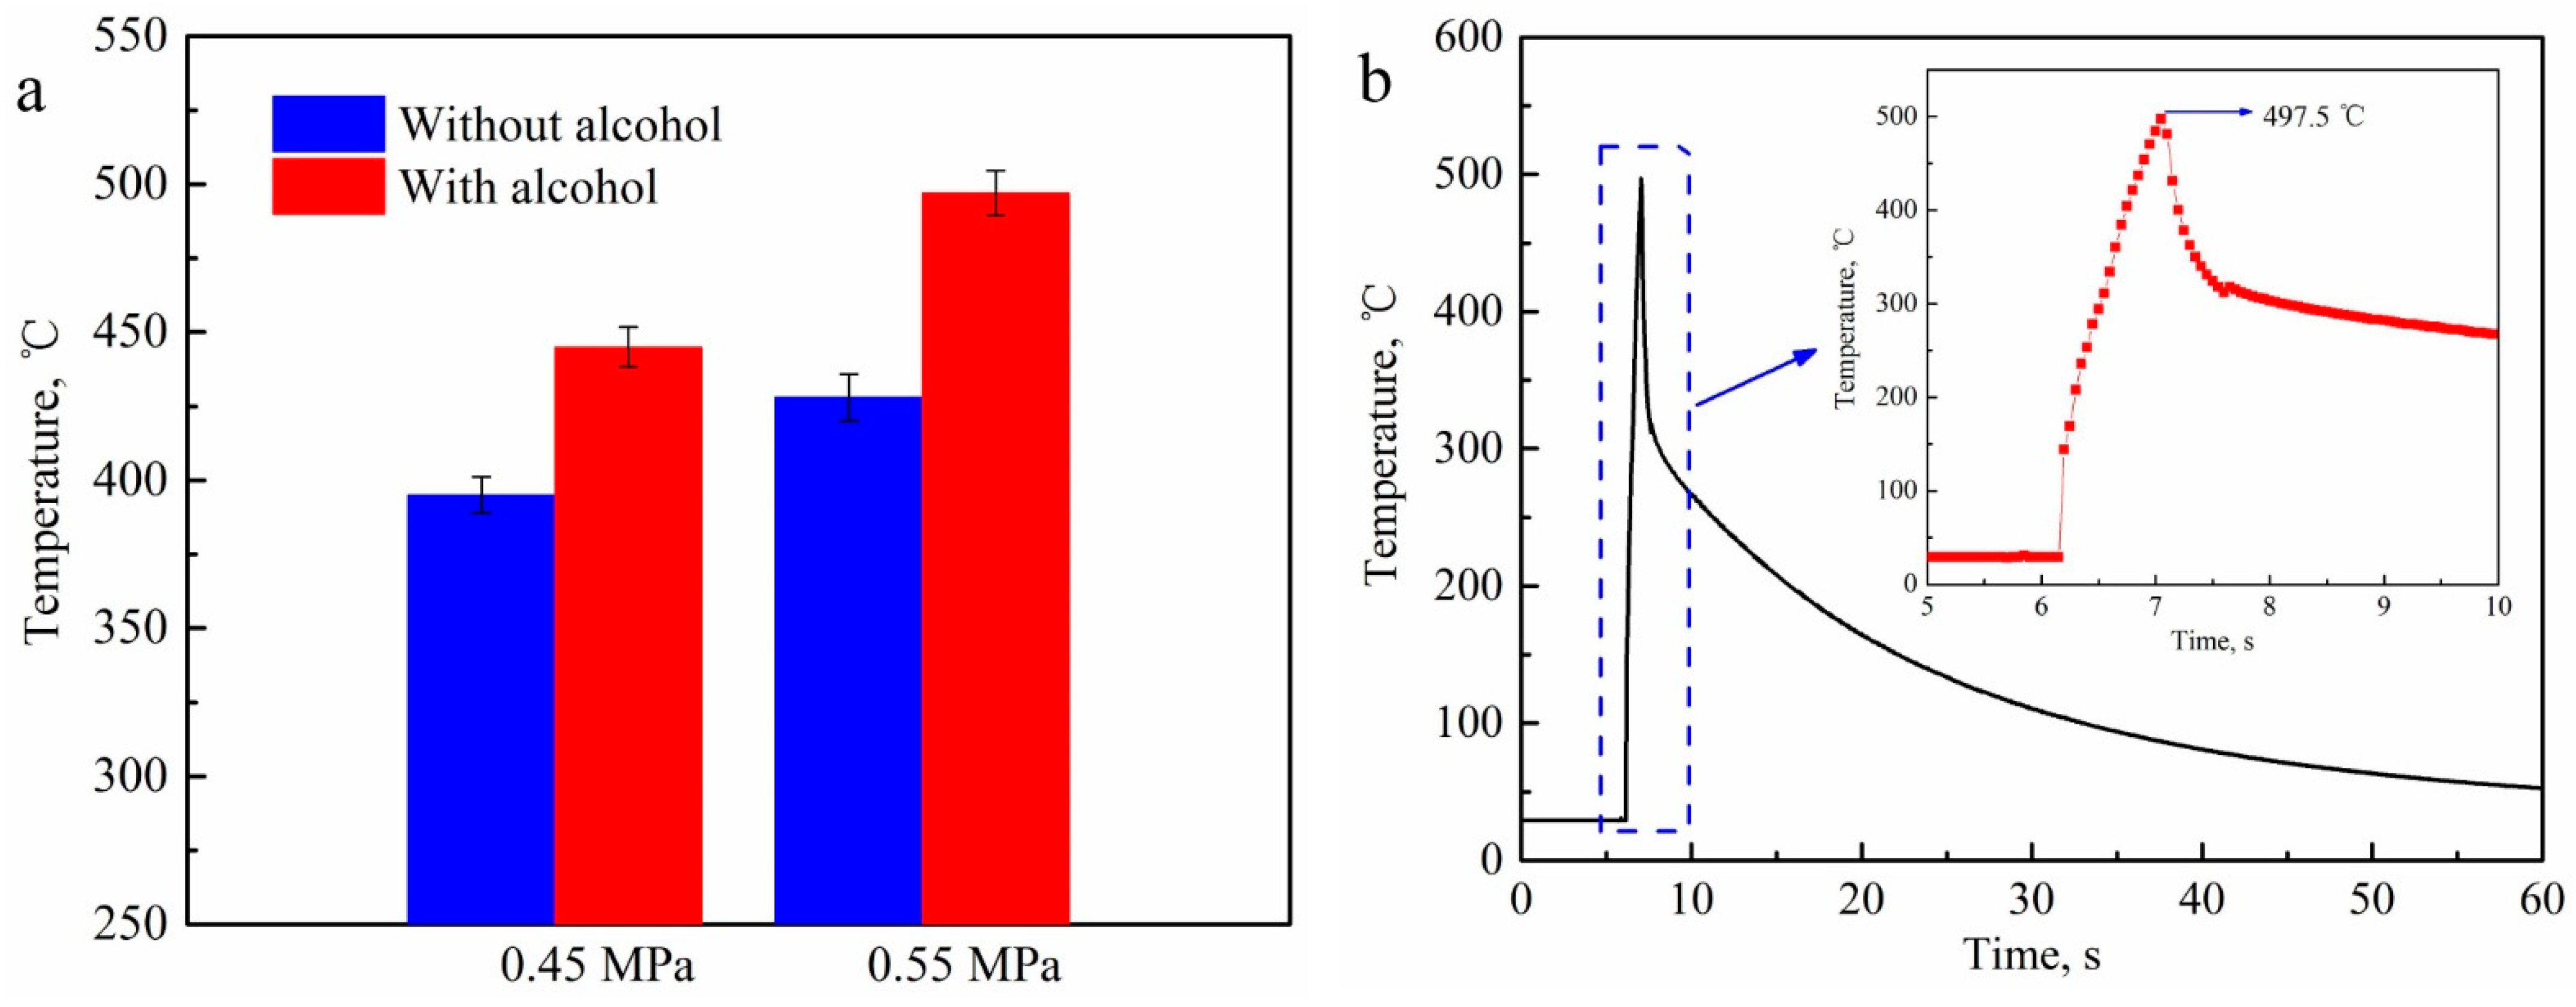
Figure 4 shows the welding interface temperature of the joints without and with alcohol at 0.45 MPa and 0.55 MPa welding pressures and the representative welding interface temperature profile for the joint with alcohol at 0.55 MPa welding pressure. From Figure 4a, it can be observed that with the increasing welding pressure, the welding interface temperature increases. Meanwhile, due to the alcohol addition, the welding interface temperatures for the joints at 0.45 MPa and 0.55 MPa welding pressures increased by 12.6% and 13.9% with respect to the corresponding temperatures of the joints without alcohol. The reason for this difference can be explained as follows. During USW, the amplitude and duration of the relative reciprocating motion between the top and bottom sheets are affected by the interface friction condition [17]. Because of the action of alcohol, the friction coefficient is reduced [18,19]. The top sheet can be easily driven by the sonotrode tip. This can promote the enhancement of the amplitude and duration of the relative reciprocating motion at the interface of the top/bottom sheets. Therefore, the welding interface temperature for the joint with alcohol can be significantly enhanced in comparison with the joint without alcohol. From Figure 4b, the temperature increases at the tremendous rate of 829.3 °C s−1 within the very short time that is caused by the massive friction heat generation under the cooperative action of the welding pressure and high frequency reciprocating vibration, and the adiabatic heating phenomenon [21]. The average cooling rate is about 9.2 °C s−1. The slope of the cooling curve varies with the cooling time. In the initial stage, the slope is pretty big due to the heat conduction through the sonotrode tip and anvil, because the two Cu sheets still closely in contact the sonotrode tip and anvil for another 0.3 s after the stop of high frequency shear vibrations. Thereafter, the sonotrode tip returns to the original position, i.e., detaches from the specimens. Thus, the cooling rate and slope of the curve decrease.

Figure 4.
Welding interface temperature of the joints without and with alcohol at 0.45 MPa and 0.55 MPa welding pressures (a) and the representative welding interface temperature profile for the joint with alcohol at 0.55 MPa welding pressure (b).
3.2. Joint Cross Section and Microstructure
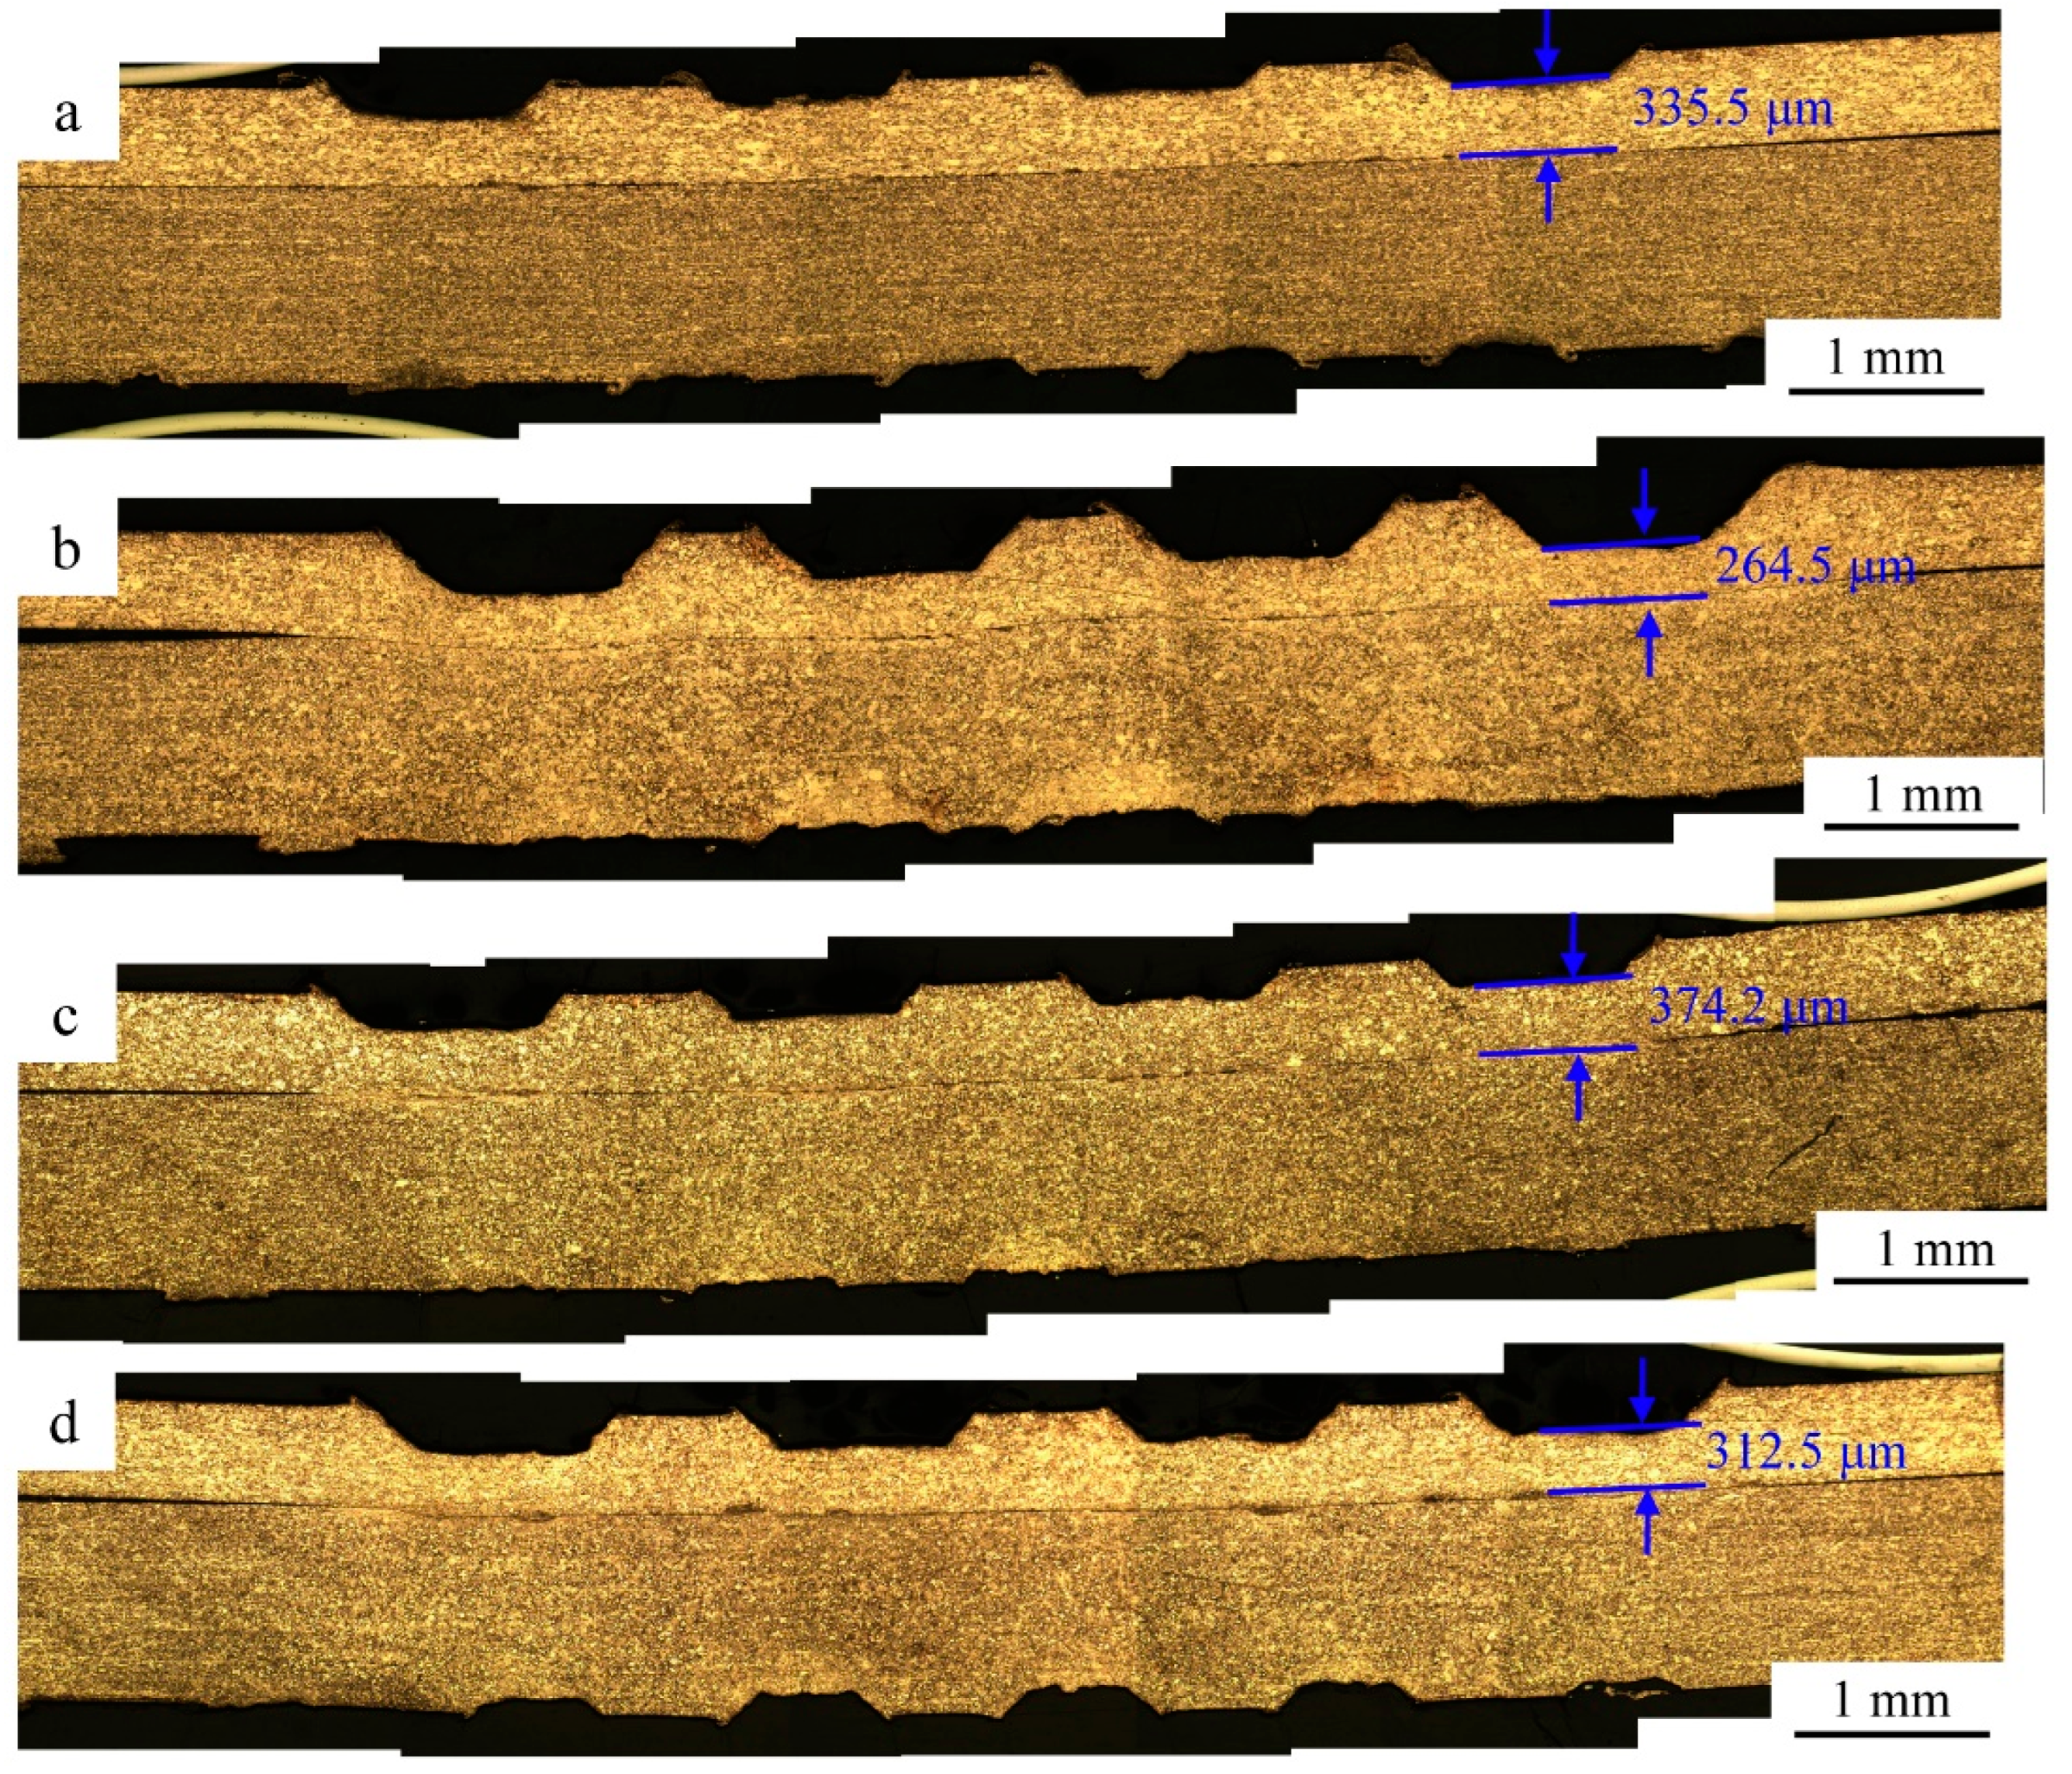
Figure 5 shows the optical micrographs of the cross-sections of the weld zone for the joints without and with alcohol. With an increase in the welding pressure, the bond density increases. In comparison with the joints without alcohol, the bond densities for the joints with alcohol at 0.45 MPa and 0.55 MPa welding pressures are increased by 29.6% and 17.3%, respectively. Moreover, it can also be observed that the indentations induced by the sonotrode tip peak exist on the top sheet. The indentation depth increases as the welding pressure increases. In comparison with the joints without alcohol, the indentation depth is obviously decreased for the joints with alcohol at 0.45 MPa and 0.55 MPa welding pressures, and the corresponding effective thickness is increased by 11.5% and 18.1%, respectively. Due to the reduced friction coefficient at the interface of top/bottom sheets induced by the alcohol, the top sheet can be easily driven. Thus, the amplitude and duration of the relative motion at the interface of sonotrode tip/top sheet can be effectively suppressed, which leads to the reduction of the friction heat and the ultrasonic softening effect [22,23] and consequently to the decreased penetrating depth into the top sheet. As a result, the effective thickness for the joints with alcohol can be enhanced.

Figure 5.
Optical micrographs of the cross-sections of the weld zone for the joints without ((a)—0.45 MPa, (b)—0.55 MPa) and with alcohol ((c)—0.45 MPa, (d)—0.55 MPa).
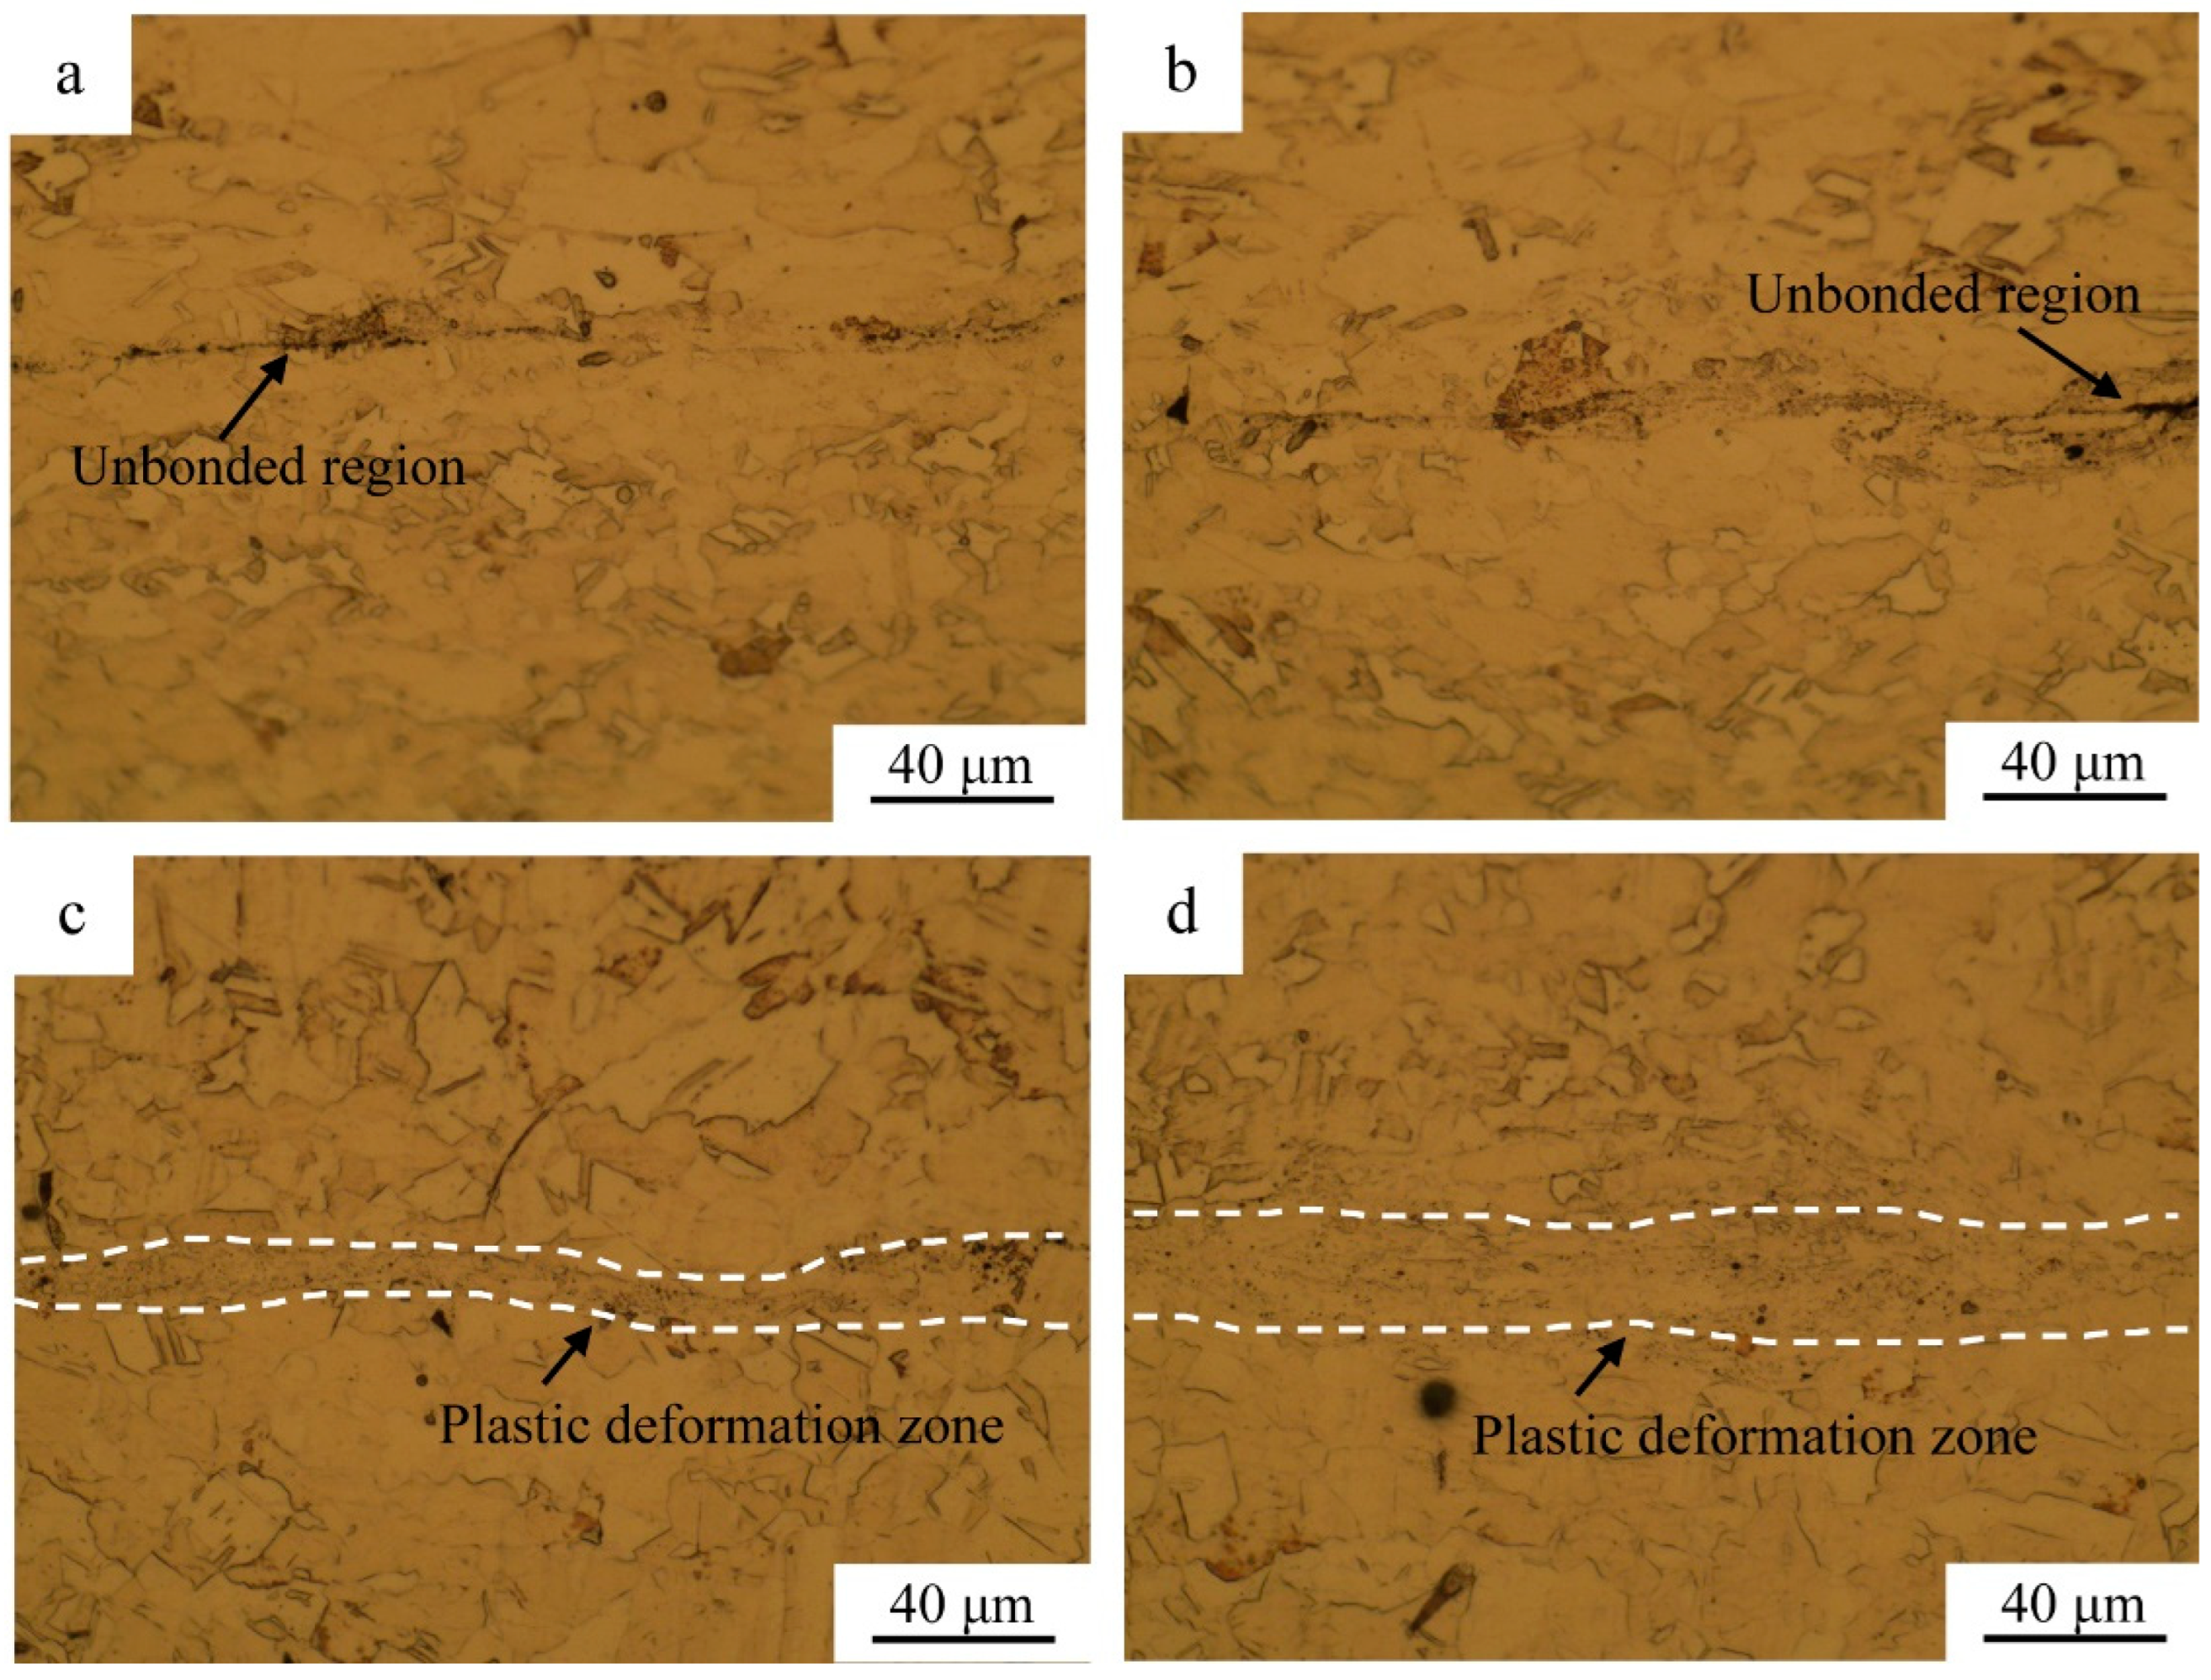
Figure 6 shows the optical micrographs of the welding interface for the joints without (a—0.45 MPa, c—0.55 MPa) and with alcohol. From the result in the previous study [20], the welding interface below the sonotrode peak is critical to the joint mechanical strength. Therefore, the welding interface microstructure below the sonotrode peak is analyzed in this study. It can be detected that the unbonded regions gradually disappear as the welding pressure increases, and almost no unbonded regions are present. Note that, along the weld zone thickness, the width of plastic deformation zone (26.7 μm) for the joint with alcohol at the 0.55 MPa welding pressure is 74.5% higher than that (15.3 μm) for the joint without alcohol at 0.55 MPa. Because of the alcohol action, the amplitude and duration of the relative motion at the interface of the top/bottom sheets can be obviously improved, so the welding interface temperature can be significantly enhanced (Figure 4). The elevated temperature can accelerate more materials softening and in turn facilitate severe plastic deformation. It is demonstrated by the results of the optical microscopy presented on Figure 6c,d. The microbumps on the base metal surface are also crushed by severe plastic deformation, leading to an increase in the storage energy that promotes dynamic recrystallization and leads to the decrease in the unbonded region area. It can also be demonstrated by the bond density obtained from Figure 5. Severe plastic deformation at the welding interface is beneficial to the interfacial metallurgical bonding [24].

Figure 6.
Optical micrographs of the welding interface for the joints without ((a)—0.45 MPa, (c)—0.55 MPa) and with alcohol ((b)—0.45 MPa, (d)—0.55 MPa).
Figure 7 presents a TEM image of the welding interface for the joint with alcohol processed at 0.55 MPa welding pressure. The average grain size here is about 265 nm at the welding interface, demonstrating that the grains were obviously refined in comparison with those in the initial 0.5 mm and 1.0 mm Cu sheets (6.3 and 5.2 μm, respectively). The ultrafine-grained microstructure can improve the mechanical strength and result in a better resistance to crack propagation [25]. The brightness on the grains is different indicating that the grain orientations are randomly distributed [26]. Meanwhile, almost no dislocations can be found in the grains. In other words, the microstructure at the welding interface consists of dislocation-free nanosized grains having no significant texture. At the periphery of the nanosize-grained region, some dislocation walls can be observed. This indicates that the main deformation mechanism at the welding interface is the dislocation slip. All these characteristics can be ascribed to discontinuous dynamic recrystallization [25]. Moreover, gradient grain size occurs from the weld joint interface to the base metal due to the generation of gradients of the strain, strain rate and temperature [27]. During USW, the plastic deformation at the welding interface occurs with a high strain rate of the order of 103 s−1 [15,28], which can promote the formation of dislocation substructure and consequently be an increase in the storage energy. When the storage energy and the welding interface temperature reach the threshold value, discontinuous dynamic recrystallization occurs. The peak temperature at the welding interface for the joint with alcohol at 0.55 MPa welding pressure is about 497 ± 4.5 °C, which is about 0.4 Tm (where Tm = 1085 °C is the melting temperature of bulk Cu), and can induce the initiation of discontinuous dynamic recrystallization. This results in the migration of grain boundaries across the contact interface, leading to the formation of a good metallurgical bonding between the two Cu sheets. The growth of the nano-scaled grains at the welding interface is hindered due to the short welding time and high cooling velocity (Figure 4).

Figure 7.
TEM image of the welding interface for the joint with alcohol processed at 0.55 MPa welding pressure.
3.3. Joint Electric Resistance and the Corresponding Peak Temperature
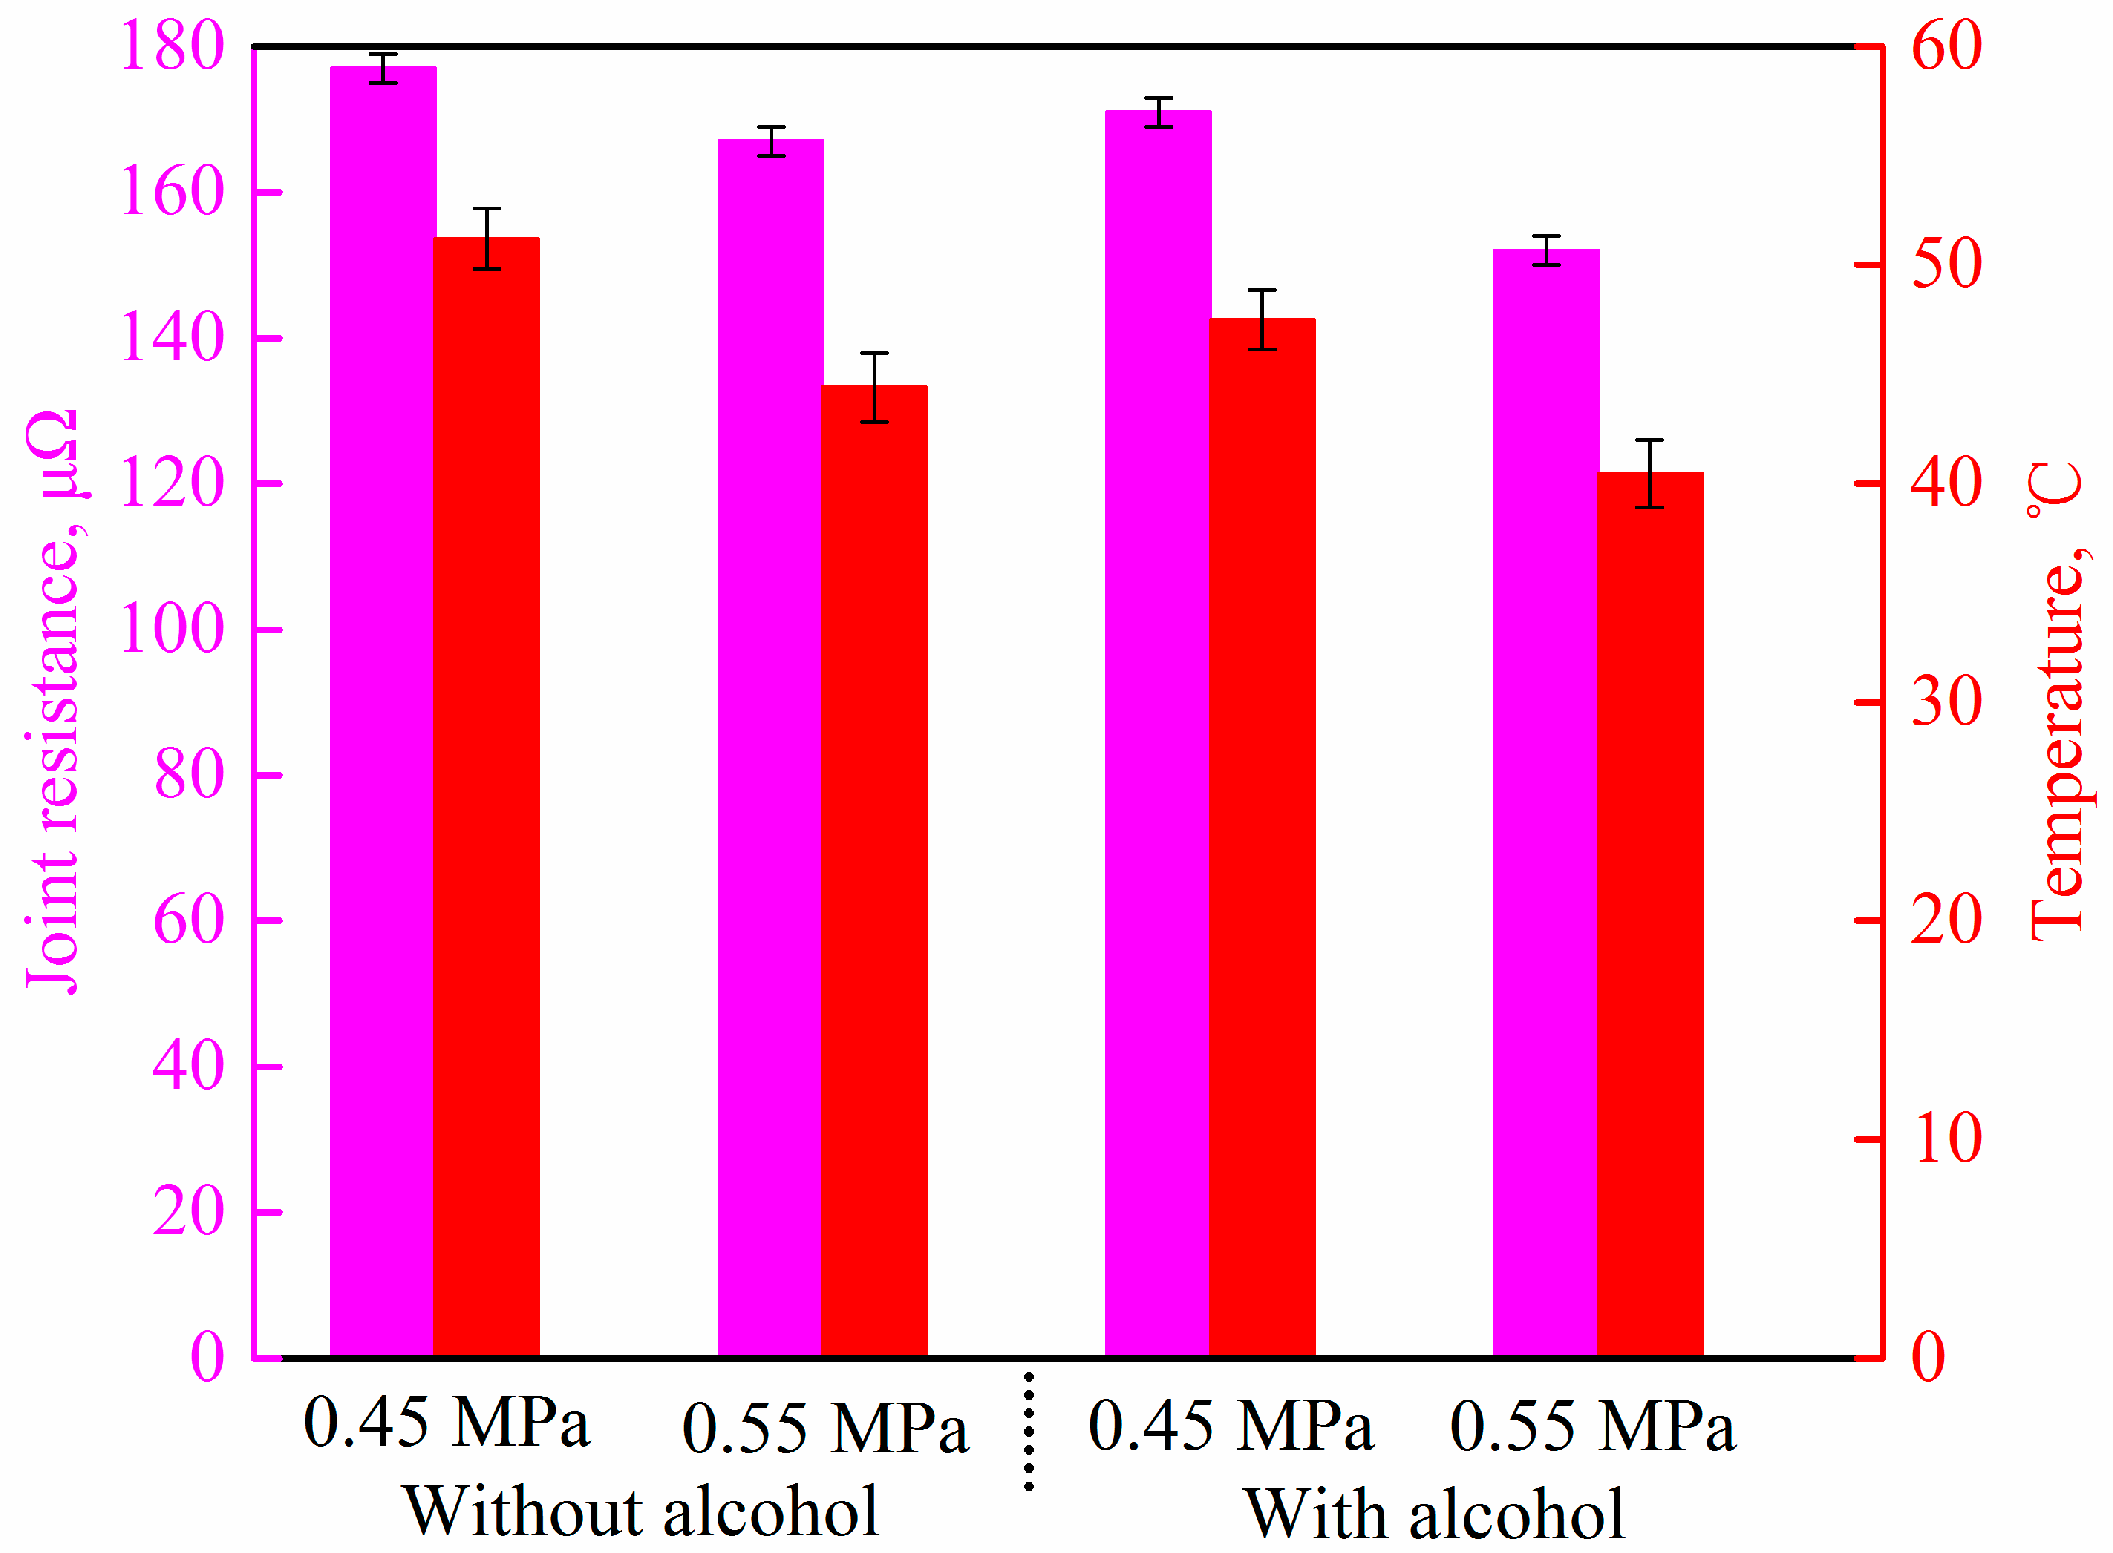
Figure 8 demonstrates the values of the joint resistance after a 200 A current flow for 60 s time and the corresponding peak temperatures at the weld zone. With an increase in the welding pressure, the joint resistance and corresponding peak temperature at the weld zone decrease. Comparing with the joints without alcohol, the joint resistance for the joints with alcohol at pressures of 0.45 MPa and 0.55 MPa decreased by an amount of 3.5% and 8.9%, respectively and the corresponding peak temperatures were reduced by 7.2% and 8.8%, respectively. The reason for this can be rationalized as follows. Based on the results mentioned above, the bond density and the effective thickness of the joints with alcohol all obviously increase in comparison with the joints without alcohol. It is well-known that the smaller the area of the cross-section, the greater the electrical resistance. The enhanced bond density and effective thickness are favorable to reduce the joint electrical resistance and related Joule heat generation when large amounts of current passes through the joints. The current flow through the USWed joints warms them up due to the effect of Joule heating and consequently increase the temperature. As the electrical resistance and Joule heat generation are reduced for the joints with alcohol, this results in a decrease in the temperature rise at the weld zone.

Figure 8.
Joint resistance after 200 A current flow for 60 s time and the corresponding peak temperature at the weld zone.
3.4. Joint Mechanical Properties
3.4.1. Vickers Micro-Hardness
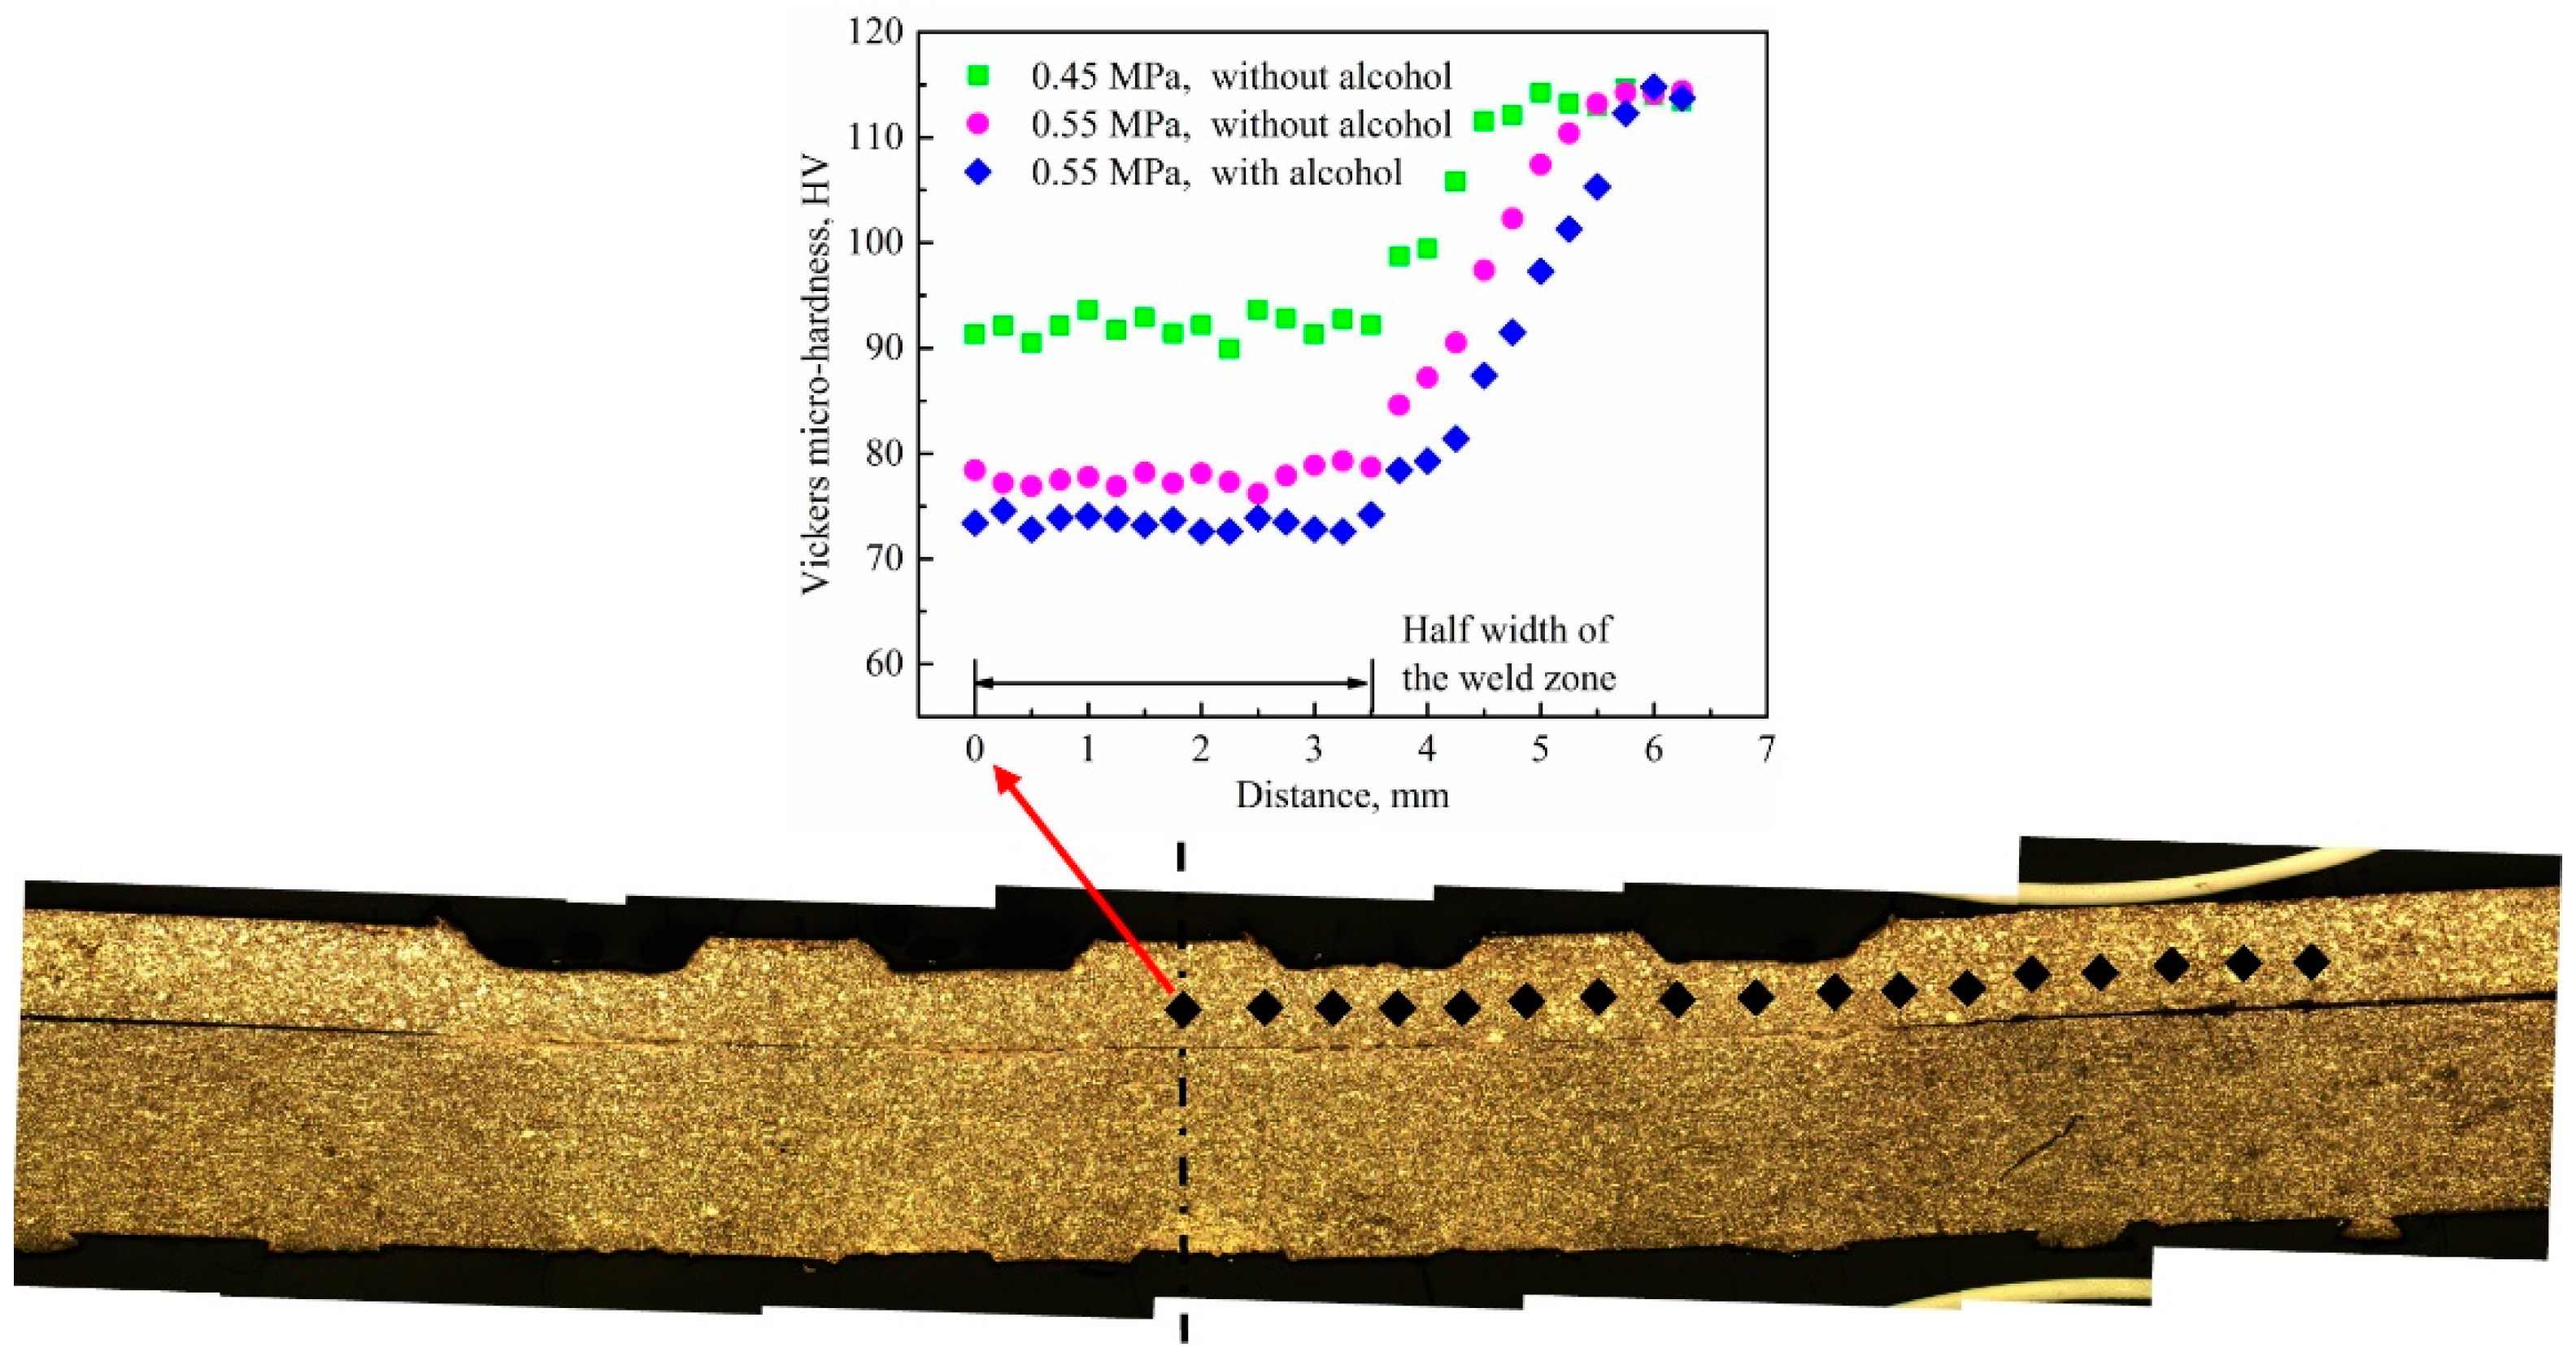
Figure 9 shows the Vickers micro-hardness along the half thickness of the top sheet cross-section of the joints. With an increase in the welding pressure, the Vickers micro-hardness at the weld zone decreases. The hardness at the weld zone for the joint without alcohol is higher than that for the joint with alcohol. In addition, hardness changes in the region of transition from the weld zone to the base metal. It is well known that high temperature can accelerate the dislocation annihilation and grain growth resulting in a decrease in the hardness. For the joint without alcohol, the welding temperature increases due to the increase in the welding pressure (Figure 4). Meanwhile, the welding temperature for the joint with alcohol is higher than that for the joint without alcohol. Therefore, the corresponding hardness variation tendency can be observed in Figure 9.

Figure 9.
Vickers micro-hardness along the half thickness of the top sheet cross-section of the joints.
3.4.2. Lap Shear Strength
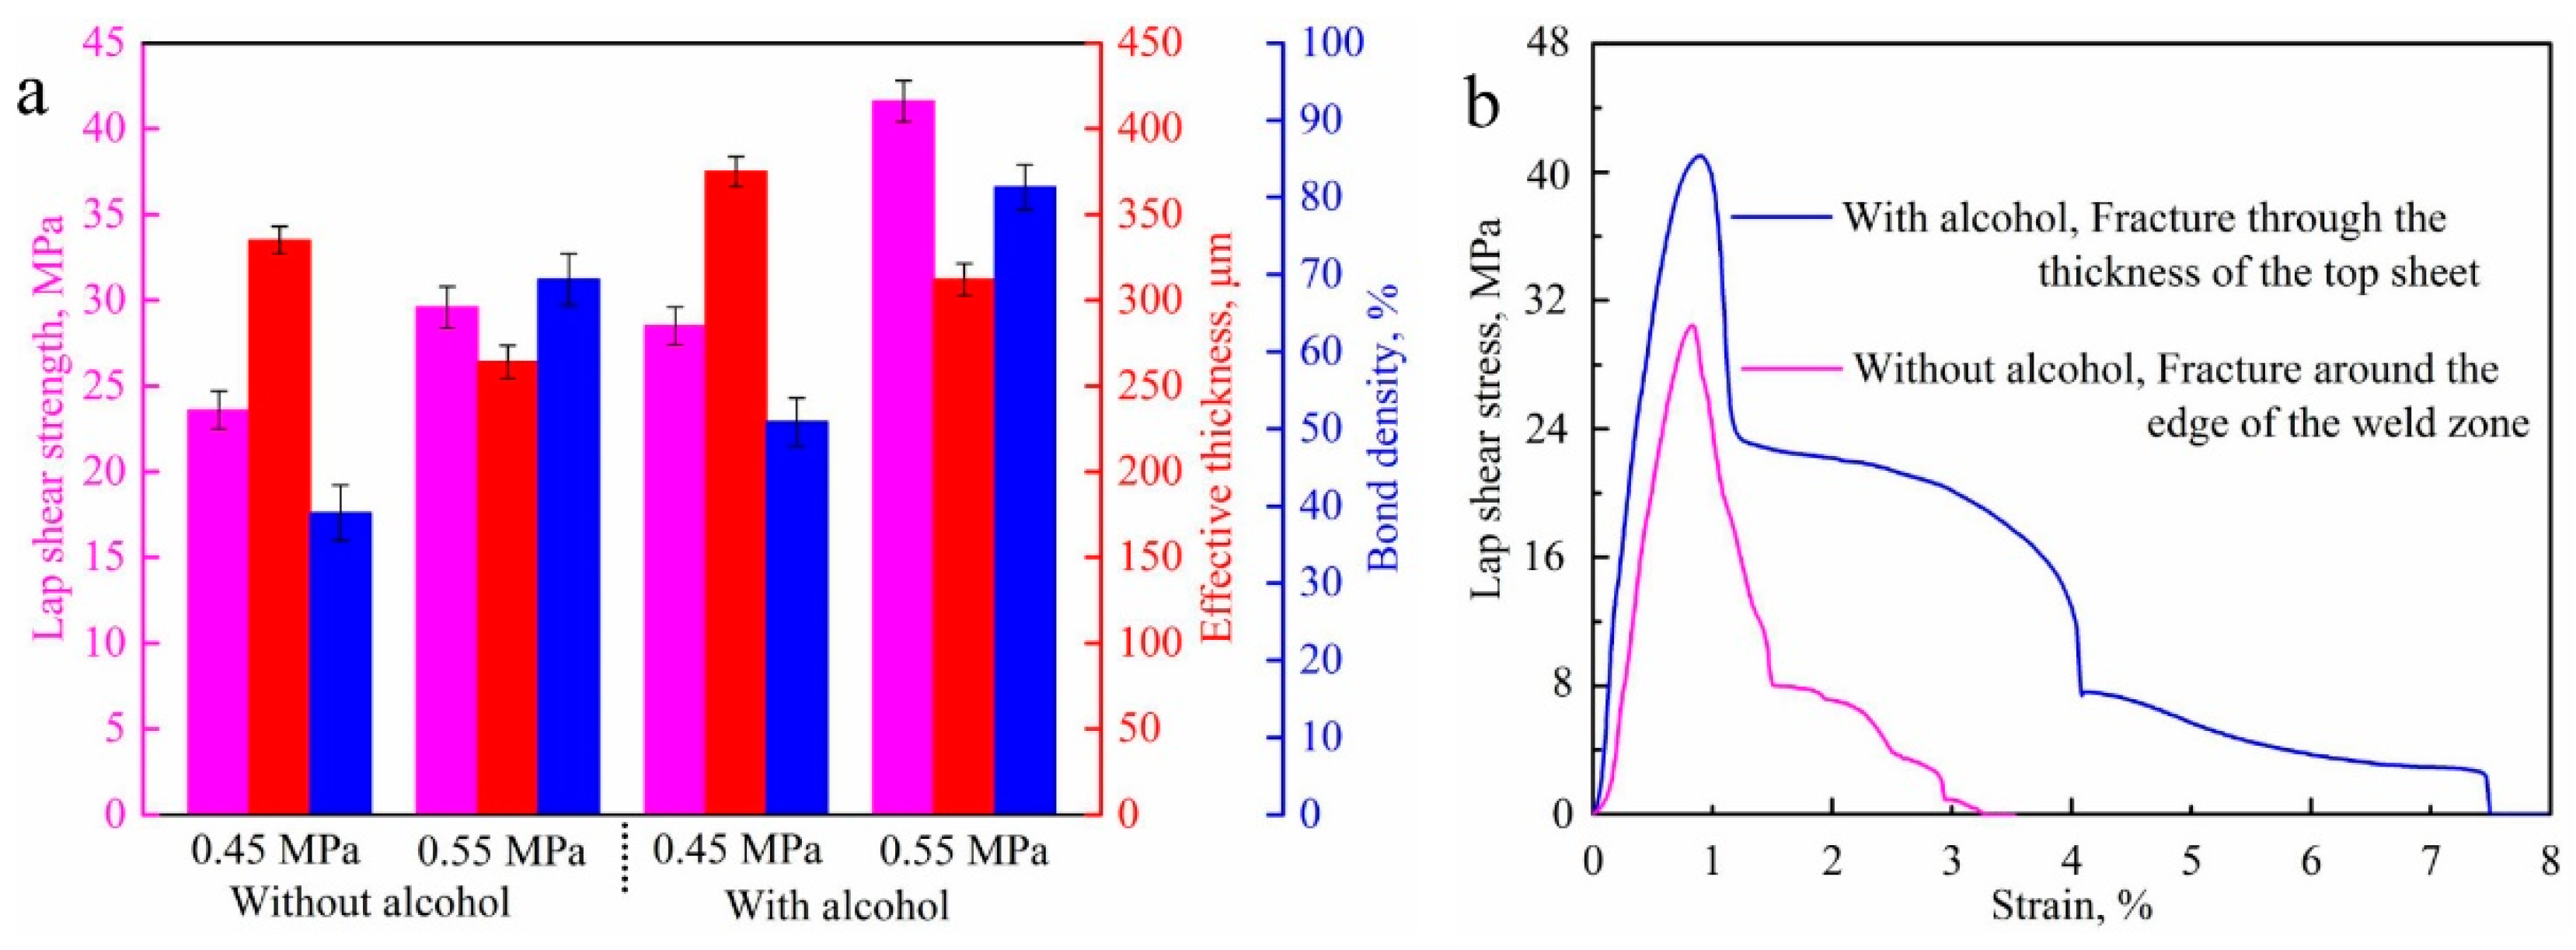
Presented on Figure 10 are the values of the lap shear strength, effective thickness, bond density for the joints without and with alcohol processed at the two values of pressure and typical stress–strain curves at 0.55 MPa welding pressure. With the increasing of the welding pressure, the lap shear strength increases. In comparison with the joints without alcohol, the lap shear strength of the joints with alcohol at the pressures of 0.45 MPa and 0.55 MPa are increased by 20.8% and 40.5%, respectively. It is related to the increased bond density and effective thickness induced by the alcohol (Figure 5, Figure 6 and Figure 10a). The enhanced effective bonded areas at the welding interface and the effective thickness can sustain a heavier load during the loading process. In addition, the strain for the joint with alcohol at 0.55 MPa welding pressure is much higher than that for the joint without alcohol (Figure 10b). Therefore, the work of failure, which is determined by the area under the stress–strain curve, is significantly higher than in the case of welding without alcohol. Interestingly, in comparison with the joint without alcohol at 0.55 MPa welding pressure, the effective thickness of the joint with alcohol is increased by 18.1%, while the lap shear strength is enhanced by 40.5%, i.e., by a much larger factor. This may be caused by the formation of more micro-cracks and higher stress concentration for the joint without alcohol. In addition, the more micro-cracks and higher stress concentration can enhance the crack growth rate, reduce the joint load bearing capacity, and change the fracture mechanism. Thus, the fracture energy, strain and the slope of the lap shear stress reaching the maximum value for the joint with alcohol are higher than that for the joint without alcohol.

Figure 10.
Lap shear strength, effective thickness and bond density for the joints without and with alcohol (a) and the typical stress–strain curves at 0.55 MPa welding pressure (b).
3.5. Fracture Behavior
3.5.1. Top and Side Views of the Optical Image of the Fracture Path
Figure 11 presents the fracture morphology of the joints fabricated without and with alcohol. When the welding pressure is 0.45 MPa, the fracture location is at the weld interface. It is demonstrated that the effective bonded areas at the welding interface do not sustain a sufficiently high load during the loading process. The light areas in Figure 11b are obviously enhanced in contrast to that in Figure 11a. It is indicated that the effective bond area increases, which is in accordance with the results presented in Figure 5 and Figure 10a. In the case of the joint with alcohol at 0.55 MPa welding pressure (Figure 11c), the enhanced effective bonded areas at the welding interface can withstand a higher load during the loading process, but the effective thickness cannot deliver such a heavy load. Hence, the fracture occurs across the thickness of the top Cu sheet. For the joint without alcohol at 0.55 MPa pressure (Figure 11d), the thin effective thickness and the low micro-hardness at the region between the weld zone and the base metal can accelerate the bend formation around the weld zone during the load process and will promote the stress concentration [29,30] at the weld zone edge that possesses a low micro-hardness and consequently a low mechanical strength; thus, the fracture location is around the edge of the weld zone. It is demonstrated that the fracture mode is changed due to the alcohol action. Meanwhile, the effective thickness is critical to the fracture mode when the bonded areas at the welding interface can transmit the heavy load.

Figure 11.
Fracture morphology of the joints fabricated at the pressures of 0.45 MPa (without (a) and with (b) alcohol) and 0.55 MPa (with (c,d) without alcohol).
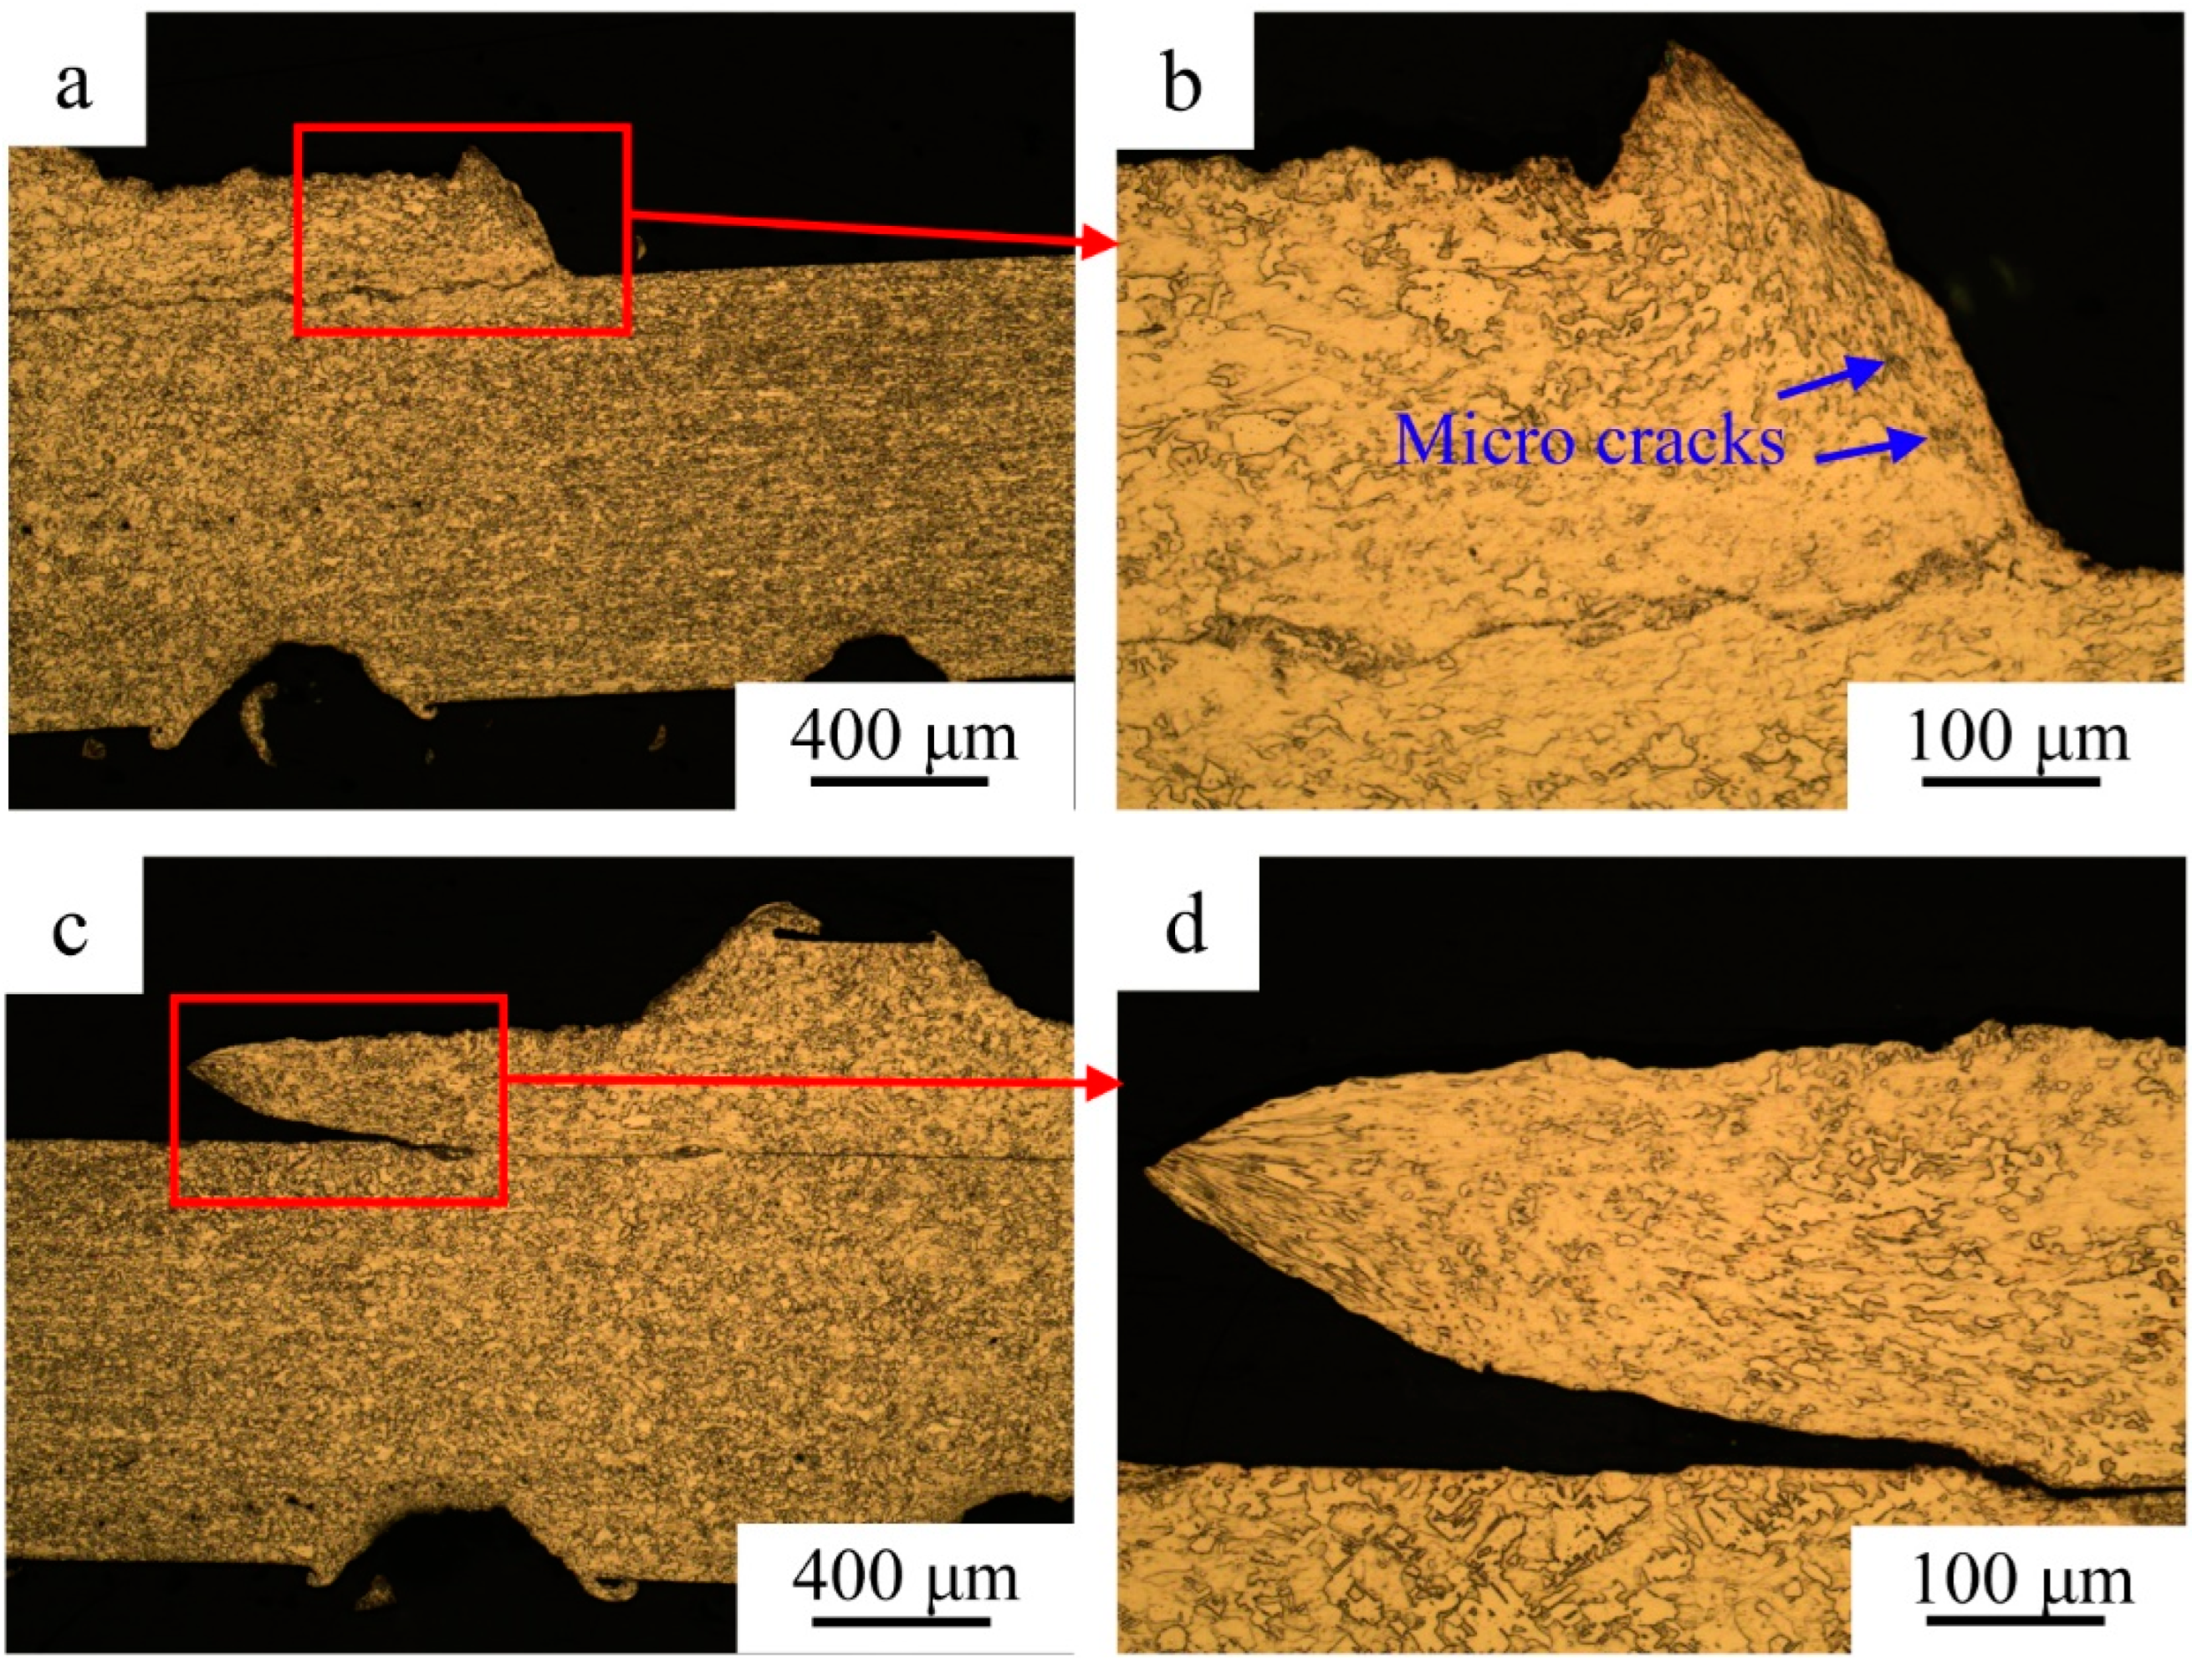
Figure 12 exhibits the side views of the optical images of the fracture path for the joints without and with alcohol at the 0.55 MPa welding pressure. From Figure 12a,b, the no necking phenomenon occurs at the weld zone edge; it is the typical feature of the brittle fracture. It can be demonstrated by the small strain in Figure 10b. This is abnormal to the Cu sheet with a face-centered cubic lattice structure; it may happen because of the formation of micro-cracks and higher stress concentration induced by the relative sliding between the sonotrode tip and the top Cu sheet [30]. In addition, some micro-cracks appear in the vicinity of the fracture (Figure 12b); it may be due to the propagation of crack source in the weld zone edge, demonstrating that the crack sources are generated around the weld zone edge for the joint without alcohol at 0.55 MPa welding pressure. From Figure 12c,d, the obvious necking phenomenon takes place at the weld zone edge; it is the typical characteristic of the ductile fracture. It is beneficial to the enhancement of the strain for the load reaching the peak value, in agreement with the result in Figure 10b. It is demonstrated that due to the action of the alcohol, the formation of the micro-cracks and higher stress concentration around the weld zone edge could be effectively suppressed.

Figure 12.
Side views of the optical images of the fracture path for the joints without (a,b) and with alcohol (c,d) at 0.55 MPa welding pressure.
3.5.2. Fracture Morphology
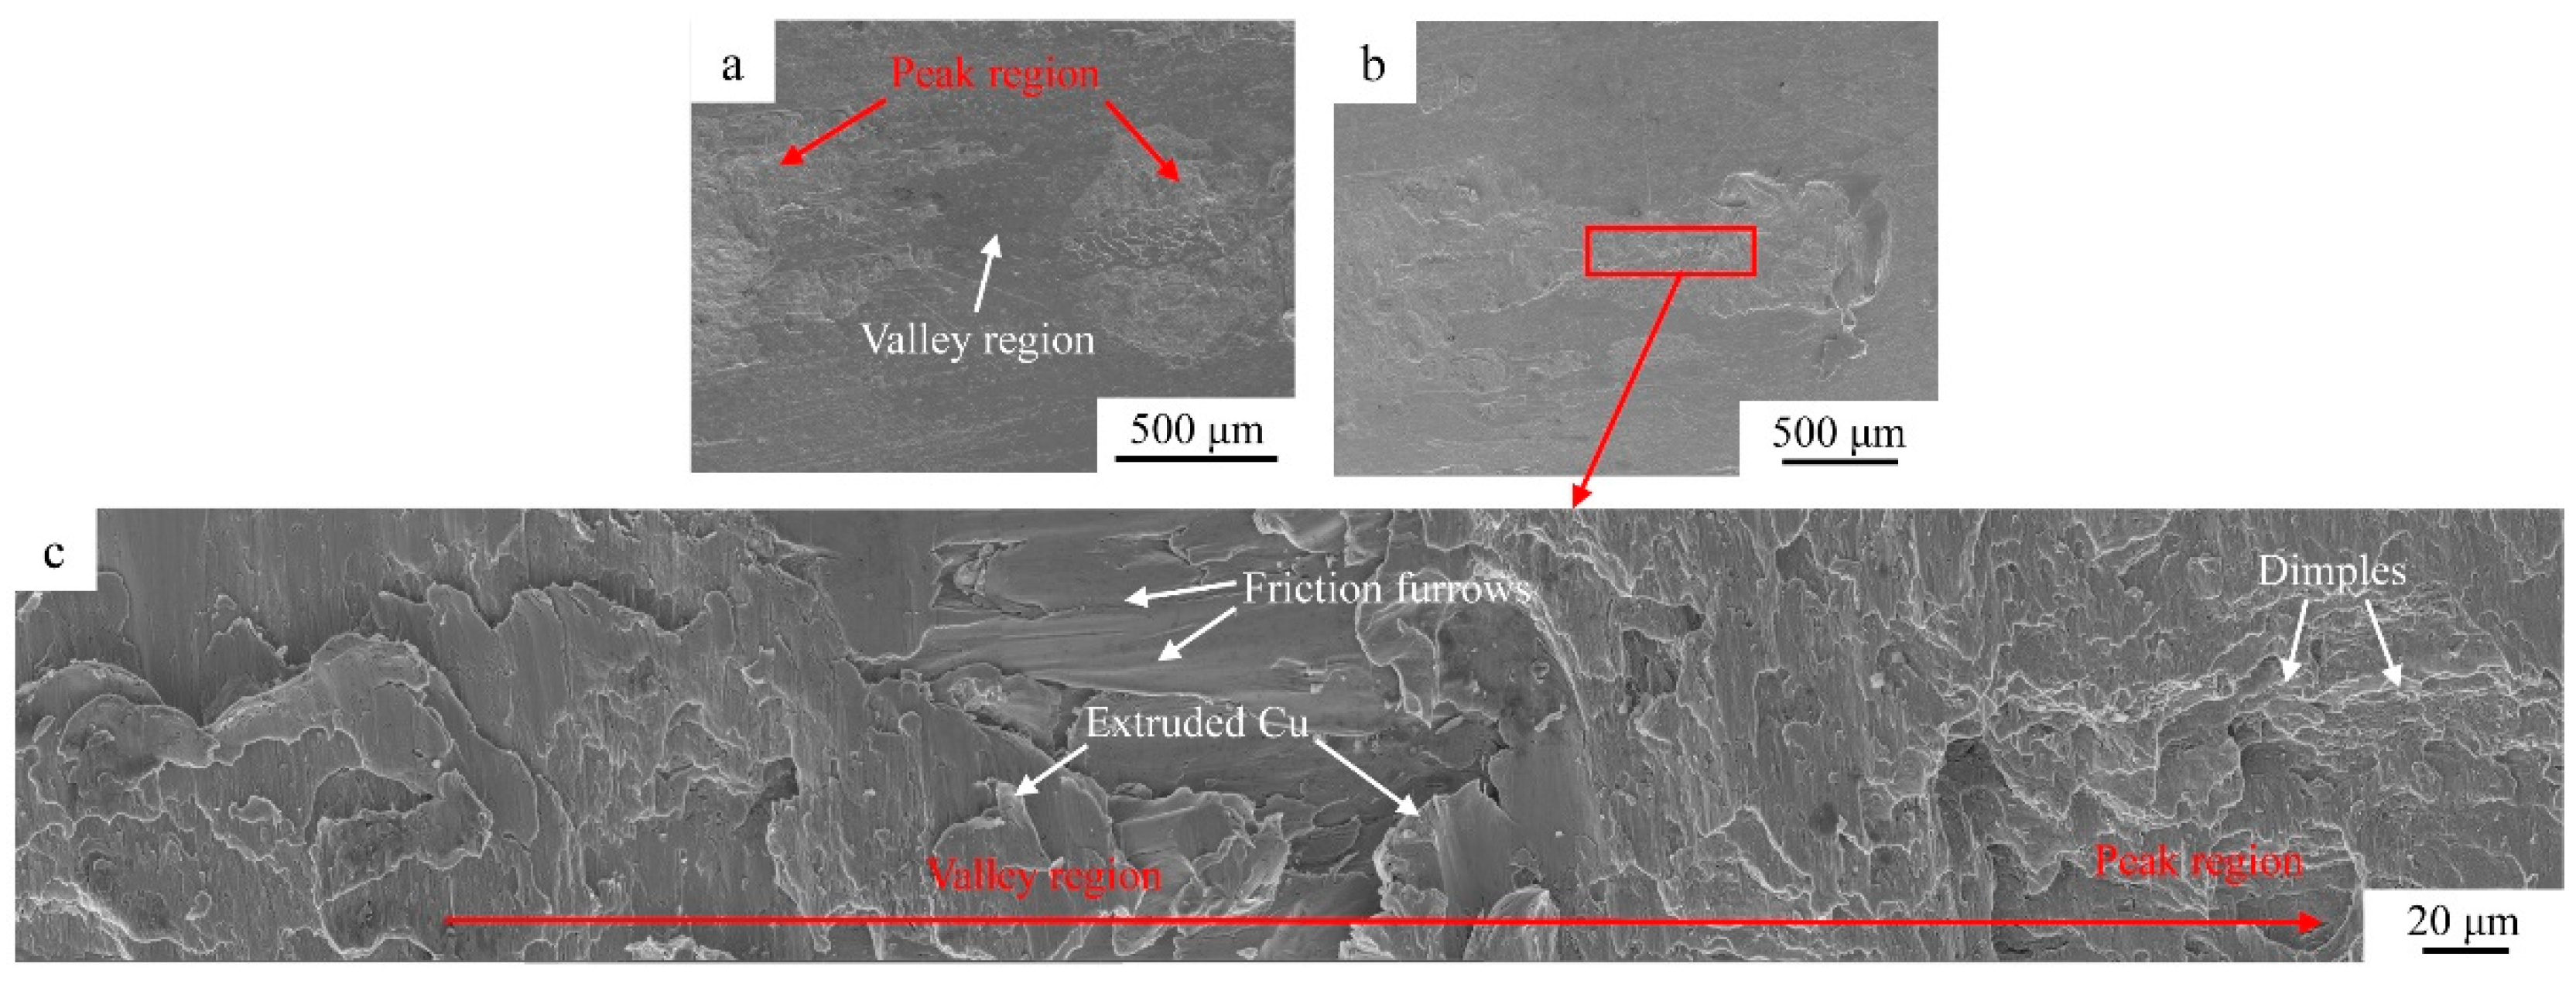
Figure 13 displays the SEM images of the fracture surfaces of joints without and with alcohol at 0.45 MPa welding pressure. Note that this is the feature of the interfacial fracture mode. From Figure 13a, it is detected that two obvious regions (valley and peak ones) occur at the fracture surface. In the peak region, some significant dimples appear, suggesting the formation of strong interface bonding; but in the case of the valley region, only a flat area takes place, evidencing that no bonded areas are generated. It is in accordance with the result obtained from Figure 5 and Figure 6. From Figure 13b, the flat surface disappears at the valley region. Figure 13c exhibits the detailed enlarged image of the red box in Figure 13b. It can be observed that the material is extruded into the valley region, and the surface of the extruded Cu is smooth, demonstrating that the welding interface bonding is poor. Meanwhile, obvious friction furrows can be observed, indicating the generation of the relative sliding friction at the valley region due to the alcohol action, which is beneficial to the severe plastic deformation and consequently the interface bonding formation. In addition, the dimples from the peak region to the valley region gradually disappear, demonstrating that the welding interface bonding strength from the valley region to the peak region becomes stronger.

Figure 13.
SEM images of the fracture surfaces of joints without (a) and with (b,c) alcohol at 0.45 MPa welding pressure.
Figure 14 shows the SEM images of the fracture surface of a joint processed without alcohol at 0.55 MPa welding pressure. It is detected that no obvious necking phenomenon occurs at the fracture surface (Figure 14b), and numerous tear ridges and cleavage facets are generated in Figure 14a,c, demonstrating the occurrence of a brittle cleavage fracture. This is in accordance with the result in Figure 12a,b. The reasons for this are summarized as follows. Firstly, the region around the weld zone possesses a low mechanical strength and easily loses its stability during the loading process [31], due to the low micro-hardness and thin effective thickness at the heat-affected zone (Figure 5b, Figure 9 and Figure 10). Consequently, a bend is formed around the weld zone (Figure 14), and the stress modes and distribution are changed. Secondly, the more severe relative sliding between the sonotrode tip and the top Cu sheet will accelerate the formation of micro-cracks (Figure 12b) and a higher stress concentration [12,30].

Figure 14.
SEM images of the fracture surface of a joint processed without alcohol at 0.55 MPa welding pressure. (a,c) the enlarged drawings indicated in (b).
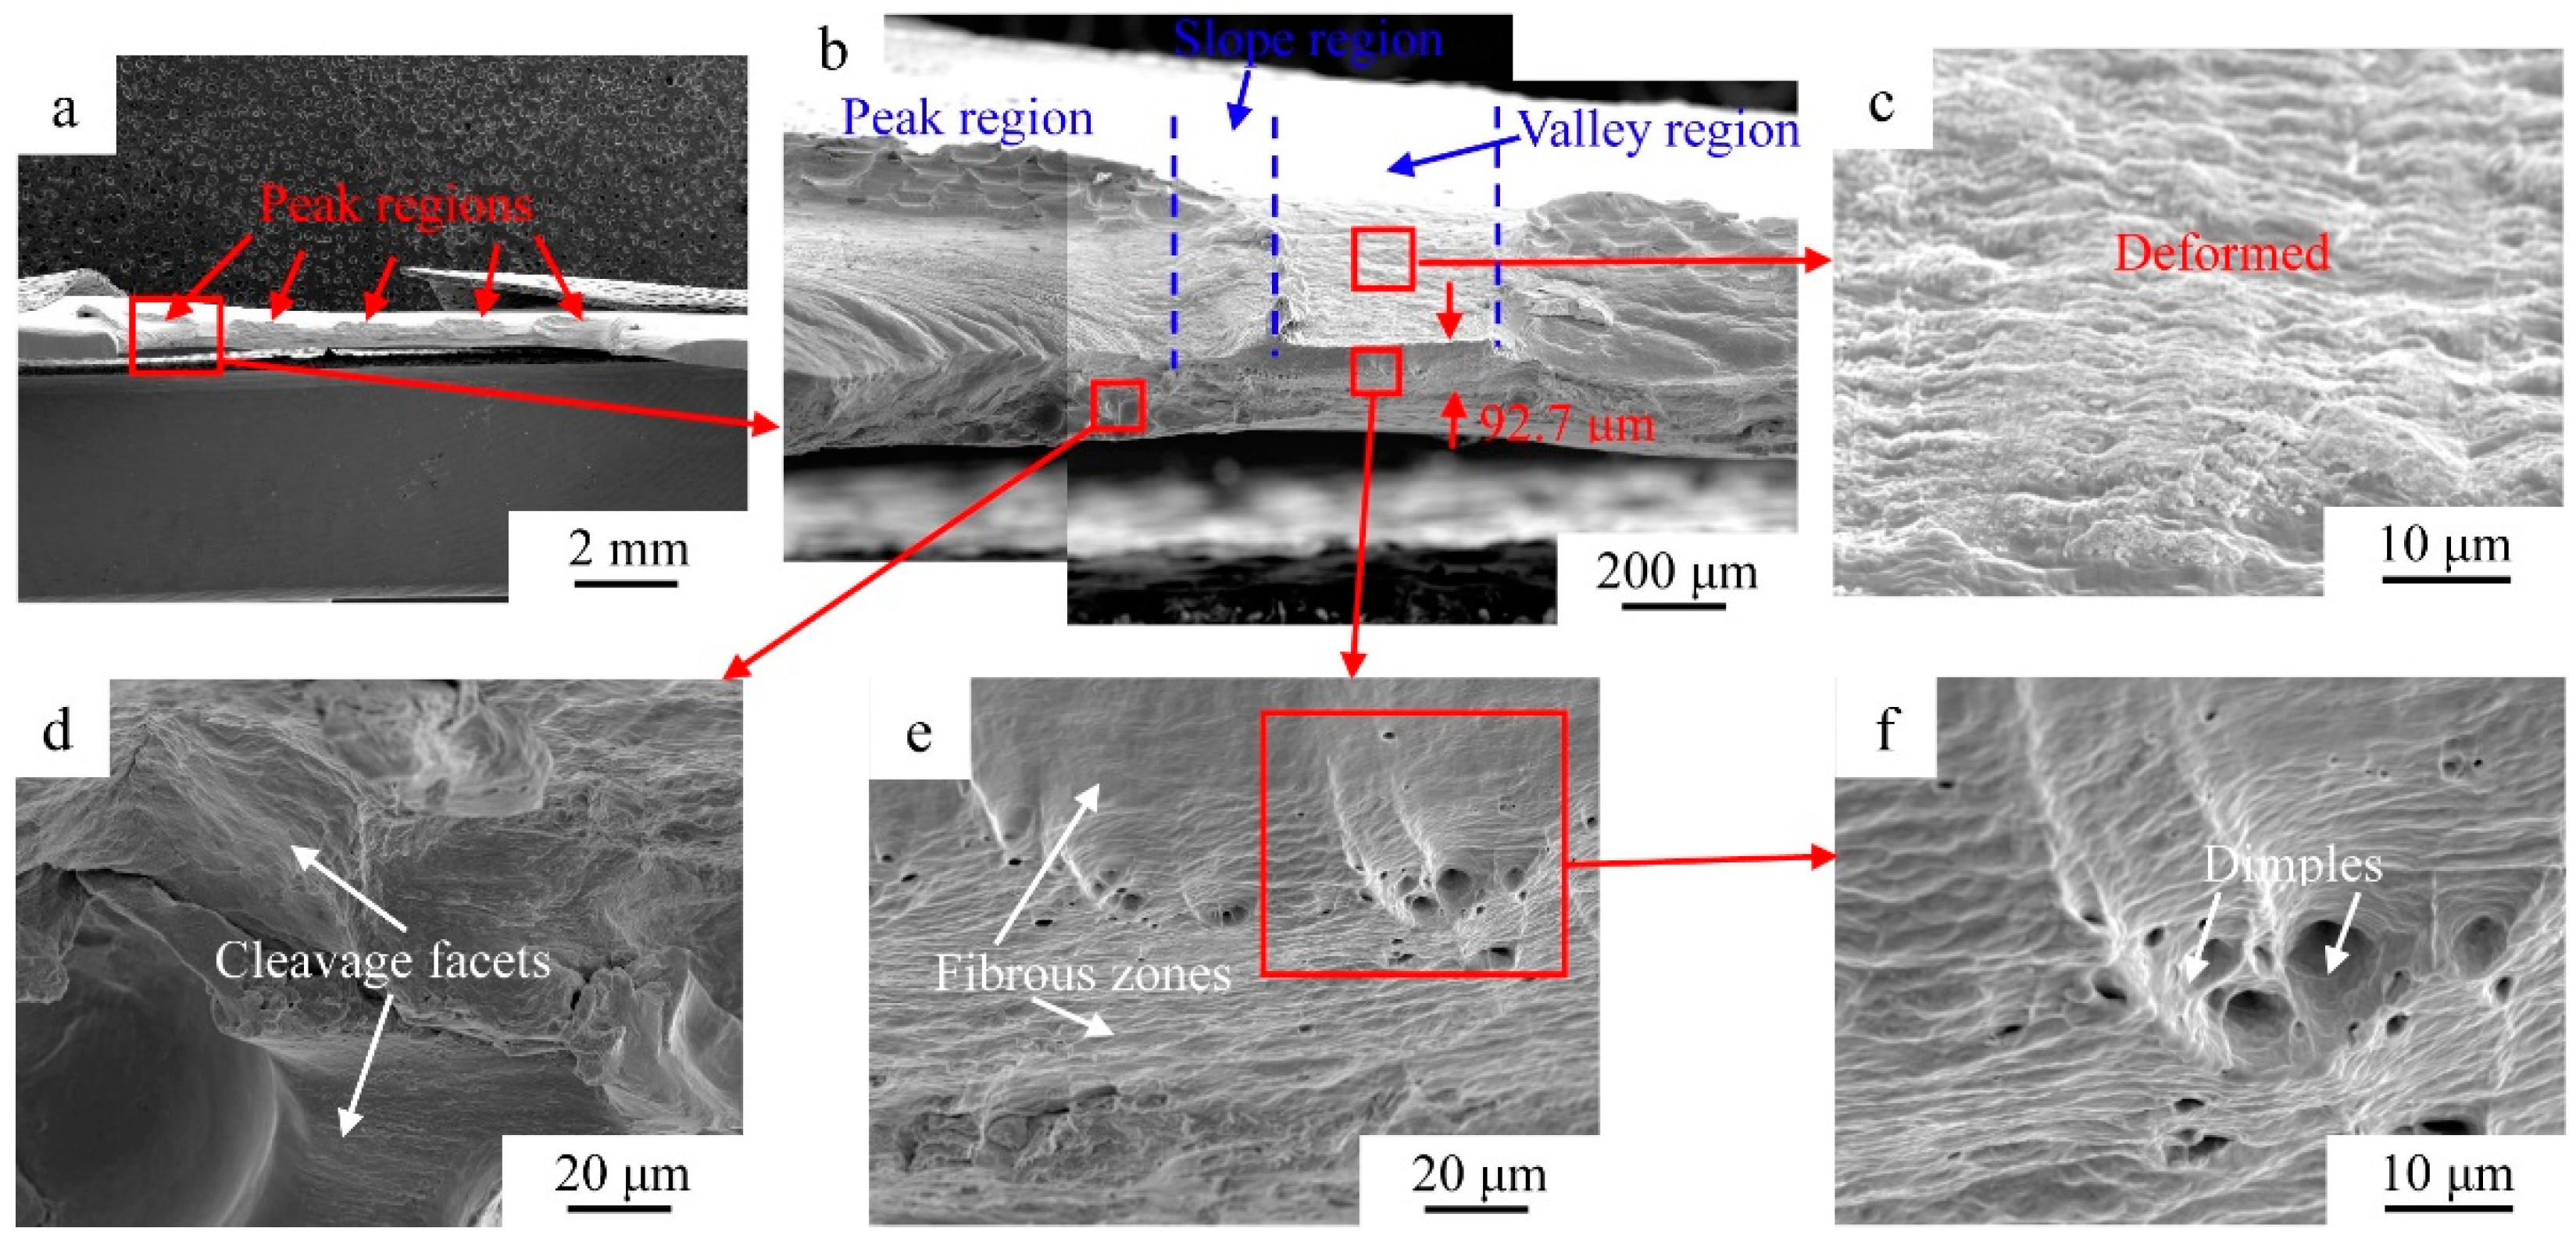
Figure 15 demonstrates the SEM images of the fracture surface of a joint processed with alcohol at 0.55 MPa welding pressure. From Figure 15a,b, it can be observed that the fracture morphology at the peak region is clearly different from that at the valley region. In the case of the fracture morphology at the peak region (Figure 15b,d), almost no necking phenomenon exists, and numerous cleavage facets are observed, confirming the formation of the brittle cleavage fracture. Note that, normally, the cleavage fracture does not occur in face-centered cubic lattice materials (e.g., Cu), but it may happen due to the factor of the material defects [32]. During USW, the high frequency reciprocating shear dynamic load is directly applied on the top Cu sheet at the peak region, leading to the generation of a high stress concentration [12,30], which consequently accelerated the formation of material defects such as micro-cracks. Hence, the brittle cleavage fracture takes place at the peak region. For the fracture morphology at the valley region (Figure 15b,c), severe necking and plastic deformation can be detected. The thickness of the top Cu sheet has been reduced to about 92.7 μm in the necking zone from the original sheet thickness of 0.5 mm. Fibrous zones and dimples with elongated voids appear in the higher magnification (Figure 15e,f). The formation of elongated dimples at the fracture surface center evidences the occurrence of ductile fracture with cracks initiating at the center and then expanding to the surface of the top specimen, which rapidly propagate in the fibrous zone with a ripple pattern. It is demonstrated that the fracture mechanism is ductile one. This is in accordance with the result in Figure 12c,d. Overall, the peak region is the weakest position for the mechanical properties for the joint with alcohol at the 0.55 MPa welding pressure and the mixed fracture mechanisms occur on the entire fracture surface. In comparison with the joint without alcohol at 0.55 MPa welding pressure, the fracture mechanism obviously changes. This can be ascribed to the alcohol action, and the amplitude and duration of the relative motion between the sonotrode tip and the top sheet are significantly reduced, leading to the formation of less micro-cracks and lower stress concentration [30]. It is demonstrated that it will be instructive to modify the interface friction condition between the top and bottom sheets, prevent the large relative sliding between the sonotrode tip and the top Cu sheet, and reduce the stress concentration on the peak and valley regions.

Figure 15.
SEM images of the fracture surface of a joint processed with alcohol at 0.55 MPa welding pressure. (b) the enlarged drawing indicated in (a); (c–e) the enlarged drawing indicated in (b); (f) the enlarged drawing indicated in (e).
4. Conclusions
- (1)
- Comparing to the joints processed by USW without alcohol, the processing with alcohol results in an obvious increase in the welding interface temperature, effective thickness, bond density, plastic deformation zone width, and lap shear strength of the joints. The joint resistance and the corresponding peak temperature at the weld zone, and the micro-hardness of the joint zone, on the contrary, significantly decrease.
- (2)
- While the joint processed without alcohol at 0.55 MPa welding pressure fails in the brittle cleavage fracture mode, the joint processed with alcohol fracture by a mixed mechanism occurs on the entire fracture surface.
- (3)
- Discontinuous dynamic recrystallization occurs at the welding interface and promotes the migration of grain boundaries across the contact interface, leading to the formation of the metallurgical bonding between the two Cu sheets. It is beneficial to enhance the joint mechanical strength.
Author Contributions
Conceptualization, A.A.N. and Z.N.; methodology, J.Y.; validation, A.A.N., J.Y. and Z.N.; formal analysis, F.Y.; investigation, J.Y., A.A.N., J.Y. and Z.N.; writing—original draft preparation, J.Y. and Z.N.; writing—review and editing, A.A.N., J.Y. and Z.N.; visualization, F.Y.; supervision, F.Y. and Z.N.; project administration, Z.N. All authors have read and agreed to the published version of the manuscript.
Funding
This research was funded by the National Natural Science Foundation of China, grant # 51905171, 51975406, and the authors are thankful for the special funding and equipment support of the visiting professor at the School of Materials Science and Engineering. A.A. Nazarov was supported by a grant # 22-19-00617 from the Russian Science Foundation.
Data Availability Statement
The raw/processed data required to reproduce these findings are available from the corresponding author on reasonable request.
Conflicts of Interest
The authors declare no conflict of interest.
Abbreviations
The following abbreviations are used in this manuscript:
| USW | Ultrasonic spot welding |
| USWed | Ultrasonic spot welded |
References
- Kumar, N.; Masters, I.; Das, A. In-depth evaluation of laser-welded similar and dissimilar material tab-to-busbar electrical interconnects for electric vehicle battery pack. J. Manuf. Process. 2021, 70, 78–96. [Google Scholar] [CrossRef]
- Sadeghian, A.; Iqbal, N. A review on dissimilar laser welding of steel-copper, steel-aluminum, aluminum-copper, and steel-nickel for electric vehicle battery manufacturing. Opt. Laser Technol. 2022, 146, 107595. [Google Scholar] [CrossRef]
- Kang, B.; Cai, W.; Tan, C. Dynamic response of battery tabs under ultrasonic welding. J. Manuf. Sci. Eng.-T ASME 2013, 135, 051013. [Google Scholar] [CrossRef]
- Das, A.; Ashwin, T.R.; Barai, A. Modelling and characterisation of ultrasonic joints for Li-ion batteries to evaluate the impact on electrical resistance and temperature raise. J. Energy Storage 2019, 22, 239–248. [Google Scholar] [CrossRef]
- Dhara, S.; Das, A. Impact of ultrasonic welding on multi-layered Al-Cu joint for electric vehicle battery applications: A layer-wise microstructural analysis. Mater. Sci. Eng. A 2020, 791, 139795. [Google Scholar] [CrossRef]
- Das, A.; Masters, I.; Williams, D. Process robustness and strength analysis of multi-layered dissimilar joints using ultrasonic metal welding. Int. J. Adv. Manuf. Technol. 2019, 101, 881–900. [Google Scholar] [CrossRef]
- Lee, S.S.; Shao, C.; Kim, T.H.; Hu, S.J.; Kannatey-Asibu, E.; Cai, W.W.; Spicer, J.P.; Abell, J.A. Characterization of ultrasonic metal welding by correlating online sensor signals with weld attributes. J. Manuf. Sci. Eng.-T ASME 2014, 136, 051019. [Google Scholar] [CrossRef]
- Lee, S.S.; Kim, T.H.; Hu, S.J.; Cai, W.W.; Abell, J.A.; Li, J. Characterization of joint quality in ultrasonic welding of battery tabs. J. Manuf. Sci. Eng.-T ASME 2013, 135, 021004. [Google Scholar] [CrossRef]
- Lee, S.S.; Kim, T.H.; Hu, S.J.; Cai, W.W.; Abell, J.A. Analysis of weld formation in multilayer ultrasonic metal welding using high-speed images. J. Manuf. Sci. Eng.-T ASME 2015, 137, 031016. [Google Scholar] [CrossRef]
- Ma, Z.; Zhang, Y. Characterization of multilayer ultrasonic welding based on the online monitoring of sonotrode displacement. J. Manuf. Process. 2020, 54, 138–147. [Google Scholar] [CrossRef]
- Li, Y.; Chu, Z.; Li, X.; Pan, Y.; Yamaguchi, T.; Wang, W. Swirl-like Cu-Sn phase formation and the effects on the ultrasonic spot welded joint of Sn-coated Cu plates. J. Mater. Process. Technol. 2021, 288, 116911. [Google Scholar] [CrossRef]
- Ma, Q.; Ma, J.; Zhou, J.; Ji, H. Intrinsic dependence of welding quality and recrystallization on the surface-contacted micro-asperity scale during ultrasonic welding of Cu-Cu joints. J. Mater. Res. Technol. 2022, 17, 353–364. [Google Scholar] [CrossRef]
- Shin, H.; de Leon, M. Mechanical performance and electrical resistance of ultrasonic welded multiple Cu-Al layers. J. Mater. Process. Technol. 2017, 241, 141–153. [Google Scholar] [CrossRef]
- Das, A.; Barai, A.; Masters, I.; Williams, D. Comparison of tab-to-busbar ultrasonic joints for electric vehicle Li-ion battery applications. World Electr. Veh. J. 2019, 10, 55. [Google Scholar] [CrossRef]
- Patel, V.K.; Bhole, S.D.; Chen, D.L. Influence of ultrasonic spot welding on microstructure in a magnesium alloy. Scr. Mater. 2011, 65, 911–914. [Google Scholar] [CrossRef]
- Lu, Y.; Song, H.; Taber, G.A.; Foster, D.R.; Daehn, G.S.; Zhang, W. In-situ measurement of relative motion during ultrasonic spot welding of aluminum alloy using Photonic Doppler Velocimetry. J. Mater. Process. Technol. 2016, 231, 431–440. [Google Scholar] [CrossRef]
- Balz, I.; Rosenthal, E.; Reimer, A.; Turiaux, M.; Schiebahn, A.; Reisgen, U. Analysis of the thermo-mechanical mechanism during ultrasonic welding of battery tabs using high-speed image capturing. Weld. World 2019, 63, 1573–1582. [Google Scholar] [CrossRef]
- Hu, Y.; Liu, W. Tribological properties of alcohols as lubricating additives for aluminum-on-steel contact. Wear 1998, 218, 244–249. [Google Scholar] [CrossRef]
- Kajdas, C. About an anionic-radical concept of the lubrication mechanism of alcohols. Wear 1987, 116, 167–180. [Google Scholar] [CrossRef]
- Ni, Z.L.; Liu, Y.; Wang, Y.H.; He, B.Y. Interfacial bonding mechanism and fracture behavior in ultrasonic spot welding of copper sheets. Mater. Sci. Eng. A 2022, 833, 142536. [Google Scholar] [CrossRef]
- Sriraman, M.R.; Babua, S.S.; Short, M. Bonding characteristics during very high power ultrasonic additive manufacturing of copper. Scr. Mater. 2010, 62, 560–563. [Google Scholar] [CrossRef]
- Shayakhmetova, E.R.; Murzinova, M.A.; Zadorozhniy, V.S.; Nazarov, A.A. Microstructure of joints processed by ultrasonic consolidation of nickel sheets. Metals 2022, 12, 1865. [Google Scholar] [CrossRef]
- Shayakhmetova, E.R.; Murzinova, M.A.; Nazarov, A.A. Ultrasonic welding of nickel with coarse and ultrafine grained structures. Metals 2021, 11, 1800. [Google Scholar] [CrossRef]
- Su, Z.; Zhu, Z.; Zhang, Y.; Zhang, H.; Xiao, Q. Recrystallization behavior of a pure Cu connection interface with ultrasonic welding. Metals 2021, 11, 61. [Google Scholar] [CrossRef]
- Lin, J.; Lai, Z.; Otsuki, T.; Yen, H.; Nambu, S. Gradient microstructure and interfacial strength of CoCrFeMnNi high-entropy alloy in solid-state ultrasonic welding. Mater. Sci. Eng. A 2021, 825, 141885. [Google Scholar] [CrossRef]
- Hughes, D.A.; Dawson, D.B.; Korellis, J.S.; Weingarten, L.I. Near surface microstructures developing under large sliding loads. J. Mater. Eng. Perform. 1994, 3, 459–475. [Google Scholar] [CrossRef]
- Li, Y.S.; Tao, N.R.; Lu, K. Microstructural evolution and nanostructure formation in copper during dynamic plastic deformation at cryogenic temperatures. Acta Mater. 2008, 56, 230–241. [Google Scholar] [CrossRef]
- Gunduz, I.E.; Ando, T.; Shattuck, E.; Wong, P.Y.; Doumanidis, C.C. Enhanced diffusion and phase transformations during ultrasonic welding of zinc and aluminum. Scr. Mater. 2005, 52, 939–943. [Google Scholar] [CrossRef]
- Arimoto, K.; Sasaki, T.; Doi, Y.; Kim, T. Ultrasonic bonding of multi-layered foil using a cylindrical surface tool. Metals 2019, 9, 505. [Google Scholar] [CrossRef]
- Lee, D.; Cai, W. The effect of horn knurl geometry on battery tab ultrasonic welding quality: 2D finite element simulations. J. Manuf. Process. 2017, 28, 428–441. [Google Scholar] [CrossRef]
- Wang, T.; Sinha, S.; Komarasamy, M.; Shukla, S.; Williams, S.; Mishra, R.S. Ultrasonic spot welding of dissimilar Al 6022 and Al 7075 alloys. J. Mater. Process. Technol. 2020, 278, 116460. [Google Scholar] [CrossRef]
- Liu, H.J.; Shen, J.J.; Huang, Y.X.; Kuang, L.Y.; Liu, C.; Li, C. Effect of tool rotation rate on microstructure and mechanical properties of friction stir welded copper. Sci. Technol. Weld. Join. 2009, 14, 577–583. [Google Scholar] [CrossRef]
Disclaimer/Publisher’s Note: The statements, opinions and data contained in all publications are solely those of the individual author(s) and contributor(s) and not of MDPI and/or the editor(s). MDPI and/or the editor(s) disclaim responsibility for any injury to people or property resulting from any ideas, methods, instructions or products referred to in the content. |
© 2022 by the authors. Licensee MDPI, Basel, Switzerland. This article is an open access article distributed under the terms and conditions of the Creative Commons Attribution (CC BY) license (https://creativecommons.org/licenses/by/4.0/).


