Article

Welding Residual Stress Distributions in the Thickness Direction under Constraints Using Neutron Diffraction and Contour Methods

1
Department of Naval Architecture and Ocean Engineering, Chosun University, Gwangju 61452, Republic of Korea
2
Department of civil Engineering, Chosun University, Gwangju 61452, Republic of Korea
3
Neutron Science Division, Korea Atomic Energy Research Institute, Daejeon 34057, Republic of Korea
*
Author to whom correspondence should be addressed.
Metals 2023, 13(1), 25; https://doi.org/10.3390/met13010025
Submission received: 27 November 2022 / Revised: 14 December 2022 / Accepted: 17 December 2022 / Published: 22 December 2022

Abstract

:
Using high-strength steel for offshore structures with a yield stress of 500 MPa, this study evaluated the distribution characteristics of welding residual stress in the thickness direction under the influence of constrained conditions during welding using cutting, neutron diffraction, and contour methods. Welding residual stress inevitably occurs during welding and impacts fracture stability in structures. As high-strength steel better reflects the effects of phase transformation, the behavior of welding residual stress is known to differ from that of general steel. This study fabricated fully constrained and unconstrained specimens and evaluated them under identical conditions to evaluate welding residual stress according to the influence of constraints on high-strength steel welds. The results indicated that the maximum tensile residual stress of the fully constrained specimen occurred in the first layer of the weld joint, while the maximum tensile residual stress of the fully unconstrained specimen occurred in the last layer of the weld joint. Additionally, the welding residual stress of the fully constrained specimen was larger. Although some errors occurred in the residual stress values in the thickness direction depending on the measurement method, both methods applied in this study exhibited nearly identical distributions. Meanwhile, a maximum angular deformation of about 6° occurred in the fully unconstrained specimen, and we considered that the residual stress decreased owing to the occurrence of angular deformation. The maximum welding residual stress is generally the degree of yield stress. When residual stress greater than the yield stress occurs, it changes to the plastic range and appears in the form of angular, longitudinal, and lateral deformation. Under the fully unconstrained condition, reduced residual stress is considered to appear in the form of angular deformation. The welding tensile residual stress decreased to around 42% in the unconstrained specimen compared to the constrained specimen, and at that time, angular deformation of approximately 6° occurred. Therefore, it is estimated that an angular distortion of about 2.4° occurs as the stress of 100 MPa decreases.

1. Introduction

With increasing global demand for minerals and energy resources, mining environments have shifted to deep and harsh polar environments such as the deep sea and the Arctic Ocean. Offshore structures require lifespans of at least 20 years on average, and the conditions for offshore plant construction are being strengthened [1]. Considering that the use of offshore plants varies with the mining environment, representative types of offshore plants include the fixed-type jacket structure and jack-up rig, the flexible-type spar and tension leg platform, and the floating-type drill ship, floating production storage and offloading, and polar offshore structures [2]. Owing to abundant minerals and energy resources buried in the ocean, the markets for offshore plants and deep-sea facilities are continuously expanding every year, with deep-sea offshore platforms and deep-sea facilities projected to comprise a large market share [3]. To mine large amounts of minerals and energy resources at once, offshore plants have increased in scale and become lighter, the applied steel has been strengthened, and strict requirements for the quality of the applied steel have been implemented. Most offshore plants are manufactured by welding and have strict quality requirements using high-strength steel plate applied with a yield strength of 500 MPa or more [4], and the quality control of welds is also a crucial parameter [5]. Welding is a core technology in the manufacturing of offshore plants. In general, flux cored arc welding (FCAW) is mostly used for welding of offshore structures, and submerged arc welding (SAW) is sometimes applied. Although welding is highly economical and efficient, it is a well-known factor that impacts fracture safety owing to inevitable welding residual stress and deformation [6,7,8]. Welding deformation changes the dimensions of the structure or causes misalignment between members, thus reducing productivity and adversely impacting structure quality. Meanwhile, welding residual stress impacts strength, fracture safety, and fatigue performance of welds; therefore, it is a critical factor that must be considered when evaluating structural safety [9,10]. Welding residual stress is caused by plastic deformation occurring because of the restraint of the thermal stress generated during rapid heating and cooling by the welding heat source [11]. Tensile residual stress lowers the fatigue resistance of the material and accelerates the growth rate of fatigue cracks, whereas compressive residual stress inhibits the development of fatigue cracks and suppresses their propagation, thereby improving fatigue life [12,13,14]. However, it negatively impacts the entire structure. Hence, the residual stress distributed in welds has different effects on fatigue and fractures according to the weld type [15].
The welding residual stress also has a great influence on the crack initiation and propagation [16]. In particular, brittle crack propagation path and its arrest location will change the effect of welding residual stress distribution. It is known that the crack propagation path can be the result of the interplay between the local material strength and toughness gradients [17]. When the compressive stress is distributed at the crack tip of the welded part, the crack propagation path will be changed to a base metal, and then, complete fracture can be avoided. Conversely, when tensile stress is distributed at the crack tip, crack propagation is further promoted, and fracture occurs more easily. As such, the analysis of welding residual stress is a very important factor in evaluating the safety of a structure.
The magnitude of the maximum tensile residual stress distributed near a weld is known to be generally distributed around the yield strength of the steel [5]. Therefore, it is an important task to improve the fatigue life of structures through the reduction in weld tensile residual stress. Although there are various methods for reducing residual stress, it is possible to control residual stress according to the change in the constraint when manufacturing the structure. However, the distribution patterns of welding residual stress may vary with the constraint method of the welded structure during welding [18,19,20,21]. As large structures, such as offshore structures, are manufactured by joining various members, the degree of constraint within the structure varies. Welding is occasionally performed under a forced constraint to control various deformations generated during welding and while the structure itself is inevitably constrained. Quantitative analyses on the distribution of residual stress generated in welds according to the influence of constraints will likely serve an important role in the safety of structures. The fracture toughness of flux cored arc weld metal with high-strength grade, i.e., 420 MPa yield strength, steels for offshore structures varies depending on the welding position. The CTOD value of vertical-up-position weld metal was much higher than horizontal-position weld metal [22]. In high-strength steel such as 500 MPa class yield stress, the fracture toughness of the welded joint tends to decrease; however, recently, welding technology has been applied to improve weldability through the improvement of welding materials and improve various mechanical properties, including impact toughness and fracture toughness [23].
Thus, this study fabricated specimens with different extreme welding constrained conditions to identify the distribution characteristics of welding residual stress according to the influence of constraints on high-strength steel for offshore structures. For the fully unconstrained specimen in which constraint had barely any influence, only the minimum constraint possible for welding was applied. For the fully constrained specimen, in which the entire specimen was fully constrained, the entire specimen was constrained using a jig on the start/end part and side of the weld; in addition, welding was performed after the constraint to prevent any deformation by applying a steel backing material. This environment can be produced depending on the welding and assembly sequences of the structure even during the actual construction of the structure. As the distribution of residual stress changes with the influence of constraints, the distribution characteristics of the welding residual stress were evaluated assuming an extreme constraint. In particular, we compared destructive methods (cutting and contour methods) with the relatively recent non-destructive method of neutron diffraction to evaluate the welding residual stress in the thickness direction. Finally, we quantitatively analyzed welding residual stress in the thickness direction according to the influence of constraints and reviewed the influence of residual stress distribution in the thickness direction on the safety of welded structures. In addition, the effects of angular distortion and welding constraint were also evaluated.

2. Materials and Experimental Procedures

2.1. Material Preparation

The steel used in this study was a yield strength of 529 MPa, which is a high-strength steel used for offshore structures. To review the welding residual stress behavior, we varied the constraints for butt welding, which is the most general and widely applied method in the manufacture of welded structures. Table 1 and Table 2 show the chemical and mechanical properties of E500 steel. Figure 1 shows the dimensions and groove shape of the specimen. The dimensions of the plate were 400 mm (length) × 150 mm (width) × 25 mm (thickness), and the groove shape was a V-groove of 45° on both sides, with 11 passes and 6 layers.
The commercial welding material AWS A5.29 E91T1, which is commonly used for E500 steel in offshore structures, was applied as the welding material to fabricate the specimen. Table 3 and Table 4 show the chemical and mechanical properties of the welding material, respectively, which are reproduced from the mill test certificate provided by the welding consumable manufacturer. The yield strength was 580 MPa, tensile strength was 650 MPa, and elongation was 20%. Flux-cored arc welding (FCAW), the most commonly used method for manufacturing offshore structures, was applied for the welding process to fabricate the specimen. Table 5 shows the welding conditions and provides information to calculate the heat input. Vertical-down welding with 11 passes was performed, with a heat input of 15 kJ/cm and 100% CO2 used as the protective gas.

2.2. Constrained Condition in Specimens

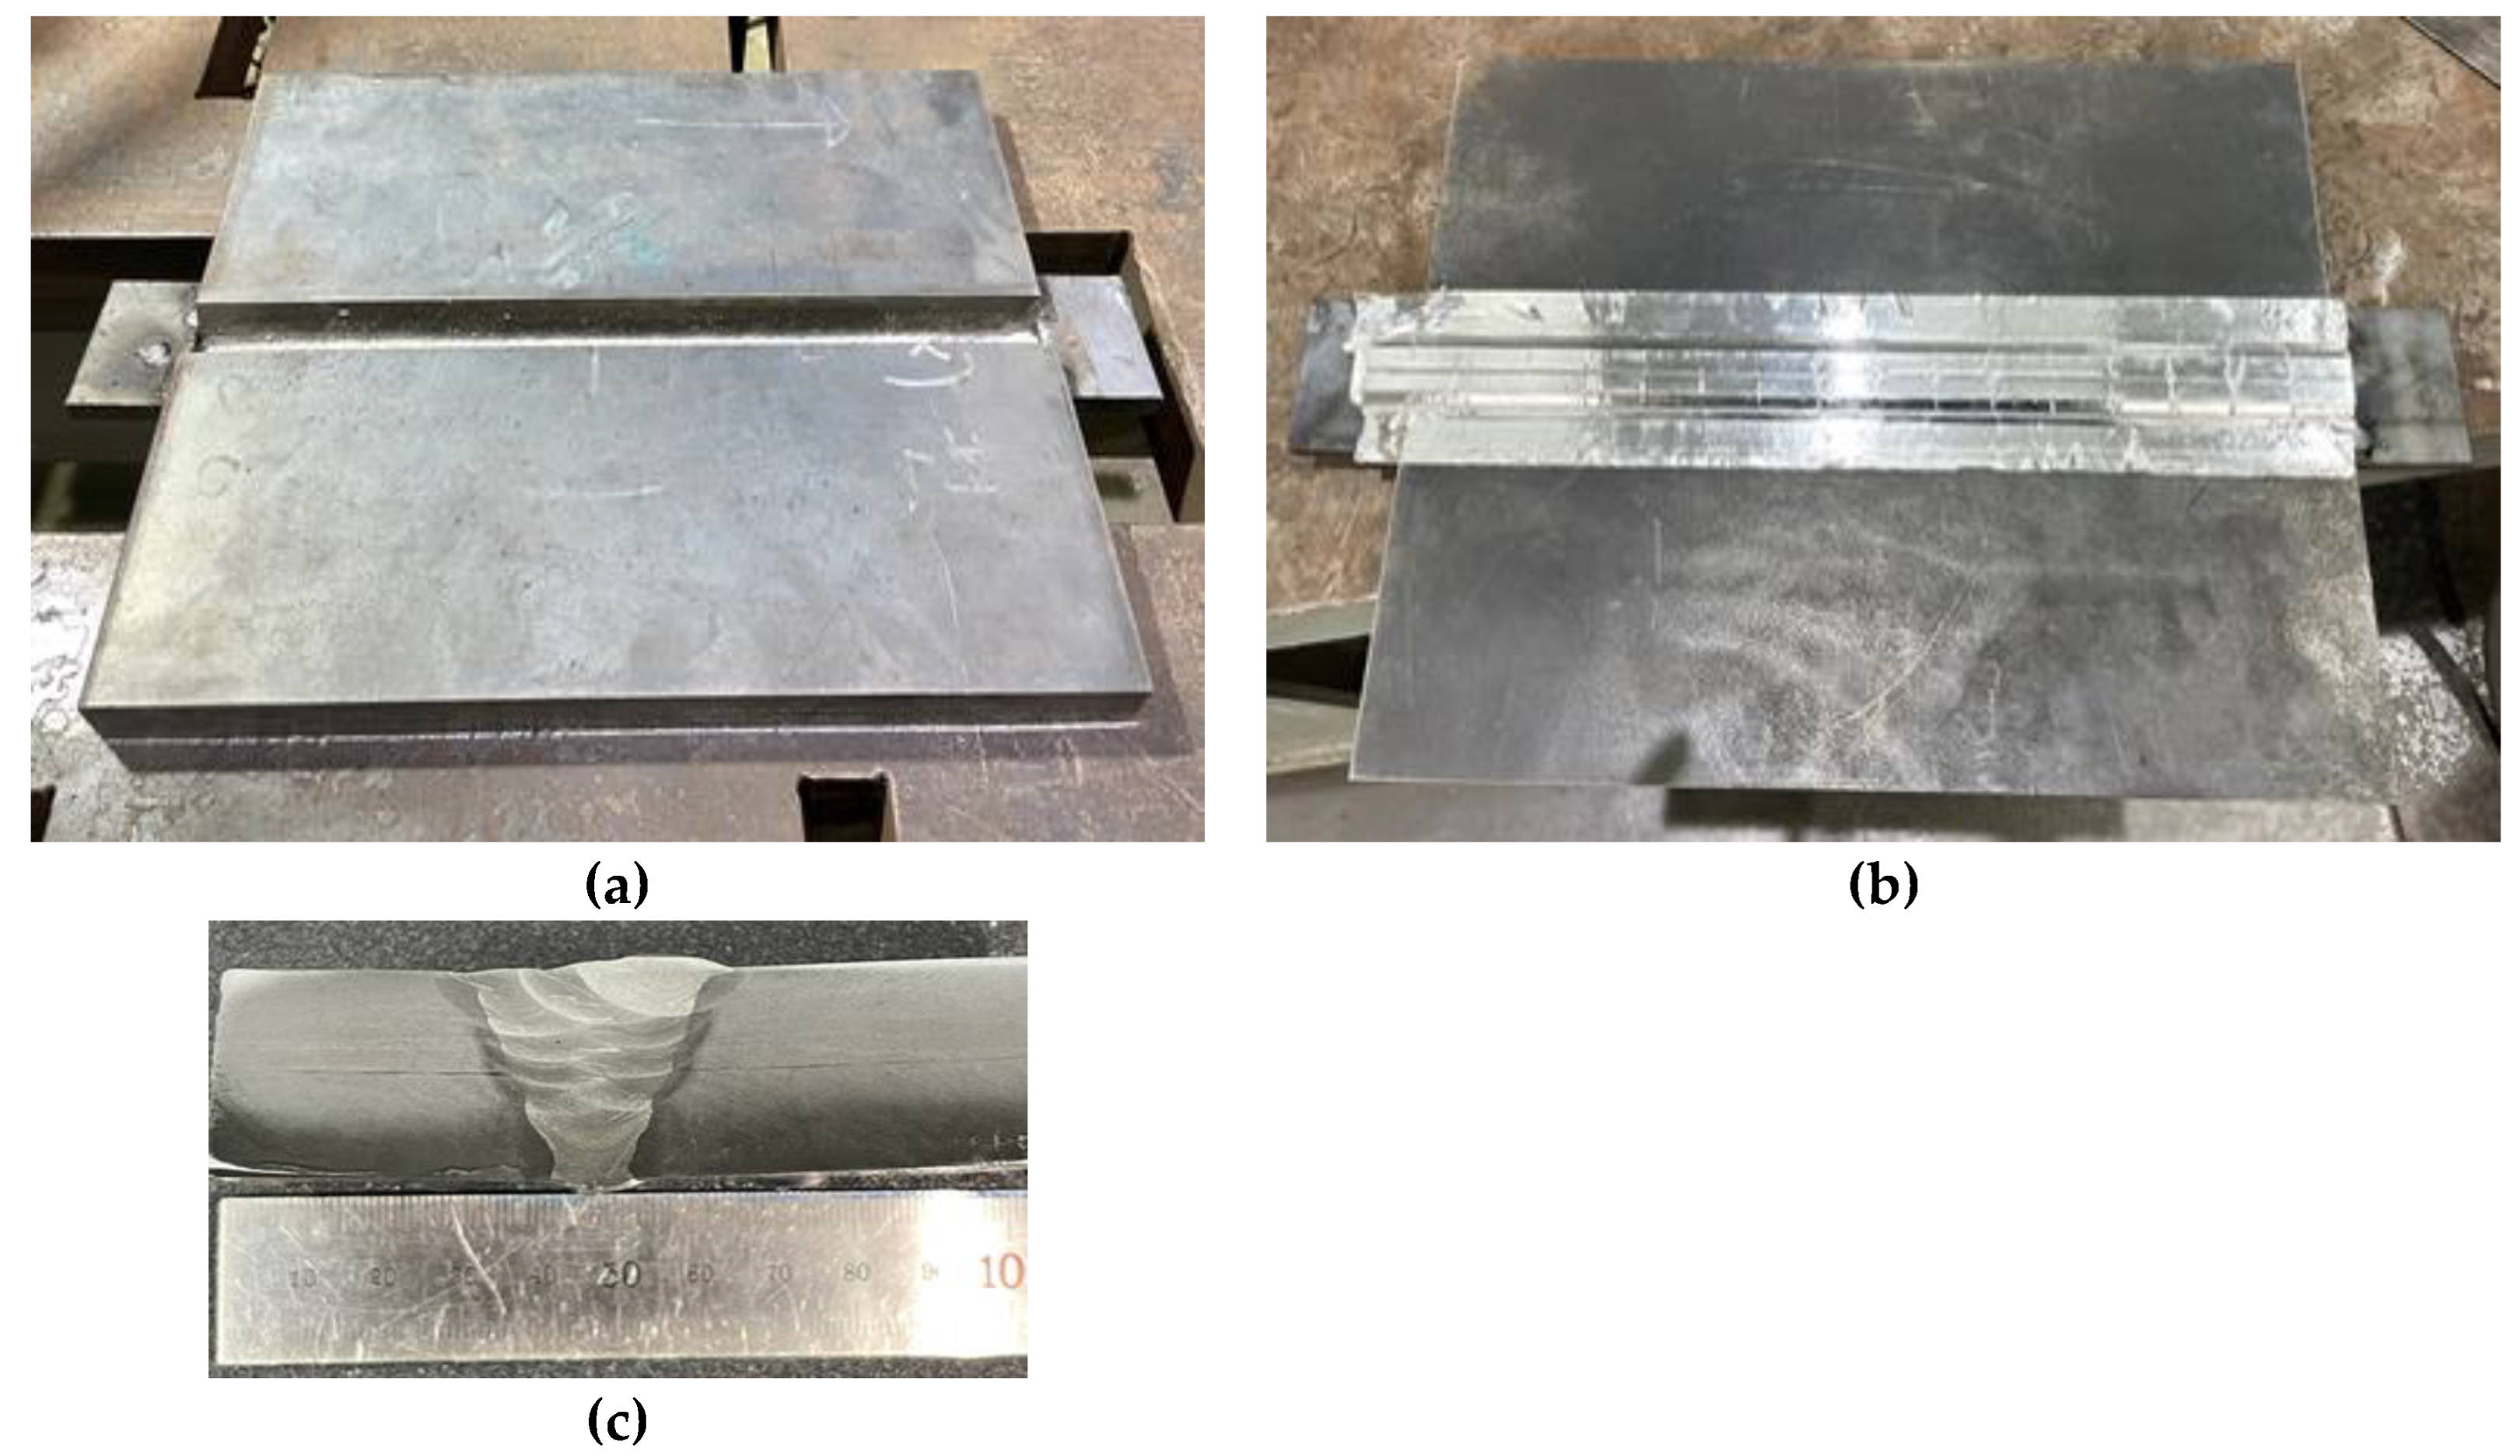
Figure 2 shows the welding constrained conditions of the fully constrained specimen. Figure 2a shows the forced constraint using the jig and end tap of the start and end parts of the weld. For the full constraint, the end tap was constrained using full penetration welding with the same size as the entire specimen. Meanwhile, as shown in Figure 2b, the root part was fully constrained with a size half the width of the weld specimen using the same type of steel as the specimen. Figure 3 shows the welding constrained conditions of the fully unconstrained specimen. As shown in Figure 3a, a free end was created to enable deformation to occur freely at both ends of the weld without using a constraint jig. As shown in Figure 3b, a ceramic backing material was used for the root part to minimize the effect of constraint.

2.3. Welding Residual Stress Measurement Using the Cutting Method

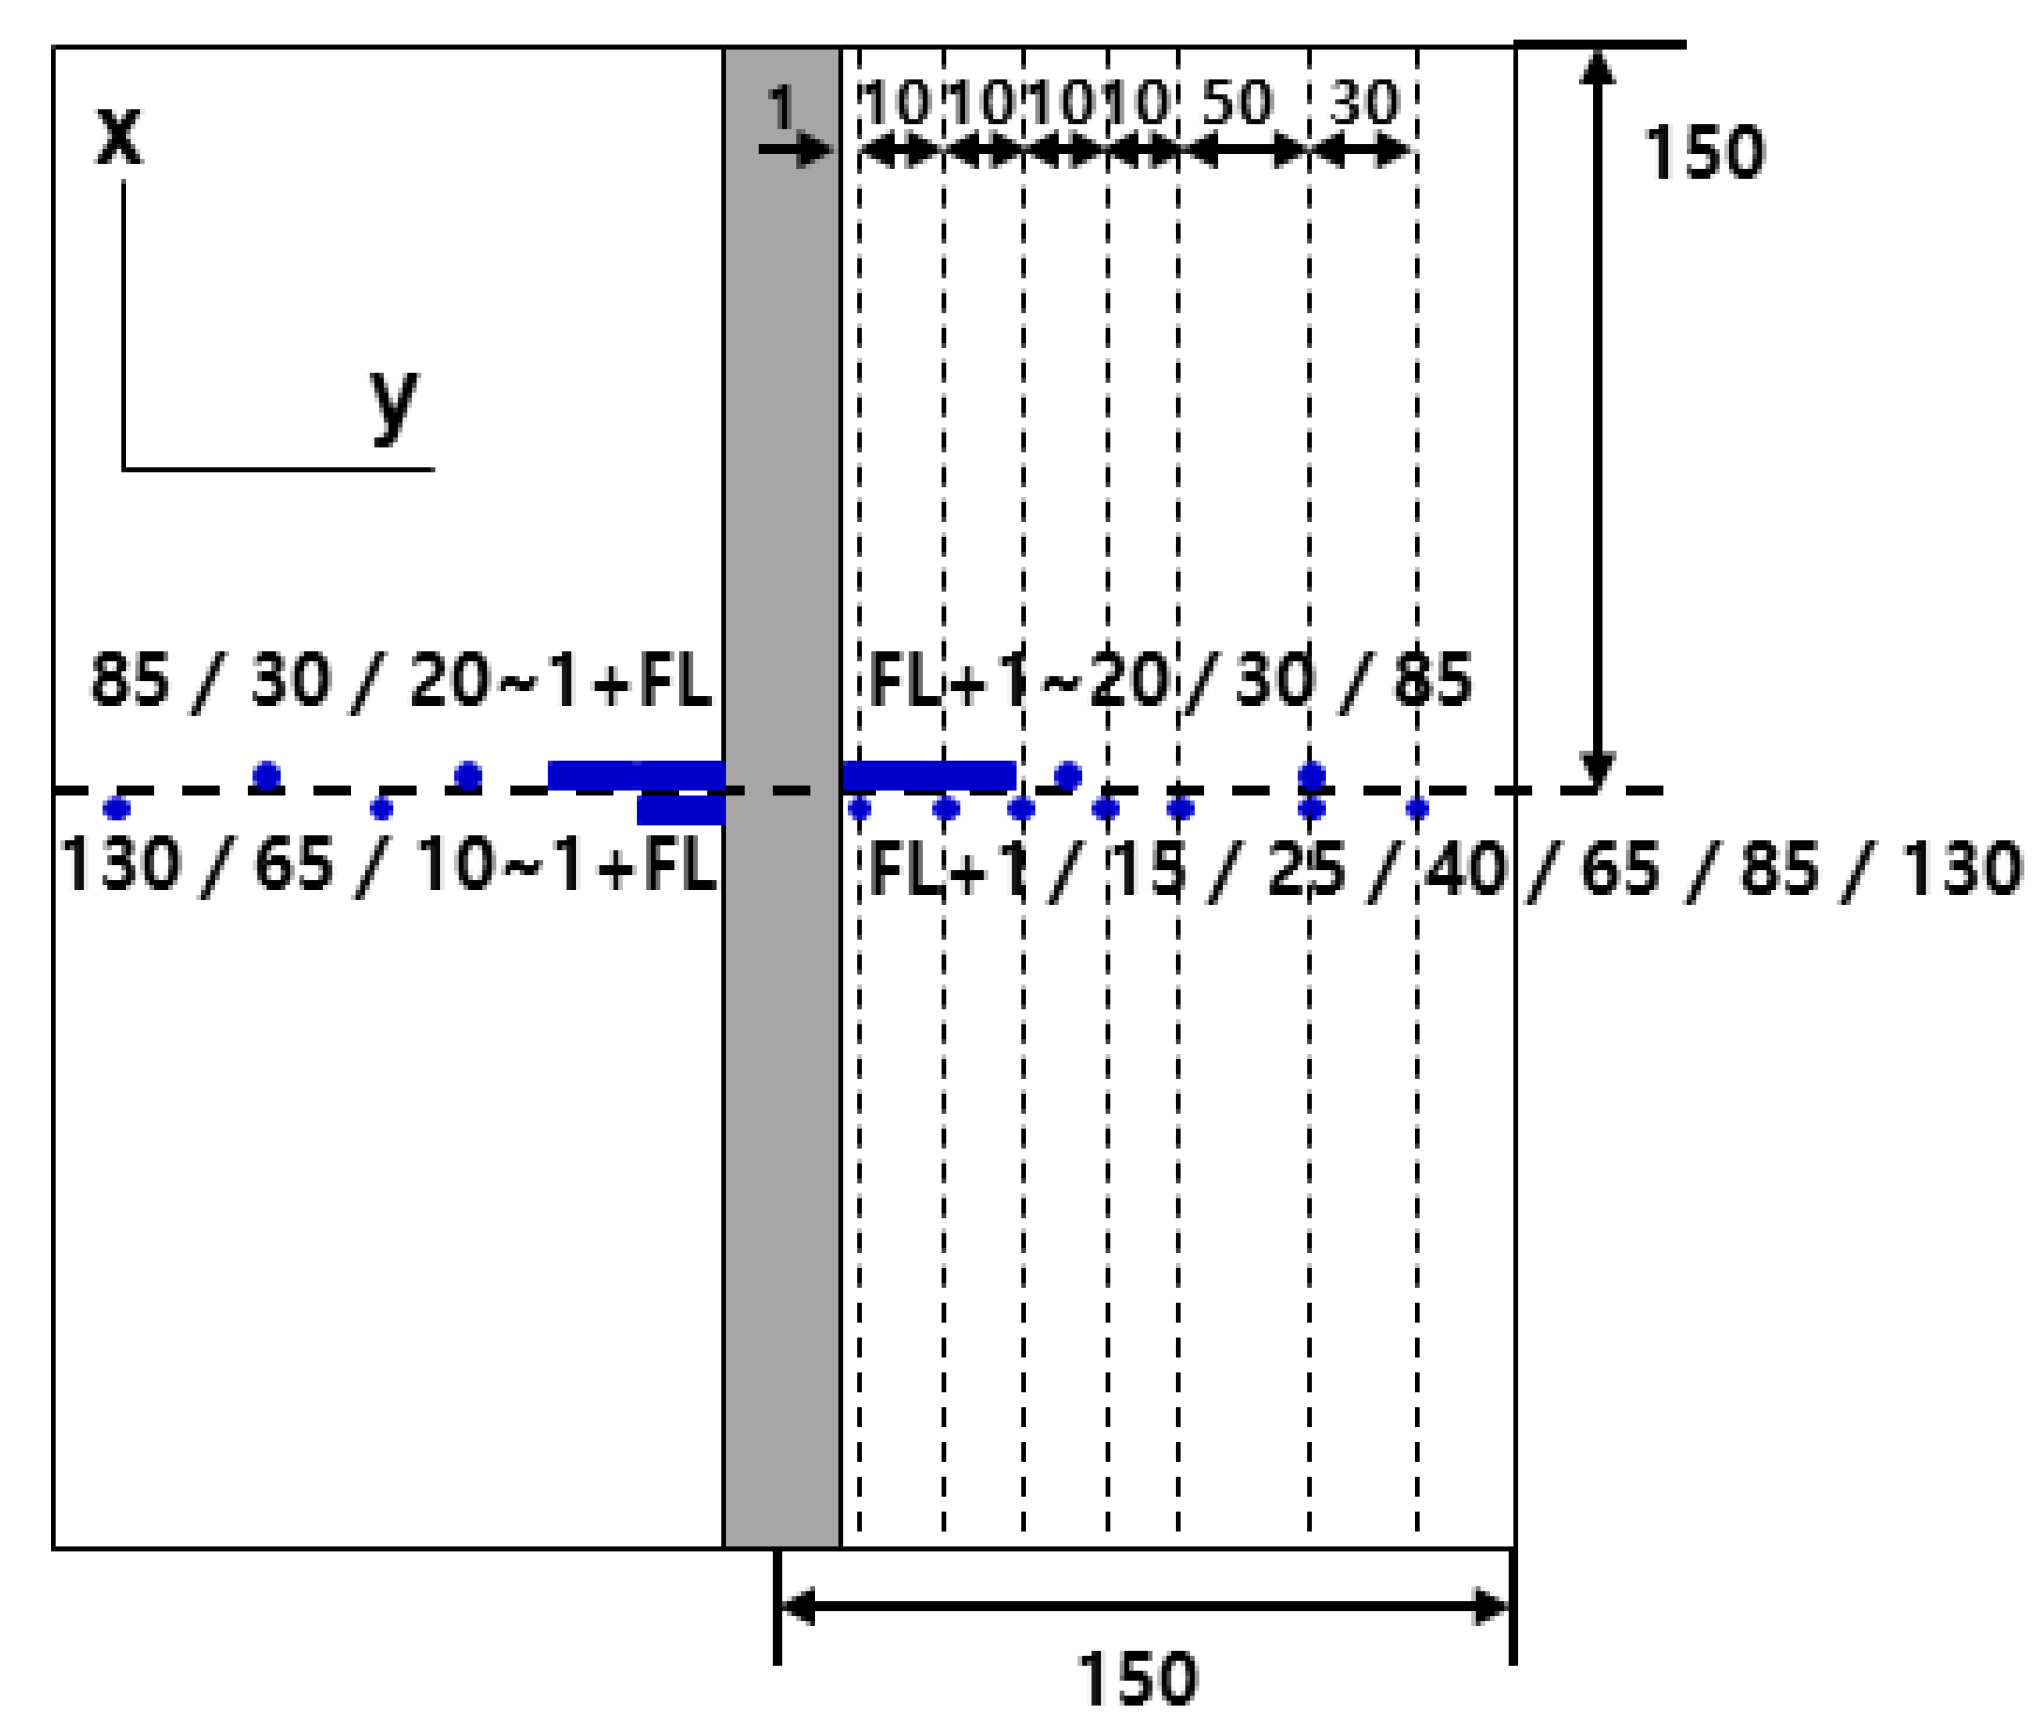
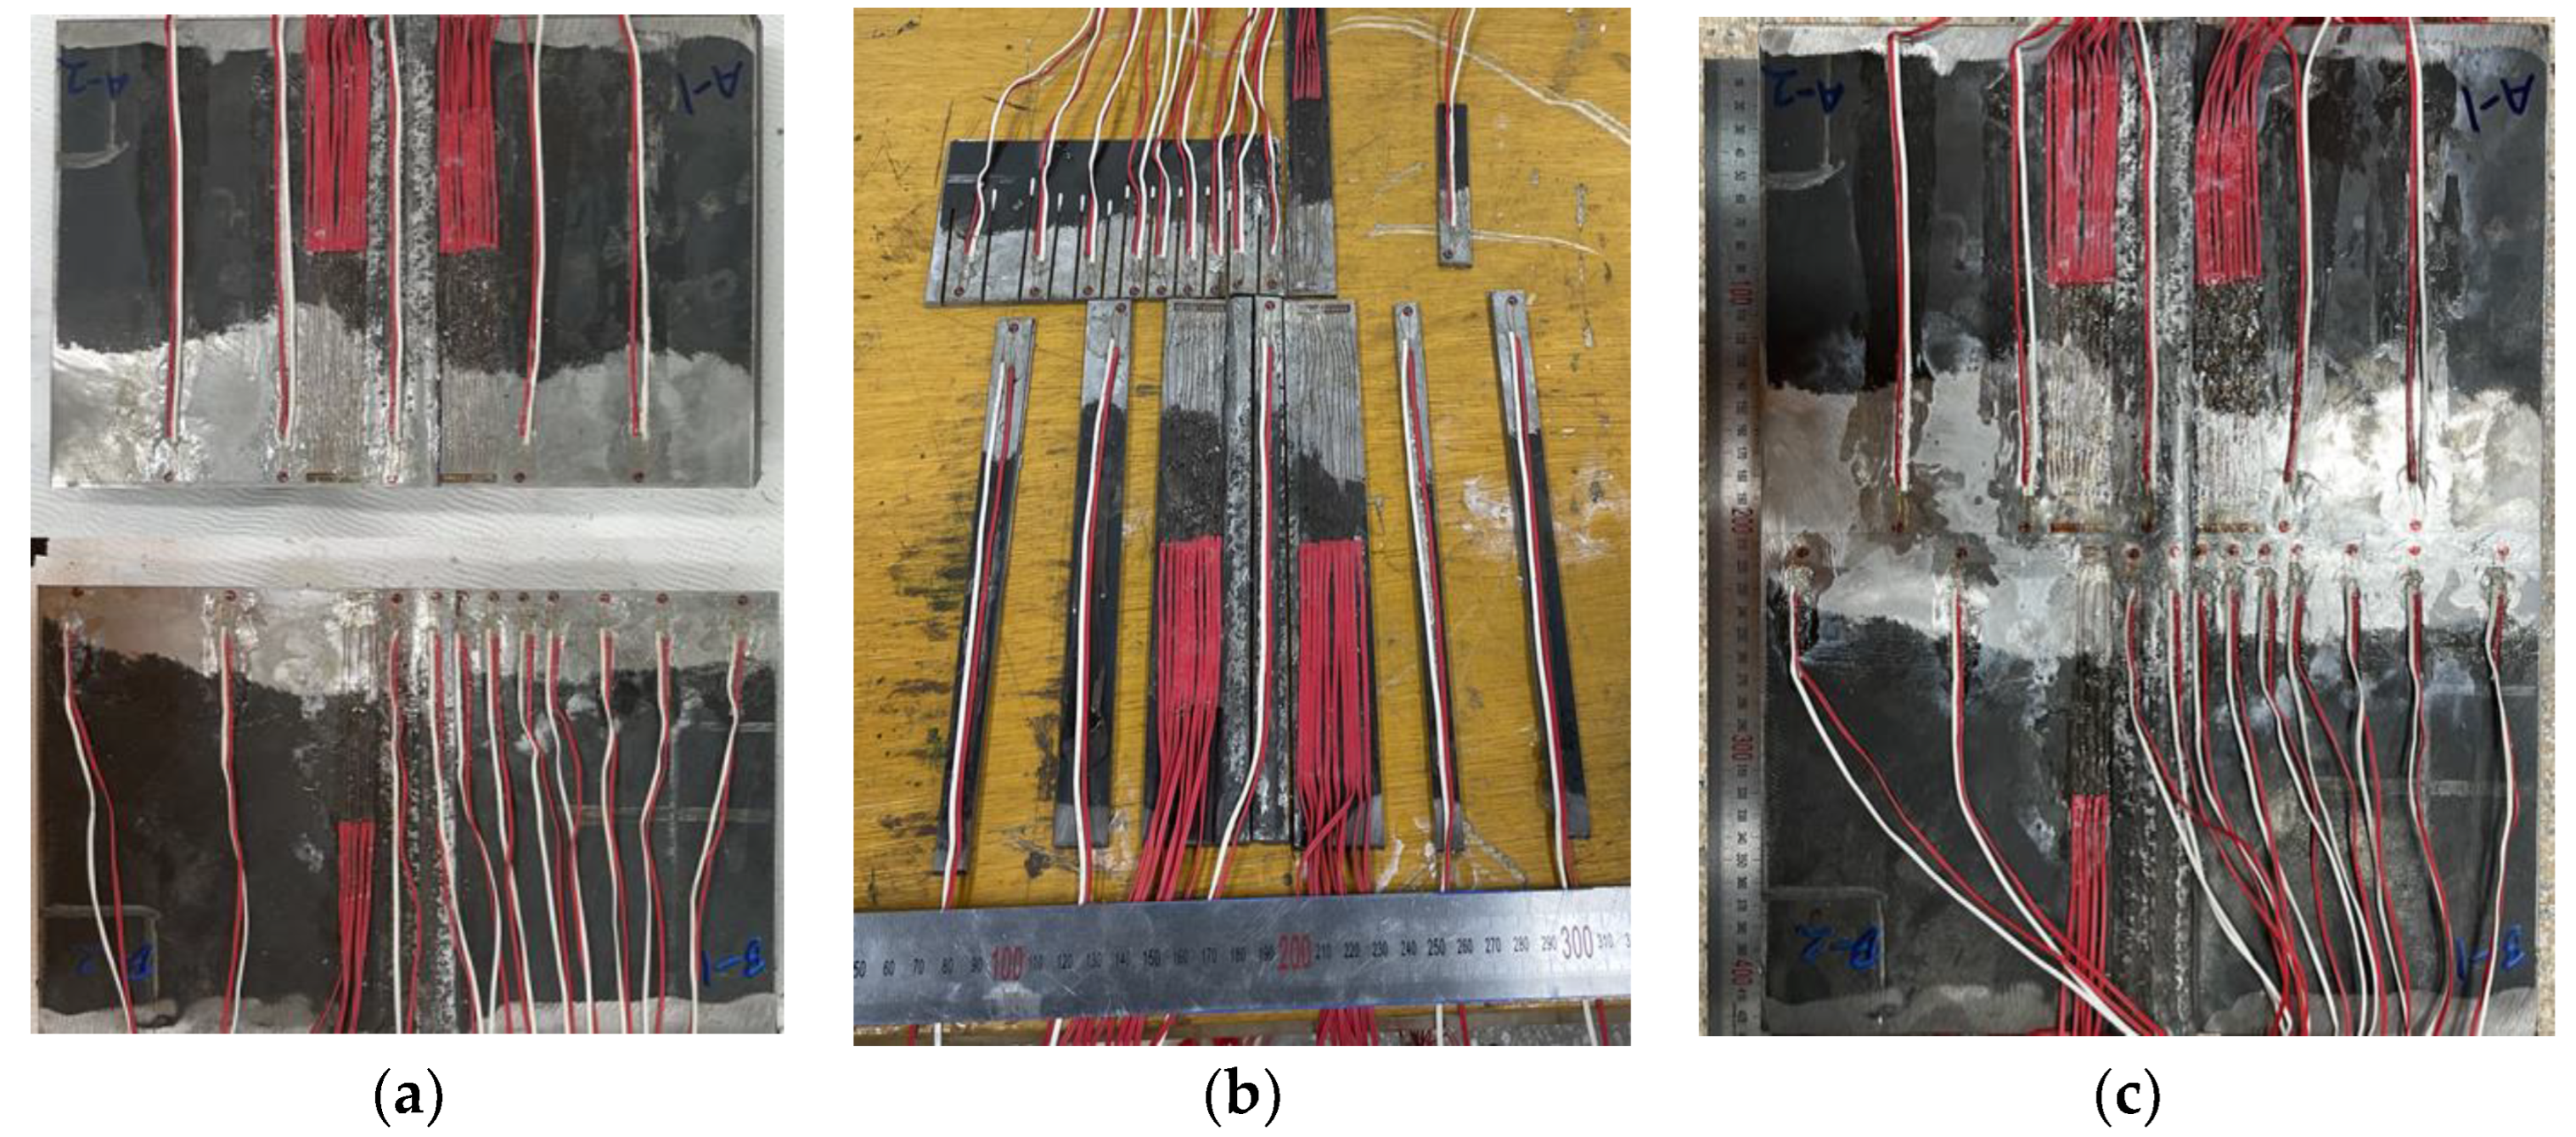
Figure 4 shows the attachment positions of the strain gauges to measure welding residual stress in the weld using the cutting method. Generally, the welding residual stress distribution rapidly changes near the weld, including the heat-affected zone (HAZ); therefore, strain gauges were attached as close to the HAZ as possible. The attached positions were fusion line (FL), FL + 1, FL + 15, FL + 25, FL + 40, FL + 65, FL + 85, and FL + 130. When measuring residual stress using the cutting method, the heat generated must be controlled by the cutting speed. Thus, the cutting speed was maintained at 2 mm/min to prevent heat generation from the cut surface, and the heat generated during cutting was controlled through the cutting fluid and water. A disadvantage of the cutting method is that only the residual stress at the surface can be measured. However, it is known that the reliability of the measured results is high because it has been used for a long time compared to other methods. Strain gauges were attached near to 150 mm, the center of the welding line direction. Figure 5a shows the state in which strain gauges to measure residual stress were attached to the welded specimen. After attachment, the initial values were measured using a data logger. As shown in Figure 5b, the specimen was cut perpendicular to the welding line to release welding residual stress in the welding line direction. As shown in Figure 5c, welding residual stress in the direction perpendicular to the welding line and welding residual stress in the thickness direction were released by cutting in the welding line direction and thickness direction.

2.4. Welding Residual Stress Measurement Using Neutron Diffraction

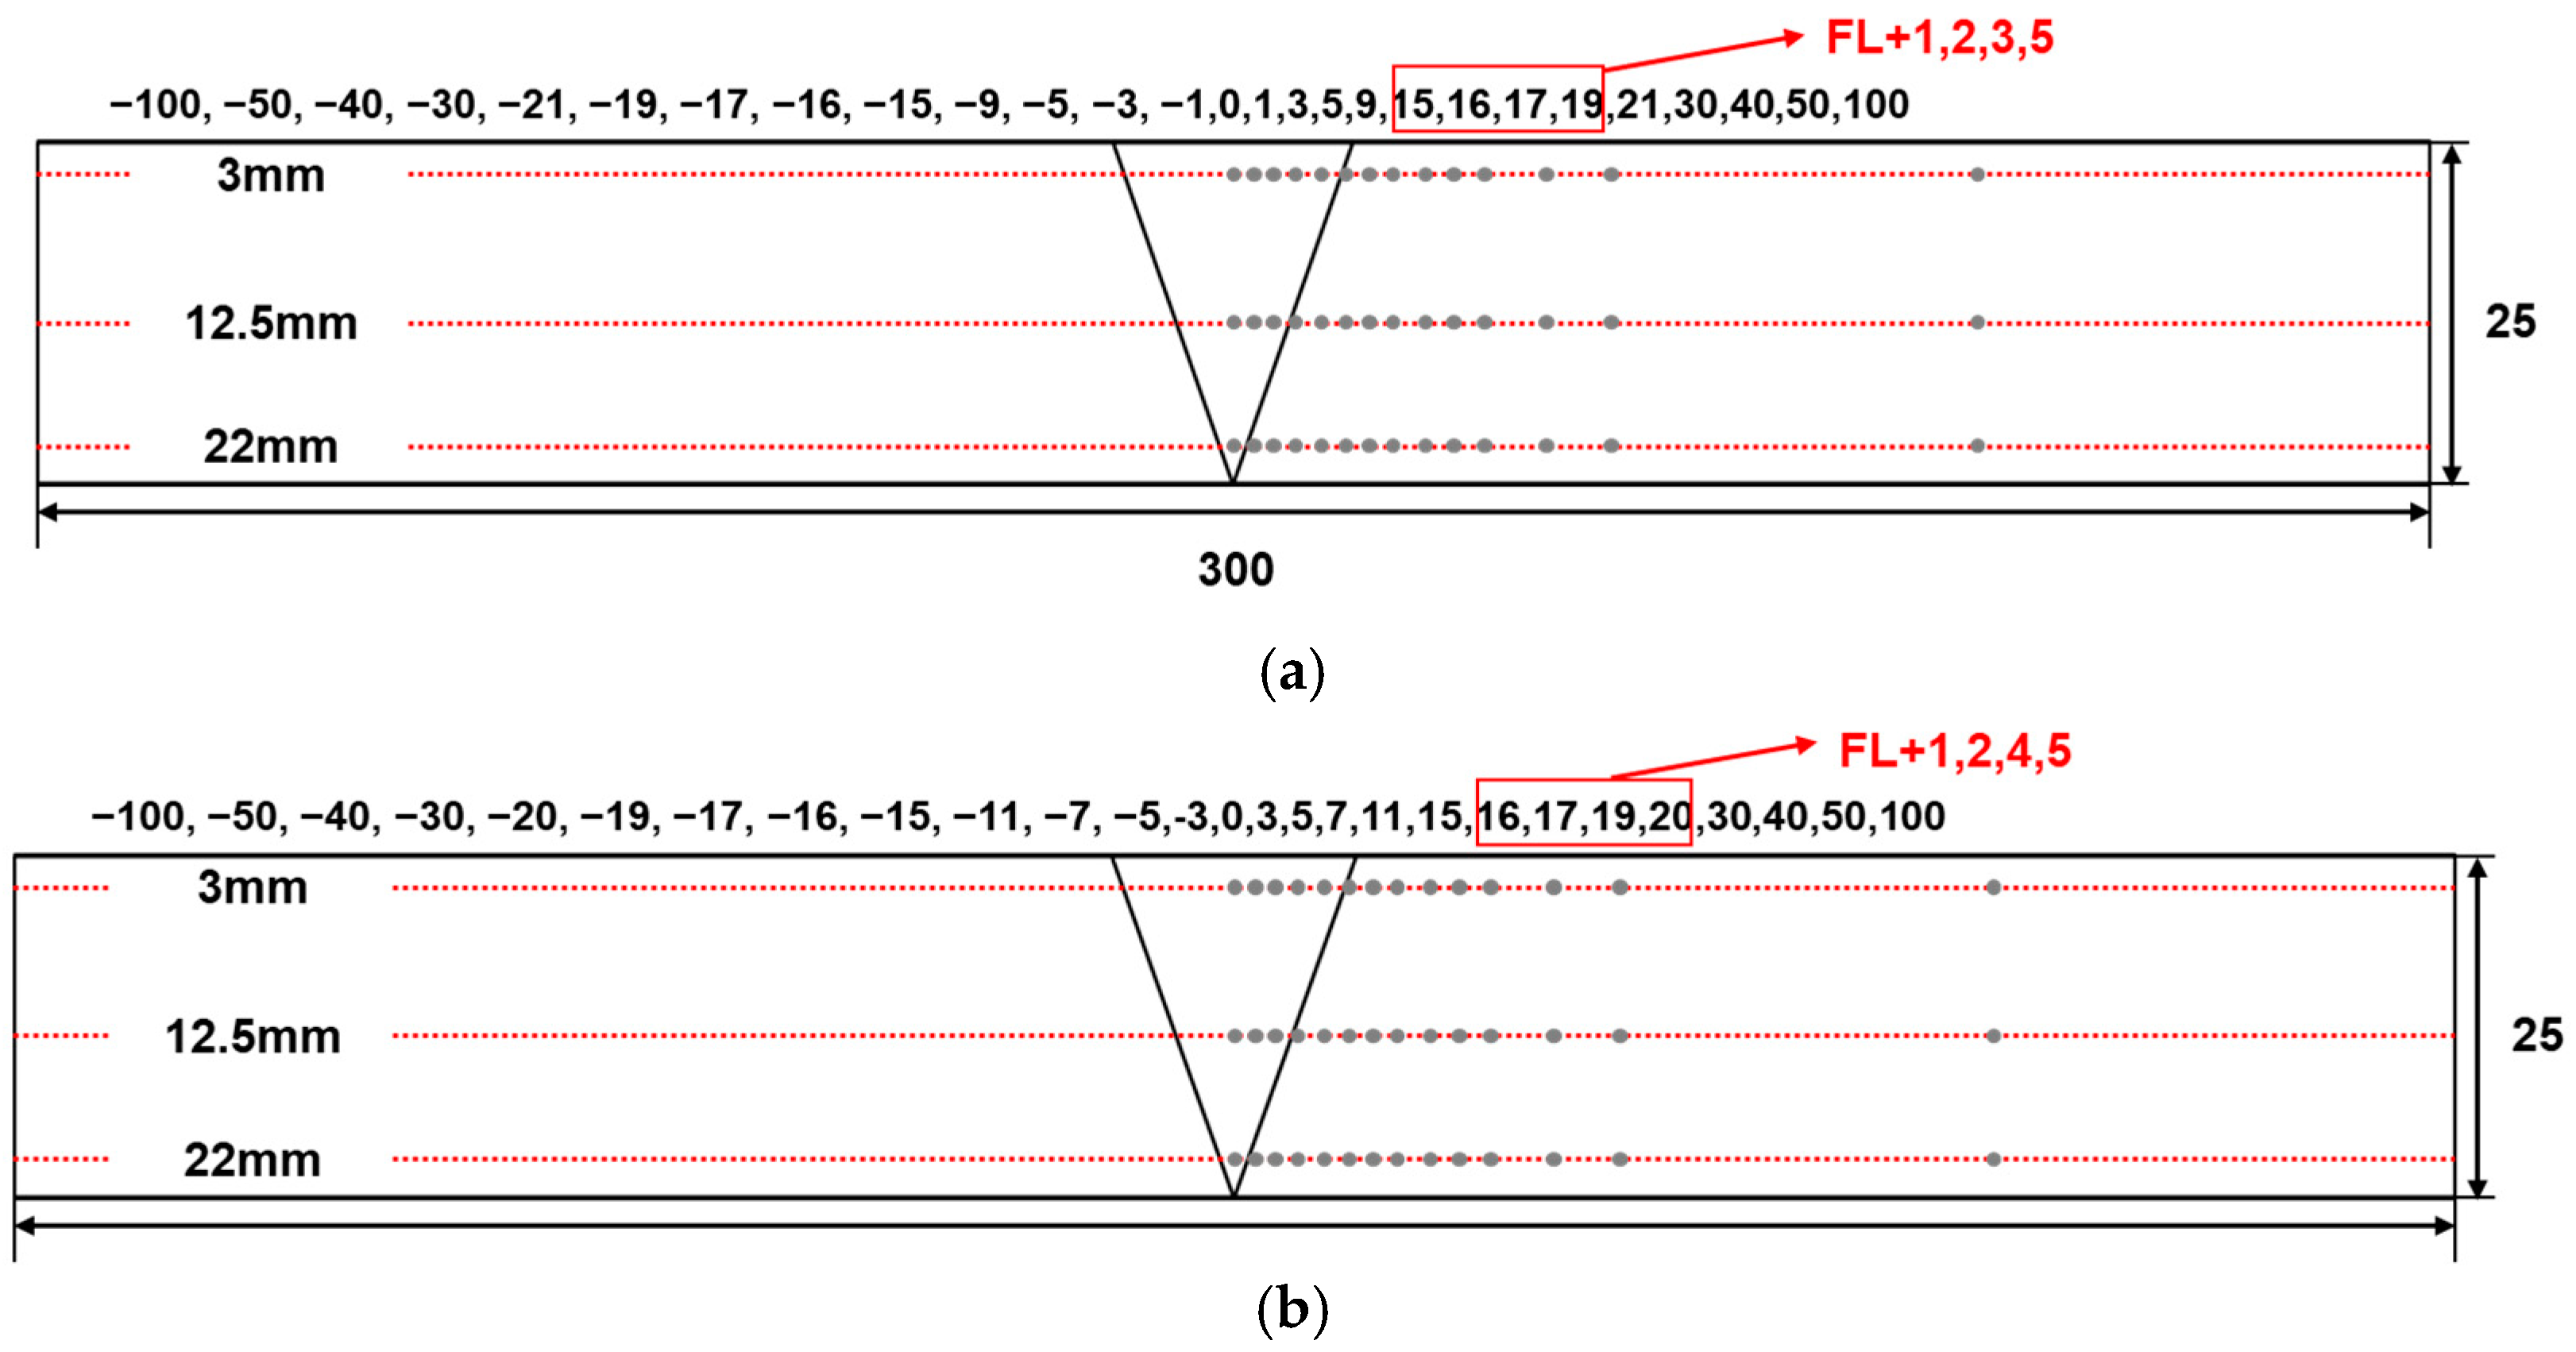
Using the research nuclear reactor HANARO of the Korea Atomic Energy Research Institute, we measured the welding residual stress using the neutron diffraction method [24,25,26]. Spatially resolved neutron strain scanning was performed by using the residual stress instrument (RSI) at the Korea Atomic Energy Research Institute (KAERI) [27]. The residual stresses were measured through the thickness of the 80 mm thick welds utilizing the two-peak combined methodology with the benefit of the wavelength dependence of neutron beam penetration [28,29]. The advantage of the neutron diffraction method is that residual stress in three directions can be measured in the thickness direction. However, it is difficult to fabricate the device because it requires the use of uranium. First, wavelengths of 2.39 Å and 1.55 Å were selected for the diffraction planes (110) and (211) at scattering angles of 72.4° and 82.5°, respectively. Note that both Si (111) and Si (220) monochromators at take-off angles of 45° and 48° produced neutrons with the appropriate wavelengths. Such a configuration increased the penetration depth of neutrons significantly due to lower attenuation [28]. Neutron diffraction is a non-destructive measurement method that can measure the stress of three axes up to about 80 mm or more in the thickness direction. Figure 6 shows the positions where welding residual stress was measured using the neutron diffraction method. Figure 6a shows the neutron diffraction measurement positions of the fully constrained specimen, and Figure 6b shows those of the fully unconstrained specimen. The welding residual stress was measured at 3, 12.5, and 22 mm in the thickness direction from the face surface of the weld. Measurements were obtained at the same positions in the bulk and stress-free specimens. To calculate the neutron diffraction, we must measure ε in three axes. Figure 7 shows the process of measuring welding residual stress using the neutron diffraction method. Figure 7a,b show the measurement process for the fully constrained specimen and stress-free specimen taken from the fully constrained specimen, respectively. The fully unconstrained specimen was measured using the same process. In Figure 7a QLD, QTD, and QND were longitudinal direction, transverse direction, normal direction.

2.5. Welding Residual Stress Measurement Using the Contour Method

The contour method, which measures welding residual stress in the thickness direction, was applied to measure the welding residual stress of the welds used in this study. However, the contour method can only measure the residual stress in the direction perpendicular to the cut surface. The contour method (CM) is a newly devised method for measuring residual stress over a cross-section [30,31]. Displacements of a cut surface occur due to the relaxation of the internal stress. The surface displacements are measured, and the residual stresses are recreated using a finite element model. The forces required to ensure that the measured deformed surface is returned to its original position represent the residual stresses. The method provides a two-dimensional (2-D) map of the residual stresses normal to the cut surface. The displacements of the cut surface (the surface contour) are created as residual stresses are relaxed. The displacements are compared to an assumed flat surface contour. The residual stresses are computed using an elastic finite element model. The main experimental procedures include (1) specimen cutting, (2) surface displacement measurement, and (3) data reduction and analysis. A detailed description of the general methodology is given in Refs. [32,33,34,35]. It is assumed that only elastic relaxation occurs on cutting and there are no cutting-induced stresses. Therefore, the direction perpendicular to the welding line was cut, and the residual stress in the direction of the welding line was measured. Cutting was performed using wire electric discharge machining (WEDM). Regarding the WEDM conditions, as shown in Table 6, brass (Cu 65% + Zn 35%) wire with a diameter of 0.25 mm was used. Figure 8 shows the contour measurement process of the cut surface using precision electric discharge machining and the cut surface using a laser 3D scanner. To secure the data from the cutting method simultaneously with the contour measurements, we attached strain gauges to the cut surface, and the cutting method was also applied to improve the reliability of the experimental values. Both sides of the cut surface were measured, and the averages of symmetric points were calculated, after which the contour data were summarized. Data that may cause measurement errors due to defects and impurities were deleted, and the specimen boundaries were extracted using the outermost coordinates. The same points as the neutron diffraction method were measured.

3. Results and Discussion

3.1. Welding Residual Stress Distribution in Specimens

Figure 9 shows the measurements of the distribution of residual stress (σx) in the welding line direction for the fully constrained and unconstrained specimens using the cutting method, contour method, and neutron diffraction method. The measured values of the cutting method were the welding residual stresses on the surface, and those of the neutron diffraction and contour methods were the welding residual stresses at 3, 12.5, and 22 mm in the thickness direction from the surface. As the same welding material was applied to the fully constrained and unconstrained specimens, similar welding residual stress behavior was observed. In the HAZ, the residual stress in the welding line direction of the fully unconstrained specimen was smaller than that of the fully constrained specimen. The fully constrained specimen was excessively constrained, thus preventing any welding deformation from occurring; therefore, a relatively large tensile residual stress was distributed. The quantitative values of residual stress differed owing to the difference in constraints. The rather small residual stress in the fully unconstrained specimen was considered to occur in the form of deformation because deformation could freely occur. As shown in Figure 9a, based on the residual stress measurements in the welding line direction on the surface of the fully constrained specimen using the cutting method, approximately 350 MPa of tensile residual stress was distributed at the weld, 332 MPa on the left of FL + 1 mm, and 381 MPa on the right. According to the measurements of residual stress in the welding line direction at a point of 3 mm in the thickness direction from the surface of the fully constrained specimen using the neutron diffraction method, about 407 MPa of tensile residual stress was distributed at the weld. In all, 287 MPa of tensile residual stress at the left of FL + 1 mm decreased toward the base material, and a compressive residual stress of −135 MPa was distributed at FL + 100 mm. A tensile residual stress of 358 MPa was distributed on the right of FL + 1 mm, and compressive residual stress of −376 MPa was distributed at FL + 100 mm. According to the measurements of residual stress in the welding line direction at a point of 3 mm in the thickness direction from the surface of the fully constrained specimen by the contour method, 438 MPa of tensile residual stress was distributed at the weld, tensile residual stress of 274 MPa on the left of FL + 1 mm, and tensile residual stress of 393 MPa on the right of FL + 1 mm.
According to the residual stress measurements in the welding line direction on the surface of the fully unconstrained specimen, a tensile residual stress of 375 MPa was distributed at the weld. A tensile residual stress of 202 MPa was distributed on the left of FL + 1 mm, the tensile stress decreased further away from the welding line, and compressive residual stress of −9 MPa was distributed at FL + 100 mm. The right side exhibited nearly identical distributions to those on the left side. According to the residual stress measurements in the welding line direction at a point of 3 mm in the thickness direction from the surface of the fully unconstrained specimen using the neutron diffraction method, a tensile residual stress of about 447 MPa was distributed at the center of the weld. Tensile residual stress of 293 MPa was distributed at the right of FL + 1 mm, and compressive residual stress of −177 MPa was distributed at FL + 100 mm. According to the contour method measurements, a tensile residual stress of 401 MPa was distributed at the weld, a tensile residual stress of 350 MPa was distributed on the left of FL + 1 mm, and a compressive residual stress of 320 MPa was distributed at FL + 1 mm. Figure 9b shows the left and right residual stresses (σx) in the welding line direction at a point of 12.5 mm in the thickness direction from the surface measured using the neutron diffraction and contour methods. The residual stress in the welding line direction at the HAZ of the fully constrained specimen was nearly identical to the residual stress distribution at a point of 3 mm from the surface. The difference in the welding residual stress on the left and right of the welding line occurred because welding was completed on the right side; thus, the constraining force increased, and heat caused the high welding residual stress to be distributed. For both the neutron diffraction and contour methods, the fully constrained specimen exhibited a greater welding residual stress than the fully unconstrained specimen. Figure 9c shows the distribution about the center of the weld metal of the left and right σx values in the welding line direction at a point of 22 mm from the surface measured using the neutron diffraction and contour methods. According to the residual stress measurements in the welding line direction of the fully constrained specimen using the neutron diffraction method, large tensile residual stress of about 600 MPa was distributed at the weld, and the residual stress at the center of the weld metal tended to decrease. A large difference was observed in the welding residual stress between the neutron diffraction and contour methods in the HAZ, including the weld metal. However, in the fully unconstrained specimen, the results of both experimental methods were nearly identical. Overall, the residual stress of the fully constrained specimen was large, and that of the fully unconstrained specimen was small.

3.2. Welding Residual Stress in Thickness Direction with Constraint Effect

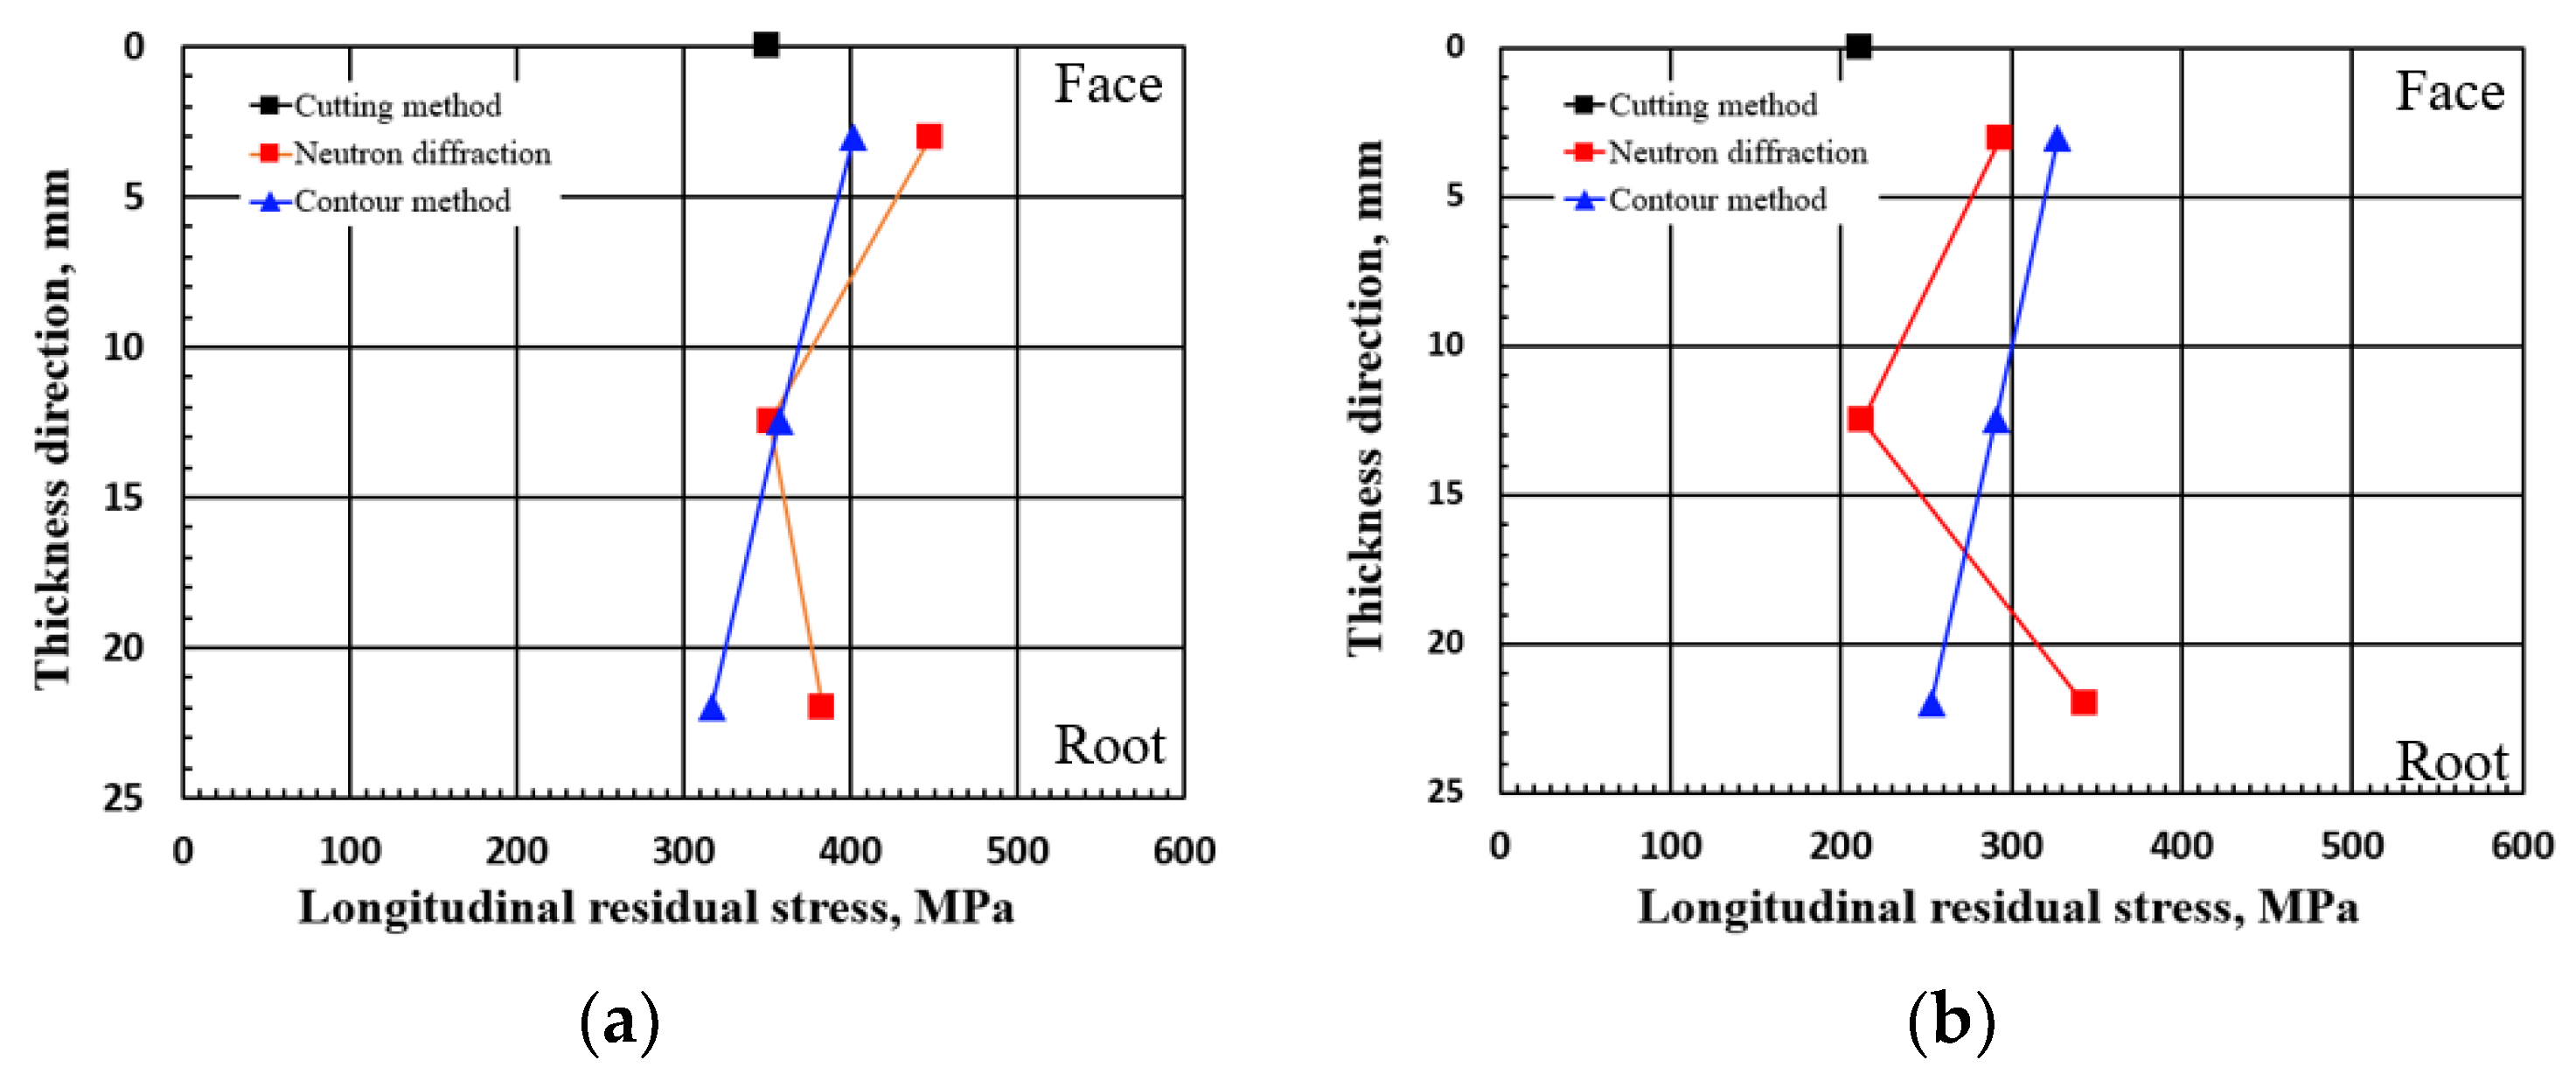
Figure 10 shows the welding residual stress (σx) distribution in the thickness direction for the fully constrained and unconstrained specimens using the cutting method, contour method, and neutron diffraction method with weld metal and fusion line + 1 mm positions. The measured values of the cutting method were the welding residual stresses on the surface, and those of the neutron diffraction and contour methods were the welding residual stresses at 3, 12.5, and 22 mm in the thickness direction from the surface. In the thickness direction, residual stress in the weld metal of the fully constrained specimen was smaller than that of both measurement methods, which were the neutron diffraction and contour methods. A large tensile residual stress was distributed on the surface, and tensile residual stress was also distributed in the thickness direction; however, the value was slightly reduced compared to the surface, with a tensile stress of 320 to 380 MPa. The welding residual stress in the thickness direction at the fusion + 1 mm position is shown in Figure 10b, and the stress distribution in the center showed good agreement in two measurement methods.
In the measurement of welding residual stress in the thickness direction for the conventional steel with a yield strength of 490 MP, the tensile residual stress of 200 MPa to 350 MPa was distributed in the thickness direction according to previous research [36]. Of course, the constrained conditions are slightly different; the constraints were slightly looser than those of the fully constrained specimens in this study, and therefore, the stress in the thickness direction was slightly smaller. It was confirmed that it was within the range of residual stress caused by completely unconstrained and fully constrained conditions. In addition, in the results of a previous study [37], the welding residual stress distribution was measured in the cruciform weld joint with 550 MPa high-strength steel, and it was confirmed that the distribution of residual stress on the surface was similar to the results of this study. Therefore, the reliability of the test results of this study was confirmed.
Figure 11 shows the residual stress distribution in the thickness direction at the WM and Fusion + 1 mm positions for the fully unconstrained specimens. As for the magnitude of quantitative stress, the tensile stress was reduced in the surface and thickness directions compared to the fully constrained specimen in weld metal and fusion line + 1 mm. It is judged that the residual stress is reduced because there is no effect of external restraint. In addition, it is judged that the system for the residual stress measurement method in the thickness direction was established through the quantitative agreement of the residual stress values by the two methods used for measuring the residual stress in the thickness direction in this study. In order to evaluate the change of the reduced residual stress according to the influence of the degree of restraint, the form of deformation was identified. When the welding residual stress is reduced or increased by the influence of external restraints, the changed residual stress is considered to be expressed in the form of deformation as complete plastic deformation occurs.

3.3. Relationship between Constraint and Welding Residual Stress

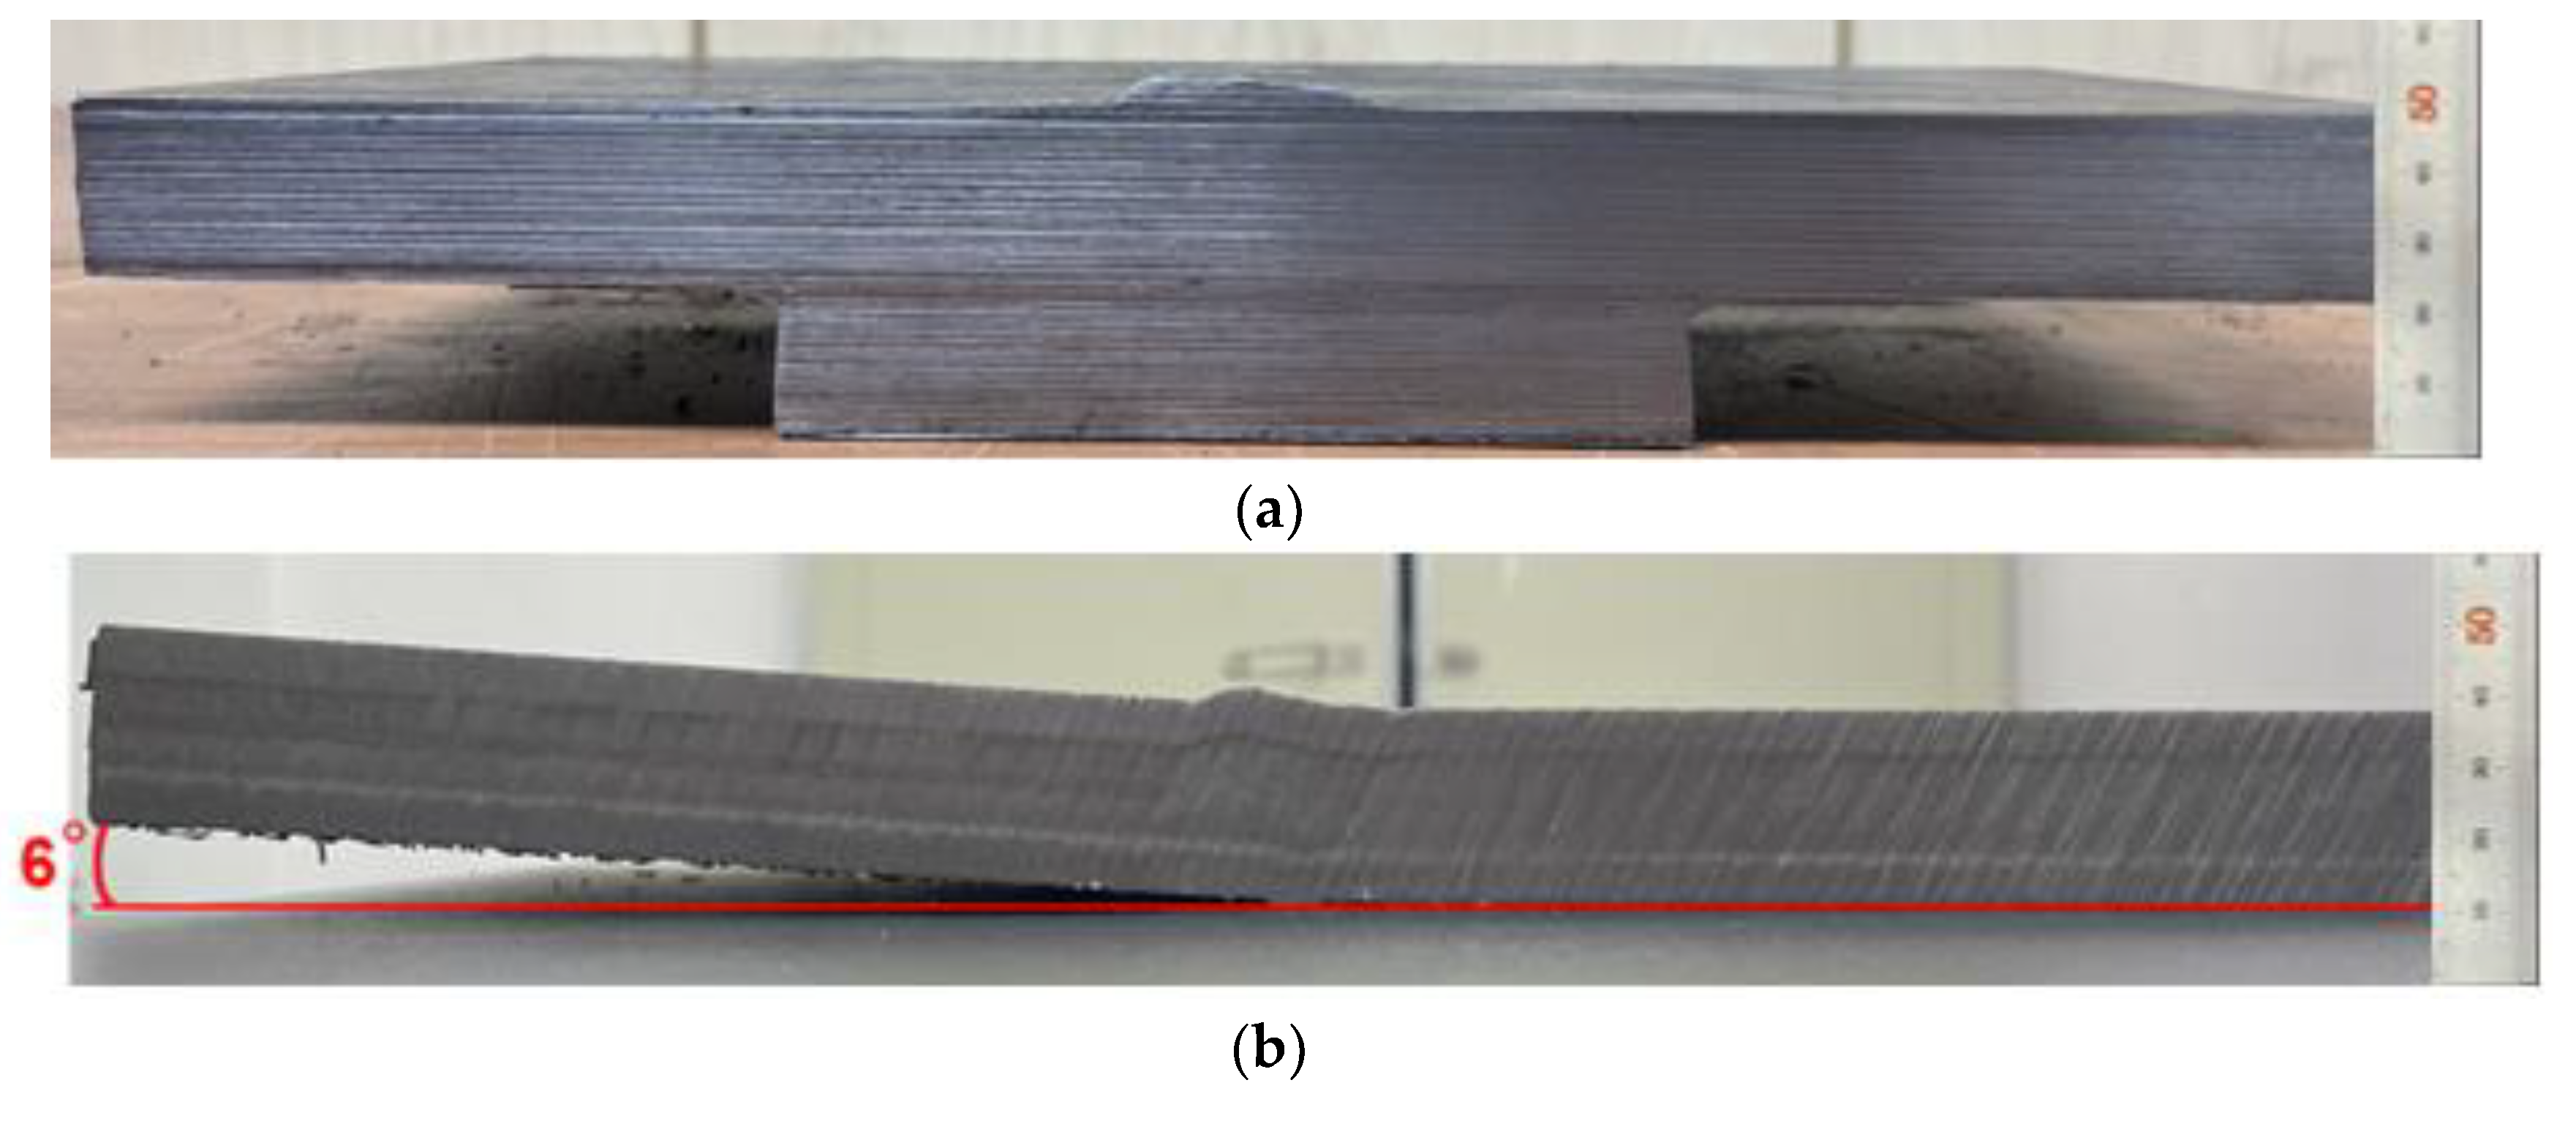
The difference in welding residual stress distributions owing to the influence of the constraint was larger in the HAZ than in the weld metal, and the fully unconstrained specimen exhibited smaller residual stress values than the fully constrained specimen. The difference in residual stress values owing to the difference in constraint with the same steel material and welding conditions was considered to have occurred because the reduced welding residual stress of the fully unconstrained specimen assumed other forms, such as deformation. Thus, we measured the angular deformation of both specimens. Figure 12a shows the angular deformation of the fully constrained specimen. Angular deformation did not occur because of the influence of the full constraint, whereas in the fully unconstrained specimen, angular deformation of approximately 6° occurred as shown in Figure 12b. The welding tensile residual stress decreased to around 42% in the unconstrained specimen compared to the constrained specimen, and at that time, angular deformation of approximately 6° occurred. Therefore, it is estimated that an angular distortion of about 2.4° occurs as the stress of 100 MPa decreases. Angular deformation was considered to have occurred freely owing to the absence of constraint, and it is known that the maximum value of welding residual stress is generally the degree of yield stress. When residual stress greater than the yield stress occurs, it changes to the plastic range; thus, it can no longer exhibit residual stress behavior in the elastic range and changes to a plastic state, appearing in the form of angular deformation, longitudinal deformation, and lateral deformation. We quantitatively evaluated that the difference in the maximum welding residual stress according to the influence of constraints would appear in the form of welding deformation. We will perform future studies on quantitative changes in welding residual stress and welding deformation to further elucidate this phenomenon.

4. Conclusions

To identify the distributions of welding residual stress according to the influence of constraints on high-strength steel for offshore structures, this study fabricated fully constrained and unconstrained specimens with butt weld joints and performed a comparative analysis of the forms of quantitatively changing residual stress values according to the influence of constraints and the welding residual stress distribution characteristics using the cutting, neutron diffraction, and contour methods. Based on this, the following conclusions were drawn.
Because of the difference between the fully constrained and unconstrained conditions, the maximum tensile residual stress values in the welding line direction differed, and the fully constrained specimen exhibited a large residual stress, such as 600 MPa in the face + 22 mm position.
Because of the influence of the constraint, the residual stress in the welding line direction at the HAZ of the fully unconstrained specimen was smaller than that of the fully constrained specimen, the maximum tensile residual stress of the fully constrained specimen formed in the first layer about 447 MPa, and the maximum tensile residual stress of the fully unconstrained specimen formed in the last layer.
The maximum welding residual stress is generally the degree of yield stress. When residual stress greater than the yield stress occurs, it changes to the plastic range and appears in the form of angular, longitudinal, and lateral deformation. Under the fully unconstrained condition, the reduced residual stress is considered to appear in the form of angular deformation.
A welding residual stress measurement system in the thickness direction was constructed. Based on applying the contour method and the neutron diffraction method, residual stress in the thickness direction of the weld was measured, and similar results were obtained in both methods, and a thickness direction welding residual stress measurement system was established.

Author Contributions

G.A. and D.S. jointly conceived, designed, and performed the experiment and conducted data analysis. G.A., J.P. and W.W. analyzed the data and plotted the figures and wrote this paper. J.P. provided scientific guidance. All authors have read and agreed to the published version of the manuscript.

Funding

This study was funded by Chosun University grant number 2022.

Institutional Review Board Statement

Not applicable.

Informed Consent Statement

Not applicable.

Acknowledgments

This study was supported by a research grant awarded by Chosun University in 2022.

Conflicts of Interest

The authors declare no conflict of interest.

References

  1. Kim, D. Offshore Plant Industry. J. Korean Soc. Power Syst. Eng. 2013, 17, 12–16. [Google Scholar]
  2. Hong, S. Market Expansion and Response Strategies in the Offshore Structure; Korea Institute for Industrial Economics & Trade: Seoul, Republic of Korea, 2006; pp. 38–40. [Google Scholar]
  3. Seo, G.; Ju, H.; Park, S. Offshore plant industry development plan. J. Korean Soc. Mech. Eng. 2012, 52, 30–35. [Google Scholar]
  4. Yi, M.; Park, J. Study of Heat Source Model and Residual Stress Caused by Welding in GMAW of AI Alloy. Metals 2022, 12, 891. [Google Scholar] [CrossRef]
  5. Handbook of The Korean Welding and Joining Society; Construction of Inspection: Seoul, Republic of Korean, 2008; p. 2.
  6. Park, J. Mechanism and Effects of Welding Residual Stress Mechanism of Welding Residual Stress. J. KWS 2004, 22, 1–2. [Google Scholar]
  7. Kim, J.; Park, J.; Jin, T. Review on the International Joint Researches for Evaluation of Welding Residual Stresses. J. KWS 2005, 23, 8–17. [Google Scholar]
  8. Jin, H.; Lee, D.; Shin, S. Effect of Distance and Restraint Degree between Fillet and Butt Weldment on Residual Stress Redistribution at each Weldment. J. KWJS 2010, 28, 59–64. [Google Scholar]
  9. An, G.; Woo, W.; Park, J.; Em, V. Comparison of crack-arrest fracture toughness between low and high heat-input thick weld specimens. Int. J. Fract. 2015, 194, 197–203. [Google Scholar] [CrossRef]
  10. Withers, P.; Bhadeshia, H. Residual stress. Part 1—Measurement techniques. Mater. Sci. Techol. 2001, 17, 355–365. [Google Scholar] [CrossRef]
  11. Park, J.; An, G.; Ma, N.; Kim, S. Effect of Transverse Restraint on Welding Residual Stress in V-Groove Butt Welding. Metals 2022, 12, 654. [Google Scholar] [CrossRef]
  12. An, G.; Park, J.; Han, I. Effects of High Toughness and Welding Residual Stress for Unstable Fracture Prevention. Appl. Sci. 2020, 10, 8613. [Google Scholar] [CrossRef]
  13. An, G.; Park, J.; Han, I.; Woo, W. Unstable fracture phenomenon of welded joints with weld residual stresses. Theoretical and Applied Fracture Mechanics. 2020, 109, 1–8. [Google Scholar] [CrossRef]
  14. Wang, Y. Phases Stress Measurement of Centrifugally Cast Duplex Stainless Steel by Neutron Diffraction. Quantum Beam Sci. 2020, 4, 28. [Google Scholar] [CrossRef]
  15. Masaoka, I.; Yada, M.; Sasaki, R. Brittle Fracture Initiation Characteristics of Weld Joint for 80 kg/mm2 High Strength Thick Plate Steel(Report3)—Effect of Residual Stress and Repair Welding on Brittle Fracture Initiation from Surface Notch in Fusion Line of Welded Joints. J. Jpn. Weld. Soc. 2010, 44, 914–9230. [Google Scholar] [CrossRef] [PubMed] [Green Version]
  16. An, G.; Woo, W.; Park, J. Brittle crack-arrest fracture toughness in a high heat input thick steel weld. Int. J. Fract. 2014, 185, 179–185. [Google Scholar] [CrossRef]
  17. Bezensek, B.; Hancock, J. The toughness of laser welded joints in the ductile-brittle transition. Eng. Fract. Mech. 2007, 74, 2395–2419. [Google Scholar] [CrossRef]
  18. Park, J.; Lee, H.; Bang, H. Effects of mechanical constraints on angular distortion of welding joints. Sci. Technol. Weld. J. 2002, 7, 232–239. [Google Scholar] [CrossRef]
  19. Smith, D.; Bouchard, P.; George, D. Measurement and prediction of residual stresses in thick-section steel welds. J. Strain Anal. 2000, 35, 287–305. [Google Scholar] [CrossRef]
  20. Withers, P.; Turski, M.; Edwards, L.; Bouchard, P.; Buttle, D. Recent advances in residual stress measurement. Int. J. Pres. Ves. Pip. 2008, 85, 118–127. [Google Scholar] [CrossRef]
  21. Rossini, N.; Dassisti, M.; Benyounis, K.; Olabi, A. Methods of measuring residual stresses in components. Mater. Des. 2012, 35, 572–588. [Google Scholar] [CrossRef] [Green Version]
  22. Kim, I.; Jeong, S.; Choi, H.; Kim, M. Study on the Fracture Toughness of FCA Weldment with the Yield Strength 420MPa Grade High Strength Steels for Offshore Structures Depending on the Welding Position. JWJ 2018, 36, 67–73. [Google Scholar] [CrossRef] [Green Version]
  23. Yokura, T. Ship and Offshore Structure. JWS 2012, 81, 402–406. [Google Scholar] [CrossRef] [Green Version]
  24. Woo, W.; An, G.; Kingston, E.; DeWald, A.; Smith, D.; Hill, M. Through-thickness distributions of residual stresses in two extreme heat-input thick welds: A neutron diffraction, contour method and deep hole drilling study. Acta Mater. 2013, 61, 3564–3574. [Google Scholar] [CrossRef]
  25. Allen, A.; Hutchings, M.; Winsor, C.; Andreani, C. Neutron diffraction methods for the study of residual stress fields. Adv. Phys. 1985, 34, 445–473. [Google Scholar] [CrossRef]
  26. Hutchings, M.; Withers, P.; Holden, T.; Lorentzen, T. Introduction to the Characterization of Residual Stress by Neutron Diffraction; Taylor and Francis: London, UK, 2005; p. 420. [Google Scholar]
  27. Seong, B.; Em, V.; Mikula, P.; Saroun, J.; Kang, M. Optimization of a bent perfect Si(111) mono chromator at a small take-off angle for use in a stress instrument. J. Appl. Cryst. 2010, 43, 654–658. [Google Scholar] [CrossRef]
  28. Woo, W.; Em, V.; Seong, B.; Shin, E.; Mikula, P.; Joo, J.; Kang, M. Effect of wavelength-dependent attenuation on neutron diffraction stress measurements at depth in steels. J. Appl. Cryst. 2011, 44, 747–754. [Google Scholar] [CrossRef]
  29. Woo, W.; Em, V.; Seong, B.; Mikula, P.; An, G. Residual stress determination in a thick ferritic steel weld plate using neutron diffraction. J. Mater. Sci. 2012, 47, 5617–5623. [Google Scholar] [CrossRef]
  30. Prime, M. Cross-Sectional Mapping of Residual Stresses by Measuring the Surface Contour After a Cut. J. Eng. Mater. Tech. Trans. ASME 2001, 123, 162–168. [Google Scholar] [CrossRef] [Green Version]
  31. Kartal, M.; Liljedahl, C.; Gungor, S.; Edwards, L.; Fitzpatrick, M. Determination of the profile of the complete residual stress tensor in a VPPA weld using the multi-axial contour method. Acta Mater. 2008, 56, 4417–4428. [Google Scholar] [CrossRef]
  32. Zhang, Y.; Ganguly, S.; Edwards, L.; Fitzpatrick, M. Cross-sectional mapping of residual stresses in a VPPA weld using the contour method. Acta Meter. 2004, 52, 5225–5232. [Google Scholar] [CrossRef]
  33. Prime, M.; Gna¨upel-Herold, T.; Baumann, J.; Lederich, R.; Bowden, D.; Sebring, R. Residual stress measurements in a thick, dissimilar aluminum alloy friction stir weld. Acta Meter. 2006, 54, 4013–4021. [Google Scholar] [CrossRef]
  34. Sonne, M.; Carlone, P.; Hattel, H. Assessment of the Contour Method for 2-D Cross Sectional Residual Stress Measurements of Friction Stir Welded Parts of AA2024-T3-Numerical and Experimental Comparison. Metals 2017, 7, 508. [Google Scholar] [CrossRef] [Green Version]
  35. Pagliaro, P.; Prime, M.B.; Swenson, H.; Zuccarello, B. Measuring multiple residual-stress components using the contour method and multiple cuts. Exp. Mech. 2010, 50, 187–194. [Google Scholar] [CrossRef]
  36. Park, J.; An, G.; Woo, W.; Heo, S. Measurement of Welding Residual Stress in a 25-mm Thick Butt Joint using Inherent Strain Method. KWJS 2013, 31, 67–72. [Google Scholar]
  37. Cao, X.; Shen, S.; Wu, M.; Tao, Z.; Liu, S.; Tao, Q.; Kong, J.; Zhang, H.; Li, J.; Zhang, Y.; et al. Residual Stresses of 550 MPa high strength steel welded cruciform sections: Experimental and numerical study. Structures 2022, 44, 579–593. [Google Scholar] [CrossRef]
Figure 1. Dimensions and groove shape of the specimen. (a) Dimension of the specimen; (b) groove shape of the specimen.
Metals 13 00025 g001
Figure 2. Constrained condition of the specimens. (a) Jig and end tap; (b) steel backing; (c) macro section.
Metals 13 00025 g002
Figure 3. Unconstrained condition of specimens. (a) End tap; (b) ceramic backing; (c) macro section.
Metals 13 00025 g003
Figure 4. Attachment position strain gauges to the specimens.
Metals 13 00025 g004
Figure 5. Cutting process to measure welding residual stress. (a) Initial condition; (b) after the first cutting; (c) after the second cutting.
Metals 13 00025 g005
Figure 6. Neutron diffraction measurement points for the specimens. (a) Constrained weld specimen; (b) unconstrained weld specimen.
Metals 13 00025 g006
Figure 7. Neutron diffraction to measure welding residual stress. (a) Neutron diffraction process of bulk specimens; (b) neutron diffraction process of stress-free specimens.
Metals 13 00025 g007
Figure 8. Contour method to measure the welding residual stress. (a) WEDM cutting process of specimens; (b) contour method process of specimens.
Metals 13 00025 g008
Figure 9. Weld residual stress σx of face + 3, 12.5, and 22 mm by cutting, contour, and neutron diffraction methods. (a) Face + 3 mm; (b) face + 12.5 mm; (c) face + 22 mm.
Metals 13 00025 g009
Figure 10. Weld residual stress σx of constrained specimen using cutting, neutron diffraction, and contour methods. (a) Weld metal; (b) fusion line + 1 mm.
Metals 13 00025 g010
Figure 11. Weld residual stress σx of unconstrained specimen using cutting, neutron diffraction, and contour methods. (a) Weld metal; (b) fusion line + 1 mm.
Metals 13 00025 g011
Figure 12. Angular distortion with constrained and unconstrained weld specimens. (a) Constrained weld specimen; (b) Unconstrained weld specimen.
Metals 13 00025 g012
Table 1. Chemical composition of E500 steel (wt.%).
MaterialCSiMnPS
E500≥0.08≥0.2≥1.6≥0.01≥0.005
Table 2. Mechanical properties of E500 steel.
MaterialYield Stress
(MPa)
Tensile Stress
(MPa)
Elongation
(%)
Charpy Impact Test,
−40 °C, (J)
E50052964619249 J
Table 3. Chemical composition of welding consumable (AWS A5.29 E91T1) (wt.%).
Welding
Consumable
CSiMnPS
AWS A5.29 E91T10.060.291.230.0070.008
Table 4. Mechanical properties of the welding consumable (AWS A5.29 E91T1).
Welding
Consumable
Yield Stress
(MPa)
Tensile Stress
(MPa)
Elongation
(%)
AWS A5.29 E91T158065020
Table 5. Welding conditions used.
ProcessPass
No.
Current
(A)
Voltage
(V)
Speed
(cm/min)
Heat Input
(KJ/cm)
FCAW *11270303215
* Welding position: 1G, * Wire diameter: Φ 1.2, * Shielding gas: 100% CO2.
Table 6. Wire electric discharge machining conditions.
Wire Electric Discharge Machining Conditions
Wire componentWire dimension
Brass (Cu 65% + Zn 35%)0.25 mm
Disclaimer/Publisher’s Note: The statements, opinions and data contained in all publications are solely those of the individual author(s) and contributor(s) and not of MDPI and/or the editor(s). MDPI and/or the editor(s) disclaim responsibility for any injury to people or property resulting from any ideas, methods, instructions or products referred to in the content.