Article

A Survey on the Oxidation Behavior of a Nickel-Based Alloy Used in Natural Gas Engine Exhaust Valve Seats

by
José Henrique Alano
1,*,
Renato Luiz Siqueira
2,
Claudio Beserra Martins Júnior
3,
Rodrigo Silva
3,
Guilherme dos Santos Vacchi
3 and
Carlos Alberto Della Rovere
3,*
1
Engineering School, Federal University of Rio Grande, Avenida Itália, Rio Grande 96203-900, Brazil
2
Latin American Institute of Technology, Infrastructure and Territory, Federal University of Latin American Integration, Avenida Tancredo Neves 6731, Foz do Iguaçu 85867-970, Brazil
3
Munir Rachid Corrosion Laboratory, Department of Materials Engineering, Federal University of São Carlos, Rodovia Washington Luís, São Carlos 13565-905, Brazil
*
Authors to whom correspondence should be addressed.
Metals 2023, 13(1), 49; https://doi.org/10.3390/met13010049
Submission received: 28 October 2022 / Revised: 14 December 2022 / Accepted: 17 December 2022 / Published: 24 December 2022
(This article belongs to the Special Issue Composition Design and Damage Mechanism of Crystal Superalloys)

Abstract

:
This study reports the oxidation behavior of a Ni-based alloy used in the manufacture of valve seats for automotive engine exhaust systems. Isothermal thermogravimetric analyses were carried out at temperatures of 660, 740, 860, and 900 °C under an oxygen atmosphere for up to 1 h. At 660 and 740 °C, only one stage was observed during the whole time studied. At this stage, the oxide layer was formed mainly by NiO + Cr2O3, following a linear oxidation law with a rate constant (Kl) on the order of magnitude of 10−6 kg/m2s and an apparent activation energy (Ea) of ~47 kJ/mol. At 860 and 900 °C, an identical first stage was observed with a transition to a different stage. In the second stage, the oxidation layer was composed of Cr2O3, and a parabolic oxidation law was followed with a rate constant (Kp) on the order of 10−8 kg2/m4s and Ea of ~128 kJ/mol. Moreover, the Ni-based alloy formed a dense and compact oxide layer after oxidation, with no apparent cavities, pores, or microcracks. Characterization techniques such as Scanning Electron Microscopy (SEM), Energy-Dispersive X-ray Spectroscopy (EDS), Fourier Transform Infrared Spectroscopy (FTIR), and Raman Spectroscopy were carried out to characterize the formed oxide layer.

1. Introduction

Nowadays, there is a growing concern over the replacement of environmentally harmful fuels that emit high levels of pollutants. For this reason, manufacturers are developing engines powered by cleaner and more efficient fuels that operate at higher temperatures, such as vehicular natural gas (VNG). This fuel burns almost entirely and emits lower levels of greenhouse gases and particulate matter than gasoline and diesel. However, the burning of VNG requires materials resistant to the service conditions inside the combustion chamber. Consequently, there is an increasing demand for the development of exhaust system components with superior mechanical and oxidation resistance at high temperatures. One of the materials used in natural gas engine exhaust valve seats are nickel-based (Ni) alloys [1,2,3].
Ni-based alloys are widely used in applications requiring high mechanical strength, phase stability, and oxidation resistance at high temperatures, especially those with precipitation hardening [4]. Constant studies have been conducted to improve the oxidation behavior and, hence, expand the application field of these alloys. One route is the addition of some elements to the Ni-based alloys, such as Cr and Al. These elements can promote the formation of NiCr2O4, Cr2O3, and Al2O3 protective layers [5,6,7,8,9,10]. The Ni-based alloy used in the manufacture of natural gas engine exhaust valve seats has a high concentration of Cr, Fe, W, Co, and Mo to yield the properties required for this application [11,12].
Valves are used to control the flow of gas into and out of cylinders in internal combustion engines, i.e., they control the intake and exhaust processes of the automotive engine. In this type of engine, the valve-seat is the surface against which an intake or an exhaust valve rests during the engine operating cycle. Incorrect positioning or any imperfections formed during the manufacture can cause valve leakage, thus impairing the compression ratio of the engine and consequently its efficiency, performance, and service life [13,14,15].
This is one of the problems that highlights the importance of understanding the high temperature oxidation behavior, as the formation of oxides over the surface modifies the dimensions of the component during operation. Furthermore, valve seats are usually applied under an aggressive temperature condition, involving water vapor and other gases from the combustion process. Continued operation under these conditions may cause oxidation and wear of the material, leading to component failure [3,16,17,18]. The constant pursuit for lighter, more efficient, and more powerful engines tends to make the valve seats’ operating environment even more severe.
The alloy studied in this survey exhibits proven mechanical resistance at high temperatures and is already applied in natural gas engine exhaust valve seats. However, there is a lack of studies in the literature on its oxidation behavior. Thus, this study aims to understand the oxidation behavior under an O2 atmosphere at different temperatures (660–900 °C) of a Ni-based alloy with high Cr, Fe, W, Co, and Mo contents. For this, thermogravimetric analyses were performed, and the oxide layer that formed was characterized using SEM/EDS, FTIR, and Raman spectroscopy.

2. Materials and Methods

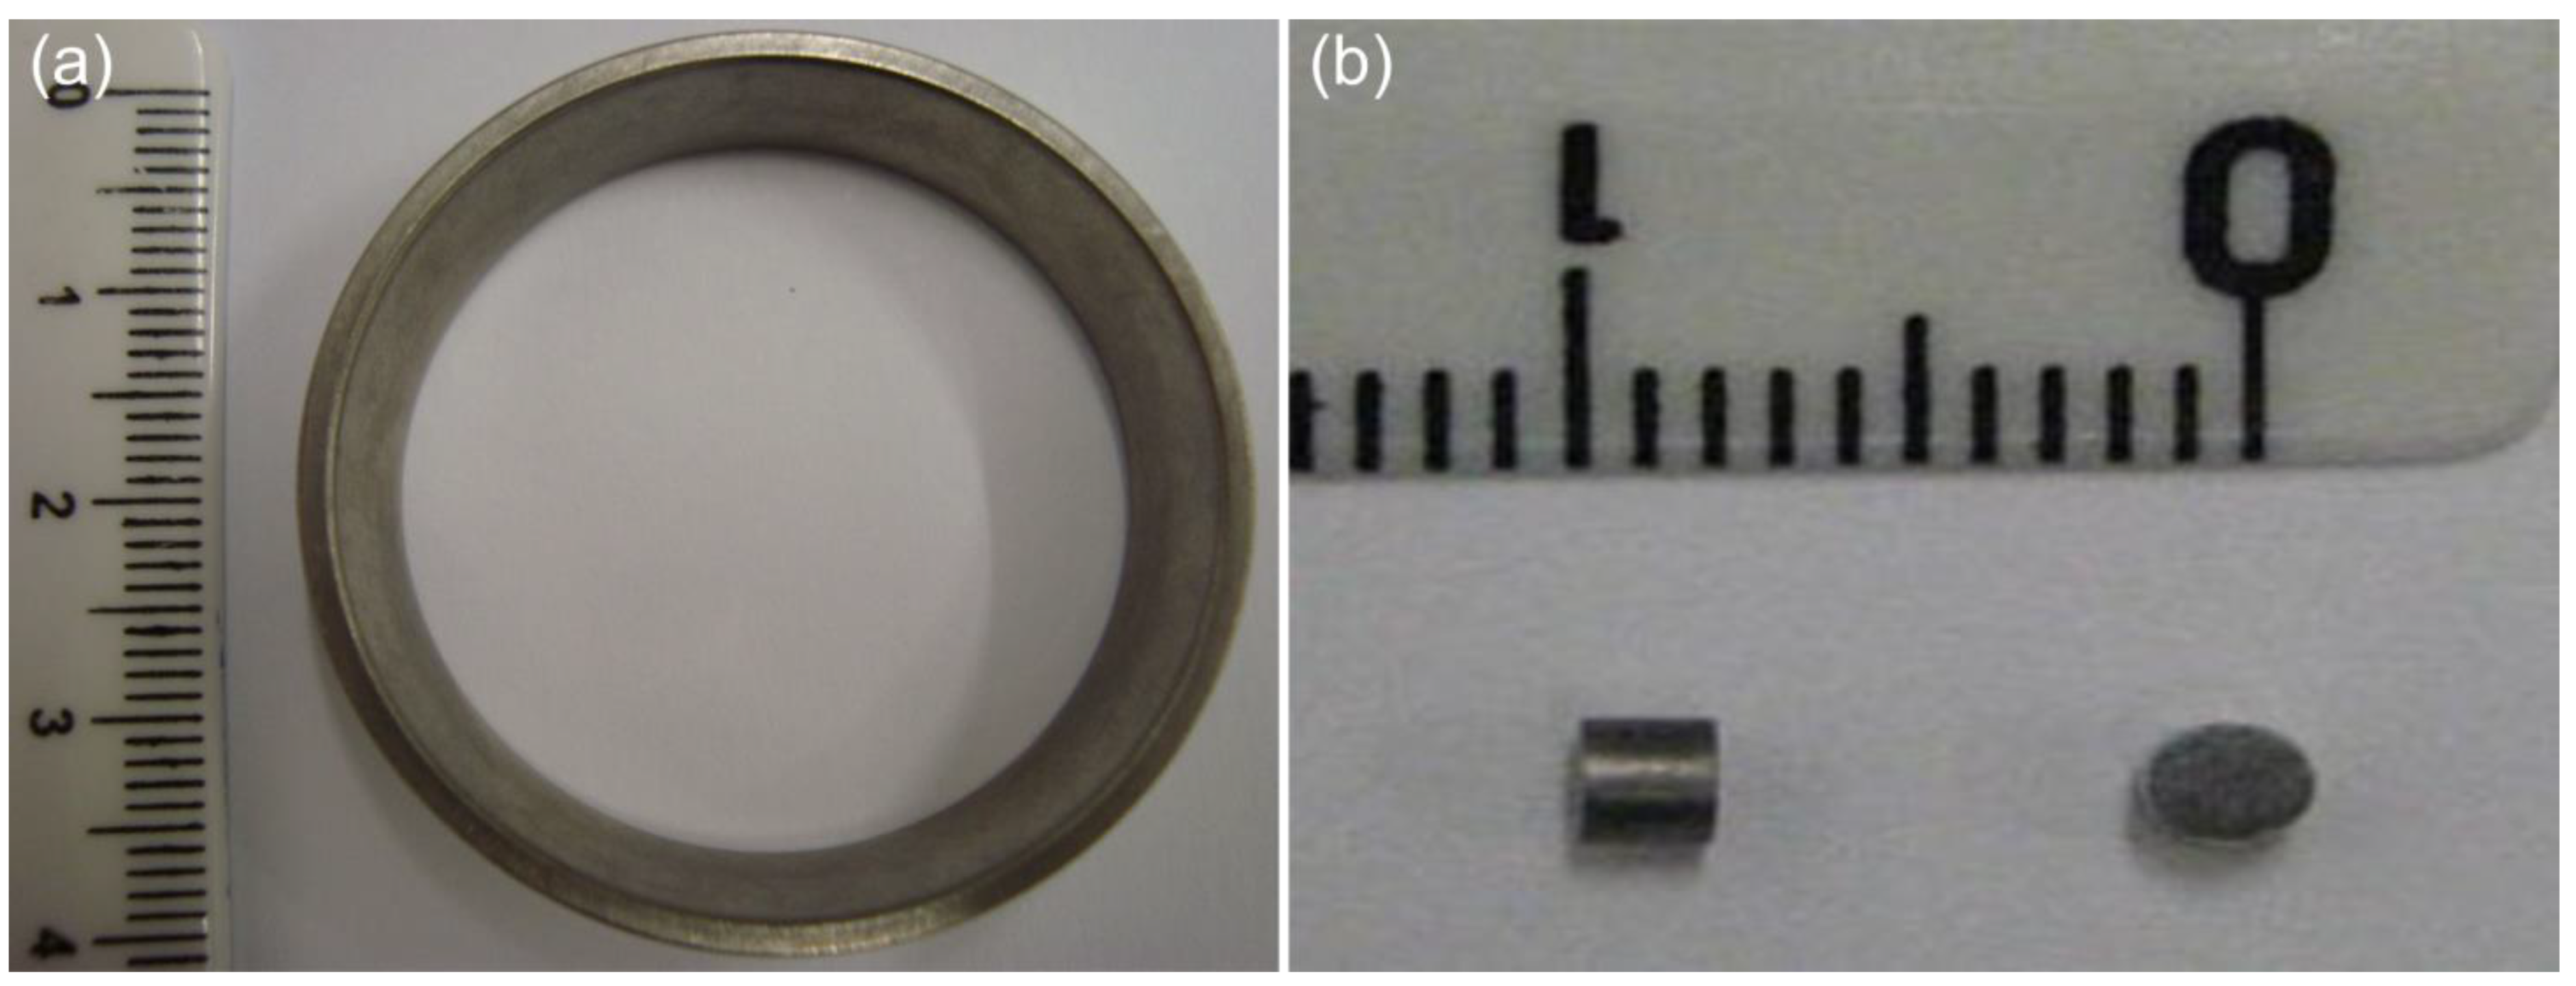
2.1. Samples Preparation

The material used in this study was exhaust valve seats manufactured from a Ni-based alloy supplied by a metallurgical company located in the interior of the state of Rio Grande do Sul, Brazil (Figure 1a). The nominal chemical composition range, provided by the supplier, in wt.%, is Ni (bal.), 24–28Cr, 10–11Fe, 8–10.5W, 8–10.5Co, 8–10.5Mo, 1.2–1.5C, and 0.7–1Si. For the thermogravimetric analyses, the samples with dimensions of Ø 2.5 mm × 2 mm (Figure 1b) were cut by electric discharge machining to fit into the thermal analyzer chamber. Afterwards, the samples were sanded on both faces and on the circumference, using water sandpaper and following a sequence of 220, 400, 600, and 1200 granulations. Then the samples were cleaned using an ultrasonic bath in acetone for 5 min to remove grease and surface residues. All samples were carefully measured in diameter and length and weighed on a precision analytical balance. From this data, it is possible to calculate their respective mean surface area as well as determine a mean value for alloy density prior to thermal analysis.

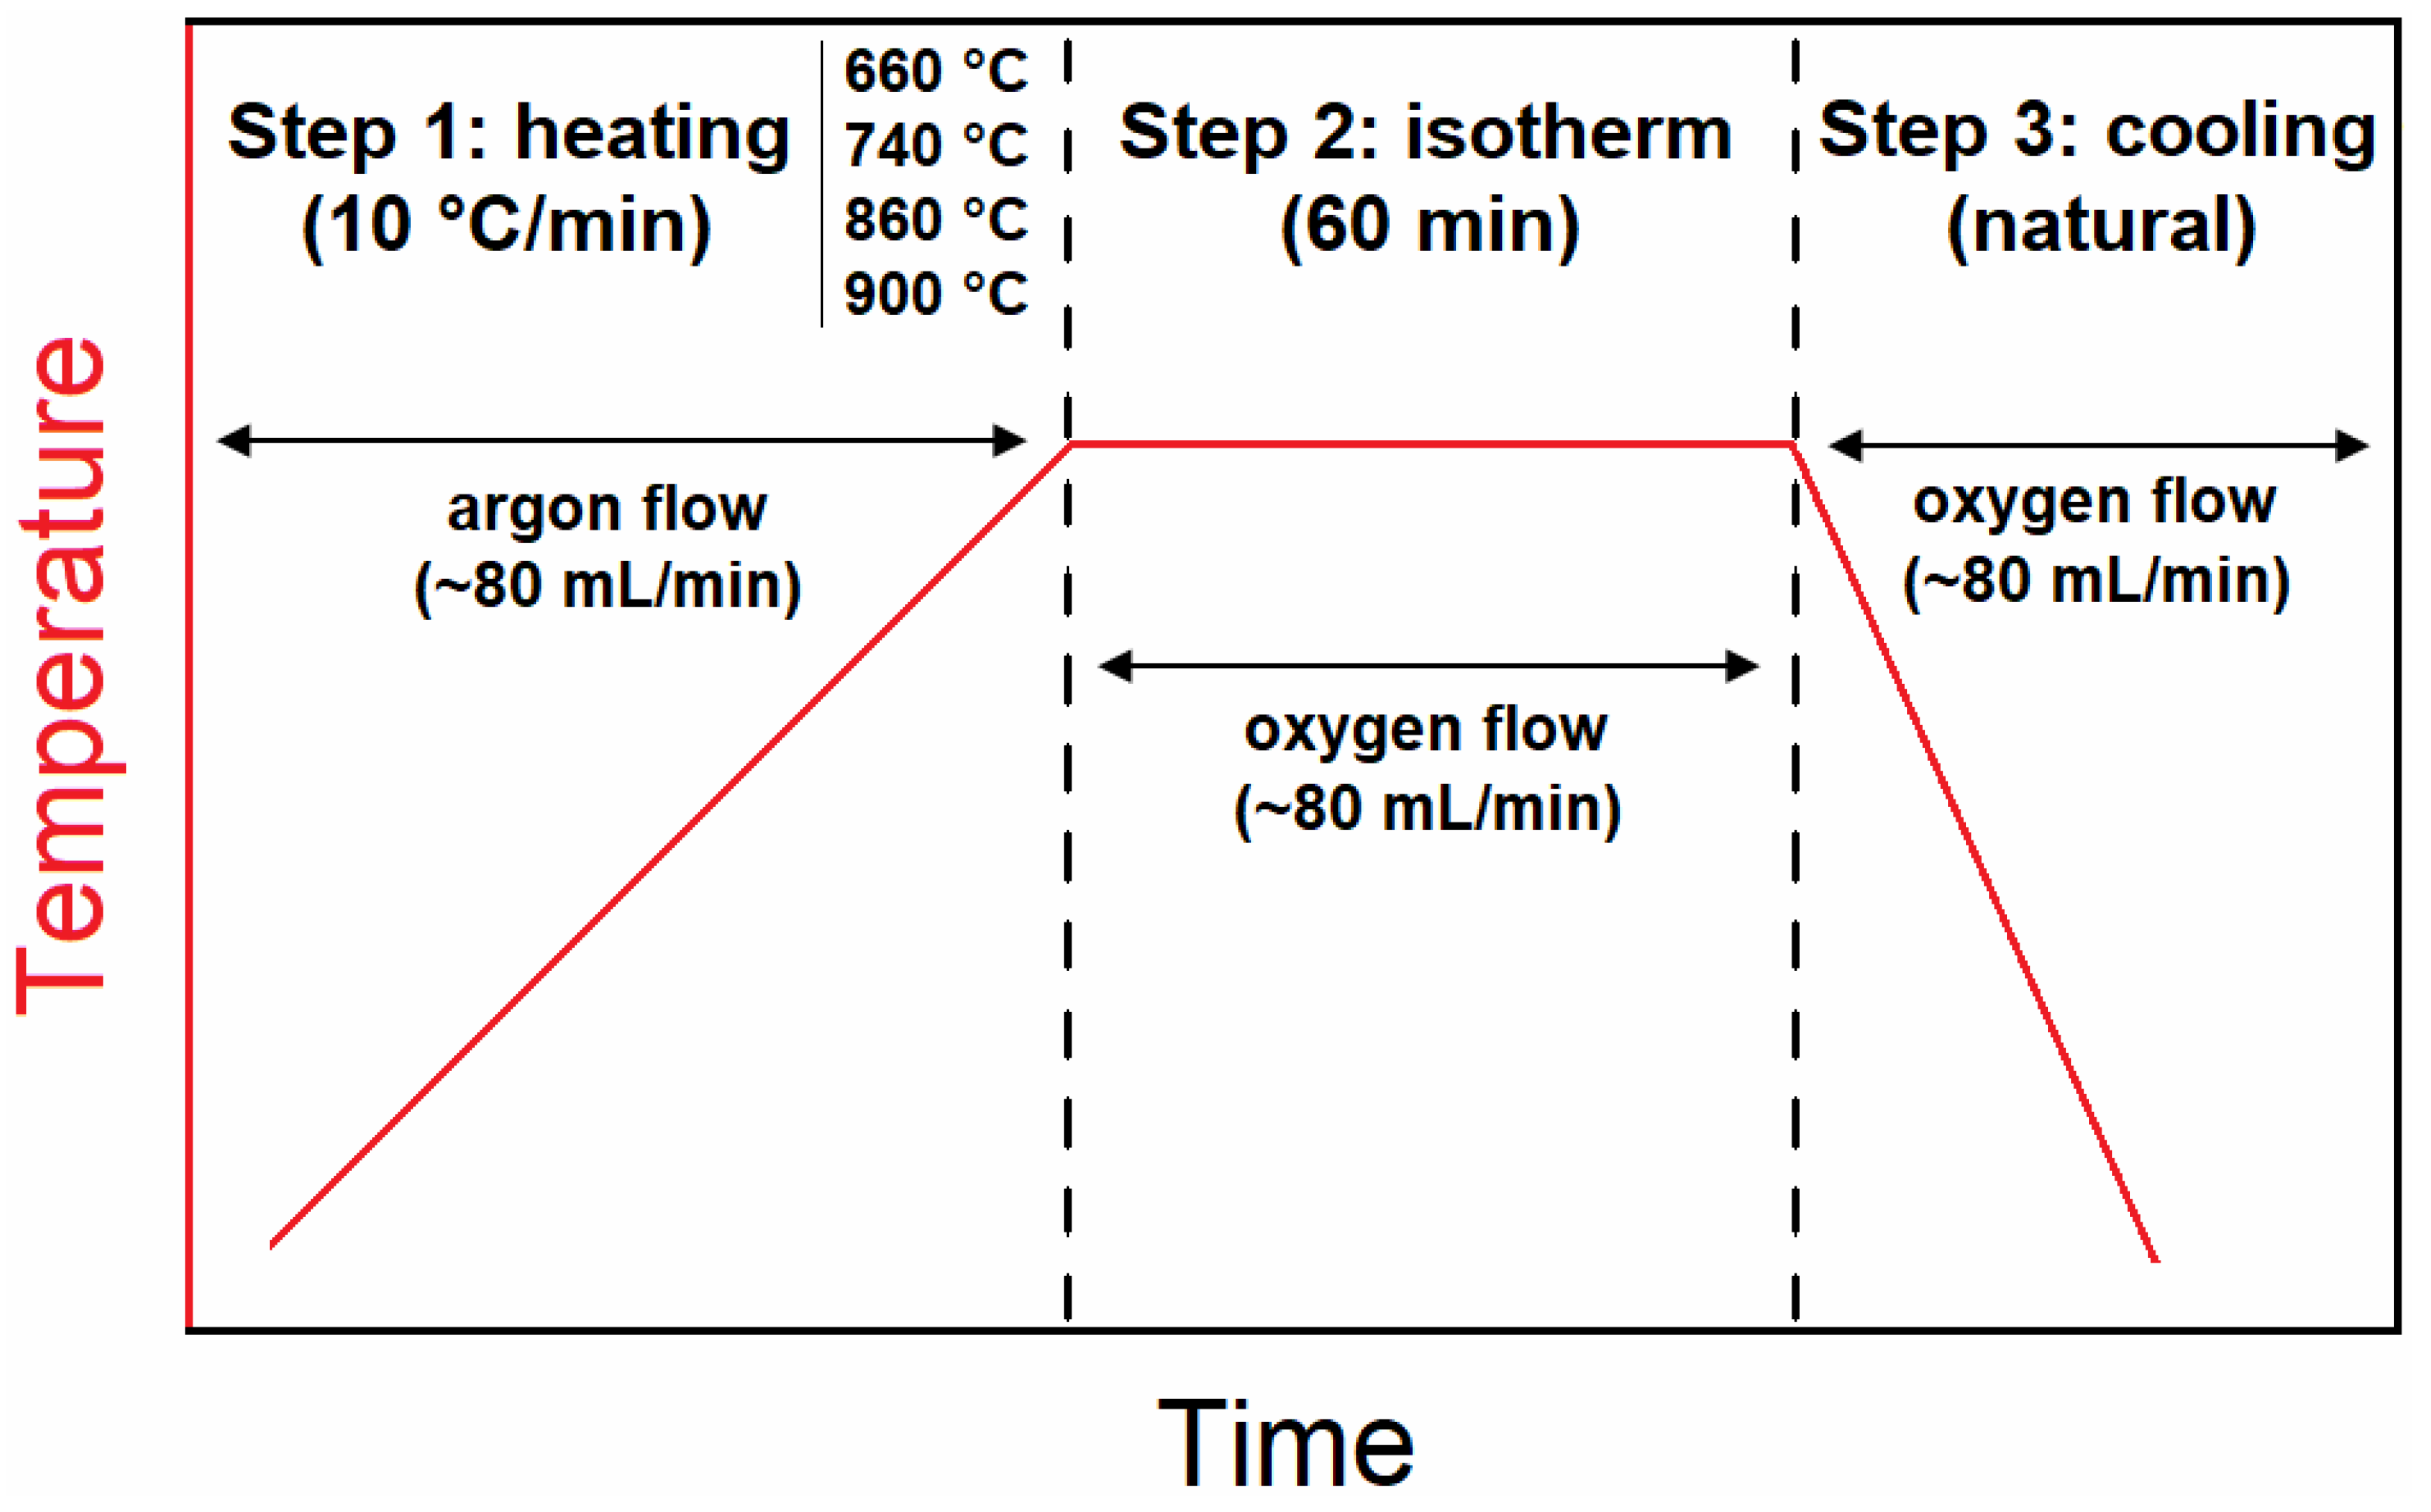
2.2. Isothermal Oxidation Tests

The thermogravimetric analysis (TG) was performed using a Netzch ST 409 instrument in three steps: (i) A sample was heated up to 950 °C with a heating rate of 10 °C/min under constant O2 flow (~80 mL/min) with non-isothermal heating. Subsequently, the mass variation data obtained were used to set the isothermal analysis parameters, with temperatures of 660, 740, 860, and 900 °C selected. (ii) The samples were heated under constant argon flow (~80 mL/min) until the set temperature was reached, aiming to reduce the initial oxidation. Upon reaching the set temperature, the argon flow was switched to the oxygen flow and maintained for 60 min during the isothermal. (iii) Cooling the samples until room temperature under constant oxygen flow (~80 mL/min). Three samples were used to assess the oxidation behavior at each temperature. Figure 2 illustrates the steps of the described process.
The rate law for oxidation kinetics is given by y = (w/A) = Ktn + C [19,20,21], where w/A is the mass gain per unit area at time t, K the rate constant, n the oxidation rate index, and C the integration constant. Thus, the data obtained from isothermal analysis were plotted as log y versus log t, determining n for each set temperature previously. The mass variation curves as a function of time were linearized to determine K, and the apparent activation energy (Ea) for the nickel-based alloy was determined from the slope of the plotted curve of ln K versus 1/T [19,22,23], since there is a dependence of the reaction rate with the temperature. The Arrhenius equation for temperature dependence can be described by K = K0 exp(−∆Ea/RT) [24,25], where K0 is the pre-exponential factor, R is the gas constant (8.314 J/mol K), and T is the absolute temperature (K).

2.3. Materials Characterization

The microstructure of the Ni-based alloy was characterized before and after the oxidation process at different temperatures using a Phillips FEG X-L30 scanning electron microscope (SEM) equipped with an energy dispersive X-ray spectroscopy (EDS) system. The SEM micrographs were inspected using the ImageJ software to estimate the relative volume fractions of each phase. The oxide layers formed were analyzed by Fourier transform infrared (FTIR) spectroscopy using a PerkinElmer Spectrum GX spectrometer. Reflectance mode with a spectral resolution of 4 cm−1 from 4000 to 400 cm−1 was carried out. An amount of 30 scans was acquired and the mean of them was plotted as adsorption. Supplementary FT-Raman spectroscopy measurements were also performed using a Bruker RFS 100/S spectrometer with an excitation source of a YAG:Nd laser (1064 nm).

3. Results and Discussion

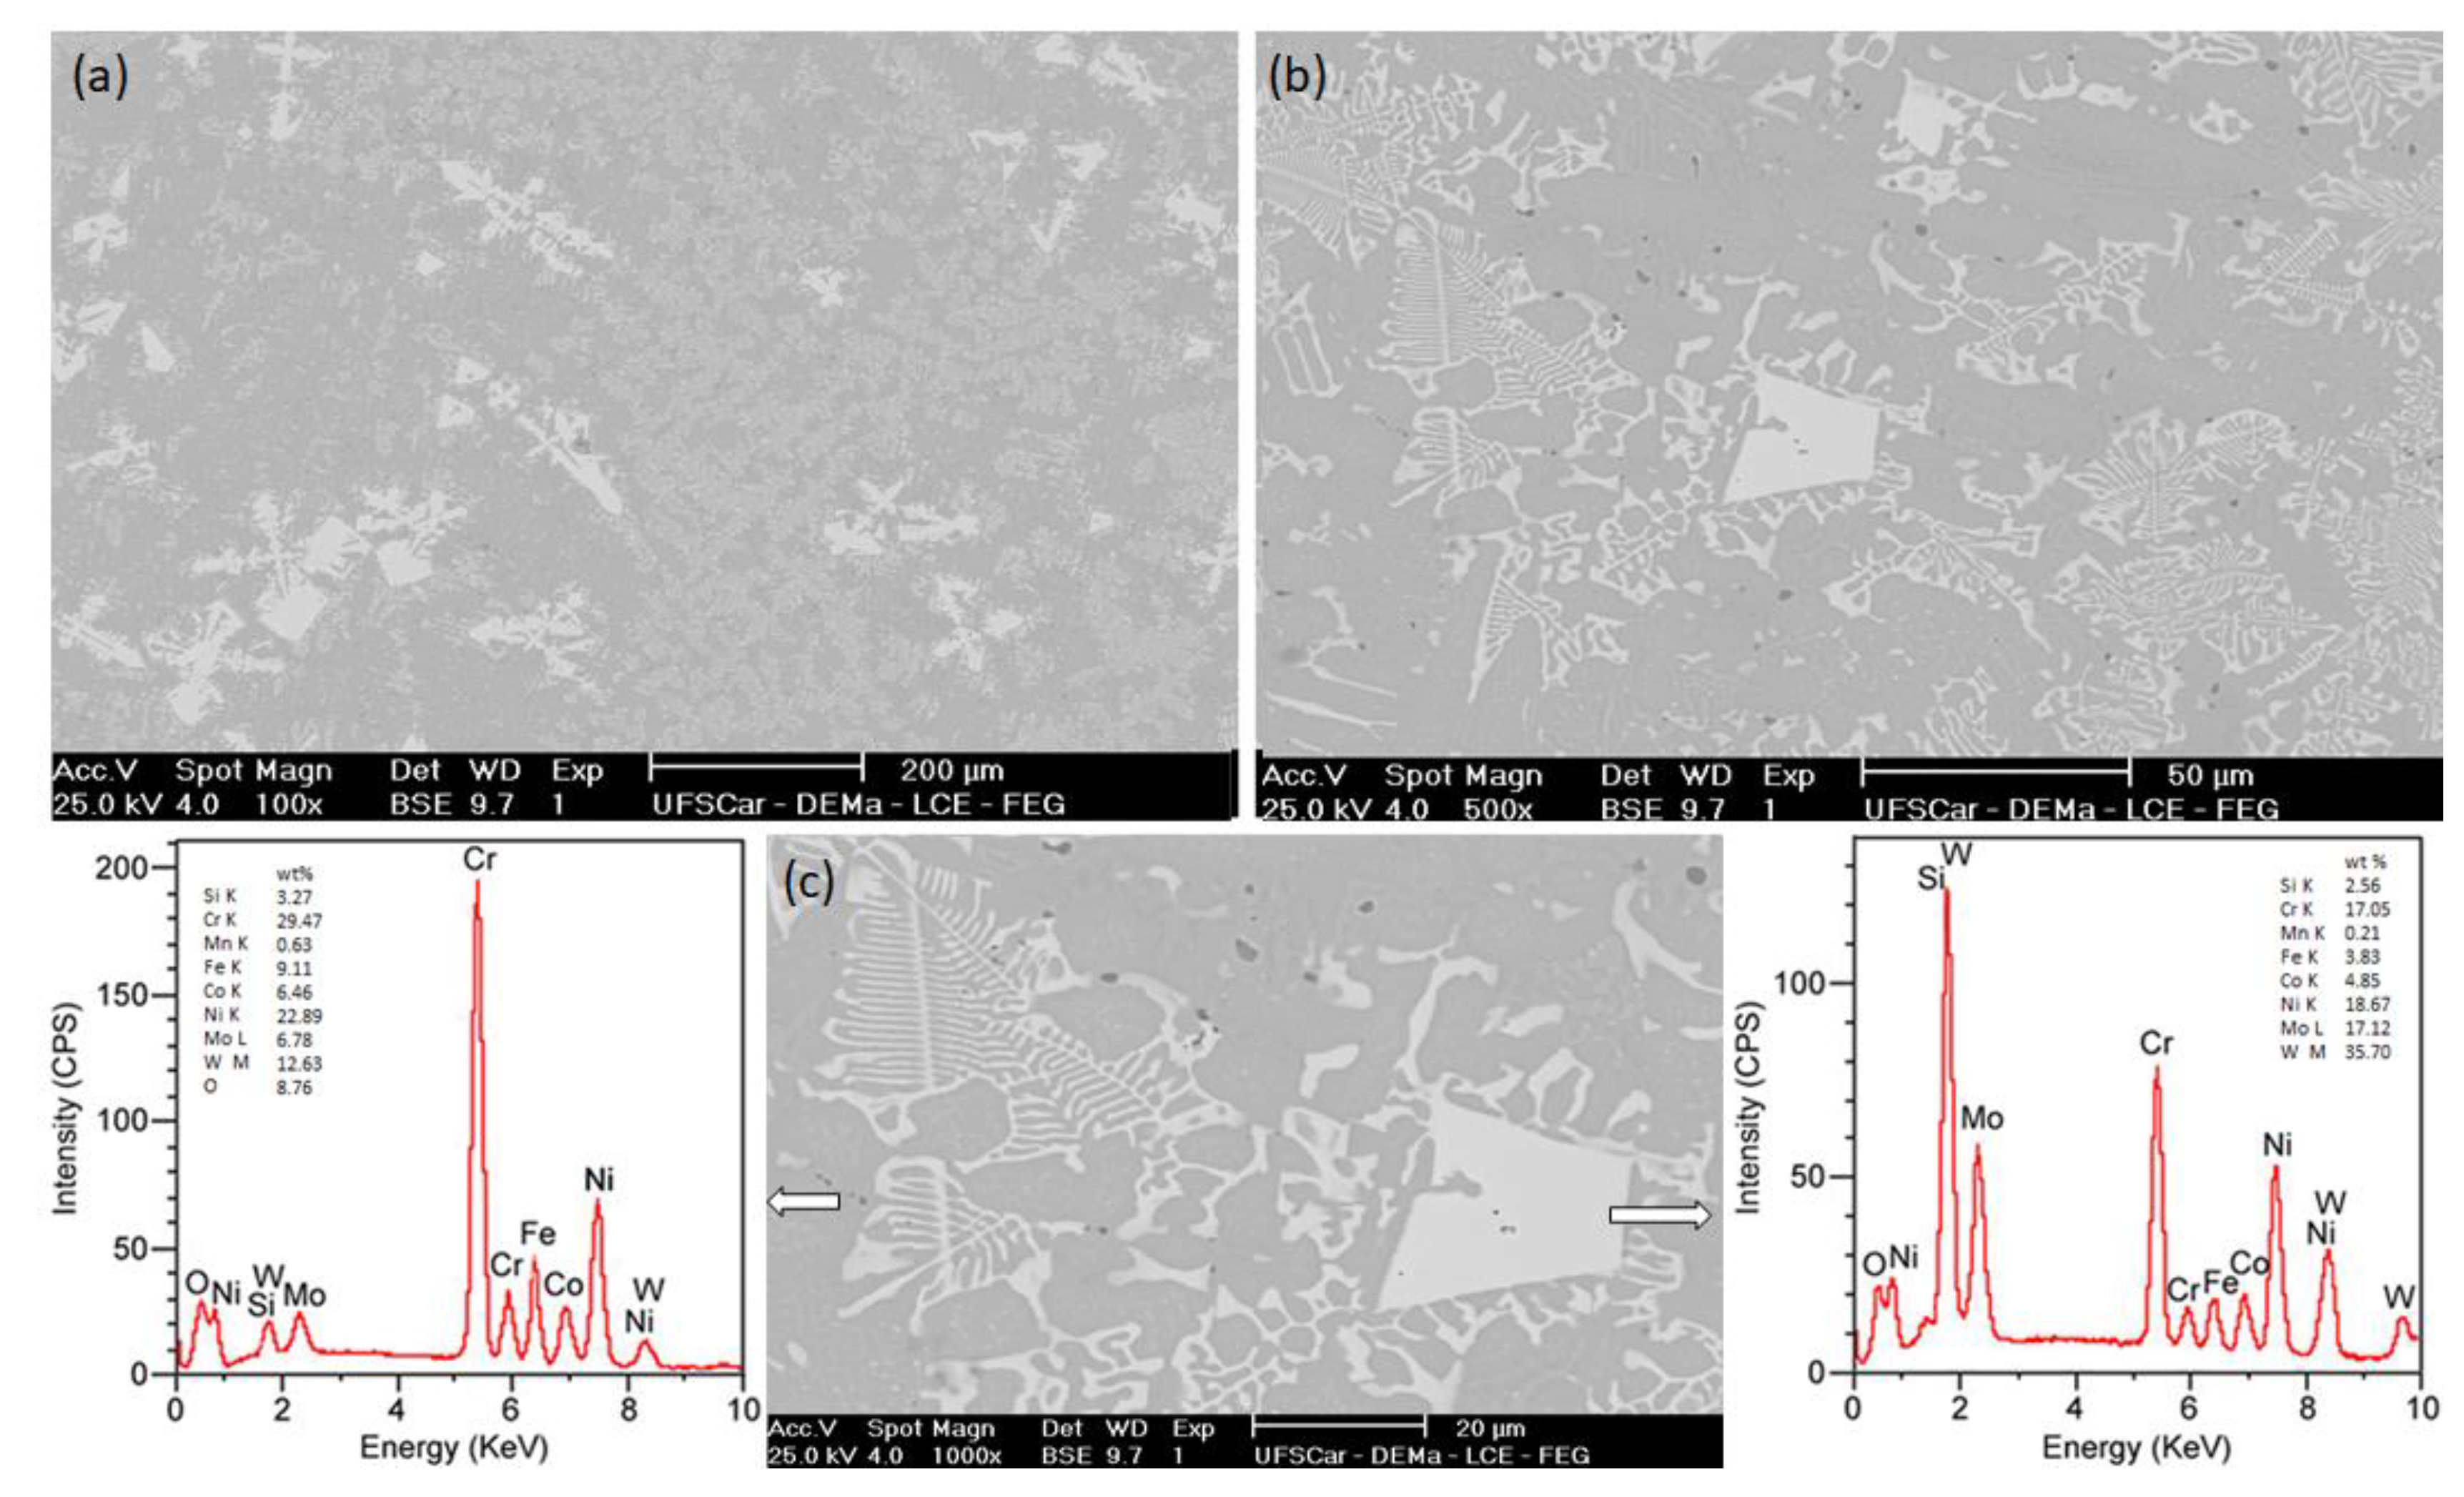
3.1. Nickel-Based Alloy Characterization

The Ni-based alloy micrographs showed two main phases (brighter and darker background) and some pores, as shown in Figure 3a,b. The EDS spectra results revealed the elements in each phase (Figure 3c). The brighter phase has as major elements W, Si, Cr, Ni, and Mo, and the darker phase has as major elements Cr, Ni, and Fe. Using the Olympus Pro 5 software, the carbide and austenite phase volume fractions were estimated to be 25% and 75%, respectively. Although the austenite phase has Cr, Fe, and Ni as major elements, others may be present in the matrix due to the formation of small carbide precipitates and/or in solid solution (Figure 3c).

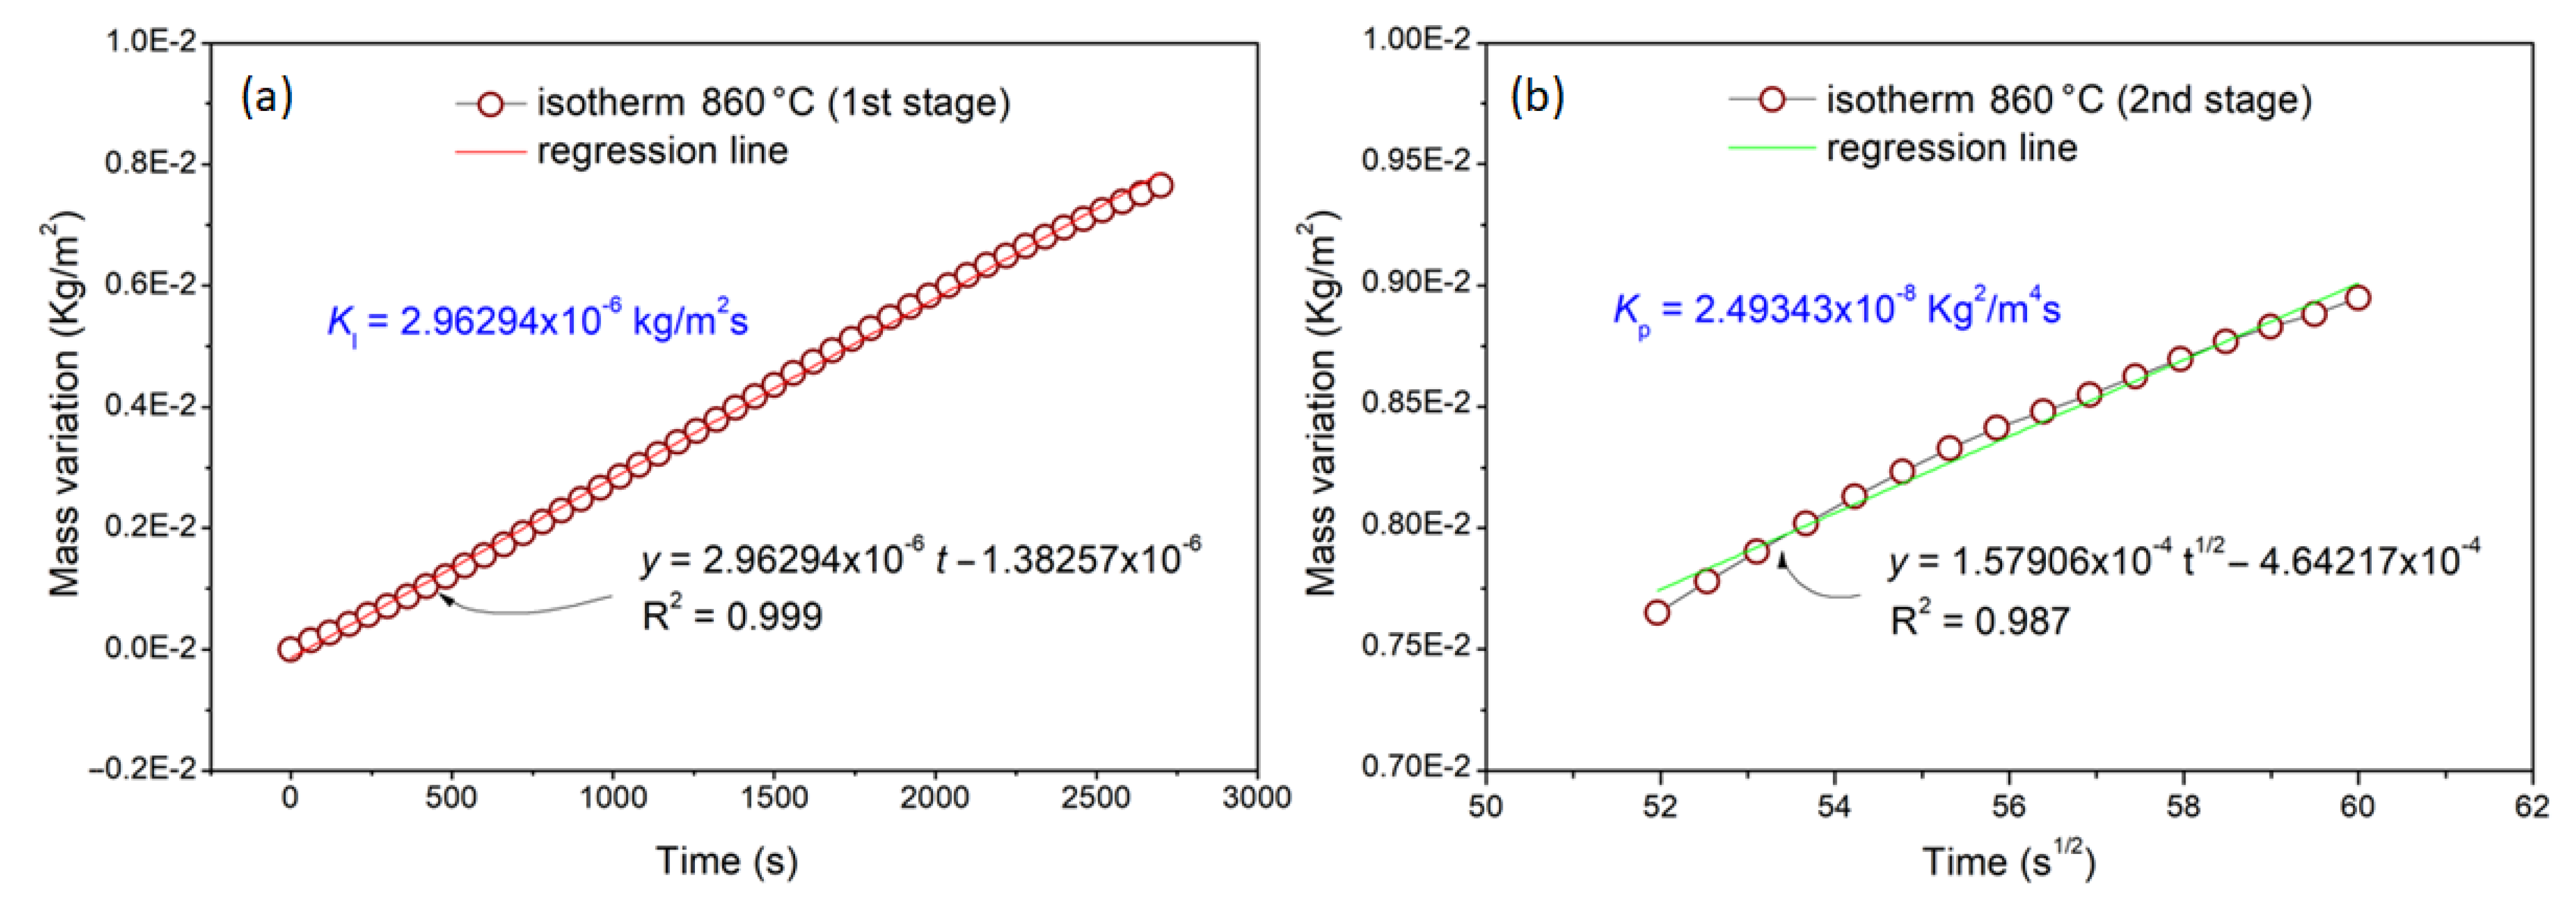
3.2. Thermogravimetric Analysis

The non-isothermal analysis carried out to set the isothermal oxidation temperatures is shown in Figure 4. The mass of the alloy has increased, exhibiting two different behaviors: (i) the curve shows a dy/dT slope that is practically constant between 500 and 740 °C; (ii) the curve undergoes a decrease in its slope due to the transition at 770 °C. Based on this observation, the temperatures of 660, 740, 860, and 900 °C were selected to perform the isothermal oxidation analysis with two temperatures from each region of the non-isothermal analysis.
The mass gain plot (per unit surface area) as a function of the exposure time is shown in Figure 5. The mass gain increased with increasing temperature, indicating that the oxidation rate also increased. The alloy shows the lowest mass gain at 660 °C, following a linear behavior until the completion of the analysis. Similar behavior was exhibited during exposure to 740 °C, but with the plot showing a higher dy/dt slope. The plot behavior changed at 860 °C, following a linear behavior until ~2400 s and subsequently undergoing a slight deviation. This deviation behavior was maintained at 900 °C but started earlier (after ~1200 s in this latter isotherm) and in a more pronounced way.
The plots of mass gain as a function of time were linearized according to the oxidation rate index (n), which is determined from the log y versus log t plots. The oxidation rate index was assumed to be 1 for values found between 0.90 and 1.10. For values between 0.4 and 0.6, an index value equal to 0.5 was assumed. This approximation was taken to keep coherence between the units of the rate constants in the graph ln K versus 1/T. The graphs log y versus log t plotted for the alloy at 660 °C showed a value of n = 0.91 with a linear correlation coefficient R2 = 0.997 (Figure 6a). No significant change in the curve d(log y)/d(logt) was observed, indicating that the oxidation mechanism does not seem to change during the analysis. Assuming the value 1 for n, the mass gain curve as a function of time was linearized (Figure 6b). As a result, it was found to have a value of 1.29 × 10⁻⁶ kg/m2s for this oxidation rate constant (Kl).
Following a similar procedure (Figure S1), the sample at 740 °C showed the same value for n (0.91) and a Kl with the same order of magnitude (2.00 × 10⁻⁶ kg/m2s). Nonetheless, it is slightly higher when compared to a sample analyzed at 660 °C. Numerically, it expresses an increase in the reaction rate when the temperature is changed from 660 to 740 °C, however, without changing the oxidation mechanism.
The mass variation of the material at 660 and 740 °C was linear throughout the isothermal oxidation during the exposure time investigated. It indicates that the oxidation mechanism at these conditions is controlled mainly by the rate of oxygen reaction with the metallic substrate. This occurs when the oxide layer formed on the metallic surface allows direct access of oxygen to the metal-oxide interface because of porosities, microcracks, and cavities (i.e., when the formation of a continuous oxide layer does not take place on the metallic surface) or when the diffusion process occurs through a protective layer with a constant thickness [19,26,27,28]. In this case, the oxidation rate remains constant over time and is expressed as x = K1t + C, where x is the mass gain per unit area or oxide thickness.
The graph log y versus log t plotted for the material at 860 °C showed a behavior deviation after ~2400 s with the d(log y)/d(log t) undergoing a significant change, as shown in Figure 7. The n value changes from 1.08 to 0.51 and shows two oxidation stages with different kinetic behaviors. The first stage (linear) occurred until 2400 s, and the second stage (parabolic) started from this time, indicating that the reactions are controlled at the interface (linear) during the initial stage and by diffusion (parabolic) subsequently. Metals and alloys exposed to high temperatures tend to follow this parabolic oxidation kinetics, in which oxide thickening occurs by diffusion of ions through the layer via structural defects [29,30,31]. The reaction rate following the parabolic kinetics is inversely proportional to the mass or the oxide layer thickness formed [19] and it is expressed by x2 = 2Kpt + C.
The curves plotted to obtain the liner (Kl) and parabolic (Kp) constant rates from two-stage oxidation for the sample at 860 °C are shown in Figure 8. In the first stage of oxidation (Figure 8a), Kl = 2.96 × 10⁻⁶ kg/m2s was calculated. This value is slightly higher than previously found at 660 and 740 °C. Before determining the Kp value, the time scale of the second stage was set to 0.5 in order to linearize the curve, and a value of Kp = 2.49 × 10⁻⁸ kg2/m4s was found; see Figure 8b. The sample at 900 °C also exhibited two-oxidation stages behavior (Figure S2), however, with the second stage being more noticeable. In the first stage, the linear behavior (Kl = 5.22 × 10⁻⁶ kg/m2s) remained until 1200 s in the isotherm. Then, the oxidation kinetics changed from linear to parabolic behavior, with Kp = 3.96 × 10⁻⁸ kg2/m4s. All kinetic parameters calculated from the thermogravimetric analysis are summarized in Table 1.
The apparent activation energies for the linear and parabolic stages of oxidation were determined using the Arrhenius plot, as shown in Figure 9. Table 2 summarizes the data used to determine Ea values.
Ea was calculated to be 47 kJ/mol and 128 kJ/mol for the linear and parabolic oxidation stages, respectively. It is challenging to compare Ea values for two different oxidation mechanisms because of the different operating factors. However, this increase in Ea is expected when changing from the linear to the parabolic stage because in the linear stage the main controlling factor is the chemical reaction between the species involved, and in the parabolic stage, there is also the diffusion factor controlling the reaction rate and being another energy barrier. The comparison between Ea values in different studies is also difficult because there is a strong dependence between the studied system and the chemical composition [32,33]. Nevertheless, Calvarin et al. [33] reported a value ranging between 96 and 171 kJ/mol for the formation of Cr2O3, which is the main oxide formed in the studied alloy, as shown later. Another factor that may contribute to the lower Ea value in the first stage of oxidation is the presence of NiO, since Ishida et al. [32] found values ranging between 17 and 56 kJ/mol for the formation of this oxide. It is worth noting that for the parabolic stage, there may be a significant error associated with the value of Ea because only two points were used to obtain the slope. However, since the parabolic mechanism was reached at only two temperatures, this was the approach that we had to apply to estimate the Ea.

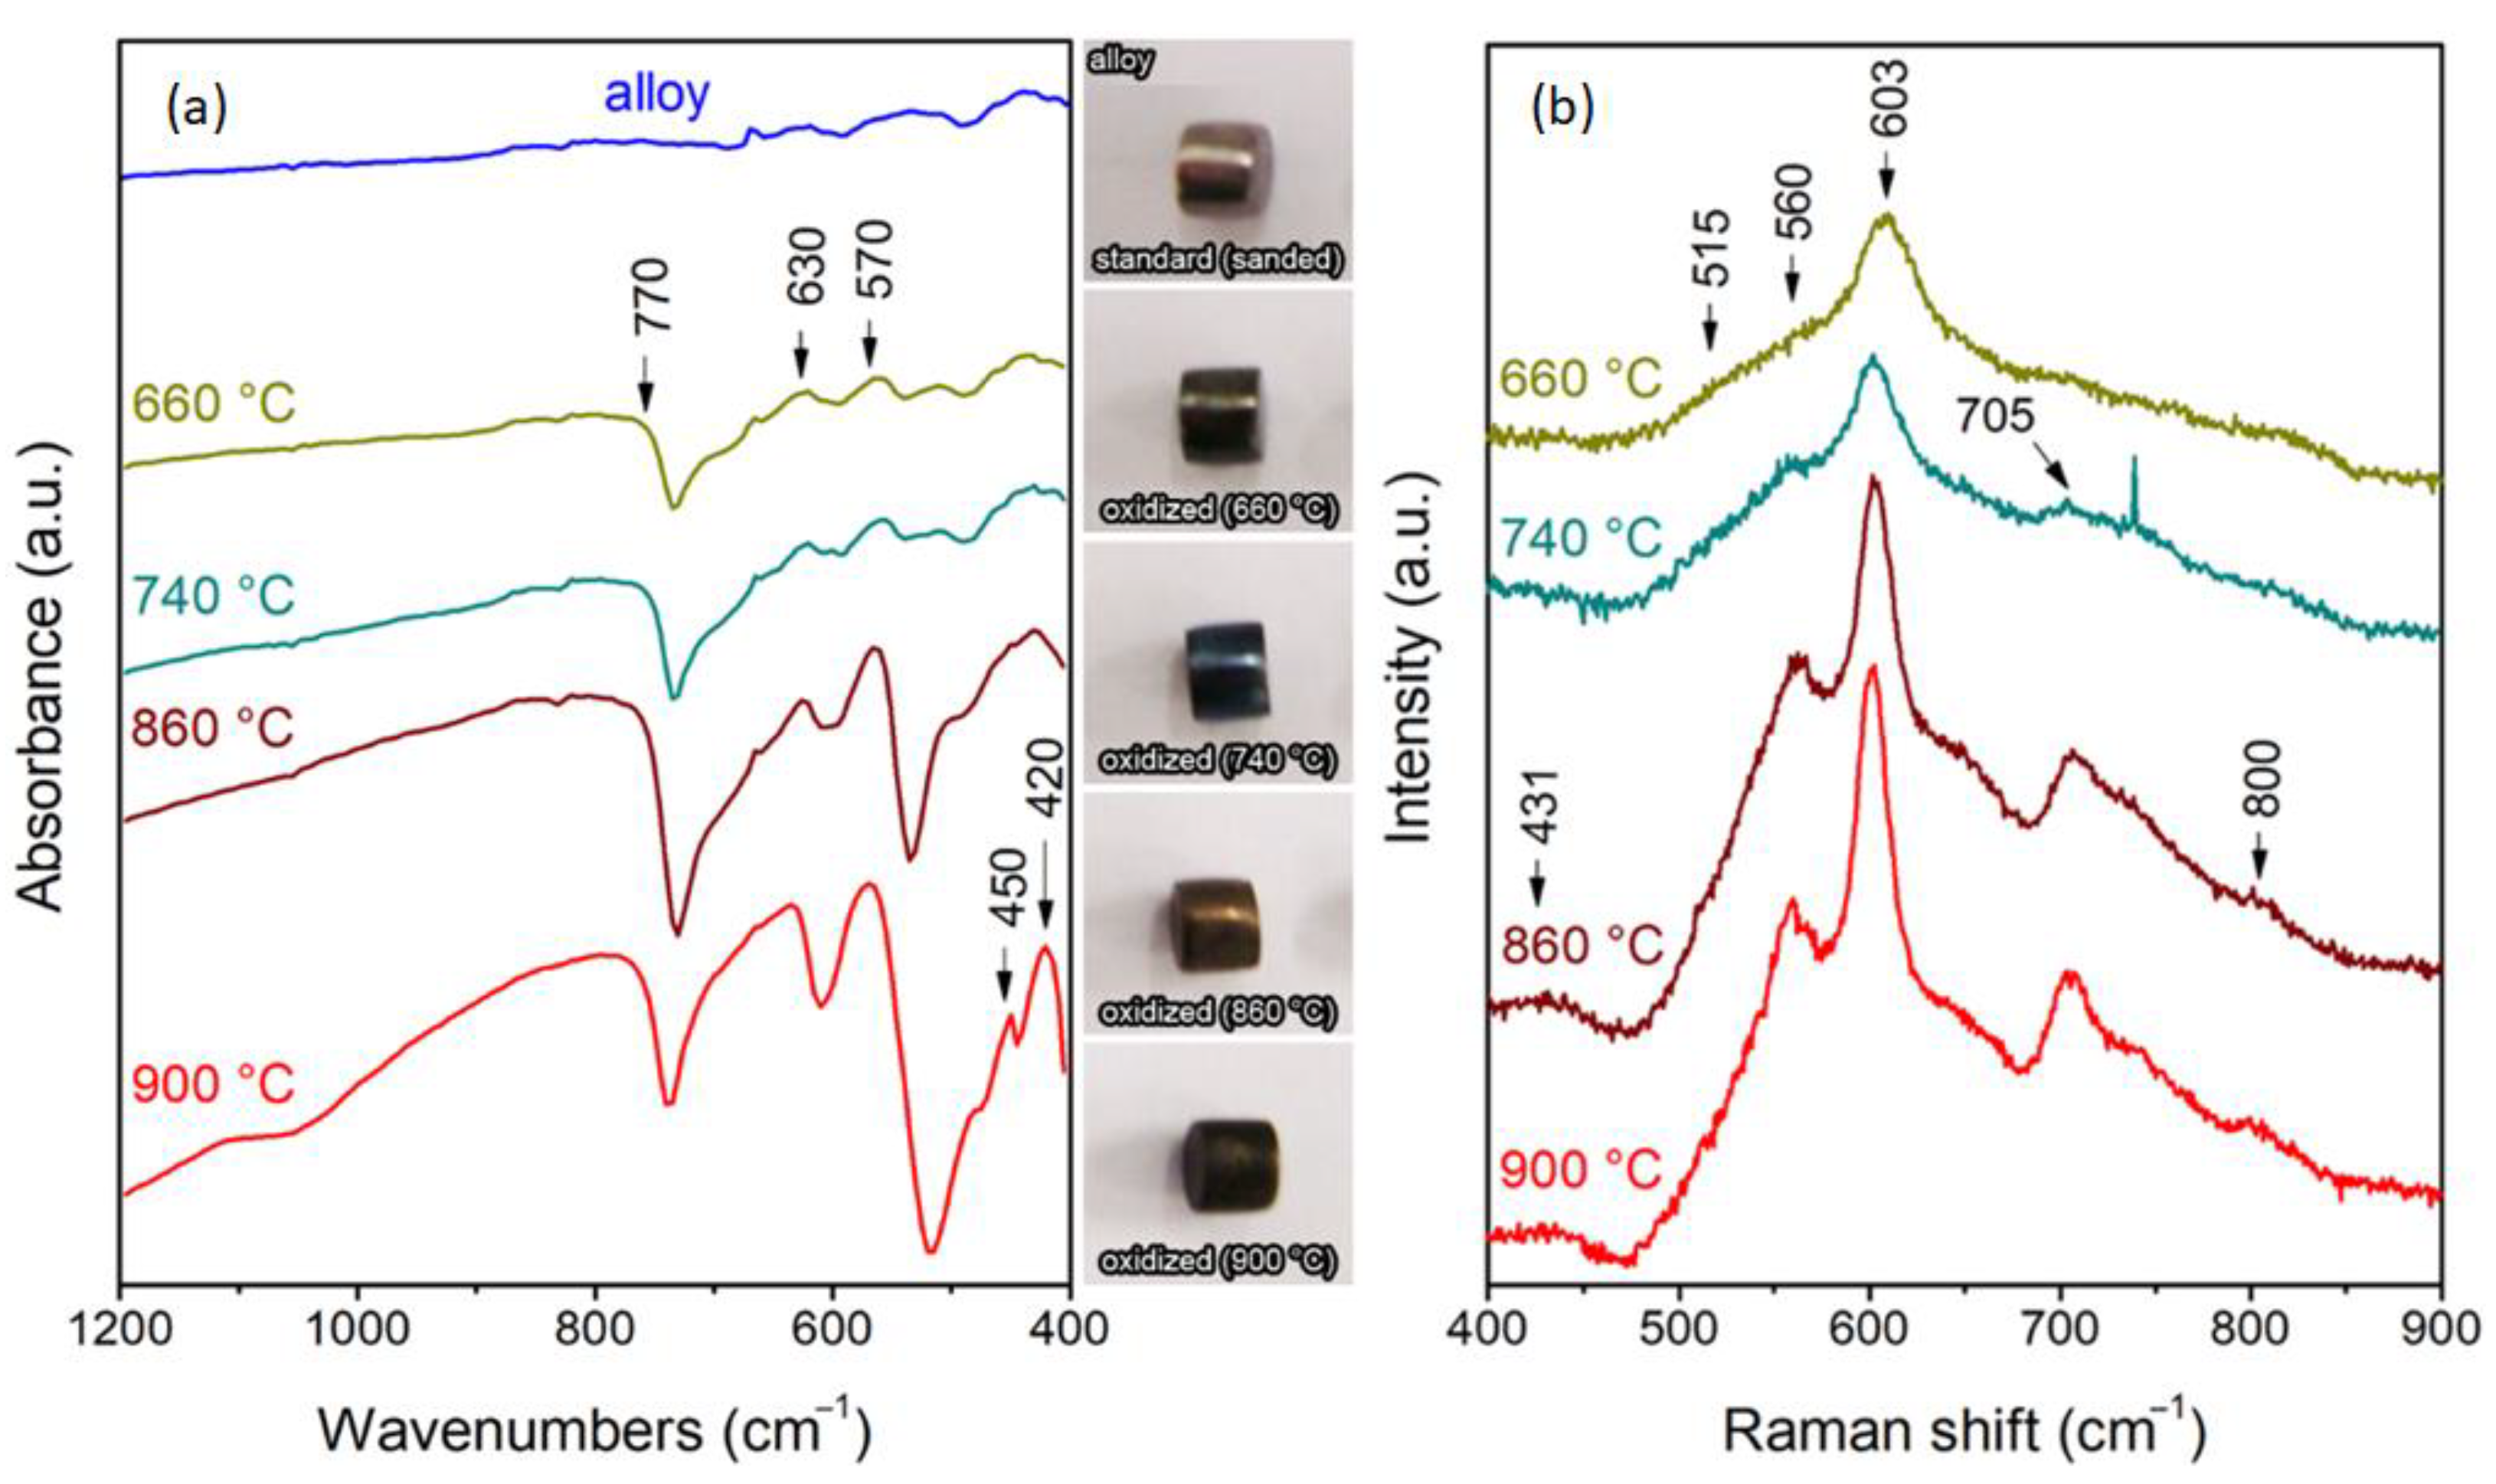
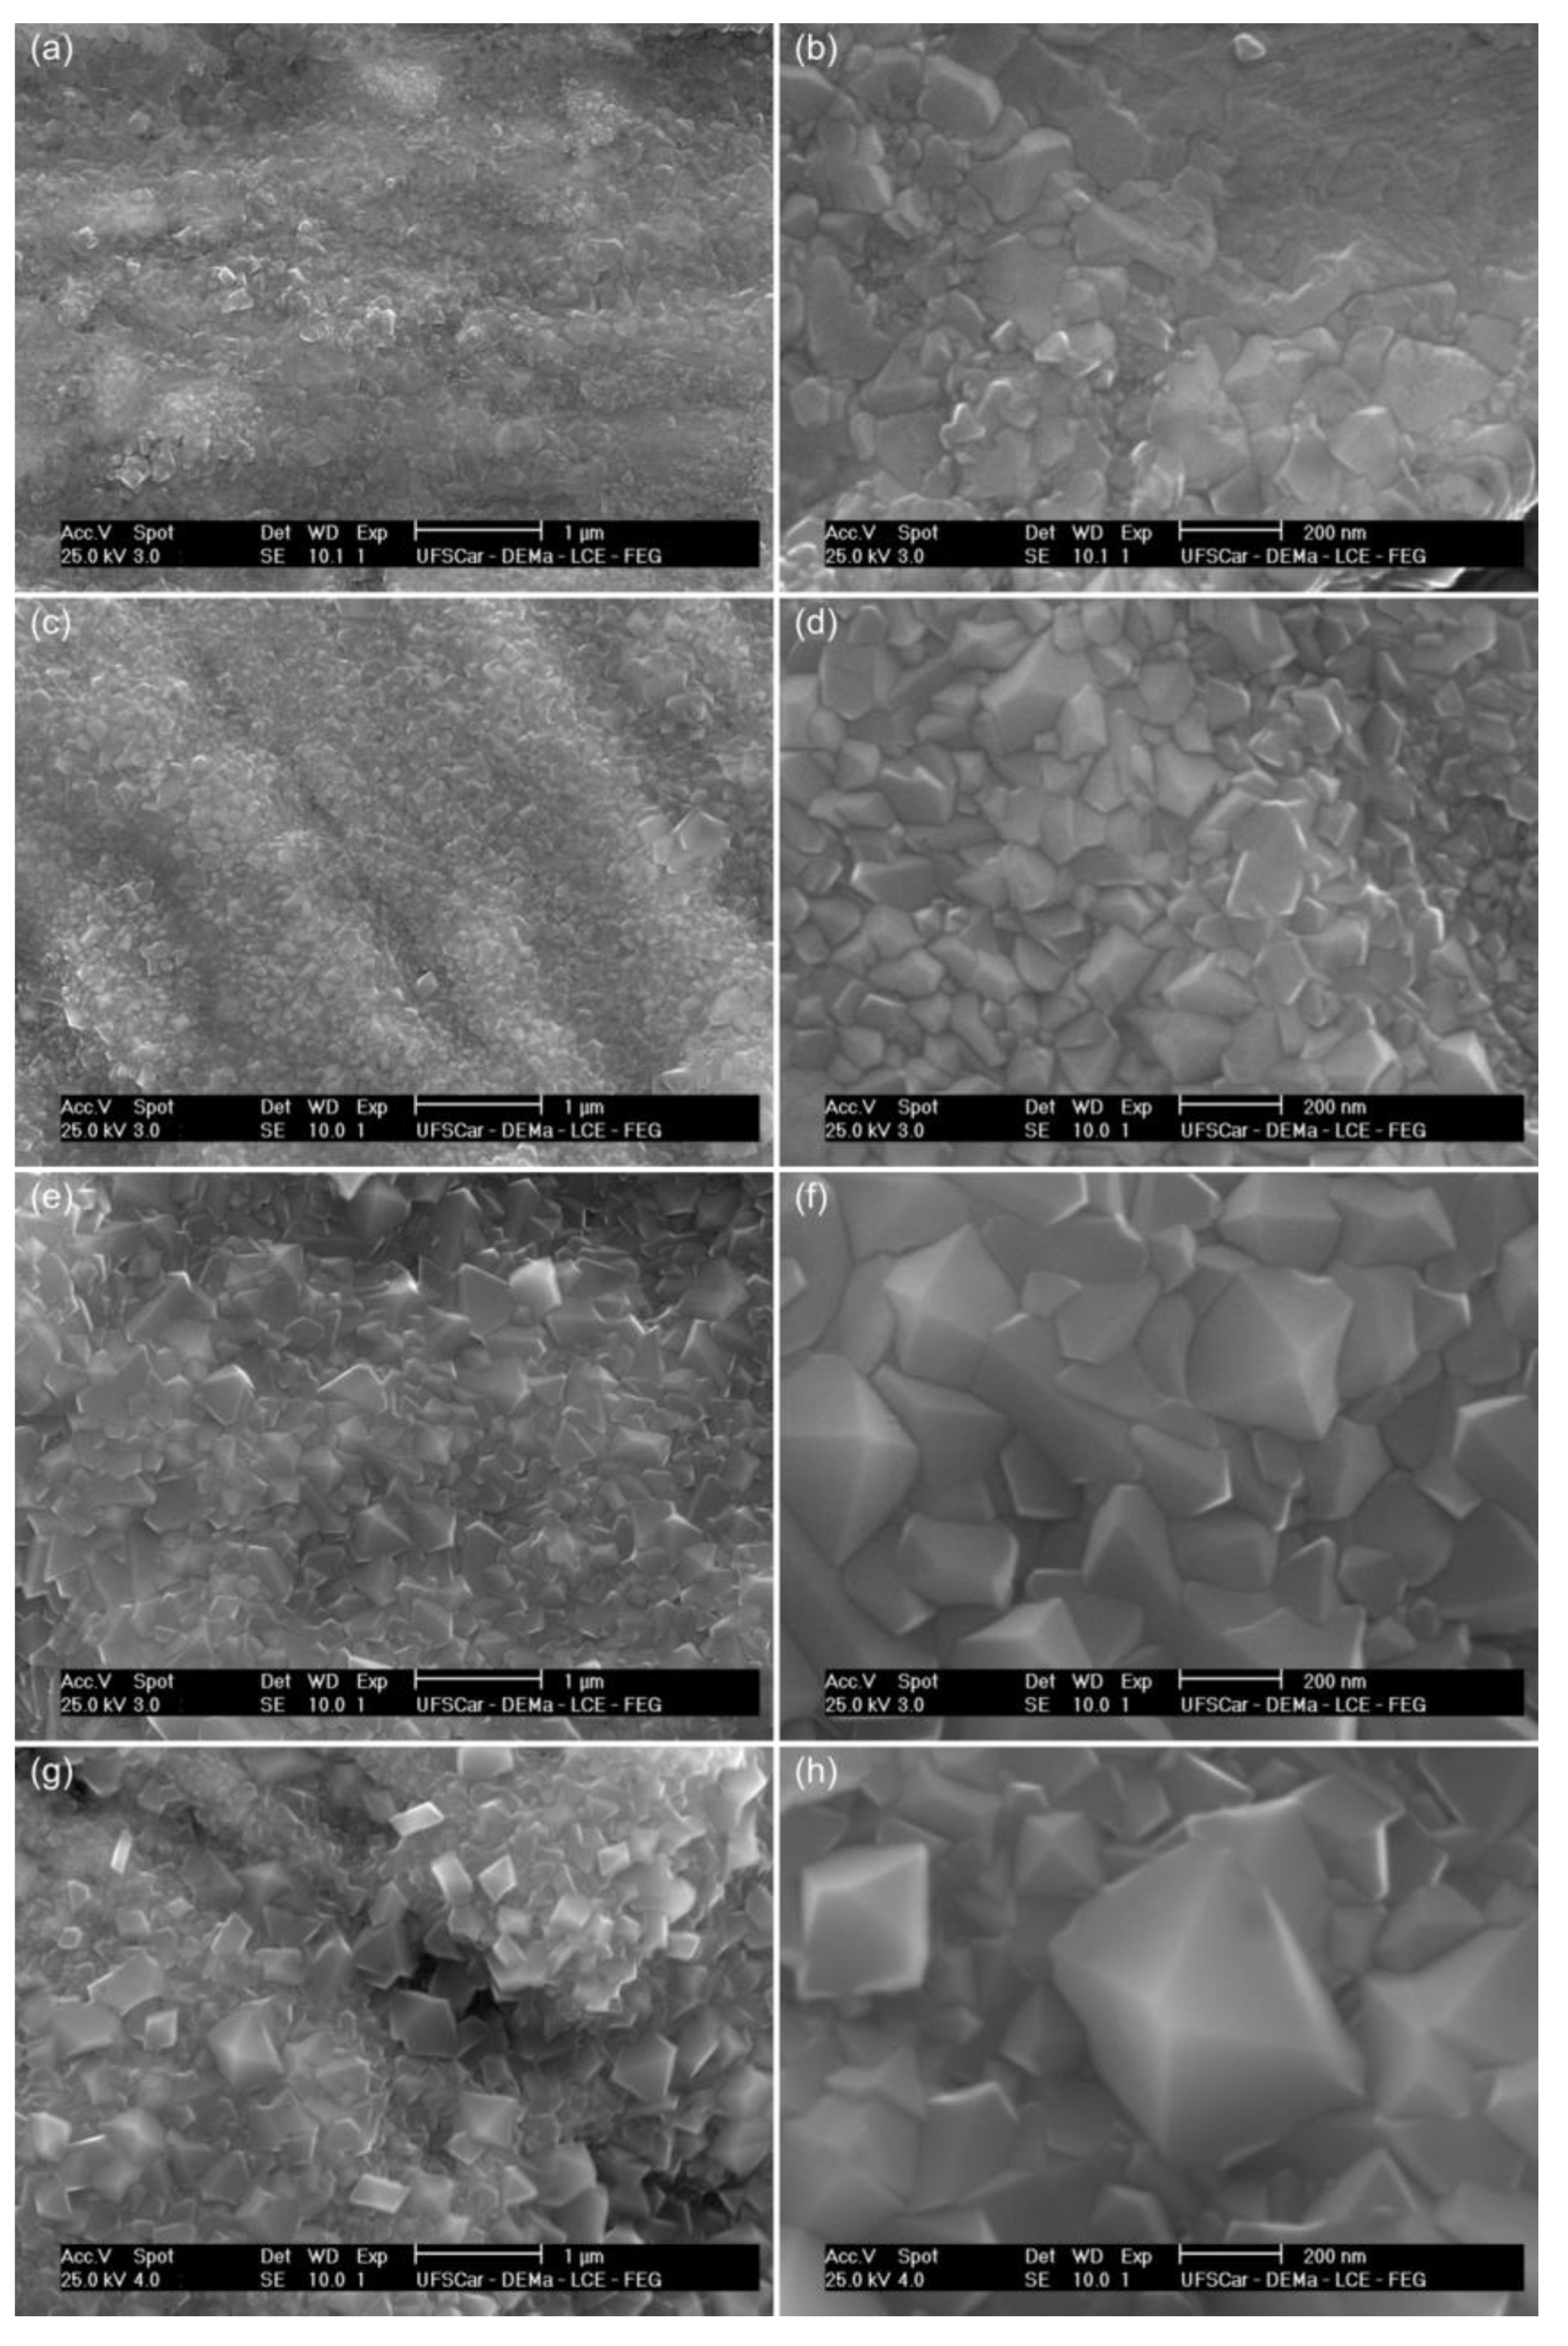
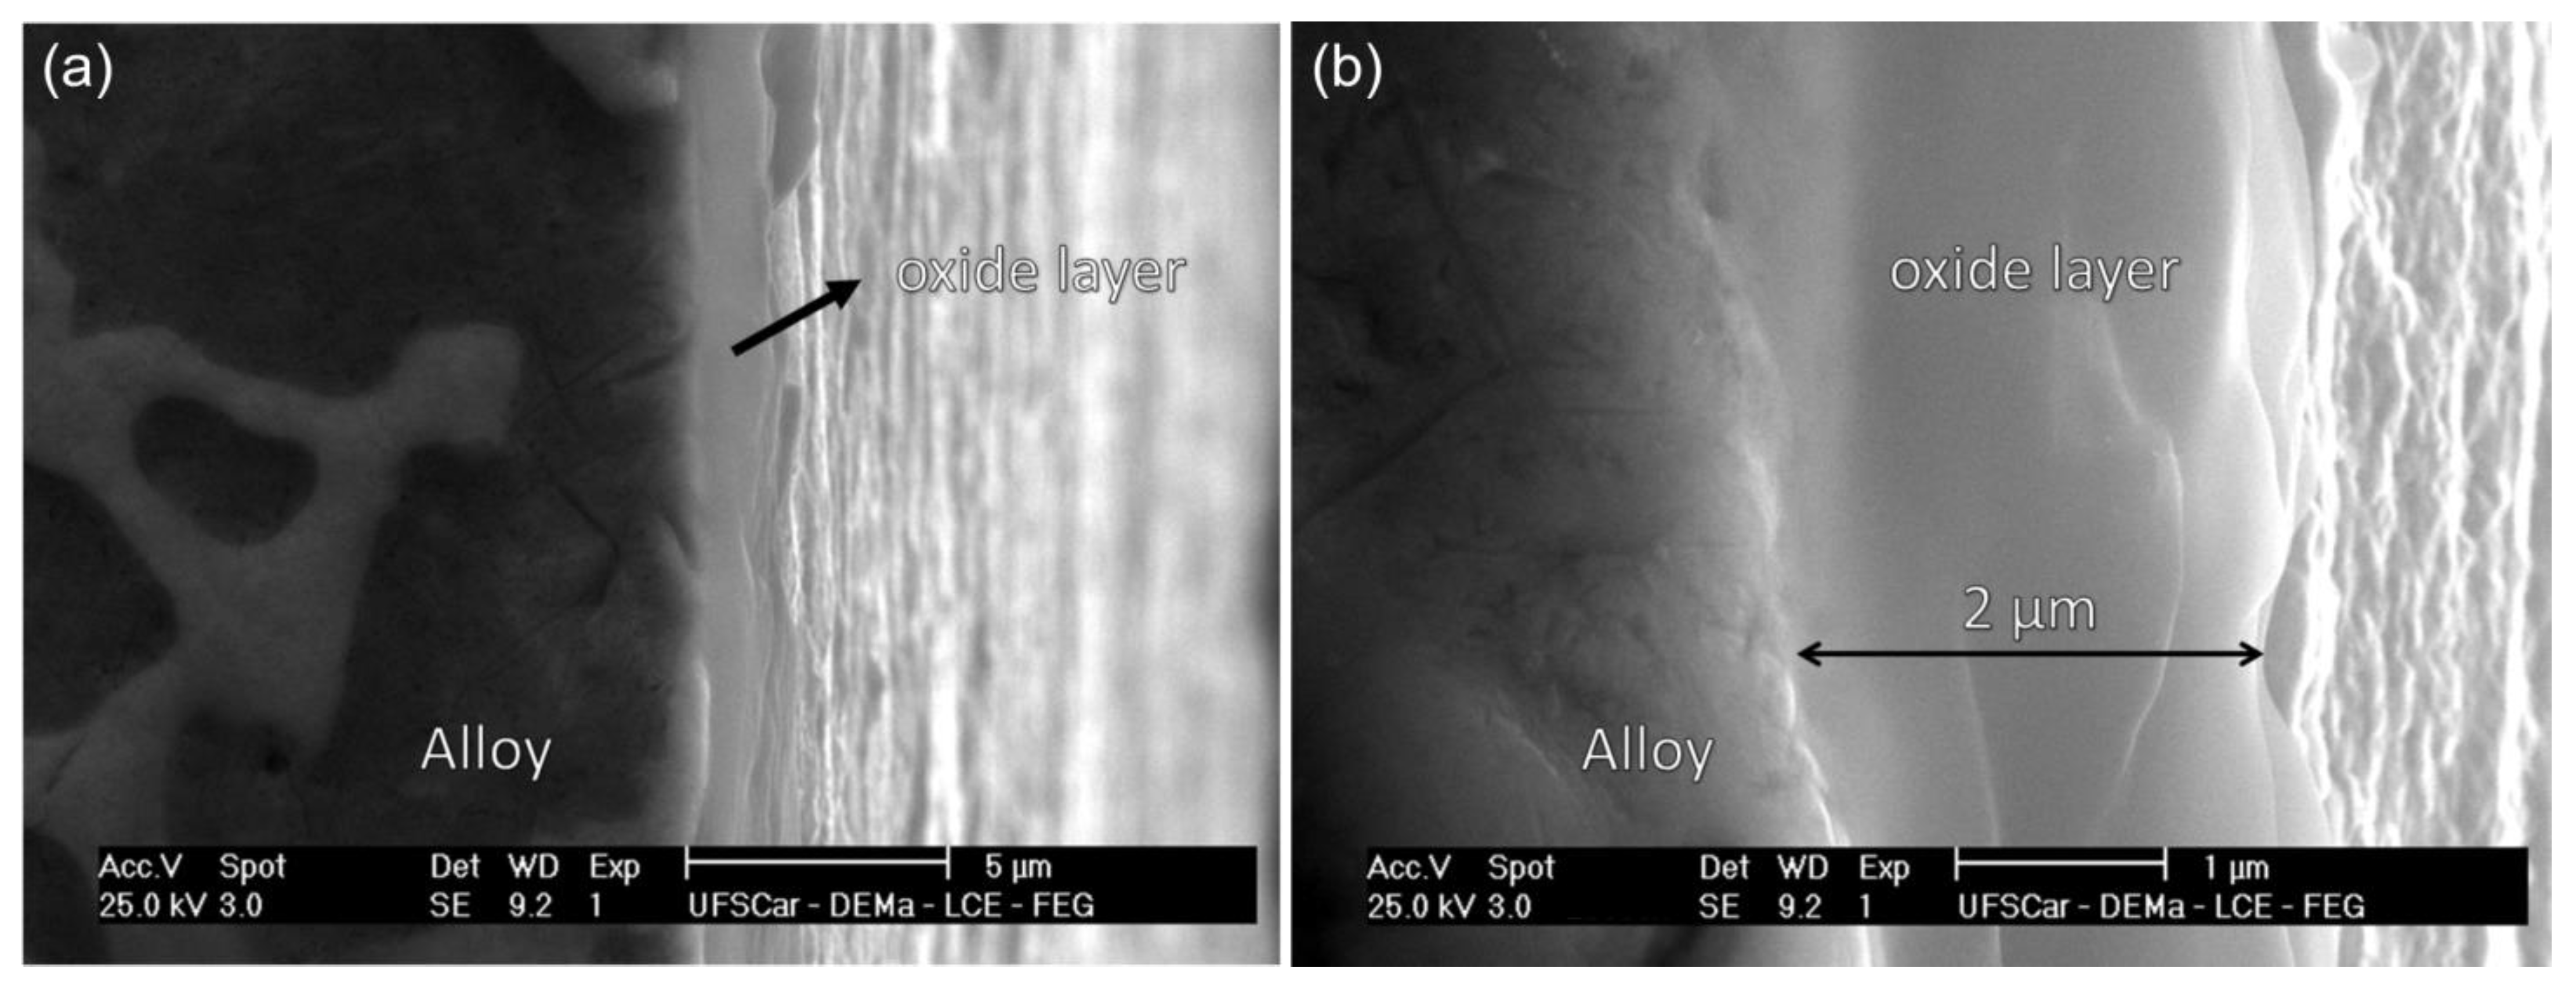
3.3. Characterization of the Formed Oxide Layer

It is possible to observe that the aspect of the samples after oxidation was different for each temperature, as shown in Figure 10. The samples oxidized at 660 °C presented a slightly green color when compared to the sanded sample (standard). The samples at 740 °C, 860 °C, and 900 °C presented blue, gold, and darkened colors, respectively. The color difference presented is due to the thickness and the type of the oxide layer formed during the analysis.
The FTIR spectra (Figure 10a) showed that the vibrational Cr–O bonds associated with Cr2O3 at ~770, 630, 570, 450, and 420 cm−1 [34,35] emerged at 660 °C. The signal remains practically constant until 740 °C; however, there is a significant increase from 860 °C. This indicates that the formation of the Cr2O3 layer is still at a very early stage up to a temperature of 740 °C, while its formation is well defined and predominant on the sample surface at 860 °C and 900 °C. Furthermore, it is indicative that the second oxidation stage demonstrated in Figure 7, Figure 8 and Figure 9 is related to the Cr2O3 formation, given the large difference in peak intensity.
The FT-Raman spectra (Figure 10b) show that the Cr2O3 signal at 660 and 740 °C was relatively low in intensity and showed no apparent change in this temperature range. At a temperature of 860 °C, the intensity of the peaks increased substantially and remained the same at 900 °C. In addition, peaks related to NiCr2O4 (NiO + Cr2O3) formation were identified at ~431, 515, 560, 705, and 800 cm−1. The sharp peak around ~740 cm−1 is due to the noises. The peaks for the NiCr2O4 phase remain practically unchanged with increasing temperature, while those for the Cr2O3 phase increase significantly. This finding further supports the suggestion that the second oxidation stage is controlled by reduced Ni diffusion and increased Cr concentration in the outermost oxide layer.
The morphologies of the oxide layers formed at 600, 740, 860, and 900 °C were investigated by SEM, as shown in Figure 11. The oxide layers are composed of small crystalline grains. Moreover, the shape and size of these crystals change with temperature. The oxides formed at 900 °C presented the largest grain sizes and more uniformity when compared to the oxides formed at lower temperatures due to the higher diffusivity of the species. Often, the oxide layers cover the entire surface of the substrate, including defects (caused during the sample preparation) and pores. It is essential to observe that the oxide layer did not break up or even detach at any of the temperatures analyzed. As the experiments were carried out under isothermal conditions, this environment (under specific conditions) may have contributed.
Spot EDS analyses performed on the cross-section of the oxide layer formed at the different temperatures, shown in Figure 12, revealed that the oxide is mainly composed of Cr and Ni. It is also observed that Ni content was reduced, whereas Cr content increased with increasing temperature. Although the criterion of standard Gibbs formation free energy indicates the existence of a pronounced difference in the stability of oxides between Cr2O3 [4/3 Cr (s) + O2 (g) = 2/3 Cr2O3 (s); ∆G° = −602.2 kJ/mol] and NiO [2Ni (s) + O2 (g) = 2NiO (s); ∆G◦ = −319.3 kJ/mol] at 600 °C—facilitating the preferential oxidation of Cr —, the amount of Cr present in the metallic matrix is not sufficient to support the formation of a single continuous Cr2O3 oxide layer at low temperature [33,36,37,38]. This occurs because Cr preferentially diffuses from the grain boundaries to bulk regions and, as the Cr diffusivity decreases with lowering temperature, a long time is required for an enrichment of Cr in the oxide layer. Thus, the oxide layer formed at lower temperatures (660 and 740 °C) consists of a continuous NiO layer with Cr2O3 particles reacting with NiO to form NiCr2O4 particles [25,33]. As the oxidation temperature increases, the diffusion coefficient of Cr increases, decreasing the critical time for the formation of a protective Cr2O3 layer [33]. The formation of a continuous Cr2O3 layer hinders the diffusion of Ni2+ cations through the oxide. This occurs because of the radius size difference between Ni2+ and Cr3+ of ~0.070 nm and ~0.062 nm, respectively. It is well known that there is a correlation between size and charge species, as well as their mobility in a specific medium, being more accessible according to the smaller particle size [39]. In this way, Cr diffusion occurs preferentially in the system compared to Ni. This may explain the reduction of the Ni content and the increase of Cr in the oxide layer with increasing temperature.
An inspection of the cross-section of the sample oxidized at 900 °C, shown in Figure 13, reveals that the oxide layer formed does not appear to have any cavities, pores, or microcracks. These aspects could allow the direct access of oxygen to the metal substrate, influencing the oxidation kinetics of the alloy. In Figure 13b, the calculated average thickness for the oxide layer is approximately 2 μm. Additionally, no internal oxidation was observed through cross-section analysis.
Based on this value of average thickness of the oxide layer and the initial dimensions of the samples, the density of the oxide formed was estimated. The mass and volume of the oxide layer was assumed to be equal to the differences between the masses and volumes before and after the oxidation process. The estimation was made according to the following equation:
ρ o x = Δ W V a o x V s s = 0.26957   mg 9.8636   mm 3 9.8125   mm 3 = 5.27   g cm 3
where: ΔW is the mass change, Vaox is the volume after the oxidation process, and Vss is the volume of the sanded sample (before oxidation). The obtained data are presented in Table 3.
Note that the height and diameter values after oxidation show an increase of 4 µm, relative to the oxide layer thickness of 2 µm at each extremity of the sample. Comparing the density value for the formed oxide after alloy oxidation at 900 °C (5.27 g/cm3) with previous studies for the density of Cr2O3 (5.21 g/cm³) [40], the obtained result suggests the oxide layer formed is mainly composed of Cr2O3. Moreover, this small deviation of density to higher values may have been caused by the presence of NiO, since this oxide presents a higher density (6.67 g/cm³) than Cr2O3.

4. Conclusions

In summary, this survey demonstrated the oxidation behavior of a nickel-based alloy used in natural gas engine exhaust valve seats when exposed to an oxygen atmosphere at temperatures ranging from 660 to 900 °C. From the presented data, the following conclusions can be drawn:
  • Based on the designed kinetic parameters, the oxidation rate increases as the temperature increases;
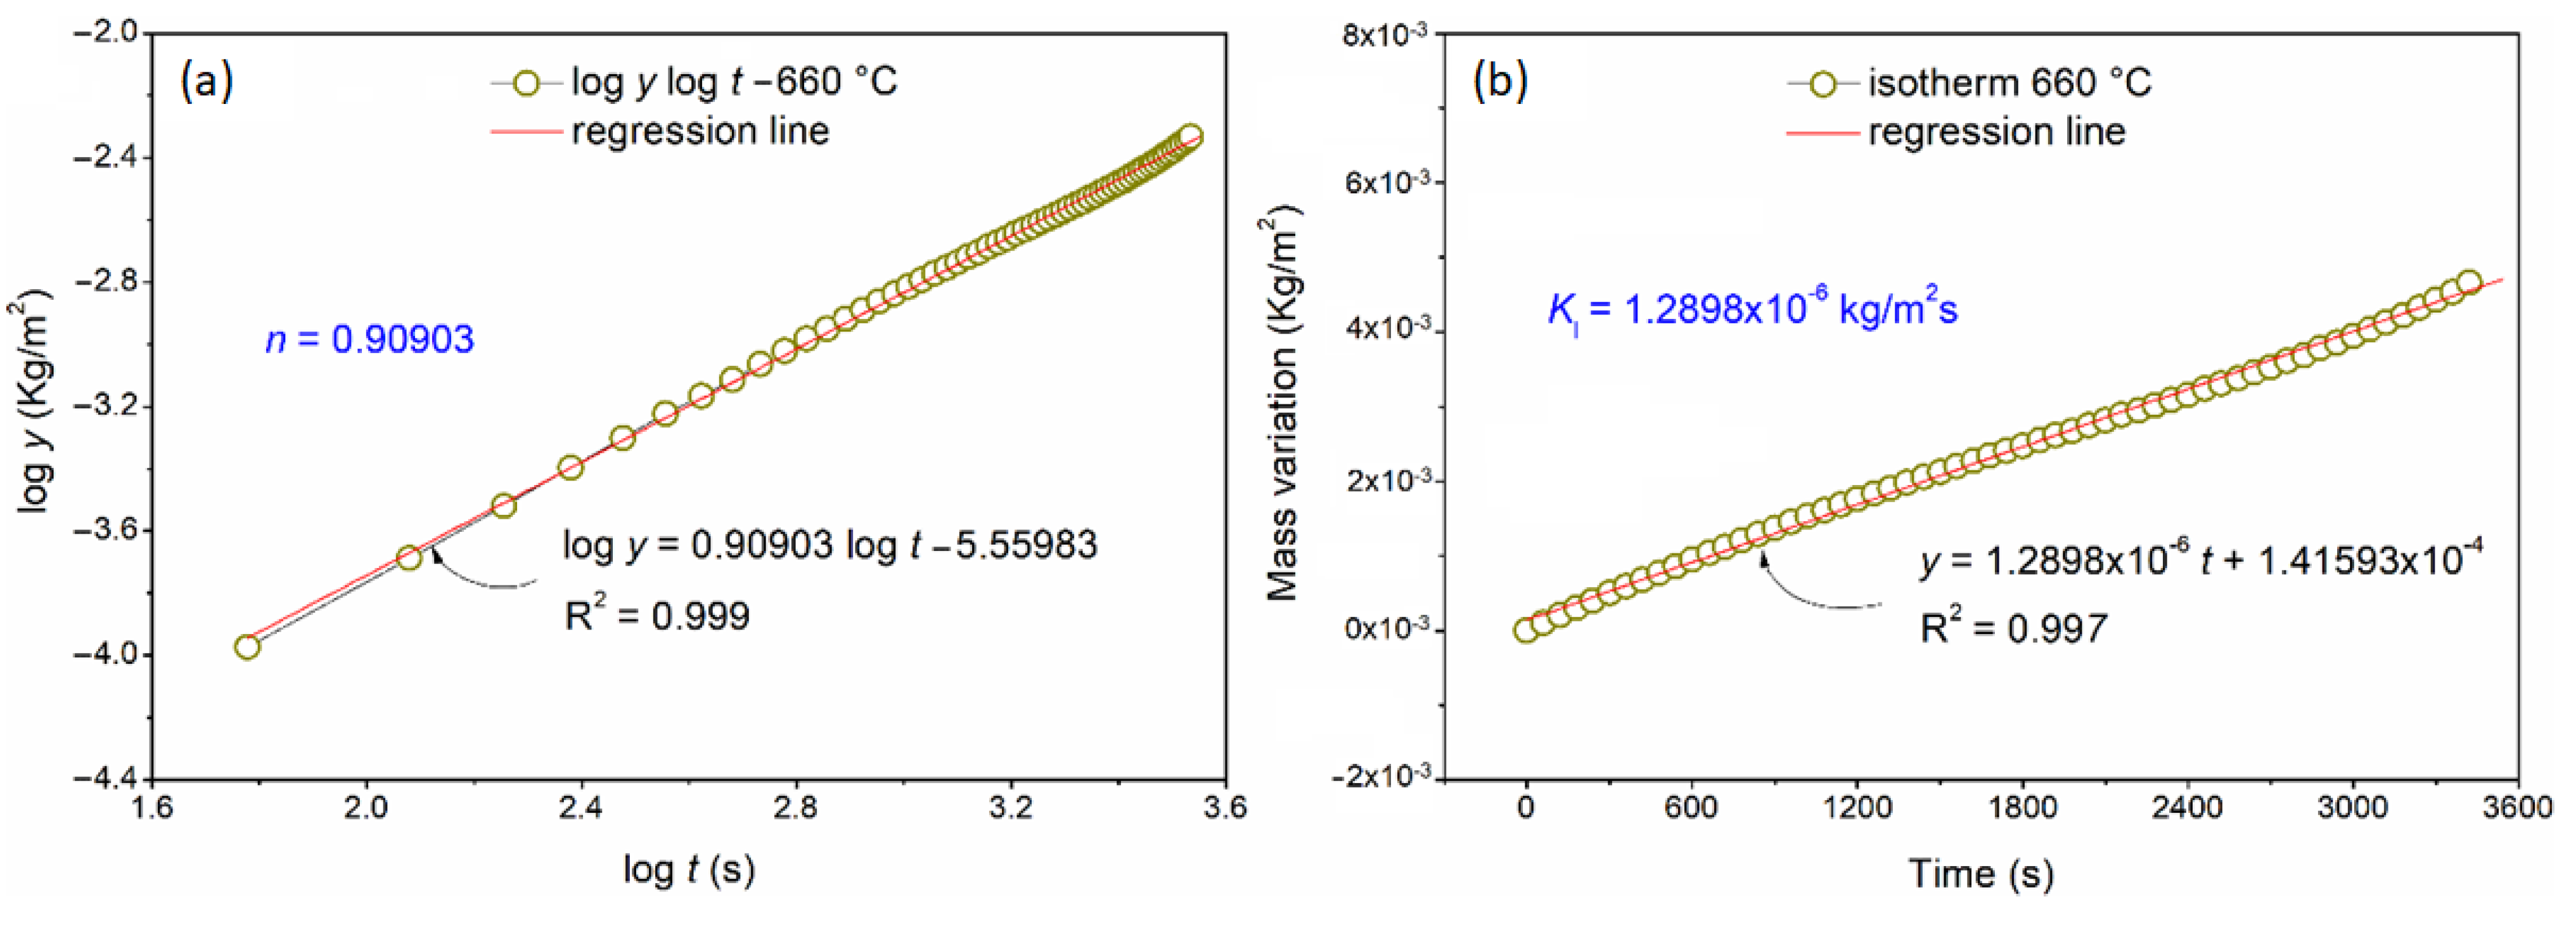
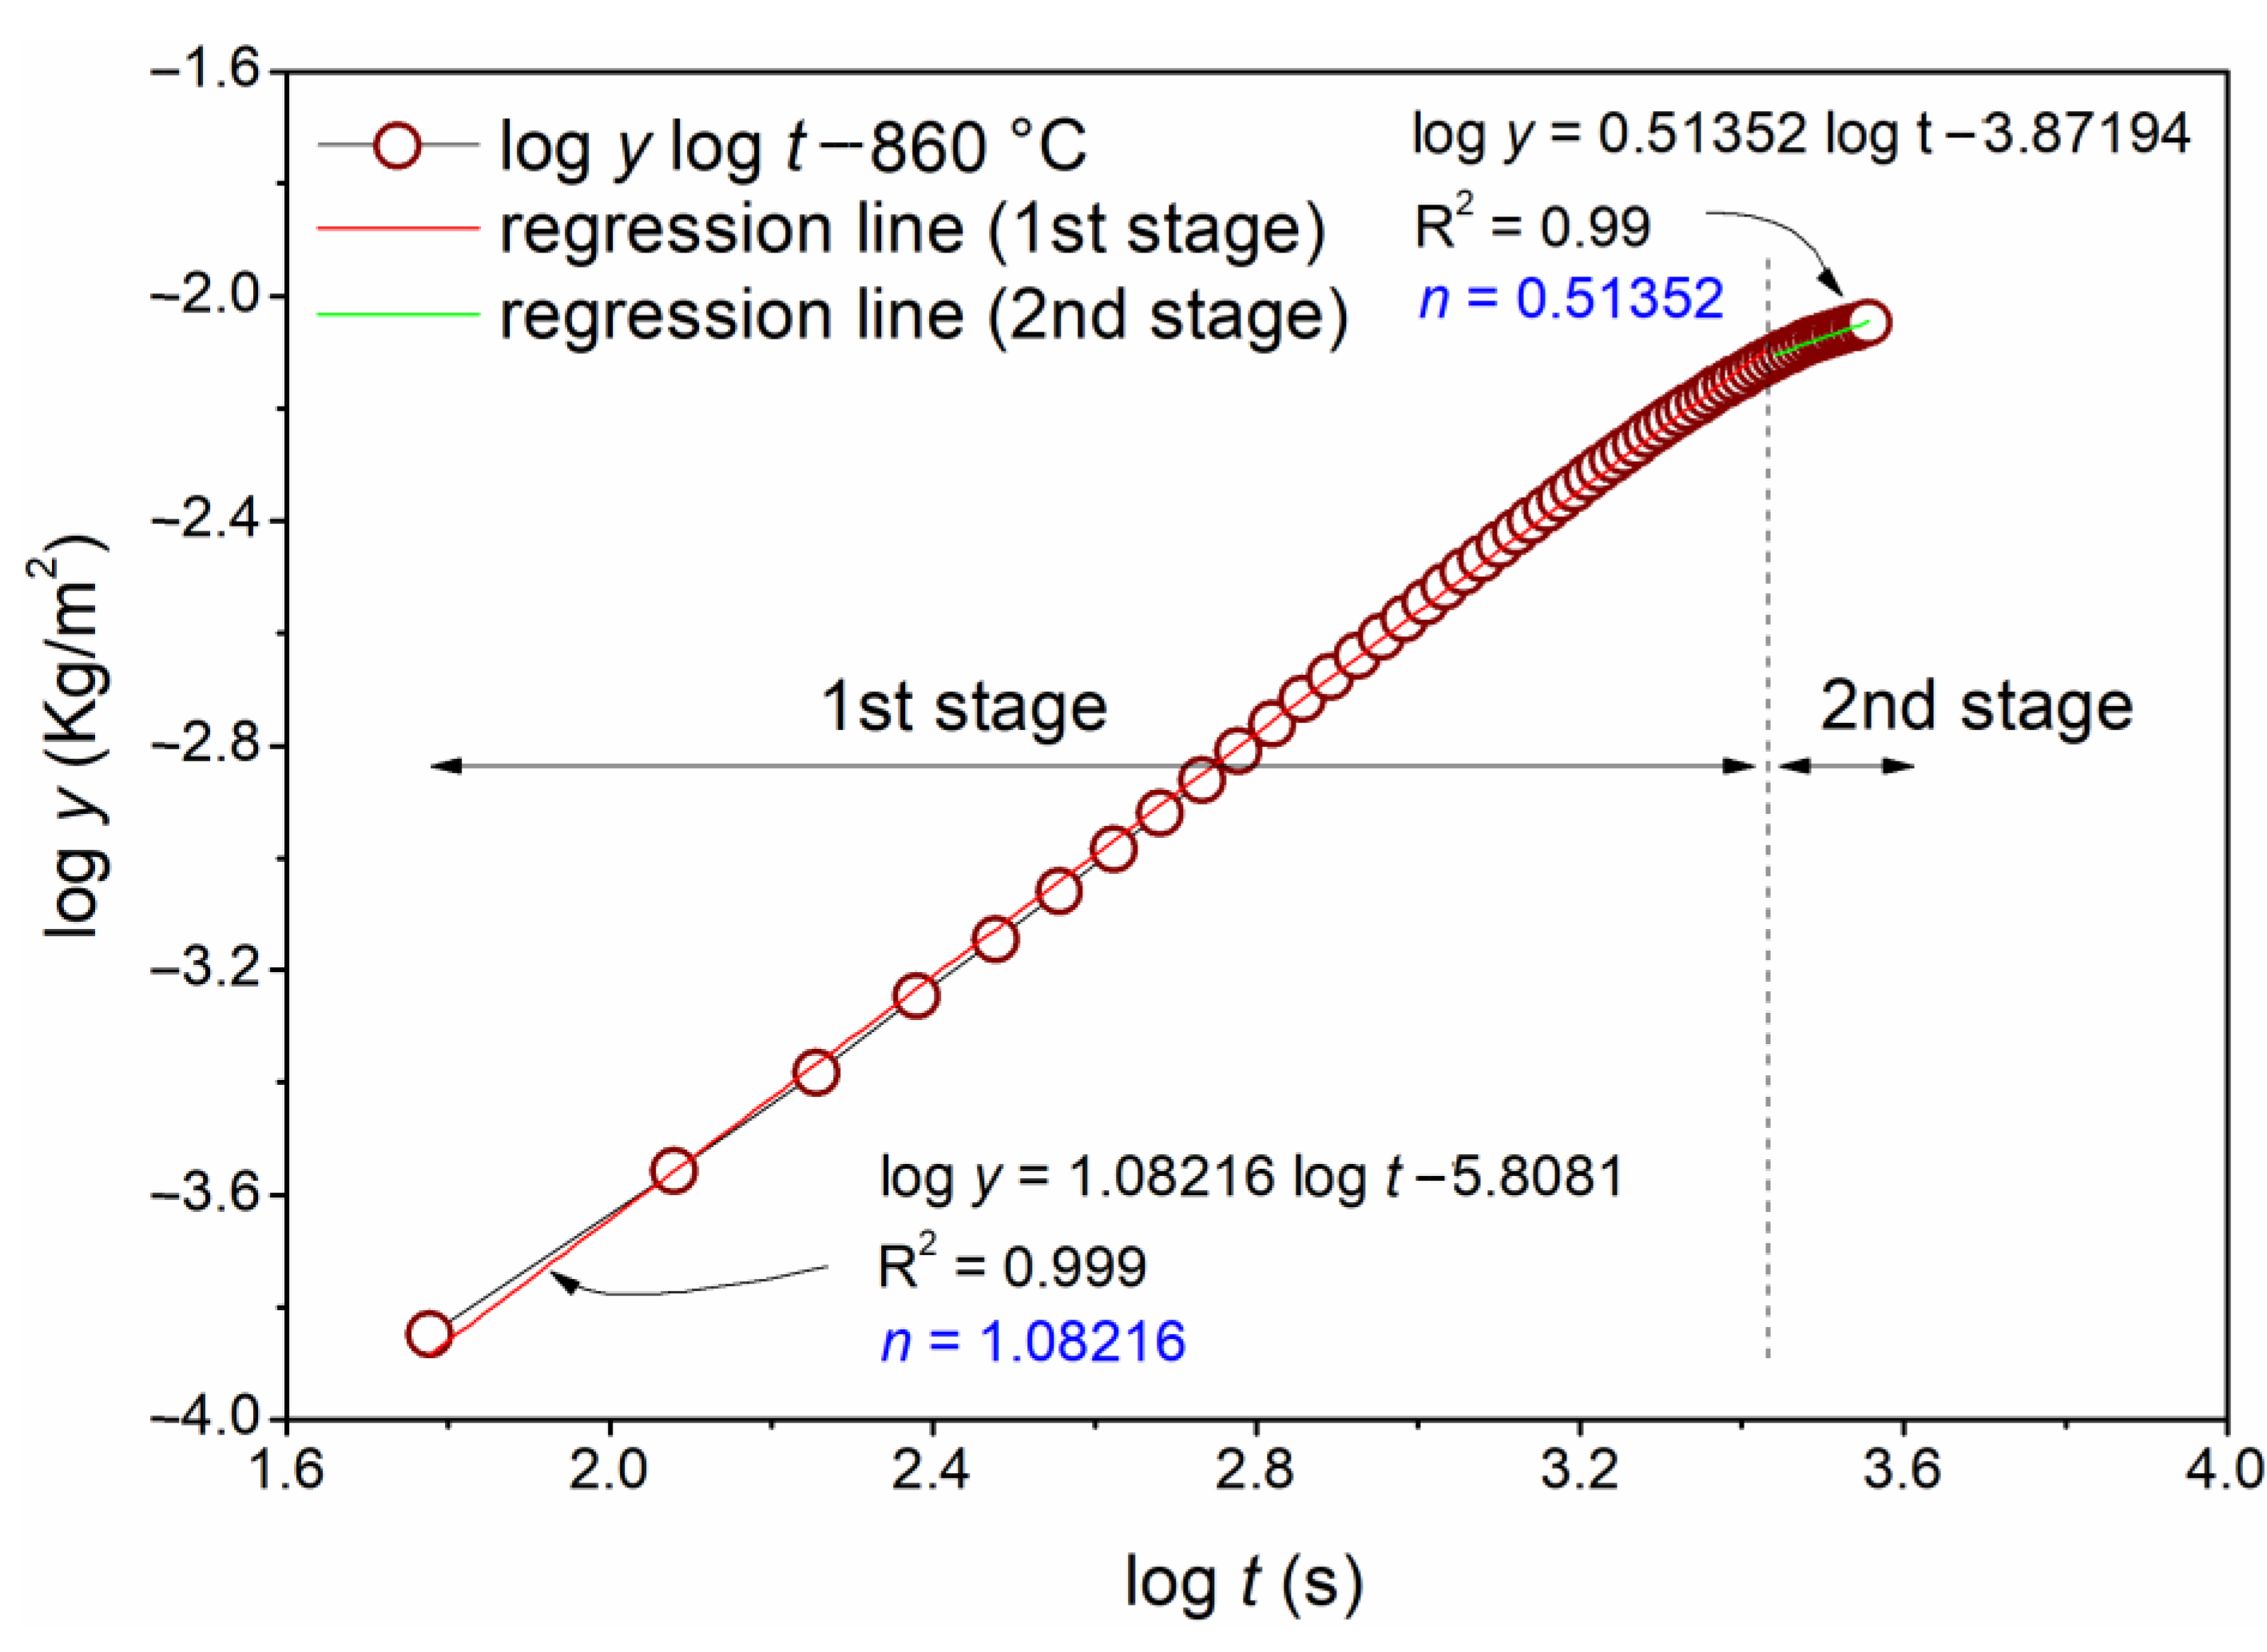
  • The samples exposed at 860 and 900 °C exhibited two stages of oxidation, while at 660 and 740 °C, only one stage was observed;
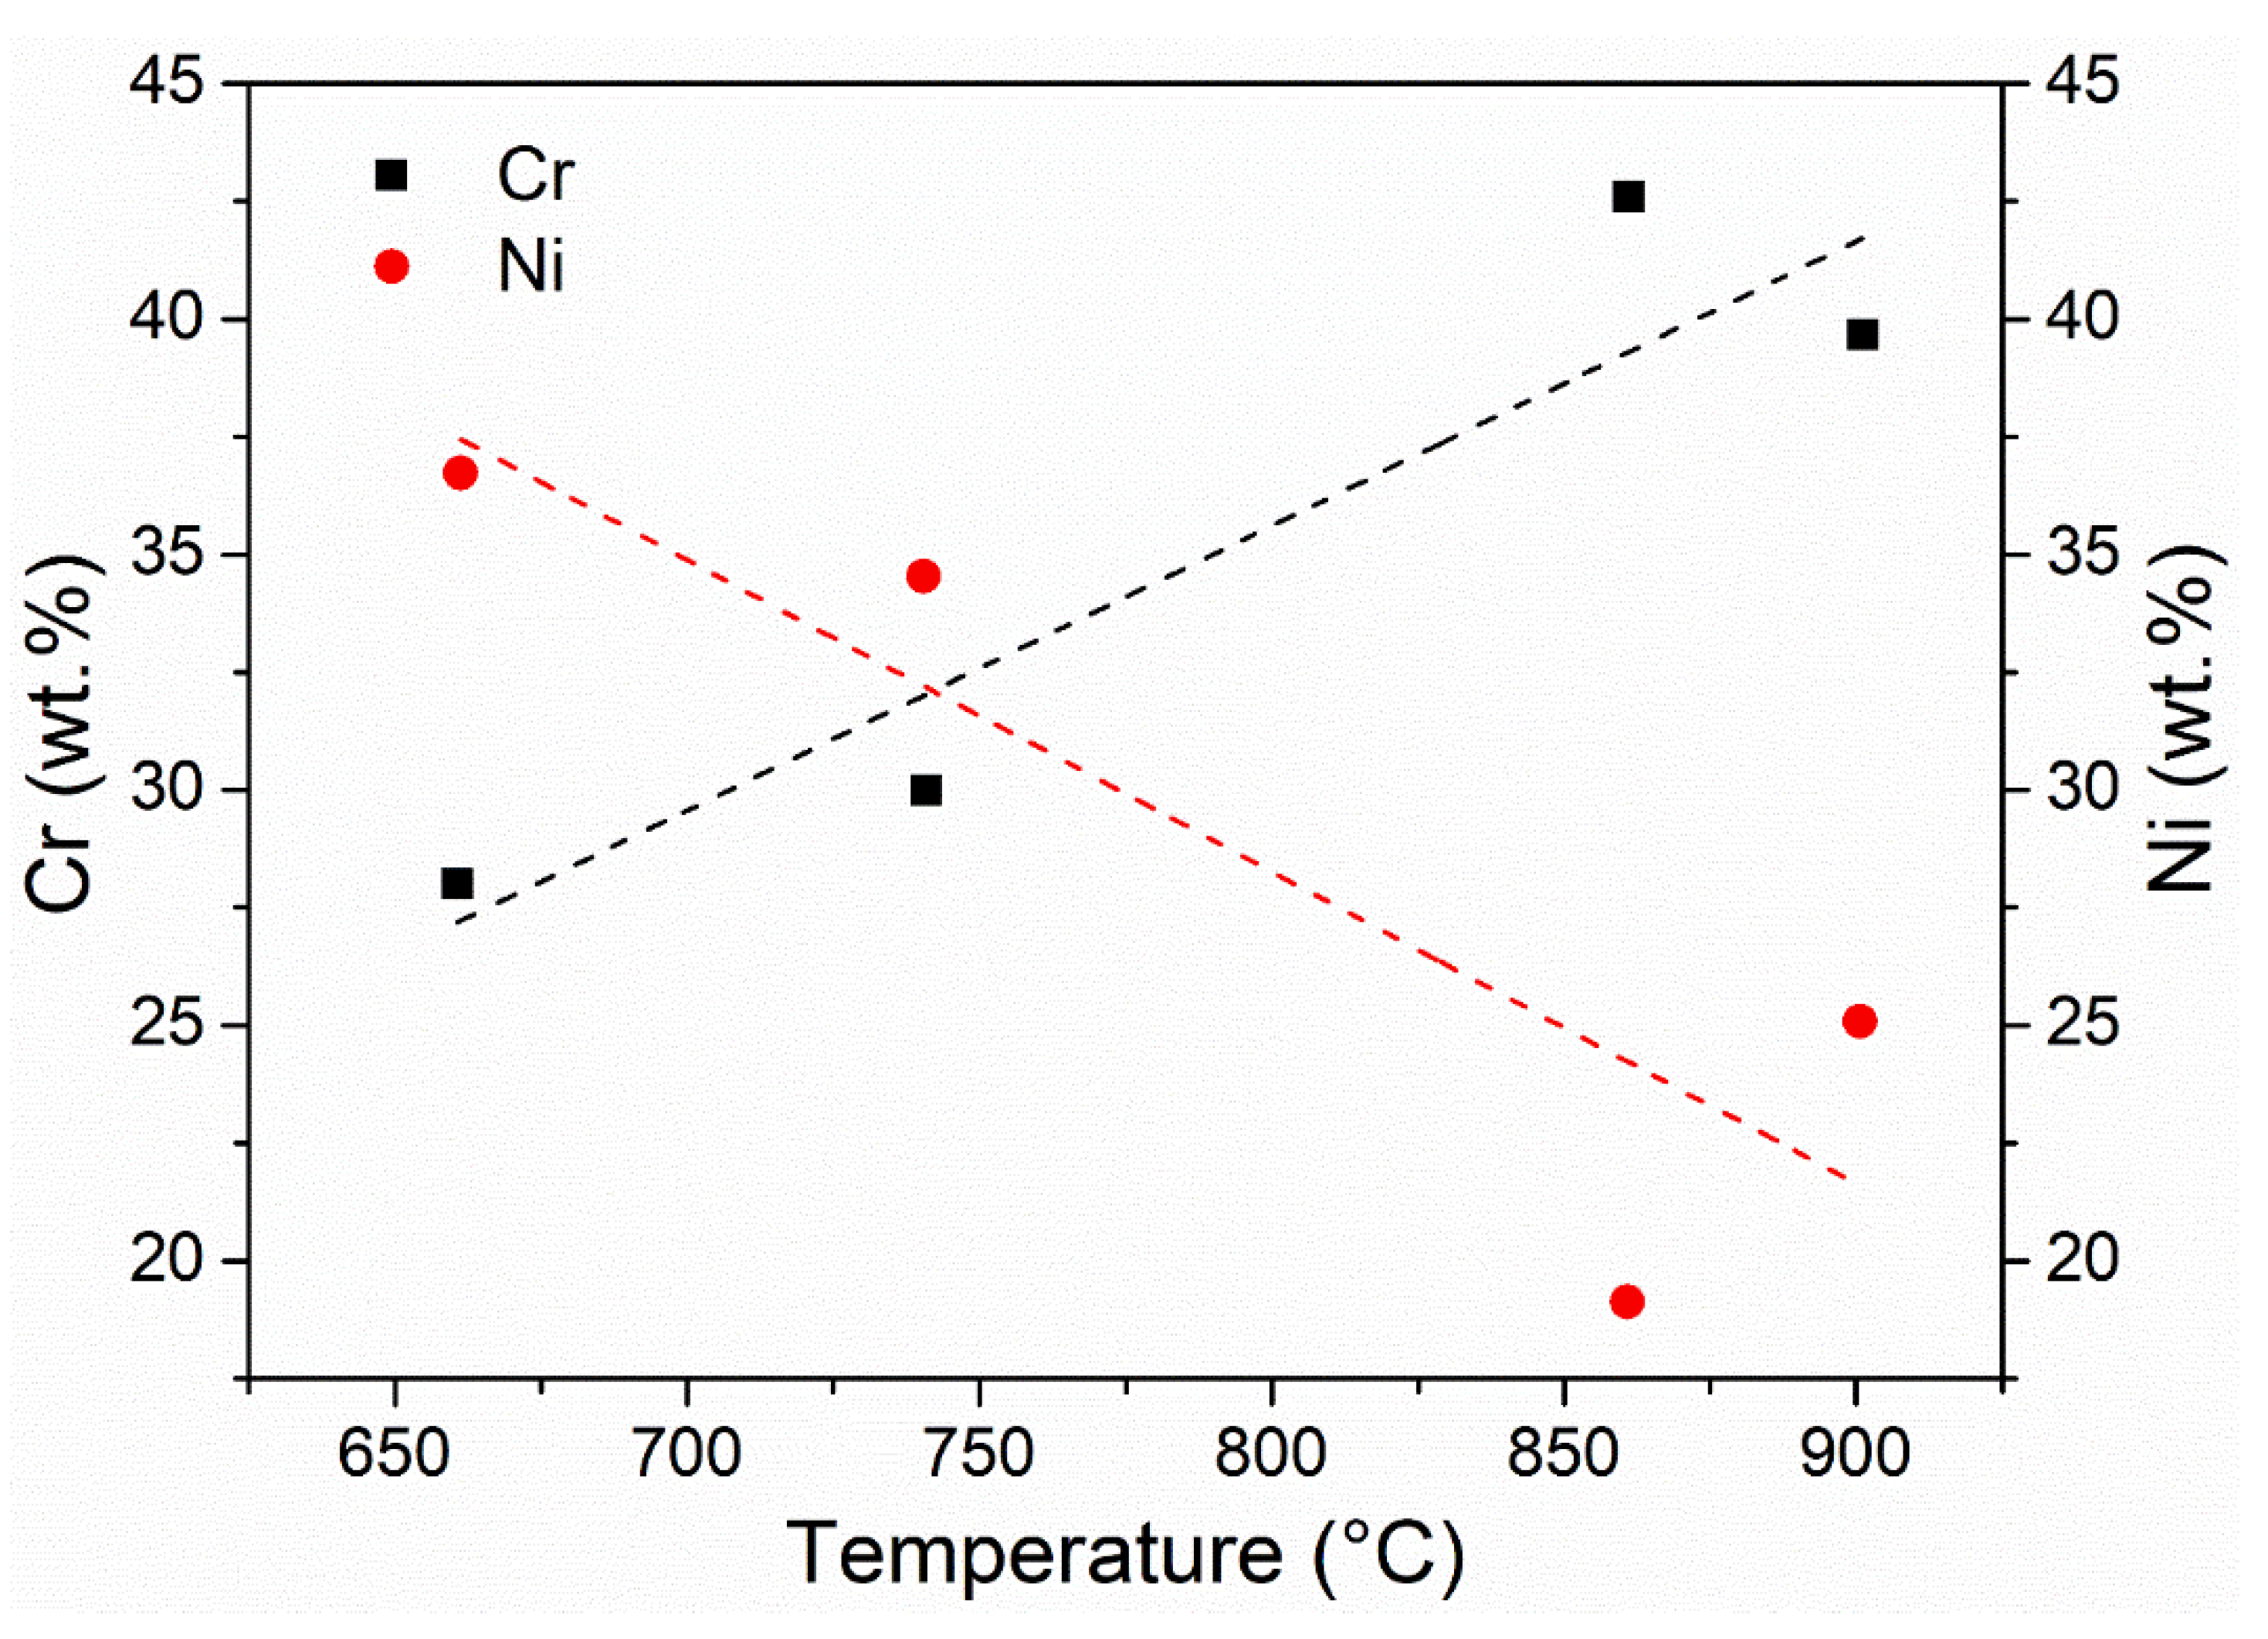
  • The first stage (linear behavior) was led by the oxygen reaction rate with the alloy surface. The second stage (parabolic behavior) was led mainly by Ni and Cr species diffusion through the formed oxide layer;
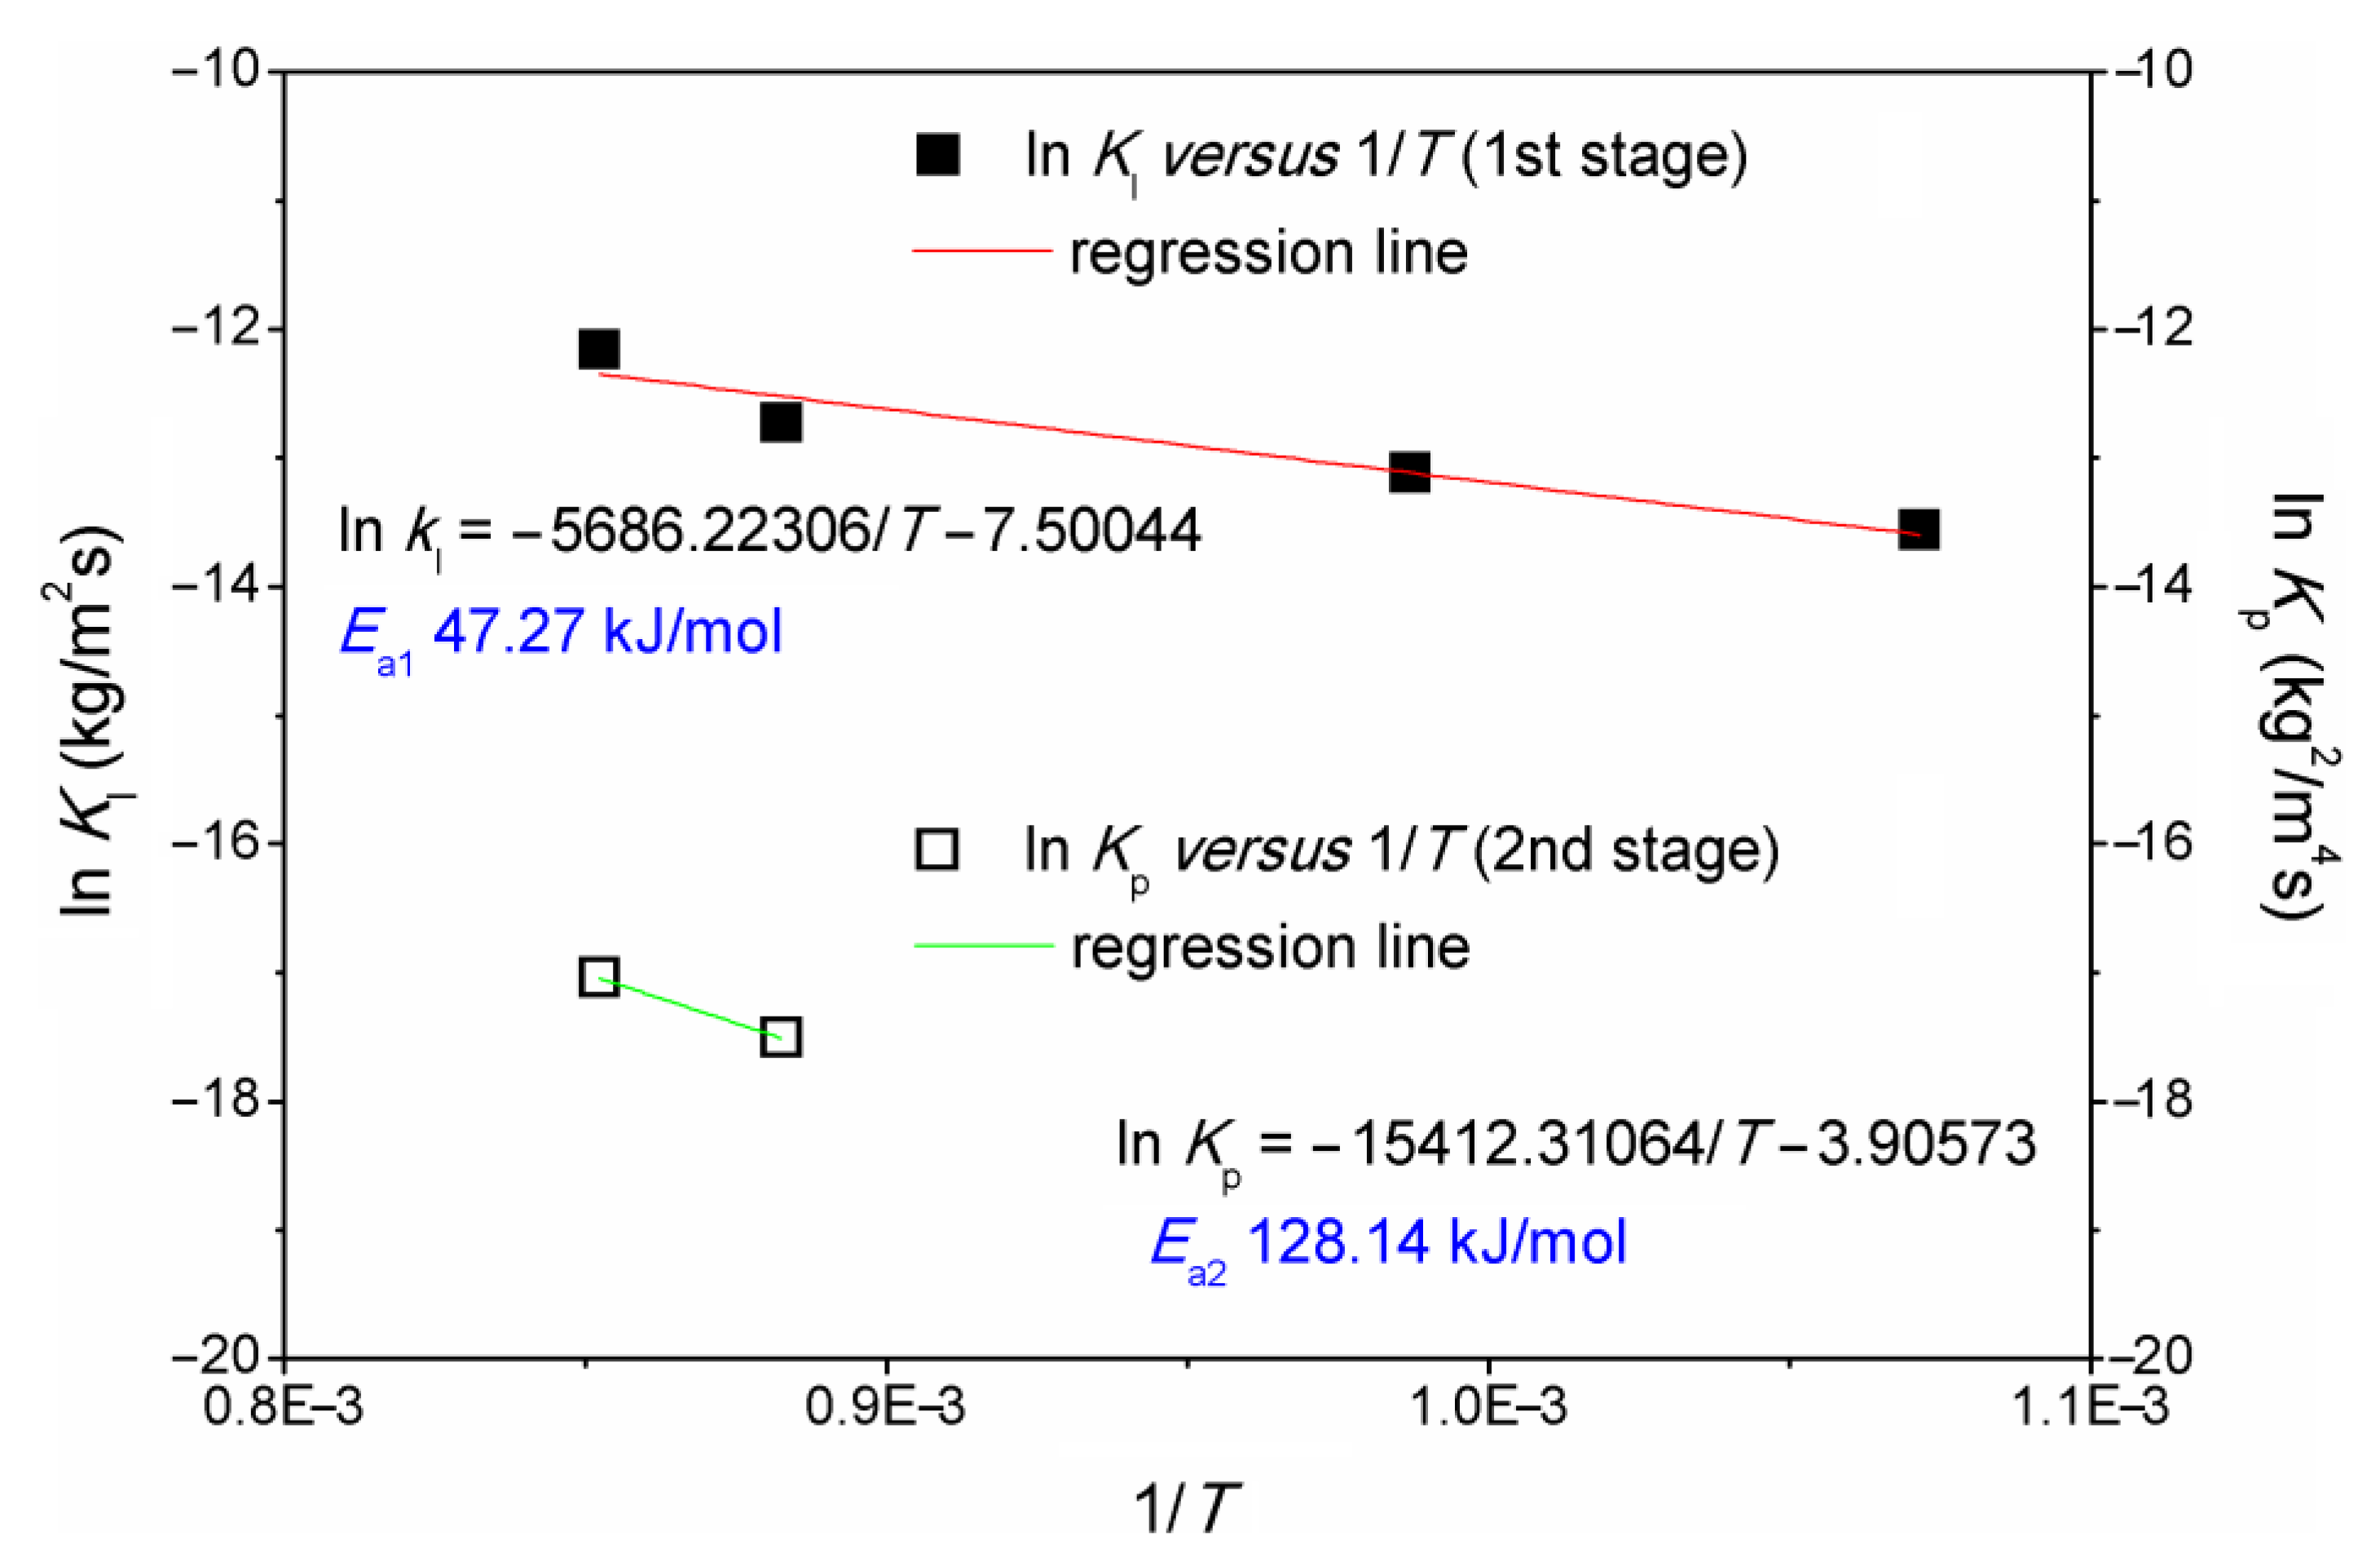
  • The apparent activation energy for the first and second stages was 47 kJ/mol and 128 kJ/mol, respectively;
  • The Cr2O3 layer that formed on the samples exposed at 900 °C presented a potentially protective character, with no noticeable cavities, pores, or microcracks.

Supplementary Materials

The following supporting information can be downloaded at: https://www.mdpi.com/article/10.3390/met13010049/s1, Figure S1: mass variation per unit surface area as a function of the exposure time for the nickel-based alloy at 740 °C; Figure S2: regression lines two-stages at 900 °C.

Author Contributions

Conceptualization, J.H.A. and C.A.D.R.; methodology, J.H.A., R.L.S. and G.d.S.V.; software, J.H.A., R.L.S. and G.d.S.V.; validation, J.H.A., C.B.M.J. and R.S.; formal analysis, J.H.A., C.B.M.J. and R.S.; investigation, J.H.A., R.L.S. and G.d.S.V.; resources, J.H.A. and C.A.D.R.; data curation, J.H.A. and C.A.D.R.; writing—original draft preparation, J.H.A., R.L.S. and G.d.S.V.; writing—review and editing, J.H.A., C.B.M.J., R.S. and C.A.D.R.; visualization, J.H.A. and C.A.D.R.; supervision, C.A.D.R.; project administration, J.H.A. and C.A.D.R.; funding acquisition, C.A.D.R. All authors have read and agreed to the published version of the manuscript.

Funding

This study was financed in part by the Coordenação de Aperfeiçoamento de Pessoal de Nível Superior—Brasil (CAPES)—Finance Code 001. The authors also gratefully acknowledge the financial support of the PPGCEM/UFSCar (Postgraduate Program in Materials Science and Engineering of the Federal University of São Carlos) and Brazilian research-funding agency CNPq (National Council for Scientific and Technological Development—Grant Nos. 312614/2020-9; 406740/2021-6 and 407624/2022-8).

Institutional Review Board Statement

Not applicable.

Informed Consent Statement

Not applicable.

Data Availability Statement

The data supporting the findings of this research are available in the paper. Any supplementary information or explanation is available from the corresponding author upon request.

Conflicts of Interest

The authors declare no conflict of interest.

References

  1. Hekkert, M.P.; Hendriks, F.H.J.F.; Faaij, A.P.C.; Neelis, M.L. Natural gas as an alternative to crude oil in automotive fuel chains well-to-wheel analysis and transition strategy development. Energy Policy 2005, 33, 579–594. [Google Scholar] [CrossRef] [Green Version]
  2. Alkemade, U.G.; Shcumann, B. Engines and exhaust after treatment systems for future automotive applications. Solid State Ion. 2006, 177, 2291–2296. [Google Scholar] [CrossRef]
  3. Yamagata, H. The Science and Technology of Materials in Automotive Engines, 1st ed.; Woodhead Publishing and Maney Publishing on behalf of The Institute of Materials, Minerals & Mining: Cambridge, UK, 2005; ISBN 9781855739703. [Google Scholar]
  4. Jang, C.; Lee, D.; Kim, D. Oxidation behaviour of an Alloy 617 in very high-temperature air and helium environments. Int. J. Press. Vessel. Pip. 2008, 85, 368–377. [Google Scholar] [CrossRef]
  5. Seal, S.; Kuiry, S.C.; Bracho, L.A. Studies on the Surface Chemistry of Oxide Films Formed on IN-738LC Superalloy at Elevated Temperatures in Dry Air. Oxid. Met. 2001, 56, 583–603. [Google Scholar] [CrossRef]
  6. Huang, J.; Fang, H.; Fu, X.; Huang, F.; Wan, H.; Zhang, Q.; Deng, S.; Zu, J. High-temperature oxidation behavior and mechanism of a new type of wrought Ni-Fe-Cr-Al superalloy up to 1300 °C. Oxid. Met. 2000, 53, 273–287. [Google Scholar] [CrossRef]
  7. Geng, S.; Wang, F.; Zhu, S. High-temperature oxidation behavior of sputtered IN 738 nanocrystalline coating. Oxid. Met. 2002, 57, 231–243. [Google Scholar] [CrossRef]
  8. Berthod, P. Kinetics of high temperature oxidation and chromia volatilization for a binary Ni-Cr alloy. Oxid. Met. 2005, 64, 235–252. [Google Scholar] [CrossRef] [Green Version]
  9. Berthod, P.; Aranda, L.; Mathieu, S.; Vilasi, M. Influence of water vapour on the rate of oxidation of a Ni-25wt.%Cr alloy at high temperature. Oxid. Met. 2013, 79, 517–527. [Google Scholar] [CrossRef] [Green Version]
  10. Xu, X.; Zhang, X.; Chen, G.; Lu, Z. Improvement of high-temperature oxidation resistance and strength in alumina-forming austenitic stainless steels. Mater. Lett. 2011, 65, 3285–3288. [Google Scholar] [CrossRef]
  11. Narasimhan, S.L.; Larson, J.M.; Whelan, E.P. Wear Characterization of New Nickel Base Alloys for Internal Combustion Engine Valve Seat Applications. In Proceedings of the Wear of Materials: International Conference on Wear of Materials, San Francisco, CA, USA, 30 March–1 April 1981; Volume 74, pp. 210–218. [Google Scholar]
  12. Pierce, D.; Haynes, A.; Hughes, J.; Graves, R.; Maziasz, P.; Muralidharan, G.; Shyam, A.; Wang, B.; England, R.; Daniel, C.; et al. High temperature materials for heavy duty diesel engines: Historical and future trends. Prog. Mater. Sci. 2019, 103, 109–179. [Google Scholar] [CrossRef]
  13. Roberge, P. Corrosion Engineering: Principles and Practice; McGraw-Hill Education: New York, NY, USA, 2008; ISBN 0071640878. [Google Scholar]
  14. Khan, M.I.; Khan, M.A.; Shakoor, A. A failure analysis of the exhaust valve from a heavy duty natural gas engine. Eng. Fail. Anal. 2018, 85, 77–88. [Google Scholar] [CrossRef]
  15. Witek, L. Failure and thermo-mechanical stress analysis of the exhaust valve of diesel engine. Eng. Fail. Anal. 2016, 66, 154–165. [Google Scholar] [CrossRef]
  16. Ootani, T.; Yahata, N.; Fujiki, A.; Ehira, A. Impact Wear Characteristics of Engine Valve and Valve Seat Insert Materials at High Temperature: Impact Wear Tests of Martensitic Heat-Resistant Steel SUH3 Against Fe-Base Sintered Alloy Using Plane Specimens. Wear 1995, 188, 175–184. [Google Scholar] [CrossRef]
  17. Division, E.C.; Wang, Y.S.; Narasimhan, S.; Larson, J.M.E.; Larson, J.M.E.; Barber, G.C. The effect of operating conditions on heavy duty engine valve seat wear. Wear 1996, 201, 15–25. [Google Scholar]
  18. Chun, K.J.; Kim, J.H.; Hong, J.S. A study of exhaust valve and seat insert wear depending on cycle numbers. Wear 2007, 263, 1147–1157. [Google Scholar] [CrossRef]
  19. Khanna, A.S. Introduction to High Temperature Oxidation and Corrosion, 1st ed.; ASM International: Materials Park, OH, USA, 2002; ISBN 9780871707628. [Google Scholar]
  20. Kubaschewski, O.; Hopkins, B.E. Oxidation of Metals and Alloys, 2nd ed.; Butterworths: Oxford, UK, 1962; ISBN 9780608180144. [Google Scholar]
  21. Kofstad, V.P. High Temperature Corrosion, 1st ed.; Elsevier Applied Science: London, UK, 1988; ISBN 9781851661541. [Google Scholar]
  22. Brown, M.E. Introduction to Thermal Analysis: Techniques and Applications, 2nd ed.; Kluwer Academic Publisher: New York, NY, USA, 2001; ISBN 9781402004728. [Google Scholar]
  23. Wright, M.R. The kinetic analysis of experimental data. In An introduction to Chemical Kinetics, 1st ed.; John Wiley & Sons Ltd.: Chichester, UK, 2004; ISBN 9780470090589. [Google Scholar]
  24. Atkins, P.; De Paula, J.; Keeler, J. Atkins’ Physical Chemistry, 9th ed.; Oxford University Press: London, UUK, 2009; ISBN 9780198769866. [Google Scholar]
  25. Birks, N.; Meier, G.H.; Pettit, F.S. Introduction to the High-Temperature Oxidation of Metals, 2nd ed.; Cambridge University Press: Cambridge, UK, 2006; ISBN 9781139163903. [Google Scholar]
  26. Ramanathan, L.V. Corrosão e Seu Controle, 1st ed.; Hemus: São Paulo, Brazil, 1997; ISBN 9788528900019. [Google Scholar]
  27. Jones, D.A. Principles and Prevention of Corrosion, 2nd ed.; Pearson: New Jersey, NJ, USA, 1995; ISBN 9780133599930. [Google Scholar]
  28. Gentil, V. Corrosão, 3rd ed.; LTC: Rio de Janeiro, Brazil, 1996; ISBN 9788521618041. [Google Scholar]
  29. Talbot, D.E.J.; Talbot, J.D.R. Corrosion Science and Technology, 3rd ed.; CRC Press: New York, NY, USA, 2017; ISBN 9780367735340. [Google Scholar]
  30. Nijdam, T.J.; Sloof, W.G. Effect of y distribution on the oxidation kinetics of NiCoCrAlY bond coat alloys. Oxid. Met. 2008, 69, 1–12. [Google Scholar] [CrossRef] [Green Version]
  31. Monceau, D.; Pieraggi, B. Determination of Parabolic Rate Constants from a Local Analysis of Mass-Gain Curves. Oxid. Met. 1998, 50, 477–493. [Google Scholar] [CrossRef] [Green Version]
  32. Ishida, M.; Jin, H.; Okamoto, T. A Fundamental Study of a New Kind of Medium Material for Chemical-Looping Combustion. Energy Fuels 1996, 10, 958–963. [Google Scholar] [CrossRef]
  33. Calvarin, G.; Molins, R.; Huntz, A.M. Oxidation Mechanism of Ni-20Cr Foils and Its Relation to the Oxide-Scale Microstructure. Oxid. Met. 2000, 53, 25–48. [Google Scholar] [CrossRef]
  34. Lopez-Navarrete, E.; Ocaña, M. Fine spherical particles of narrow size distribution in the Cr2O3-Al2O3 system. J. Mater. Sci. 2001, 36, 2383–2389. [Google Scholar] [CrossRef]
  35. Madi, C.; Tabbal, M.; Christidis, T.; Isber, S.; Nsouli, B.; Zahraman, K. Microstructural characterization of chromium oxide thin films grown by remote plasma assisted pulsed laser deposition. J. Phys. Conf. Ser. 2007, 59, 600–604. [Google Scholar] [CrossRef]
  36. Moshtaghi, M.; Abbasi, S.M. Effect of vacuum degree in VIM furnace on mechanical properties of Ni–Fe–Cr based alloy. Trans. Nonferrous Met. Soc. China 2012, 22, 2124–2130. [Google Scholar] [CrossRef]
  37. Moshtaghi, M.; Safyari, M. Effect of dwelling time in VIM furnace on chemical composition and mechanical properties of a Ni–Fe–Cr alloy. Vacuum 2019, 169, 108890. [Google Scholar] [CrossRef]
  38. Zhang, Y.; Zhang, C.; Li, F.; Wang, Z.; Wang, X.; Wang, C.; Zhang, C.; Huang, J.; Mao, F.; Chen, C.; et al. High-Temperature Oxidation Behavior of Cr-Ni-Mo Hot-Work Die Steels. Mater 2022, 15, 5145. [Google Scholar] [CrossRef]
  39. Rabbani, F.; Ward, L.P.; Strafford, K.N. A Comparison of the Growth Kinetics and Scale Morphology for Three Superalloys at 930 °C in Air and Low PO2 Environments. Oxid. Met. 2000, 54, 139–153. [Google Scholar] [CrossRef]
  40. Koshelev, I.; Paulikas, A.P.; Veal, B.W. Refracted X-Ray Fluorescence (RXF) Applied to the Study of Thin Films and Thermally-Grown Oxide Scales. Oxid. Met. 1999, 51, 23–54. [Google Scholar] [CrossRef]
Figure 1. Exhaust valve seats: (a) as received from the supplier and (b) samples prepared for thermogravimetric analyses.
Metals 13 00049 g001
Figure 2. Experimental procedure adopted for isothermal thermogravimetric analysis.
Metals 13 00049 g002
Figure 3. BSE SEM micrographs of the Ni-based alloy: (a,b) chemical contrast of the microstructure; and (c) EDS spectra of the different phases.
Metals 13 00049 g003
Figure 4. Mass variation per unit surface area as a function of the temperature for the Ni-based alloy.
Metals 13 00049 g004
Figure 5. Mass variation per unit surface area as a function of the exposure time for the Ni-based alloy at 660, 740, 860, and 900 °C.
Metals 13 00049 g005
Figure 6. Mass variation per unit surface area as a function of the exposure time for the Ni-based alloy at 660 °C: (a) log y versus log t to determine the oxidation rate index (n) and (b) y versus t to determine the linear oxidation rate constant (Kl).
Metals 13 00049 g006
Figure 7. Log of the mass variation per unit surface area as a function of the exposure time for the Ni-based alloy at 860 °C to determine the oxidation rate index (n) for the two different oxidation stages.
Metals 13 00049 g007
Figure 8. Mass variation per unit surface area as a function of the exposure time for the Ni-based alloy at 860 °C to determine the linear (Kl) and parabolic (Kp) oxidation rate constants: (a) first stage and (b) second stage.
Metals 13 00049 g008
Figure 9. ln of the linear (Kl) and parabolic (Kp) oxidation rate constants as a function of the inverse exposure time (K−1) to obtain the activation energy (Ea) for the two different oxidation stages.
Metals 13 00049 g009
Figure 10. Ni-based alloy characterizations before and after the oxidation analyses at 660, 740, 860, and 900 °C: (a) FTIR and (b) FT-Raman.
Metals 13 00049 g010
Figure 11. SEM micrographs of the Ni-based alloy after the oxidation test: (a,b) 660 °C; (c,d) 740 °C; (e,f) 860 °C; and (g,h) 900 °C.
Metals 13 00049 g011
Figure 12. Cr and Ni contents in the oxide layers formed on Ni-based alloy as a function of the temperature.
Metals 13 00049 g012
Figure 13. SEM micrographs of the nickel-based alloy after the oxidation analysis at 900 °C with emphasis on the oxide layer formed: (a) lower and (b) higher magnification.
Metals 13 00049 g013
Table 1. Kinetic parameters determined from the thermogravimetric analysis of the Ni-based alloy under study.
Temperature (°C)Oxidation Rate Index ( n ) K l (kg/m2s) K p (kg2/m4s)
1st Stage (Linear)2nd Stage (Parabolic)
6600.90903 (1)-1.2898 × 10⁻⁶-
7400.91528 (1)-2.0058 × 10⁻⁶-
8601.08216 (1)0.51352 (0.5)2.9629 × 10−62.49343 × 10−8
9000.90381 (1)0.53096 (0.5)5.2203 × 10−63.96464 × 10−8
Table 2. Data used to determine the apparent activation energy for the two oxidation stages of the Ni-based alloy under study.
1 / T (K−1) lnKl (kg/m2s)lnKp (kg2/m4s)Ea1 (kJ/mol)
1st Stage (Linear)
Ea2 (kJ/mol)
2nd Stage (Parabolic)
1.07164 × 10⁻³−13.56102-47.27-
9.87021 × 10⁻⁴−13.11947-
8.82496 × 10⁻⁴−12.72934−17.50703128.14
8.52046 × 10⁻⁴−12.16296−17.04328
Table 3. Average dimensions and mass of the samples before and after the oxidation process at 900 °C.
SampleMass (mg)Thickness (µm)Height (mm)Diameter (mm)Volume (mm3)Density (g/cm3)
Standard (sanded)79.80000-2.00002.50009.81258.13
Oxidized (900 °C)80.06957-2.00402.50409.8636-
Oxide layer0.26957~2--0.0511 5.27
Disclaimer/Publisher’s Note: The statements, opinions and data contained in all publications are solely those of the individual author(s) and contributor(s) and not of MDPI and/or the editor(s). MDPI and/or the editor(s) disclaim responsibility for any injury to people or property resulting from any ideas, methods, instructions or products referred to in the content.

