Article

Numerical Simulation Analysis on Surface Quality of Aluminum Foam Sandwich Panel in Plastic Forming

1
College of Materials Science and Engineering, Jilin University, Changchun 130025, China
2
Roll Forging Research Institute, Jilin University, Changchun 130025, China
*
Authors to whom correspondence should be addressed.
Metals 2023, 13(1), 65; https://doi.org/10.3390/met13010065
Submission received: 15 November 2022 / Revised: 22 December 2022 / Accepted: 22 December 2022 / Published: 26 December 2022

Abstract

:
The surface quality of an aluminum foam sandwich panel (AFSP) is very important for its appearance and application. This paper mainly studies the surface quality of AFSP after plastic forming. Combined with three-dimensional (3D) scanning technology, the normal deviation between the experimental AFSP and the target surface was obtained, and the surface quality parameters S q , S z and d max were calculated to evaluate surface quality. The AFSP models with cubic-spherical (CS) and tetrakaidecahedral (TKD) as foam structures were established respectively. A series of numerical simulations of multi-point forming (MPF) were then carried out. Equivalent strain and deformation characteristics of spherical and saddle-shaped AFSP were discussed. The main surface defects produced by AFSP in plastic forming, such as surface wrinkle, the local straight face effect and surface dimpling were analyzed. Finally, MPF experiments were carried out, and it was found that the numerical simulation results were significantly corresponded to the experimental AFSP in terms of the degree and distribution of normal deviation and surface quality evaluation parameters. The TKD model was more consistent with the experimental results than the CS model. Moreover, the results show that the surface quality can be improved by thicker face sheets and smaller core cell sizes.

1. Introduction

An aluminum foam sandwich panel (AFSP) is a panel composed of an upper and lower face sheet and aluminum foam in the middle. It has the advantages of a high stiffness to mass ratio, is waterproof, and has thermal insulation and impact resistance [1]. This makes it widely used in the aviation, navigation, automobile and construction sectors [2,3]. In particular, curved sandwich panels are widely used. In the traditional manufacturing of curved sandwich panels, the face sheet and cores are usually bent separately and then connected together by brazing or adhesive. The above method is inefficient and the connection accuracy of a curved sandwich panel is difficult to guarantee. However, sandwich panels with good forming accuracy can be obtained by plastic forming, which also saves time and labor costs.
At present, the research on plastic forming of sandwich panels mainly focuses on three-point bending [4] and the forming of simple curved surfaces [5]. Defects occur in the sandwich panel in plastic forming. Zhang et al. [6] studied the quasi-static three-point bending of hybrid composite sandwich beams with aluminum foam cores, and found that there are four failure modes (face sheet fracture, indentation, core shear and core shear tension) in the bending process of a hybrid composite sandwich. In the process of V-bending AFSP, Sun et al. [7] found that there was large transverse shear deformation between the face sheet and the core, which eventually led to the delamination of AFSP. Weiss et al. [8] studied V-bending and rolling forming for AFSP. It was found that the edge of the roll-formed sandwich panel wrinkles due to the delamination of the core layer and the face sheet. Wang et al. [9] studied the hydroforming of an open cell foam sandwich panel combined with numerical simulation. It was found that the failure of hydroforming sandwich panels is mainly related to the properties of the face sheet, the foam materials and adhesives, and the formability can be improved by reducing the density of aluminum foam. In addition to the above forming methods, there is also gas pressure forming [10], single point incremental forming [11], and laser forming [12].
Previous studies have proved the possibility of the curved surface forming of sandwich panels. Although the curved sandwich panels can be obtained quickly, the surface quality of the formed sandwich panels is poor due to the special structure of the core. These surface defects reduce the surface quality and appearance of the face sheet. Therefore, it is crucial to evaluate the degree of surface quality. Jaafar et al. [13] studied the influence of material parameters on the surface quality of Nomex honeycomb during milling, and proposed a new evaluation criterion. Reyno et al. [14] used a three-dimensional scanning method to evaluate the damage of honeycomb aircraft sandwich panels, and obtained the depth and area of pits to evaluate the surface quality. Harhash et al. [15] found that compared with the metal sheet with the same thickness of incremental forming, the outer skin of the incremental forming sandwich panel broke earlier than the inner skin, and the inner layer was affected by friction and vertical steps, showing scratches and poor surface quality. The surface roughness of sheet metal in incremental forming is related to processing parameters, sheet thickness and material properties [16]. Doluk et al. [17] studied the relationship between the surface defects of the two-layer sandwich structure and the cutting parameters, and obtained the processing parameters under the condition of forming the largest defects. Cai [18] carried out a multi-point plastic forming experiment and numerical simulation on an egg-box-like sandwich panel, and established theoretical prediction formulas for defects, such as the face sheet dimpling, face sheet wrinkling and core fracture. Subsequently, Liang [19] discussed the influence of the geometric parameters of the egg-box-like sandwich panel on the forming defect mode, and found that the formability of the thick face sheet sandwich panel is better than that of the thin face sheet sandwich panels. To sum up, most of the previous studies were qualitative analyses of the forming defects of sandwich panels. The influence of surface defects on surface quality was not discussed. There is a lack of quantitative research and analysis on the surface quality of sandwich panels.
Therefore, the surface quality of AFSP in plastic forming is studied in this paper. The surface quality of AFSP is quantified by the surface quality evaluation parameters S q , S z and d max combined with 3D scanning technology. A series of finite element numerical simulations were carried out with AFSP based on the cubic-spherical (CS) model and the tetrakaidecahedral (TKD) model, and its deformation characteristics, forming defects and surface quality were analyzed. The validity of the numerical simulation is verified by comparing the normal deviation and surface quality evaluation parameters with the experimental results. Based on reasonable surface quality evaluation parameters, the influence of AFSP geometry parameters on surface quality is further discussed and analyzed. It is found that thicker face sheets and smaller core cells are helpful in improving the surface quality of AFSP.

2. Surface Quality Defect of AFSP in Plastic Forming

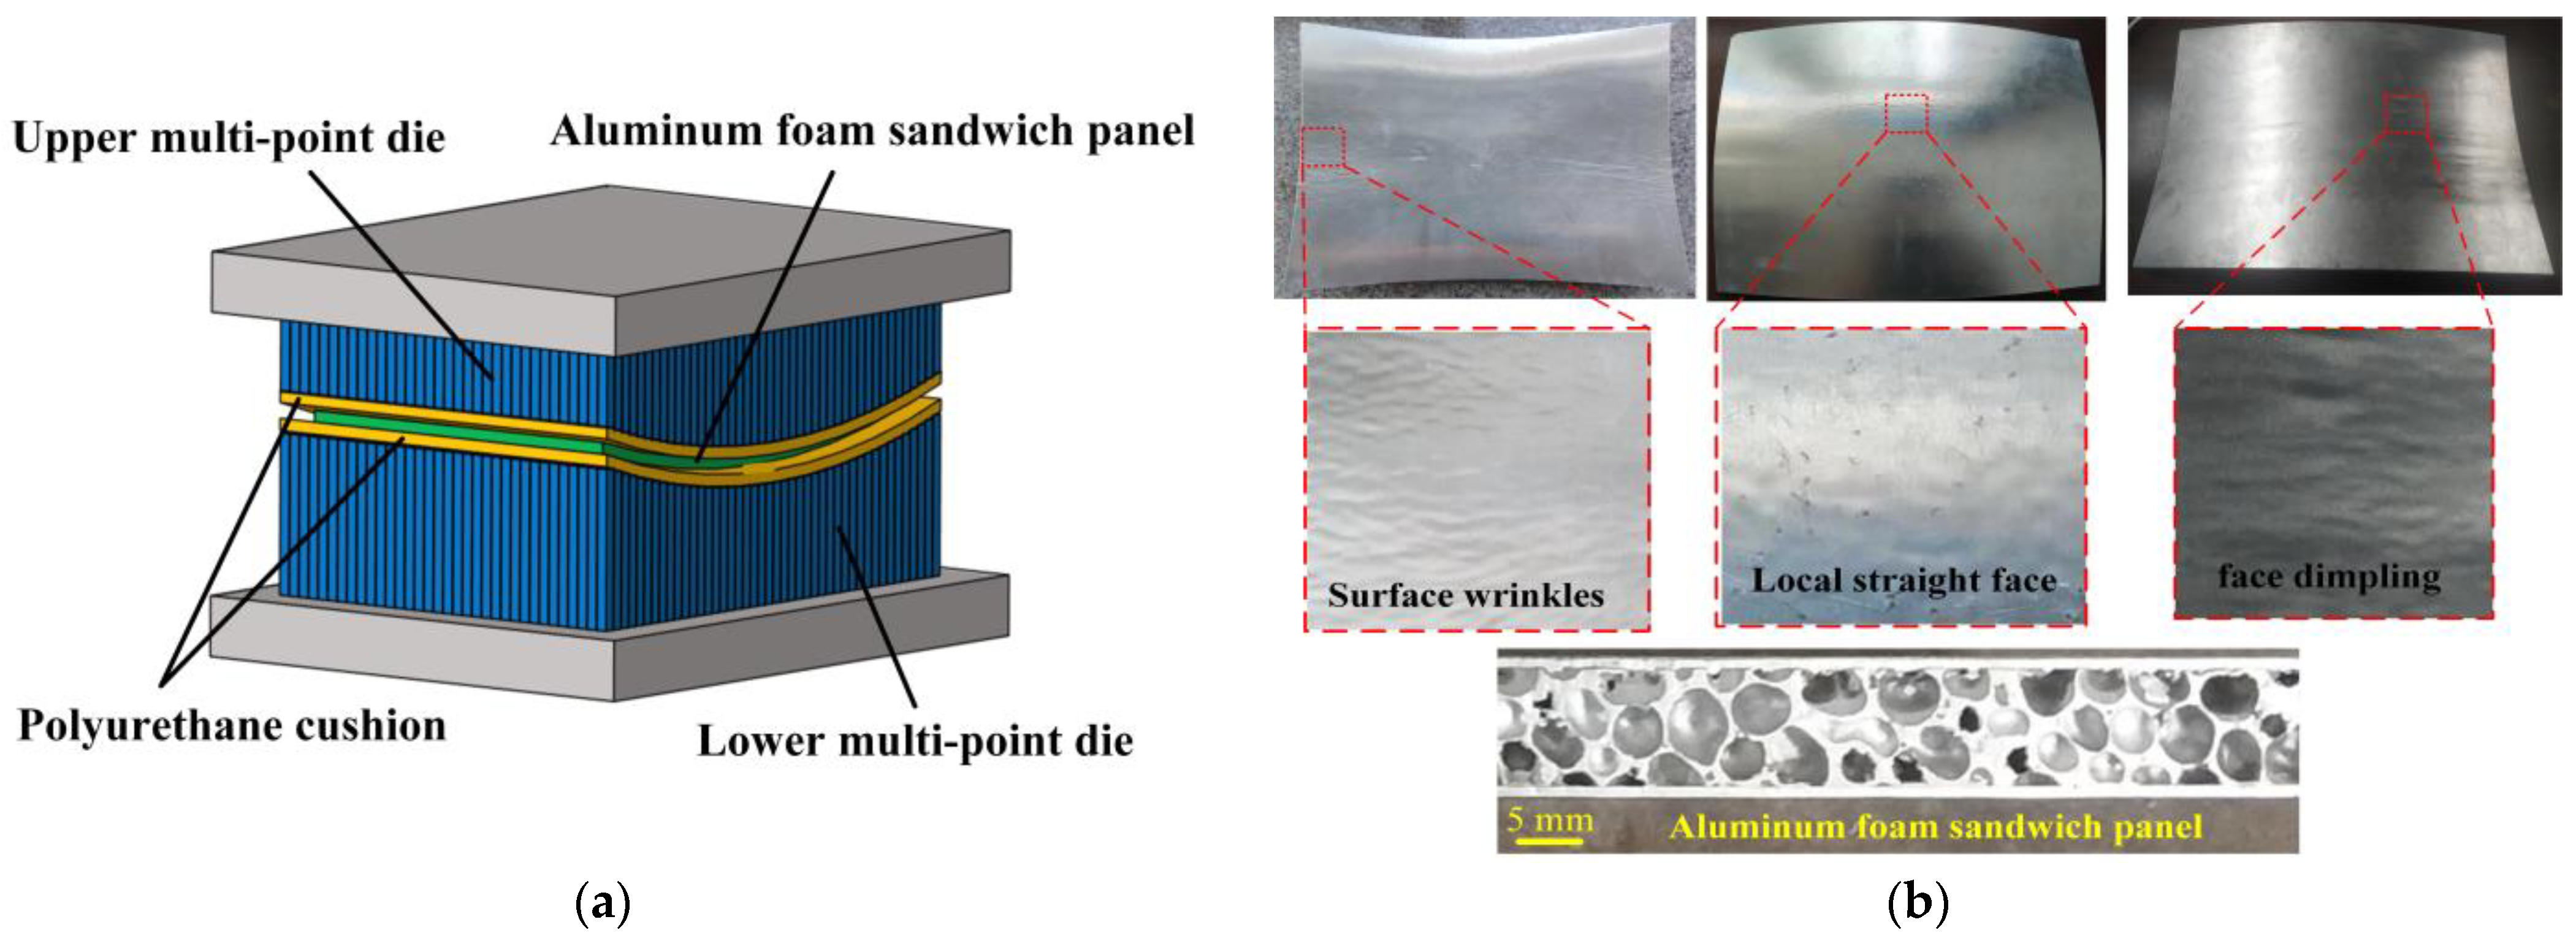
2.1. Plastic Forming of AFSP

In the plastic forming process of AFSP, the core is a porous structure, the strain situation of the face sheet at different positions is different, and the deformation situation is complex, which affects the surface quality of the AFSP. Figure 1a shows the multi-point forming (MPF) of the AFSP.
The main surface defects affecting the surface quality are surface wrinkles, the local straight face effect and surface dimpling. In the process of forming spherical AFSP, the constraints on the thickness direction of the four sides of the upper face sheet are not enough. The upper face sheet of the AFSP bears the compression force in two directions, and the stability of the center of the four sides is easy to lose, resulting in surface wrinkles on the upper face sheet. According to the bending characteristics of the sandwich panel, the lower face sheet of the spherical AFSP bears the tensile force in two directions. These tensions lead to tensile deformation rather than bending deformation in the unsupported area of the lower face sheet, which makes the curvature of the face sheet between the core wall support areas decrease and tend to the plane surface. This phenomenon is called the local straight face effect, which reduces the surface quality of sandwich panels. In the process of forming the saddle-shaped AFSP, the lower face sheet bears the compressive force in one direction and the tensile force in the other direction. Under the effect of the compressive force, the surface dimpling is produced in the unsupported area of the lower face sheet. Figure 1b shows the surface defects produced by AFSP after plastic forming. These surface defects not only affect the appearance of the AFSP, but also reduce the surface strength of the AFSP. Therefore, such surface defects should be avoided in the production process.

2.2. Surface Quality Evaluation of AFSP

In order to produce sandwich panels with excellent surface quality, the surface quality of formed sandwich panels should be evaluated. The traditional evaluation of surface quality relies too much on the technical level and subjective evaluation of the evaluators. This makes the measurement results have certain errors. Furthermore, because of the lack of quantitative evaluation standards, it cannot guide the production of sandwich panels. Therefore, it is necessary to set surface quality evaluation parameters to effectively and accurately quantify the surface quality, which can detect the surface defects of sandwich panels in time, and then guide the production of sandwich panels. It can be seen from the previous analysis that the surface quality of sandwich panels depends on the degree of surface wrinkles, local straight face effects and surface dimpling. Therefore, some indexes need to be set to measure the degree of the above surface defect.
The surface of the sandwich panel with surface defects is rough. In the machining process, three-dimensional roughness parameters were used to evaluate the surface quality [20,21]. Therefore, this paper combines the three-dimensional roughness parameters to evaluate the surface including surface wrinkles and surface dimpling.
Three-dimensional surface roughness parameters include amplitude parameters, space parameters, comprehensive parameters and functional parameters. These parameters have good statistics, small errors, and can be used to evaluate surface quality more comprehensively and accurately [22]. Among them, amplitude parameters are widely used and accurately characterized. The main three-dimensional evaluation amplitude parameters and calculation methods are shown in Table 1.
Equation z = z ( x i , y i ) for the measured surface and z = z b ( x i , y i ) for the reference surface. The normal deviation from the measured surface to the reference surface can be expressed as:
E ( x i , y i ) = z ( x i , y i ) z b ( x i , y i )
In the Table 1, the number of measuring points in x direction and y direction for m x and n y respectively. e p i and e v i are the distance between the five maximum peak heights and the five maximum troughs of the measured surface relative to the reference surface. Based on the above roughness parameters, the target surface was taken as the reference surface to evaluate the surface quality of the formed AFSP. S q can reflect the degree of normal deviation between the measured surface and the reference surface. The larger the S q value, the worse the surface quality of the measured surface. Compared with S q , S z can reflect the characteristics of special points on the surface. The larger the S z value, the worse the surface quality. Select S q and S z to evaluate the surface quality of the AFSP with surface wrinkles and surface dimpling from the perspectives of the whole surface and the special position of the sandwich panel.
In order to calculate these values, it is necessary to obtain the information of the measured surface. For the experimental AFSP, the surface was scanned by a three-dimensional scanner GOM ATOS Q (GOM Co., Ltd., Braunschweig, Germany) with the scanning accuracy of 5–18 μm. In GOM Inspect software 2021 (GOM Co., Ltd., Braunschweig, Germany), we put the scanned point cloud under the Cartesian coordinate system x , y , z and extracted the Cartesian coordinates m i x m i , y m i , z m i of each measuring point i = 1 to n (the number of scanned points). For the numerical simulation results, the node coordinates of the formed AFSP surface were directly extracted. The target surface is obtained by 3D modeling software CATIA V5R21 (Dassault Systemes, Paris, France). The above point cloud data and the geometry of the target surface are imported into the GOM inspect software. After the best fit alignment, the normal deviation between the experimental AFSP and the target surface is obtained. The normal deviation of each measuring point can be obtained in GOM Inspect. The obtained normal deviation is substituted into the calculation equations of S q and S z in Table 1. Furthermore, the values of S q and S z can be calculated. For the local straight face effect of sandwich panels, the three-dimensional roughness parameter cannot reflect the surface defect characteristics, so the maximum distance d max from the measured point to the target surface is selected to represent its degree.

3. Numerical Simulation and Analysis

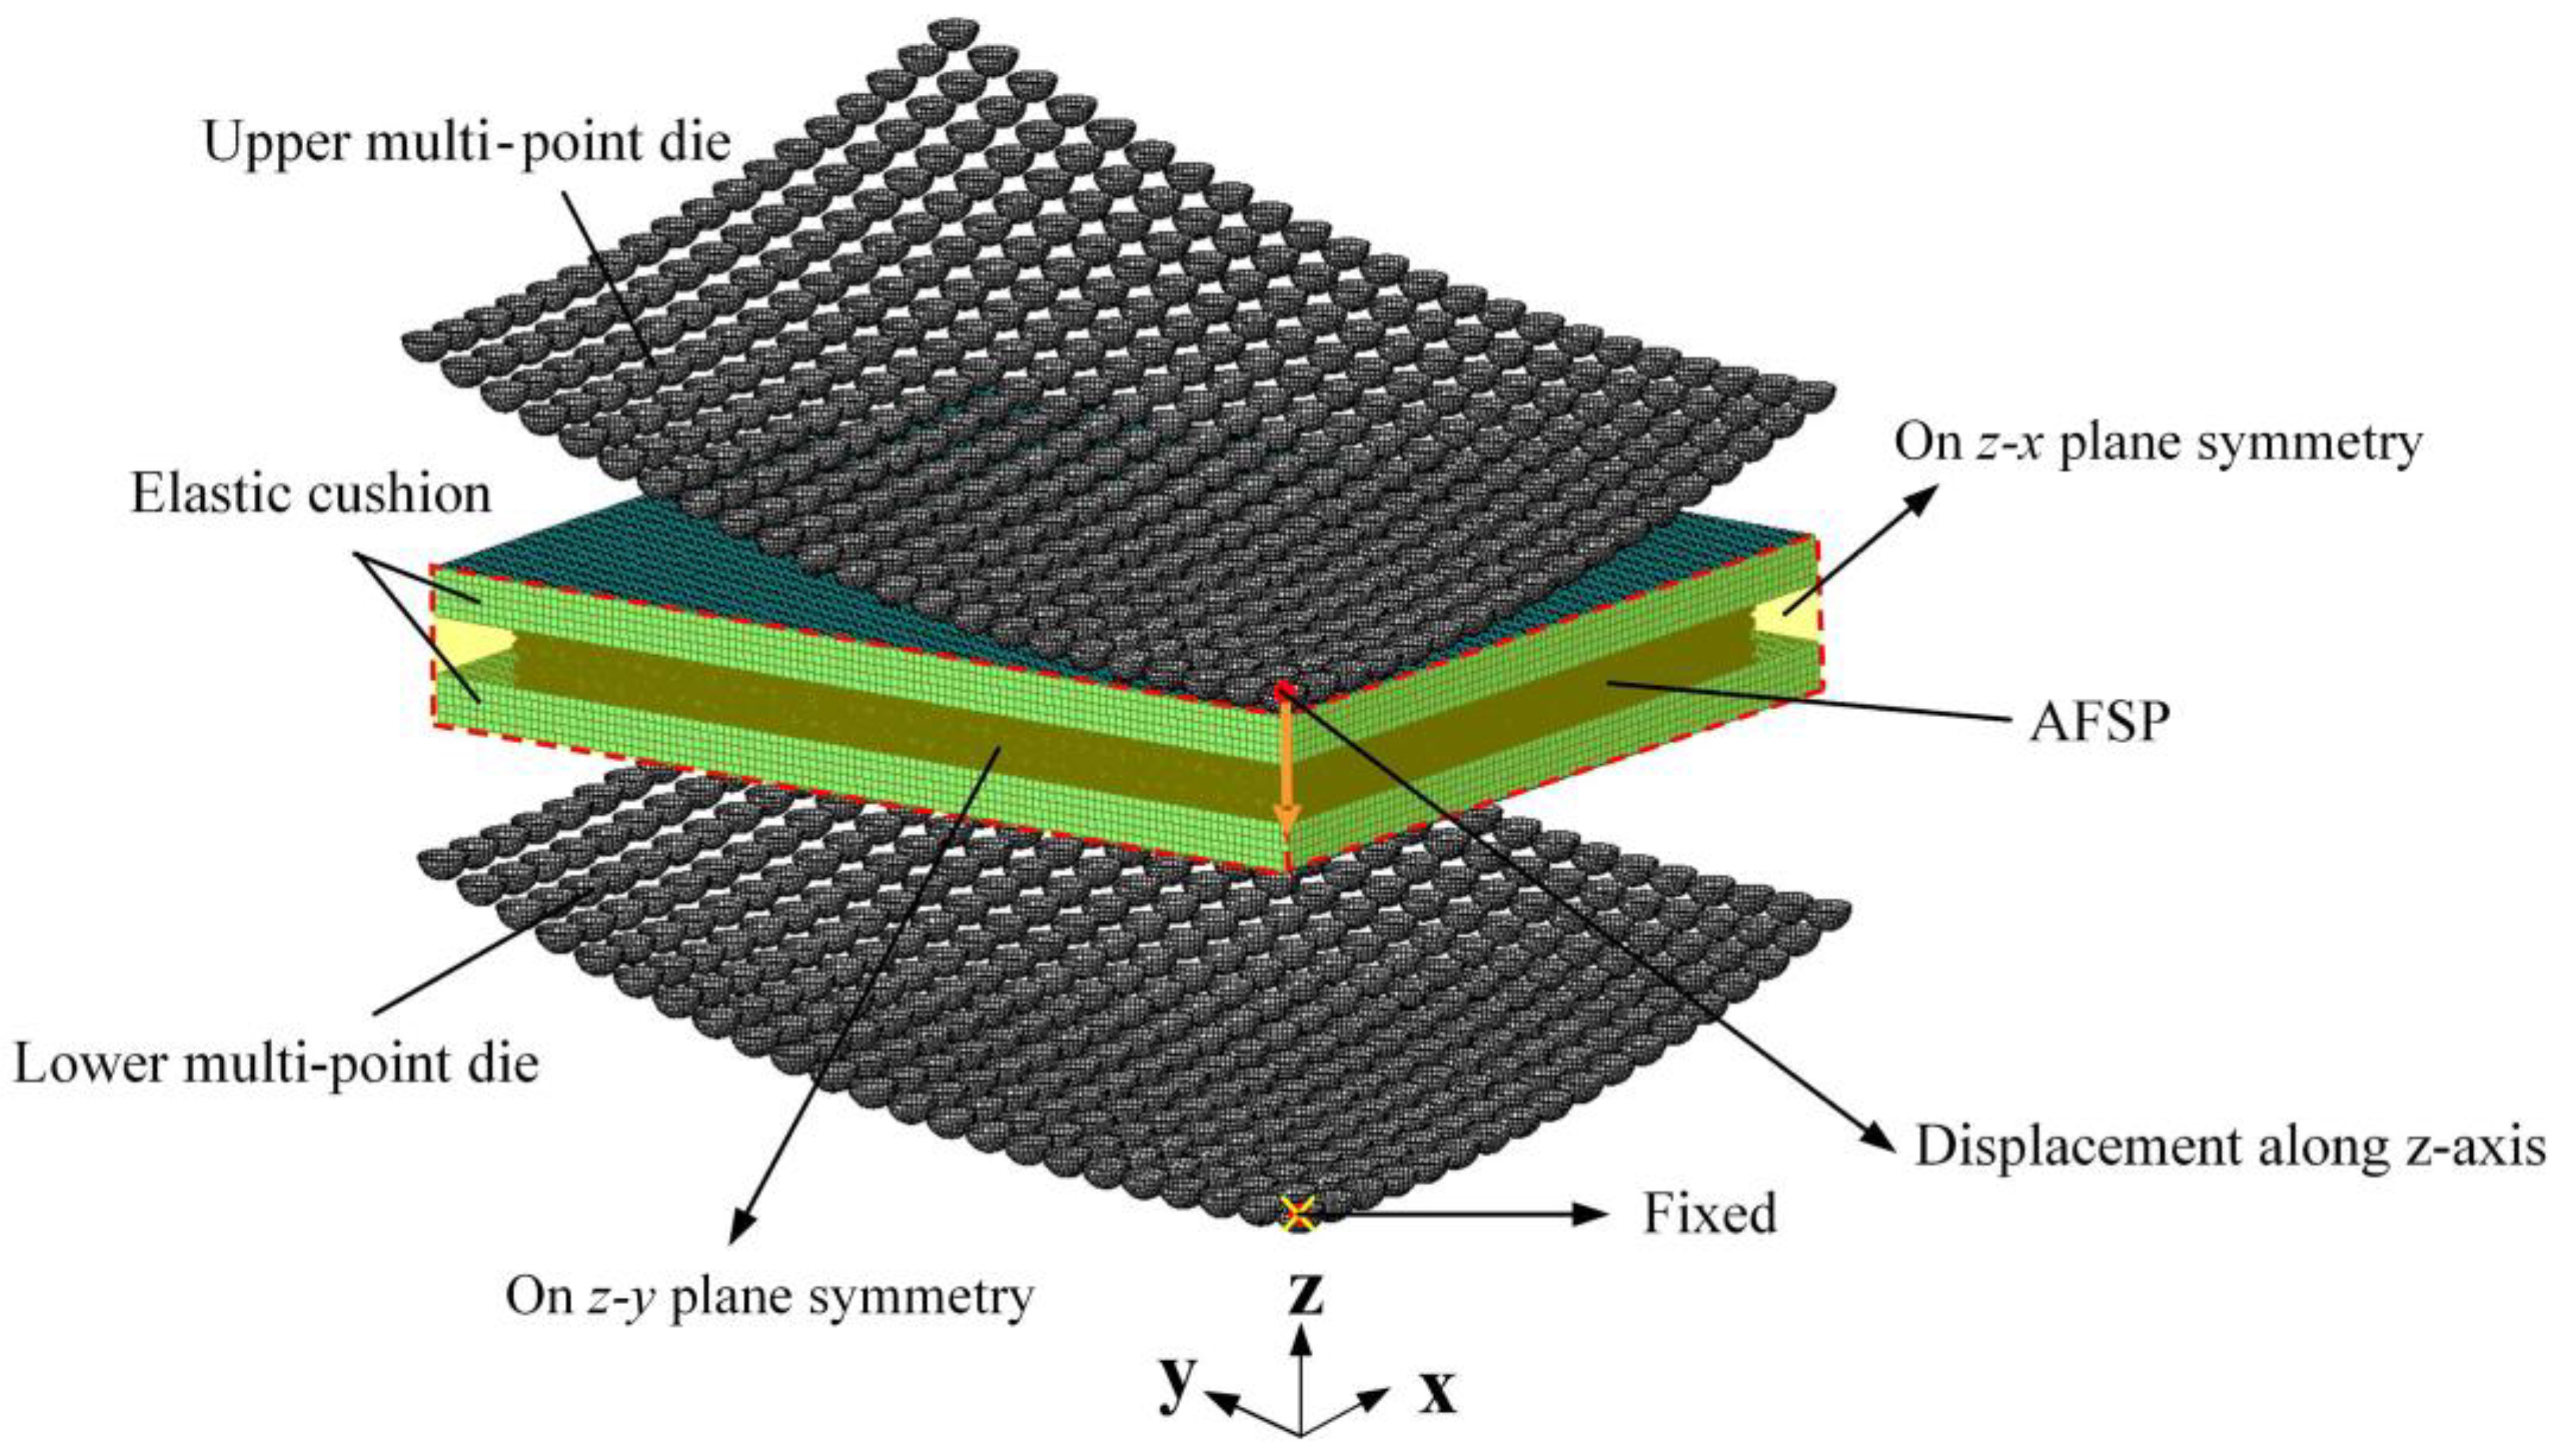
3.1. Finite Element Modeling of MPF

Aluminum foam is a special structure. The size and distribution of the cells are random. The mechanical properties of aluminum foam are closely related to its geometric parameters. The structure of aluminum foam is complex, and there are a large number of curved surfaces and micro cells inside, which leads to the difficulty of the geometric modeling of aluminum foam. It is particularly important to obtain the relationship between the geometric parameters of aluminum foam and its properties through reasonable modeling and numerical simulation. At present, there are primarily four methods for the modeling of aluminum foam. The first method is to build a three-dimensional Voronoi model [23], and the second method is to build a real foam model through X-ray tomography and digital image correlation analysis [24]. The third method is to establish a three-layer equivalent uniform AFSP [25]. The above three methods have problems such as poor calculation efficiency, limited equipment [26], and low accuracy. The fourth method is to establish regular representative volume cells that can reflect the geometric characteristics of aluminum foam. This method can improve the calculation efficiency [27]. At present, the CS cell, octahedron cell, TKD cell [28] and other models have been developed. Among them, CS and TKD models can realistically and effectively reflect the geometric structure of aluminum foam [29]. The sizes of these two representative volumetric elements (RVE) are described below.
For representative volume cells of the CS model and TKD model, they have the same size of l × l × l (mm3). The CS model and TKD model have the same wall thickness t (mm), and the sphere radius in CS model is r (mm). In this paper, the closed cell aluminum foam with a relative density of 0.21 is mainly taken as the research object, assuming that the pores are evenly distributed. The RVE size l is set to 5 mm. Combined with Formulas (2) and (3), the wall thickness t of the CS model and TKD model is calculated as 0.34 mm, and the spherical radius r in the CS model is 1.83 mm [29].
ρ CS 3 t l 3 ( t l ) 2 + 3.1415 t l ( r l ) 2 3.4248 ( t l ) 2 r l + 1.691 ( t l ) 3
ρ TKD 3.3517 t l 3.6976 t l 2
The finite element simulation was carried out by ABAQUS/Standard, and the MPF was carried out by ABAQUS/explicit. The face sheet and core of the AFSP were divided by C3D8R and C3D6 elements. In the thickness direction, the face sheet was divided into four layers, and the polyurethane elastic cushion was divided into four layers by the C3D8R elements. The multi-point die was set as a discrete rigid body, and the R3D4 elements were used for meshing. Because the FE model is symmetric about the z-x plane and the z-y plane, in order to reduce the calculation time, a quarter model sandwich panel was used for modeling. The sandwich panel size is 150 mm × 200 mm × 12 mm, the face sheet thickness is 1 mm, and the face sheet material is 5052 aluminum alloy. It was set as elastic-plastic isotropic hardening. Table 2 shows the detailed data of the face sheet and foam core material. Since there was no delamination between the face sheet and the core during the MPF process, there was no bonding layer between the face sheet and the core, and a tie connection was used. The completed FE model is shown in Figure 2. The multi-point die is controlled by reference point, and the lower multi-point die is fixed while the upper multi-point die displaces negatively along the z-axis. The friction coefficient between the polyurethane elastic cushion and the sandwich panel is 0.1, the friction coefficient between the multi-point die and the elastic cushion is 0.2 [30], the mass scaling coefficient was set to 400 to improve the calculation efficiency, the server CPU is e5-2620v4, and the ram is 32 GB.

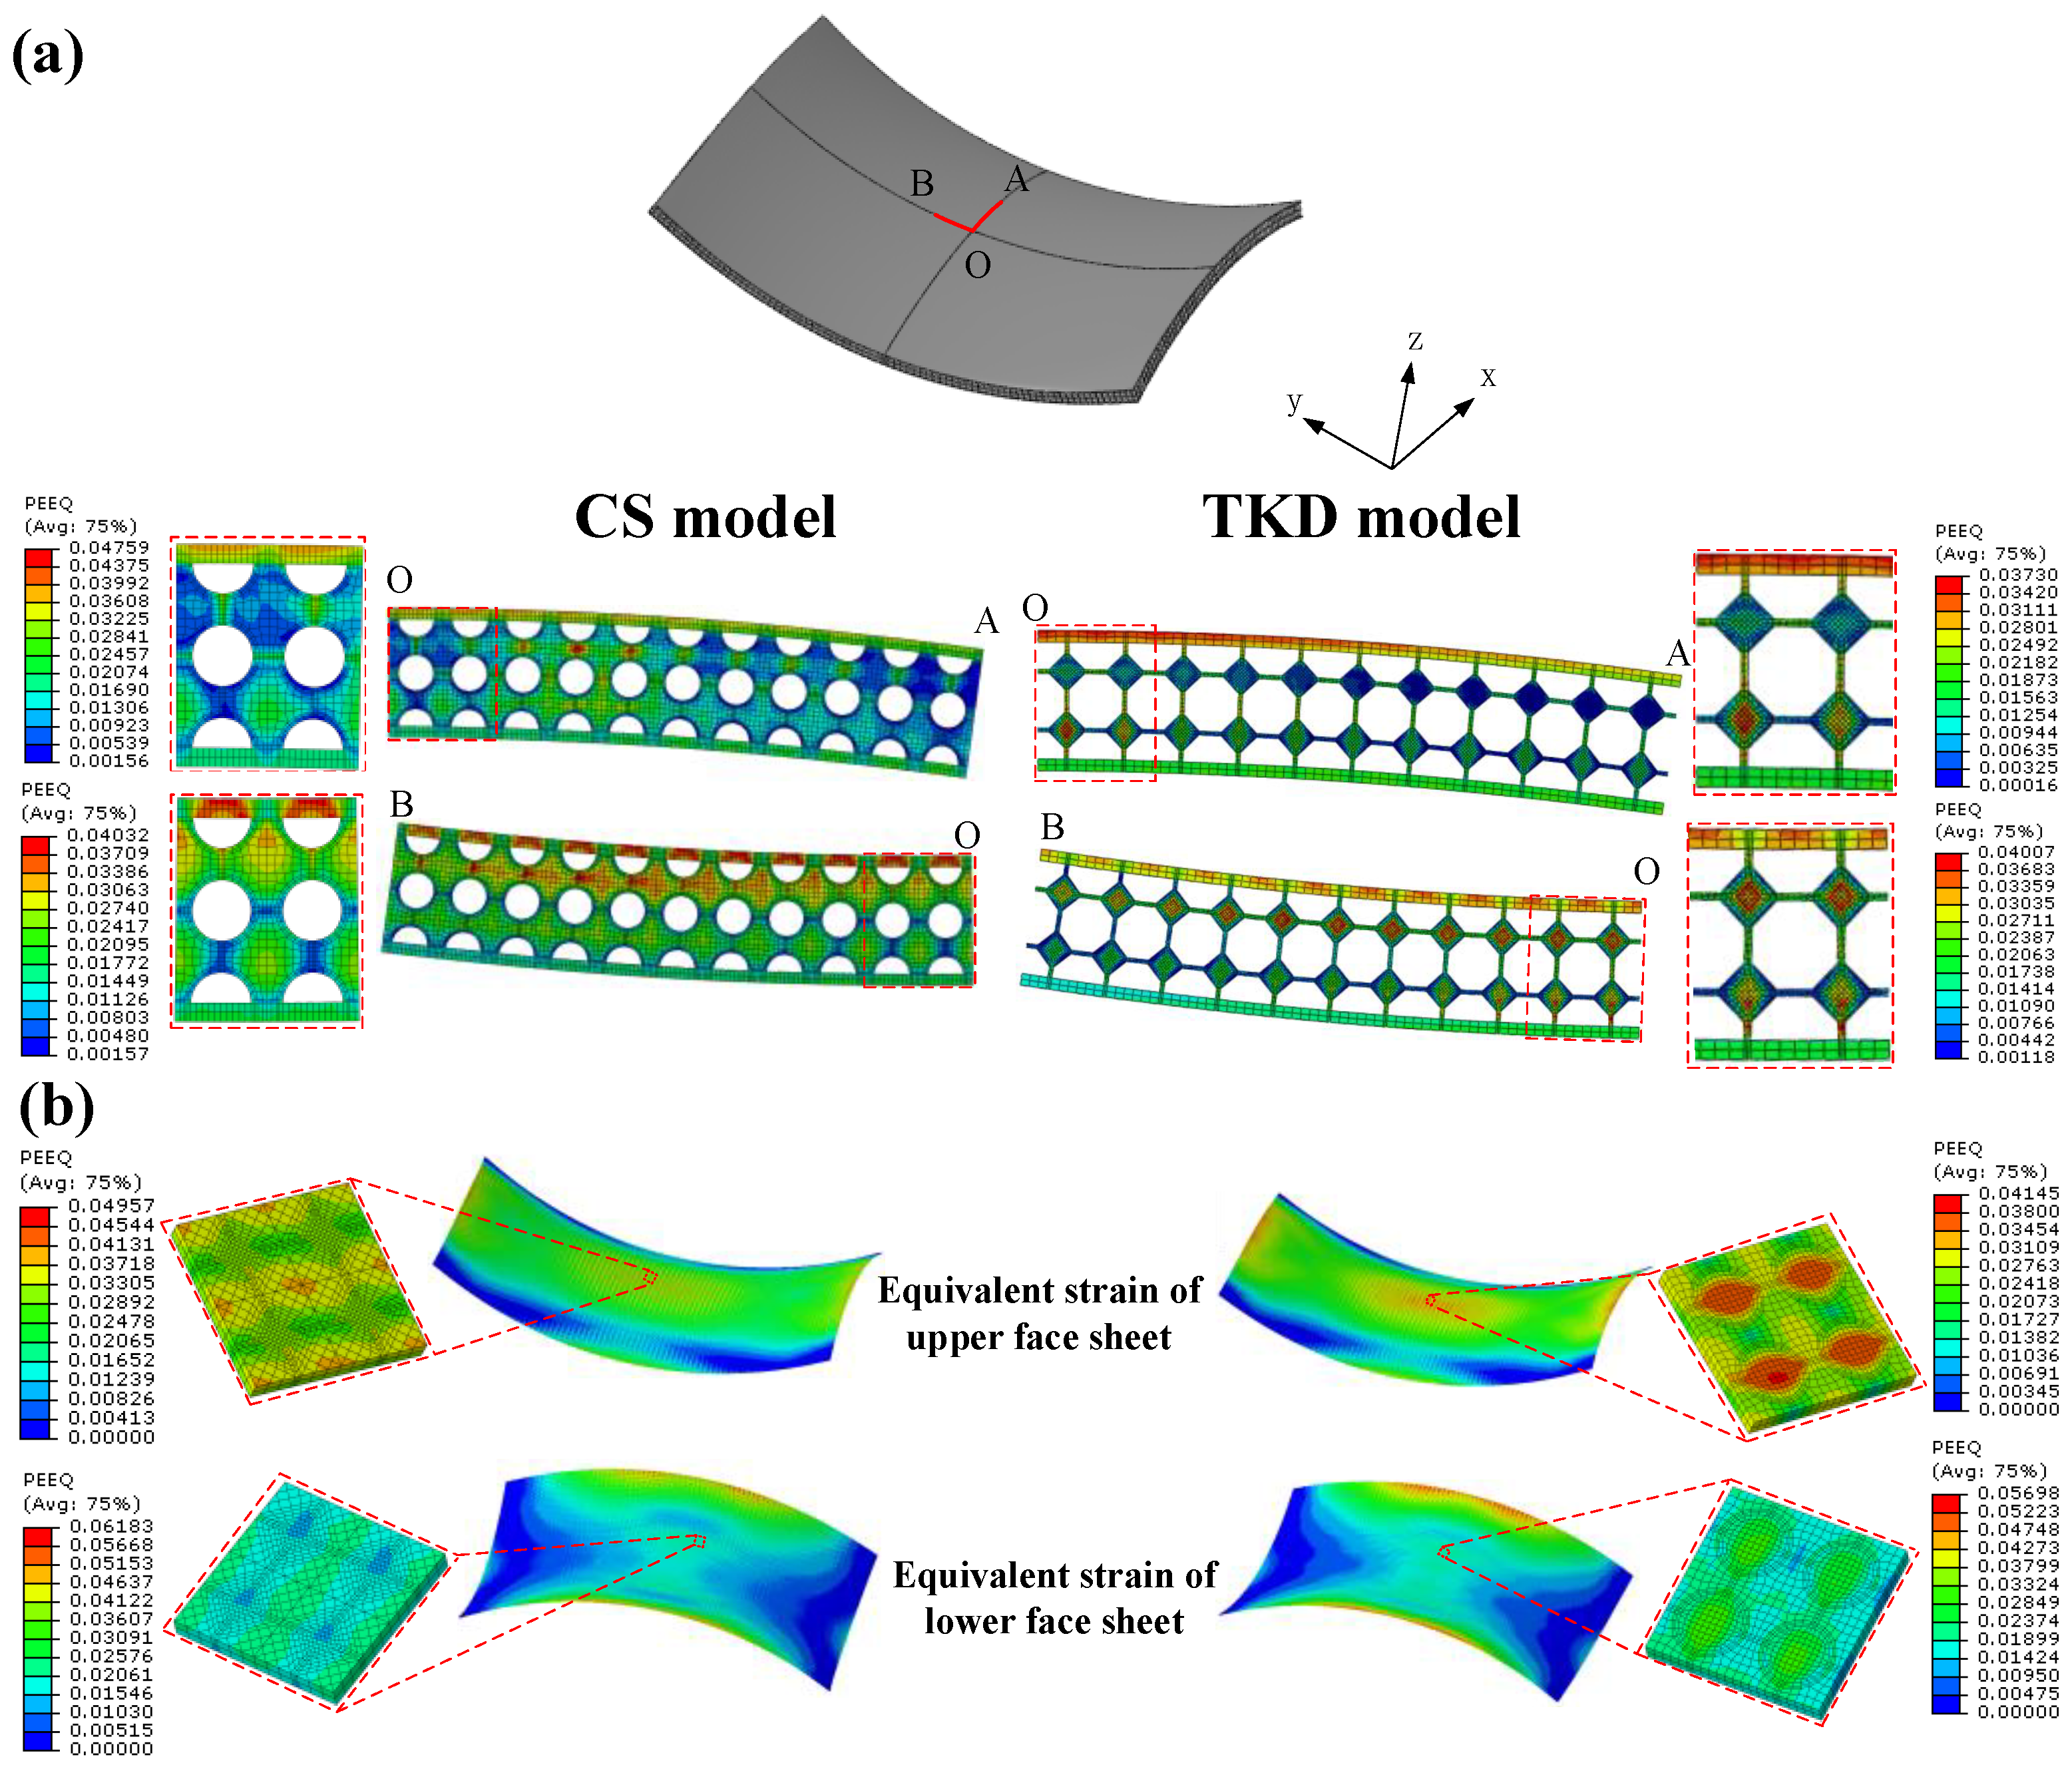
3.2. Strain Analysis of Spherical and Saddle-Shaped AFSPs

The sandwich panel is different from the single-layer metal panel. The complexity of the core structure makes the deformation of the sandwich panel complex in the plastic forming process. In order to understand the strain distribution of the AFSP during MPF, AFSPs of the CS model and TKD model with a spherical target radius of 400 mm were simulated. Figure 3a shows the equivalent strain of the spherical AFSP along the cross sections of the symmetric planes OA and OB. The strain of the upper face sheet is smaller than that of the lower face sheet. Due to the support effect of the core wall, the equivalent strain of the unsupported area is larger than the equivalent strain of the supported area, which indicates that the unsupported area is more prone to instability. It can be found from OA and OB that the farther away from the central region, the larger the equivalent strain. The equivalent strain in the x direction is higher than the equivalent stress in the y direction, which indicates that the deformation in the x direction is larger in the spherical forming process. As shown in Figure 3b, from the whole face sheet, the strain distributions in CS and TKD models are basically the same. The deformation of the upper face sheet is mainly concentrated in the middle of the boundary, while the deformation of the lower face sheet is mainly concentrated in the middle of the face sheet and the middle of the boundary. The area with larger values of these equivalent strains has larger deformation, which easily produces surface defects and reduces the surface quality. The maximum equivalent strain on the face sheet of the CS model is slightly larger than that of the TKD model.
Figure 4a shows the equivalent strain of AFSP with a saddle-shaped target radius of 400 mm along symmetry planes OA and OB. It was found that the equivalent strain of the upper face sheet is larger than the equivalent strain of the lower face sheet. The equivalent strain of the face sheet in the unsupported area is also lower than that in the supported area. Figure 4b shows that from the perspective of the whole face sheet, the large equivalent strain is mainly concentrated in the center of the shorter edge of the upper face sheet, the center of the lower face sheet and the longer edge. The maximum equivalent strain of the lower face sheet is larger than the maximum equivalent strain of the upper face sheet. This means that the lower face sheet is more prone to large deformation. The maximum equivalent strain of the CS model is larger than that of the TKD model. We selected the face sheet in the range of 2 × 2 core cells in the center area of the lower face sheet. It was found that the large equivalent strain is distributed in the unsupported area. Compared with the face sheet of spherical AFSP, the equivalent strain of the face sheet of saddle-shaped AFSP is small.

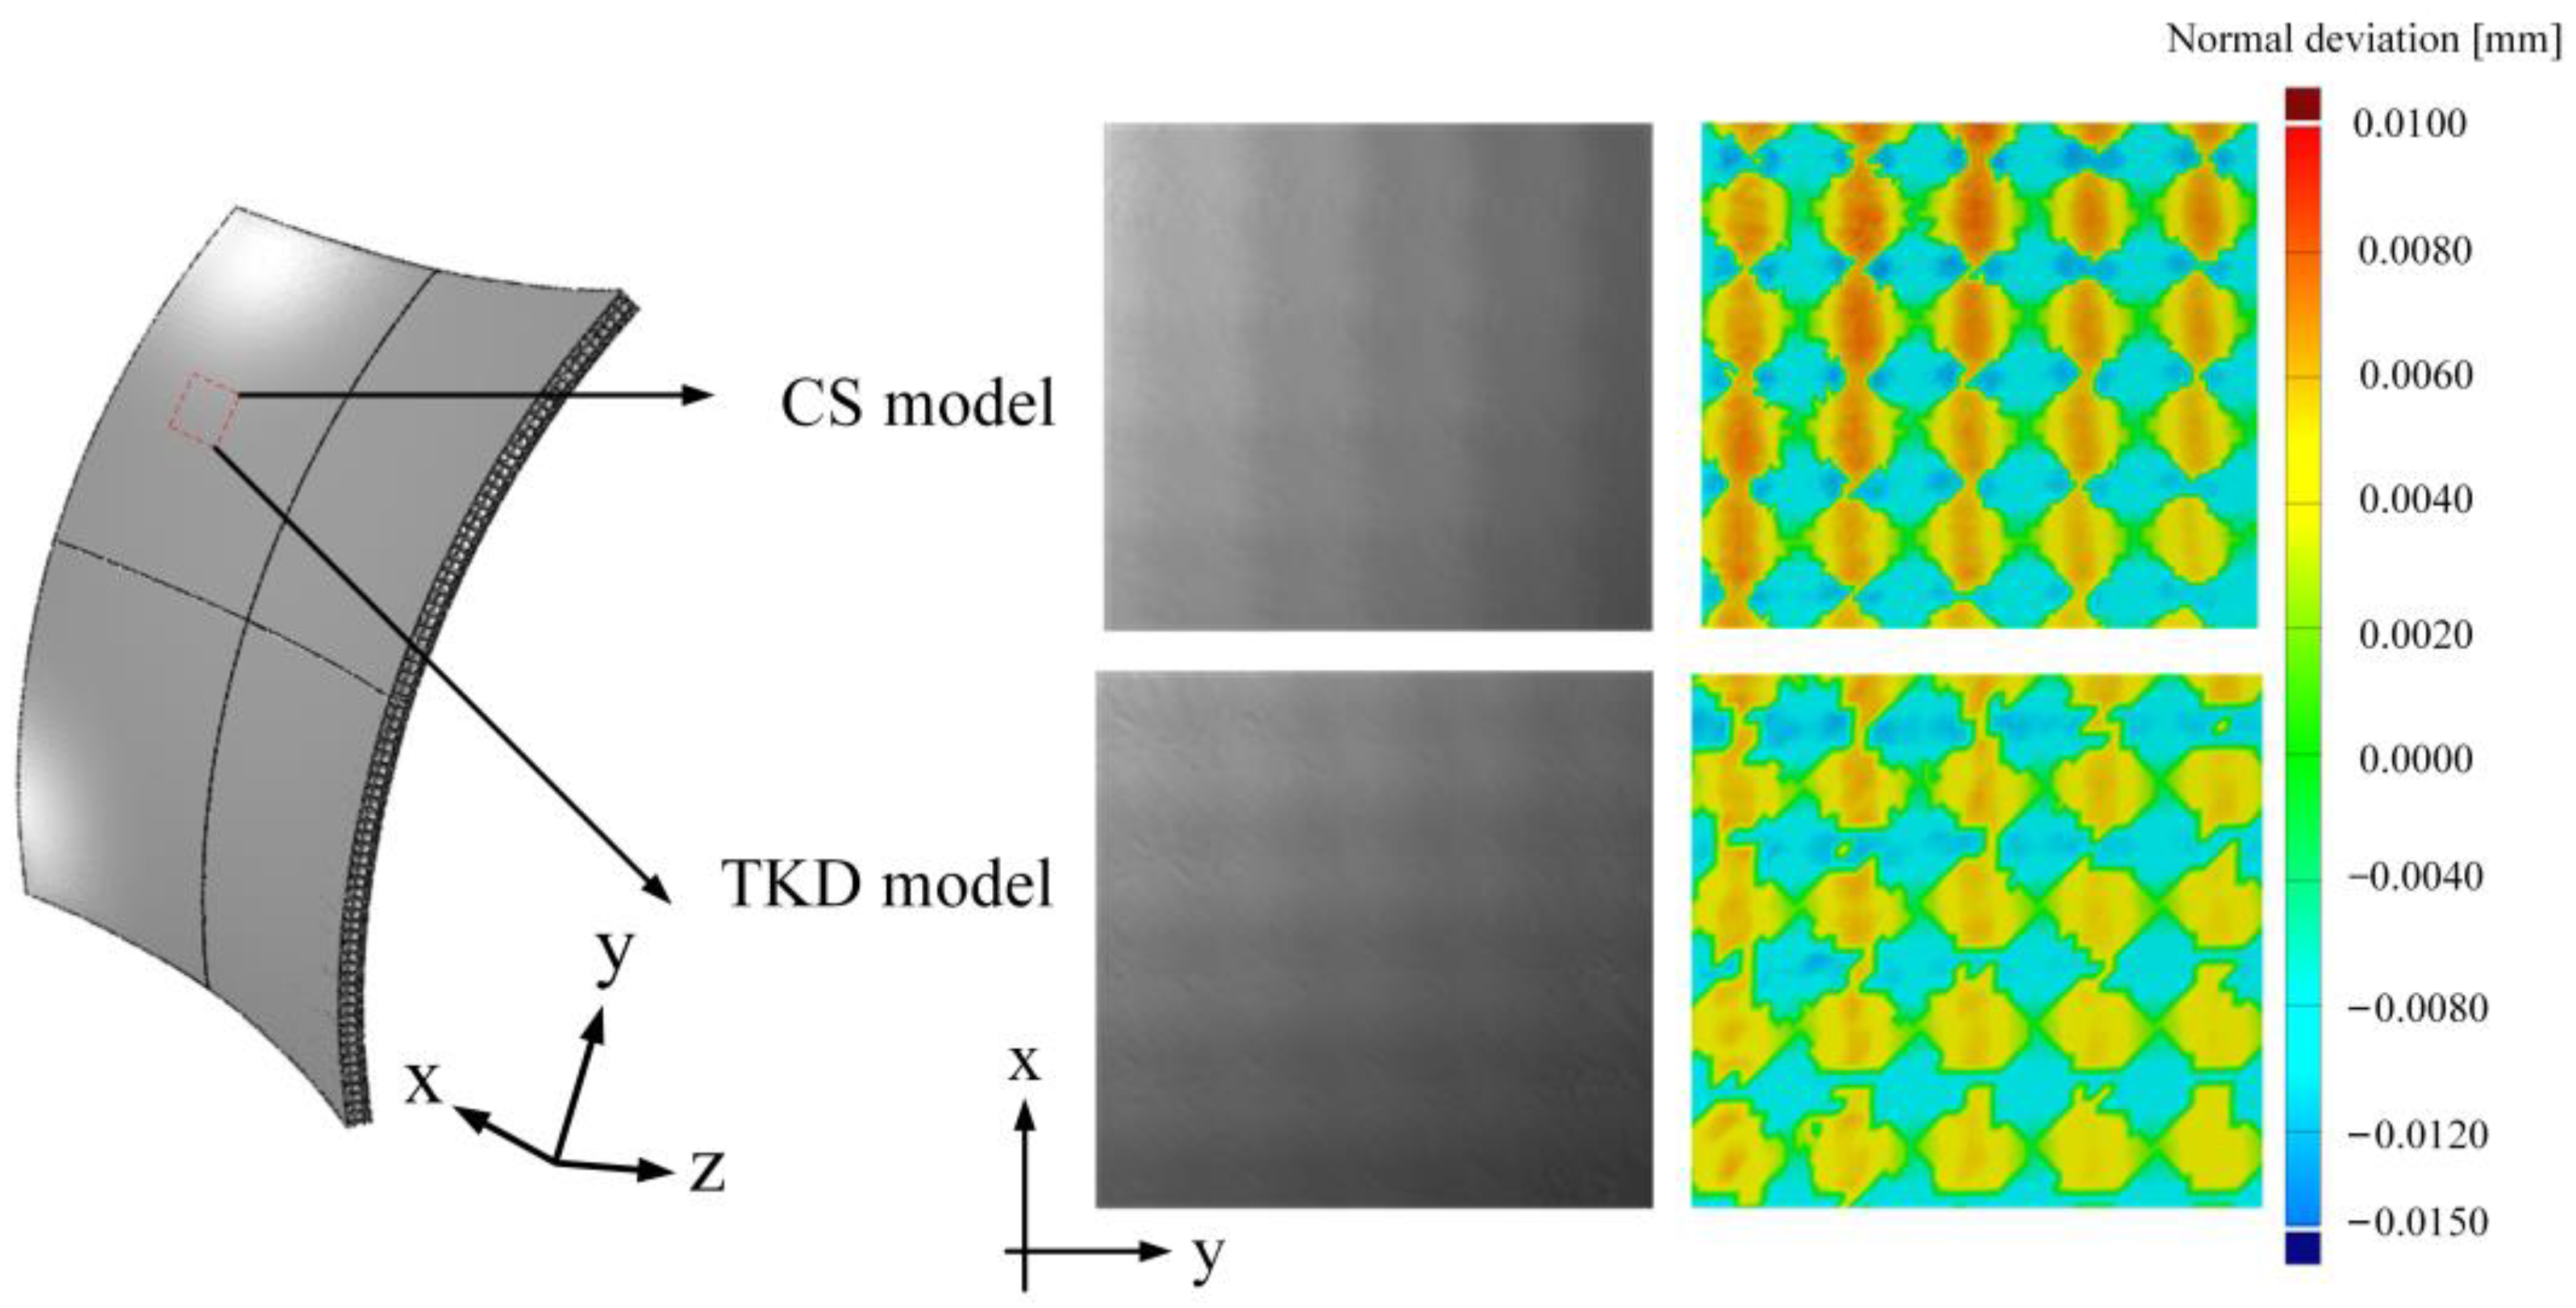
3.3. Surface Defects of Numerical Simulation

In the forming process of sandwich panels, most of the surface wrinkles occur at the edge of the face sheet under compressive force. In the CS model and TKD model with a spherical target radius of 400 mm, the upper face sheet bears the compressive force. From the strain analysis, it can be seen that the equivalent strain value at the edge center of the upper face sheet is large, and it is easy to lose stability.
We set the distance away from the short edge boundary to d. Figure 5b shows the position of profile lines on the face sheet. The profile lines were extracted along the x direction at the position d = 0 mm, 2.5 mm, 10 mm, 12.5 mm, 20 mm, 20.5 mm, 40 mm and 40.5 mm from the short edge boundary. From Figure 5a, the surface wrinkles at the center of the short side edge can be found. This place mainly bears the compression force in the x direction. It can be seen from Figure 5b that the dimpling occurs in unsupported areas, which lacks constraints in the out of plane direction. When these dimpling are connected with each other, surface wrinkles perpendicular to the short edge boundary are formed. The closer to the middle area of the upper face sheet, the less obvious the surface wrinkles. Figure 5b shows that when the distance from the short edge is less than 42.5 mm, the surface wrinkles can be found. The farther away from the short edge boundary, the less obvious the surface wrinkles are.
Figure 6 shows the lower face sheet with an AFSP spherical target radius of 400 mm. It can be found that in the CS and TKD models, the surface of the central area of the lower face sheet is not smooth. According to the bending characteristics of sandwich panels, in the process of spherical forming, the lower face sheet is subjected to two-way tensile force. The unsupported area lacks the normal support of the core wall in the forming process. The supported area at the edge of the unsupported area generates bending moments and tensile forces on it. The reverse bending moments generated by the tensile forces can offset part of the spherical forming bending moments, which causes the bending deformation of the unsupported area to decrease, and tensile deformation occurs. Finally, the lower face sheet had a local straight face effect. It can be seen from the above analysis that the local straight face effect cannot be completely eliminated, but the serious local straight face effect belongs to the forming defect, so the defect degree should be reduced as far as possible.
The distance away from the y-axis was set to s. At the position s = 0 mm and s = 2.5 mm from the y axis, the profile line was extracted along the y direction. The local straight face effect appears in the unsupported area of the lower face sheet. The lower face sheet in the support area can fit the target surface. The unsupported area of the lower panel tends to be straight. The farther away from the central area, the weaker the local straight face effect is.
Figure 7 shows the saddle-shaped AFSP with a target radius of 400 mm. The lower face sheet of saddle-shaped AFSP bears tension in the y direction and compression in the x direction. This opposite force makes the saddle-shaped sandwich panel less deformed than the spherical sandwich panel. However, there are some surface defects when the bending deformation is large. It can be seen from the illumination maps that the surface of the lower face sheet is not smooth and there is surface dimpling. We compared the lower face sheet surface with the target surface to obtain the normal deviation diagram. It can be found that there is surface dimpling that is not connected with each other on the surface of the lower face sheet. This surface defect is caused by the compression force. The unsupported area is sunken towards the core direction, while the face sheet in the supported area is relatively stable with small normal deviation.

4. Experimental Verification and Parameter Analysis

In order to verify the results of numerical simulation, the multi-point spherical and saddle-shaped forming experiments of AFSPs were carried out. During the forming of AFSP, the surface defect was closely related to the geometric parameters of the AFSP. In this section, numerical simulation was used to study the AFSP forming with different face sheet thickness and core cell size, and explored the relationship with surface defects. Detailed geometric parameters of the AFSP are shown in Table 3.

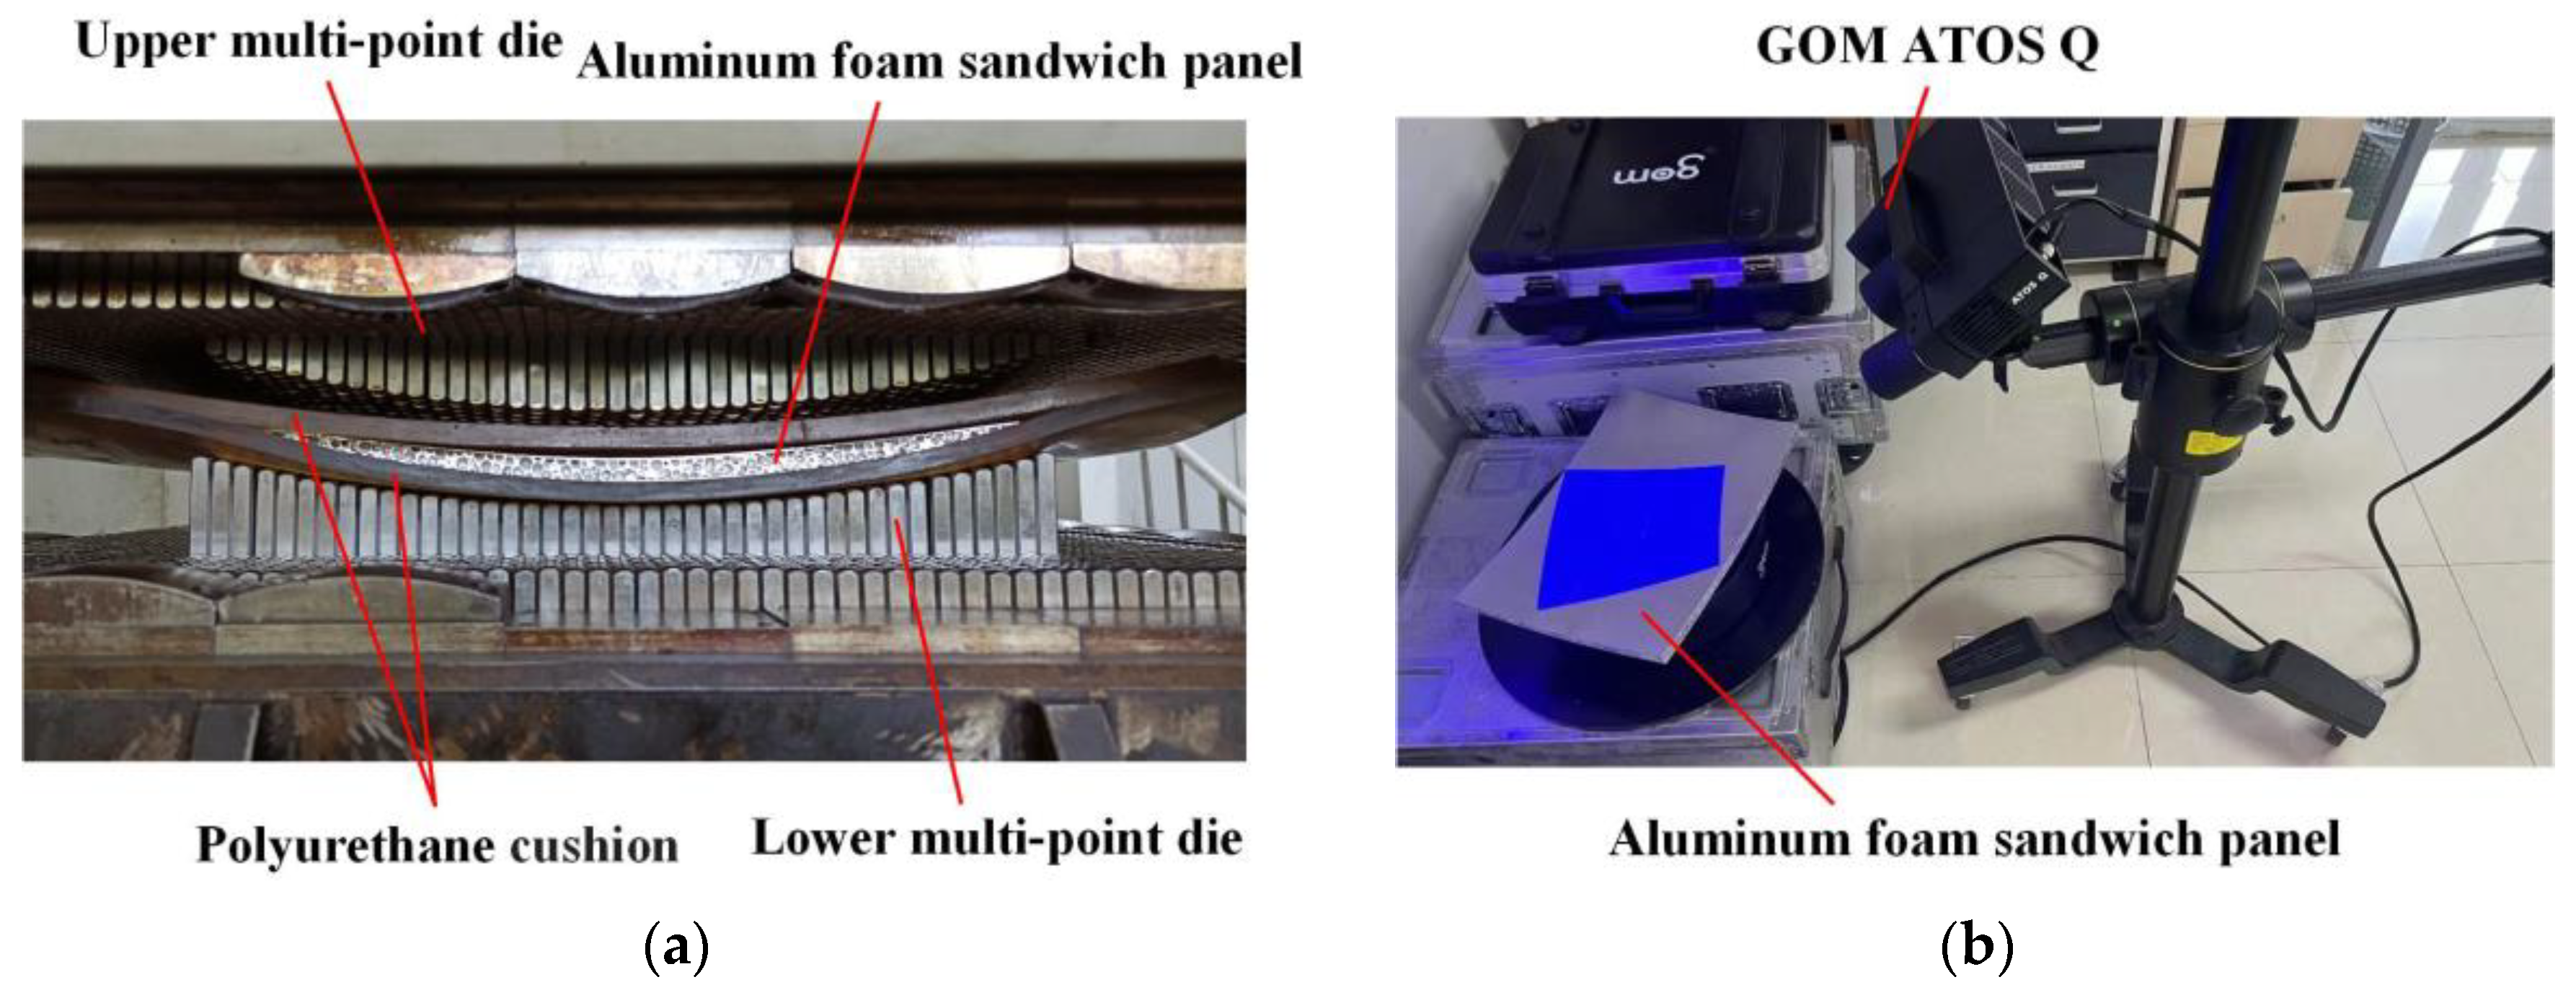
4.1. MPF and 3D Scanning Equipment

MPF is a flexible and adjustable die forming method for metal sheets. The regular punches arranged by CAD/CAE/CAM software can form dies of different shapes, which is simple to operate and low in cost [31]. Figure 8a shows the MPF experiment of AFSP with a spherical target radius of 400 mm. The upper and lower dies are composed of 42 × 32 rectangular punch elements, and each punch size is 10 mm × 10 mm. The AFSP used in the experiment were supplied by Yuan Taida New Material Co., Ltd. (Guangyuan, Sichuan, China). Aluminum foam with a density of 0.57 g/cm3 was fabricated by the melt foaming method, and then AFSP with a size of 400 mm × 300 mm × 12 mm was formed by hot-pressing the bonding 5052 aluminum alloy face sheet with a thickness of 1 mm. The foam core thickness is 10 mm. A 10 mm thick polyurethane cushion was added between the multi-point die and the AFSP.
Figure 8b shows the 3D scanning process of GOM ATOS Q. The collected point cloud data was then denoised. The point cloud of the experimental part was compared with the target surface, and the real normal deviation value was obtained.

4.2. Comparison between Simulated and Experimental Results

Figure 9a shows the upper face sheet with a spherical target radius of 600 mm, and there are obvious surface wrinkles along the y direction at the short edge of the boundary. From the 3D scanning diagram in Figure 9a, it can be found that the instrument can sufficiently scan the surface wrinkles of the AFSP. The reason for this phenomenon is that the face sheet at the short edge boundary is compressed in the x direction. The foam core wall is connected with the face sheet, and the material in this area is thickened with less deformation. However, due to the lack of normal support, the face sheet located at the pore hole is more likely to deform and produce dimpling. When these face dimpling are connected due to deformation, surface wrinkles along the y direction appear.
Figure 9b shows the normal deviation of experimental results and numerical simulation. The measured area is shown in Figure 9a. The normal deviation shows the degree of surface wrinkles. The darker the color is, the larger the surface wrinkle is. The normal deviation of the CS model and the TKD model is similar to the experimental results. Compared with the CS model and the TKD model, the surface wrinkling distribution of experimental results is more random. The reason for this phenomenon is that the size and distribution of the pores in the aluminum foam are random, which leads to a wide range of changes in the normal deviation of the experimental AFSP. Compared with the normal deviation of the target radii at 600 mm and 400 mm, the normal deviation of the target radius at 400 mm is larger, which indicates that the surface quality of the face sheet on the AFSP becomes worse when the target radius is reduced.
Figure 10a shows the lower face sheet of the 600 mm AFSP with the spherical target radius. 3D scanned images correspond to its surface characteristics, and it can be found that the AFSP in the center area of the lower face sheet is not smooth. Without the support of the core wall, the unsupported areas of the lower face sheet cannot reach the target surface, and these areas cannot be completely deformed and bent. If the area with core wall support can fit the target surface, “bulges” will be formed. There is a local straight-face effect between the various “bulges” in the unsupported area, and the normal deviation is large.
Figure 10b shows the experimental and simulated results of the normal deviation of the lower face sheet of the spherical AFSP with a target radius of 600 mm and 400 mm in the range selected in the red box of Figure 10a. The results of normal deviation show that in the “bulge” area, the lower face sheet fits well with the target surface, while in the area with a local straight face effect, there is a large normal deviation. The normal deviation area of the experimental AFSP is larger and its distribution area is wider. The reason is that compared with the CS model and TKD model, the experimental aluminum foam has uneven pore size, and the face sheet in the area with large pore size is prone to lose stability, and surface defects are more serious. The simulation results also correspond to the experimental results. On the other hand, when the target radius is 400 mm, the normal deviation of the experimental results and the simulation results both show more serious normal deviation. In general, increasing the degree of deformation will increase the normal deviation. The CS model and TKD model can sufficiently represent the normal deviation distribution and degree of experimental AFSP.
In order to visually compare the surface quality of the numerical simulation AFSP with that of the experimental AFSP, the spherical and saddle-shaped AFSPs with target radii of 600 mm and 400 mm were formed by taking the experimental AFSP size parameters as an example. We compared S q , S z and d max of the measured area within the red box selection range. The size of the red box selection range is 50 mm × 50 mm, as shown in Figure 11d. In Figure 11a, we can find that the value of S z is always larger than S q , because the deviation of the extreme point is calculated by S z itself. As the deformation degree required is larger and the surface quality is worse when forming the spherical AFSP, the surface quality evaluation parameters S q the S z , and d max of the spherical AFSP are always larger than those of the saddle AFSP. From the analysis of equivalent strain in Figure 4b, the surface of the saddle-shaped AFSP is subject to tensile force in one direction and compressive force in the other. These two opposite forces make the sandwich panel deform evenly, which is conducive to improving the surface quality. Similarly, from Figure 11b,c, we can find that when the target radius is 400 mm, the trend of the results is the same as that of the target radius of 600 mm, and the value of the surface quality evaluation parameter is always larger than the target radius of 600 mm, which corresponds to the normal deviation results in Figure 9b and Figure 10b, indicating that the surface quality becomes worse when the target radius is reduced. In addition, from Figure 11a–c, it can be found that, compared with the CS model, the TKD model is closer to the experimental AFSP in terms of S q , S z and d max . The numerical simulation results can better correspond to the results of MPF experiments and verify the validity of the numerical simulation results.

4.3. Parameter Analysis

4.3.1. Influence of Face Sheet Thickness

The thickness of the face sheet has an important relationship with the surface quality of the AFSP. In order to analyze the influence of upper face sheet thickness on AFSP surface quality, other geometric parameters remain unchanged. Numerical simulation of spherical AFSP with a target radius of 400 mm were carried out for AFSP with an upper face sheet thickness of 0.5 mm, 0.75 mm, 1.25 mm and 1.5 mm. The thickness of the upper face sheet is defined as t1.
Figure 12a,b show the numerical simulation results for different upper face sheet thicknesses. For the CS model, the profile line and equivalent strain 2.5 mm from the center of the shorter edge are extracted. For the TKD model, the profile line and equivalent strain 0 mm from the center of the shorter edge are extracted. The equivalent strain of the upper face sheet with different thickness is located at the trough of the curve in the support area, with the same distribution. In the unsupported area, the equivalent strain is sensitive to the thickness change of the face sheet. When the face sheet is thin, the equivalent strain rises sharply. Therefore, the equivalent strain curve of thin face sheet changes greatly, while the equivalent strain distribution curve of the thick face sheet is relatively flat. By observing the profile lines of face sheets with different thicknesses, it can also be found that when the thickness of the upper face sheet is 0.5 mm, AFSP shows serious surface wrinkles, corresponding to the peak of the equivalent strain curve. With the increase of the thickness of the upper face sheet, the degree of surface wrinkle and equivalent strain decreases and the profile lines tends to be smooth. When the thickness of the upper face sheet is less than 1.25 mm, there will be obvious surface wrinkles in the unsupported area, and the corresponding equivalent effect changes greatly. When the thickness of the upper face sheet is 1.5 mm, the profile line tends to be smooth at the peak of the equivalent strain curve, and there is no surface wrinkle. This shows that surface wrinkling can only occur under a certain degree of deformation.
Similarly, compare S q and S z on the 50 mm × 50 mm surface within the red box selection range mentioned above. Figure 12c shows that the S q and S z values of the TKD model are larger than those of the CS model. The thickness of the face sheet increases from 0.5 mm to 1 mm, and decreases significantly and slowly from 1 mm to 1.5 mm. This shows that the surface quality of the sandwich panel becomes better with the increase of the thickness of the upper face sheet.
In order to analyze the influence of the lower face sheet thickness on the local straight face effect of AFSP, the AFSP with a spherical target radius of 400 mm is taken as an example, and the lower face sheet thickness is adjusted to 0.5 mm, 0.75 mm, 1 mm, 1.25 mm and 1.5 mm. Figure 13a shows that d max decreases gradually with the increase of lower face sheet thickness. This shows that with the increase of the thickness of the lower face sheet, the lower face sheet can fit the target surface more closely, and the local straight face effect is reduced. In the range of 0.5 mm lower face sheet thickness to 1.5 mm lower face sheet thickness, the d max of TKD model is always larger than that of CS model. This is consistent with the result trend in Figure 11. The AFSP with a target radius of 400 mm on the saddle-shaped surface was then simulated, and the thickness of the lower face sheet is 0.5 mm, 0.75 mm, 1 mm, 1.25 mm, and 1.5 mm. It can be seen from Figure 13b that the thickness of the lower face sheet and the surface dimpling have an impact on the surface quality. When the thickness of the lower face sheet is larger than 0.5 mm, S q and S z decrease and the surface quality was improved. Figure 13c shows the equivalent strain of the face sheet within the range of 5 mm × 5 mm for AFSPs with different lower face sheet thicknesses. It can be found that in the CS model and the TKD model that the equivalent strain of the unsupported area is obviously larger than the equivalent strain of the supported area, and the surface dimpling occurs easily. And with the increase of the thickness of the face sheet, the equivalent strain decreases, and the difference between the supported area and the unsupported area also gradually decreases. To sum up, with the increase of the thickness of the lower face sheet, the degree of local straight face effect and surface dimpling defects decreases. When the thickness of the face sheet increases from 0.5 mm to 1.5 mm, the values of S q and S z of the lower face sheet of the saddle-shaped AFSP are smaller than those of the upper face sheet of the spherical AFSP.

4.3.2. Influence of Core Cell Size

The area of the unsupported area can be changed by changing the size of the core cell, which greatly affects the deformation degree and surface quality of the AFSP. Taking AFSP with 2.5 mm, 5 mm and 10 mm core cell size as an example, an AFSP with a spherical and saddle-shaped target radius of 400 mm was simulated. The size of the core cell is indicated by C.
Figure 14 shows the equivalent strain results at the short edge boundary of the spherical AFSP. The equivalent strain of the face sheet in the unsupported area is larger than the equivalent strain of the face sheet in the supported area. In the unsupported area of 2.5 mm to 10 mm core cell size, the equivalent strain at the red dot in the CS model increased by 0.020, and the equivalent strain increased by 0.032 in the TKD model, with obvious surface wrinkling. This also means that the equivalent strain of the unsupported area increases with the increase of the core cell size. From the analysis in Figure 12a,b, it can be seen that the increase of the equivalent strain of the unsupported area leads to the unsmooth profile line of the corresponding area and large surface wrinkles. This seriously reduces the surface quality of AFSP. From the deformation results, the deformation of the TKD model is larger than that of the CS model. This is because the contact area between the TKD model core and the face sheet is smaller than that of CS model core within the range of unit core cell size. This relates to the core structure being modeled.
Figure 15 shows S q , S z and d max under different core cell sizes. With the increase of core cell size, these values also increase significantly, and the surface quality of the AFSP decreases. In the upper face sheet of spherical TKD model AFSP, the S q of 10 mm core cell size is 4.39 times the 2.5 mm core cell size. In the lower face sheet of the saddle-shaped TKD model AFSP, the S q of 10 mm core cell size is 1.95 times of 2.5 mm core cell size. Similarly, this value is 3.26 times and 2.63 times in the spherical CS model AFSP and saddle-shaped CS model AFSP, respectively. It shows that the increase of core cell size has a larger impact on the surface quality decline in the spherical AFSP. In conclusion, reducing the core cell size is conducive to improving the surface quality.

5. Conclusions

Based on the CS model and the TKD model of the foam core, the finite element model of AFSP was established, and MPF experiments were carried out. The surface quality of AFSP after plastic forming was quantitatively evaluated by 3D scanning technology. The surface quality of AFSP with different face sheet thicknesses and core cell sizes is studied by numerical simulation and the following conclusions are drawn:
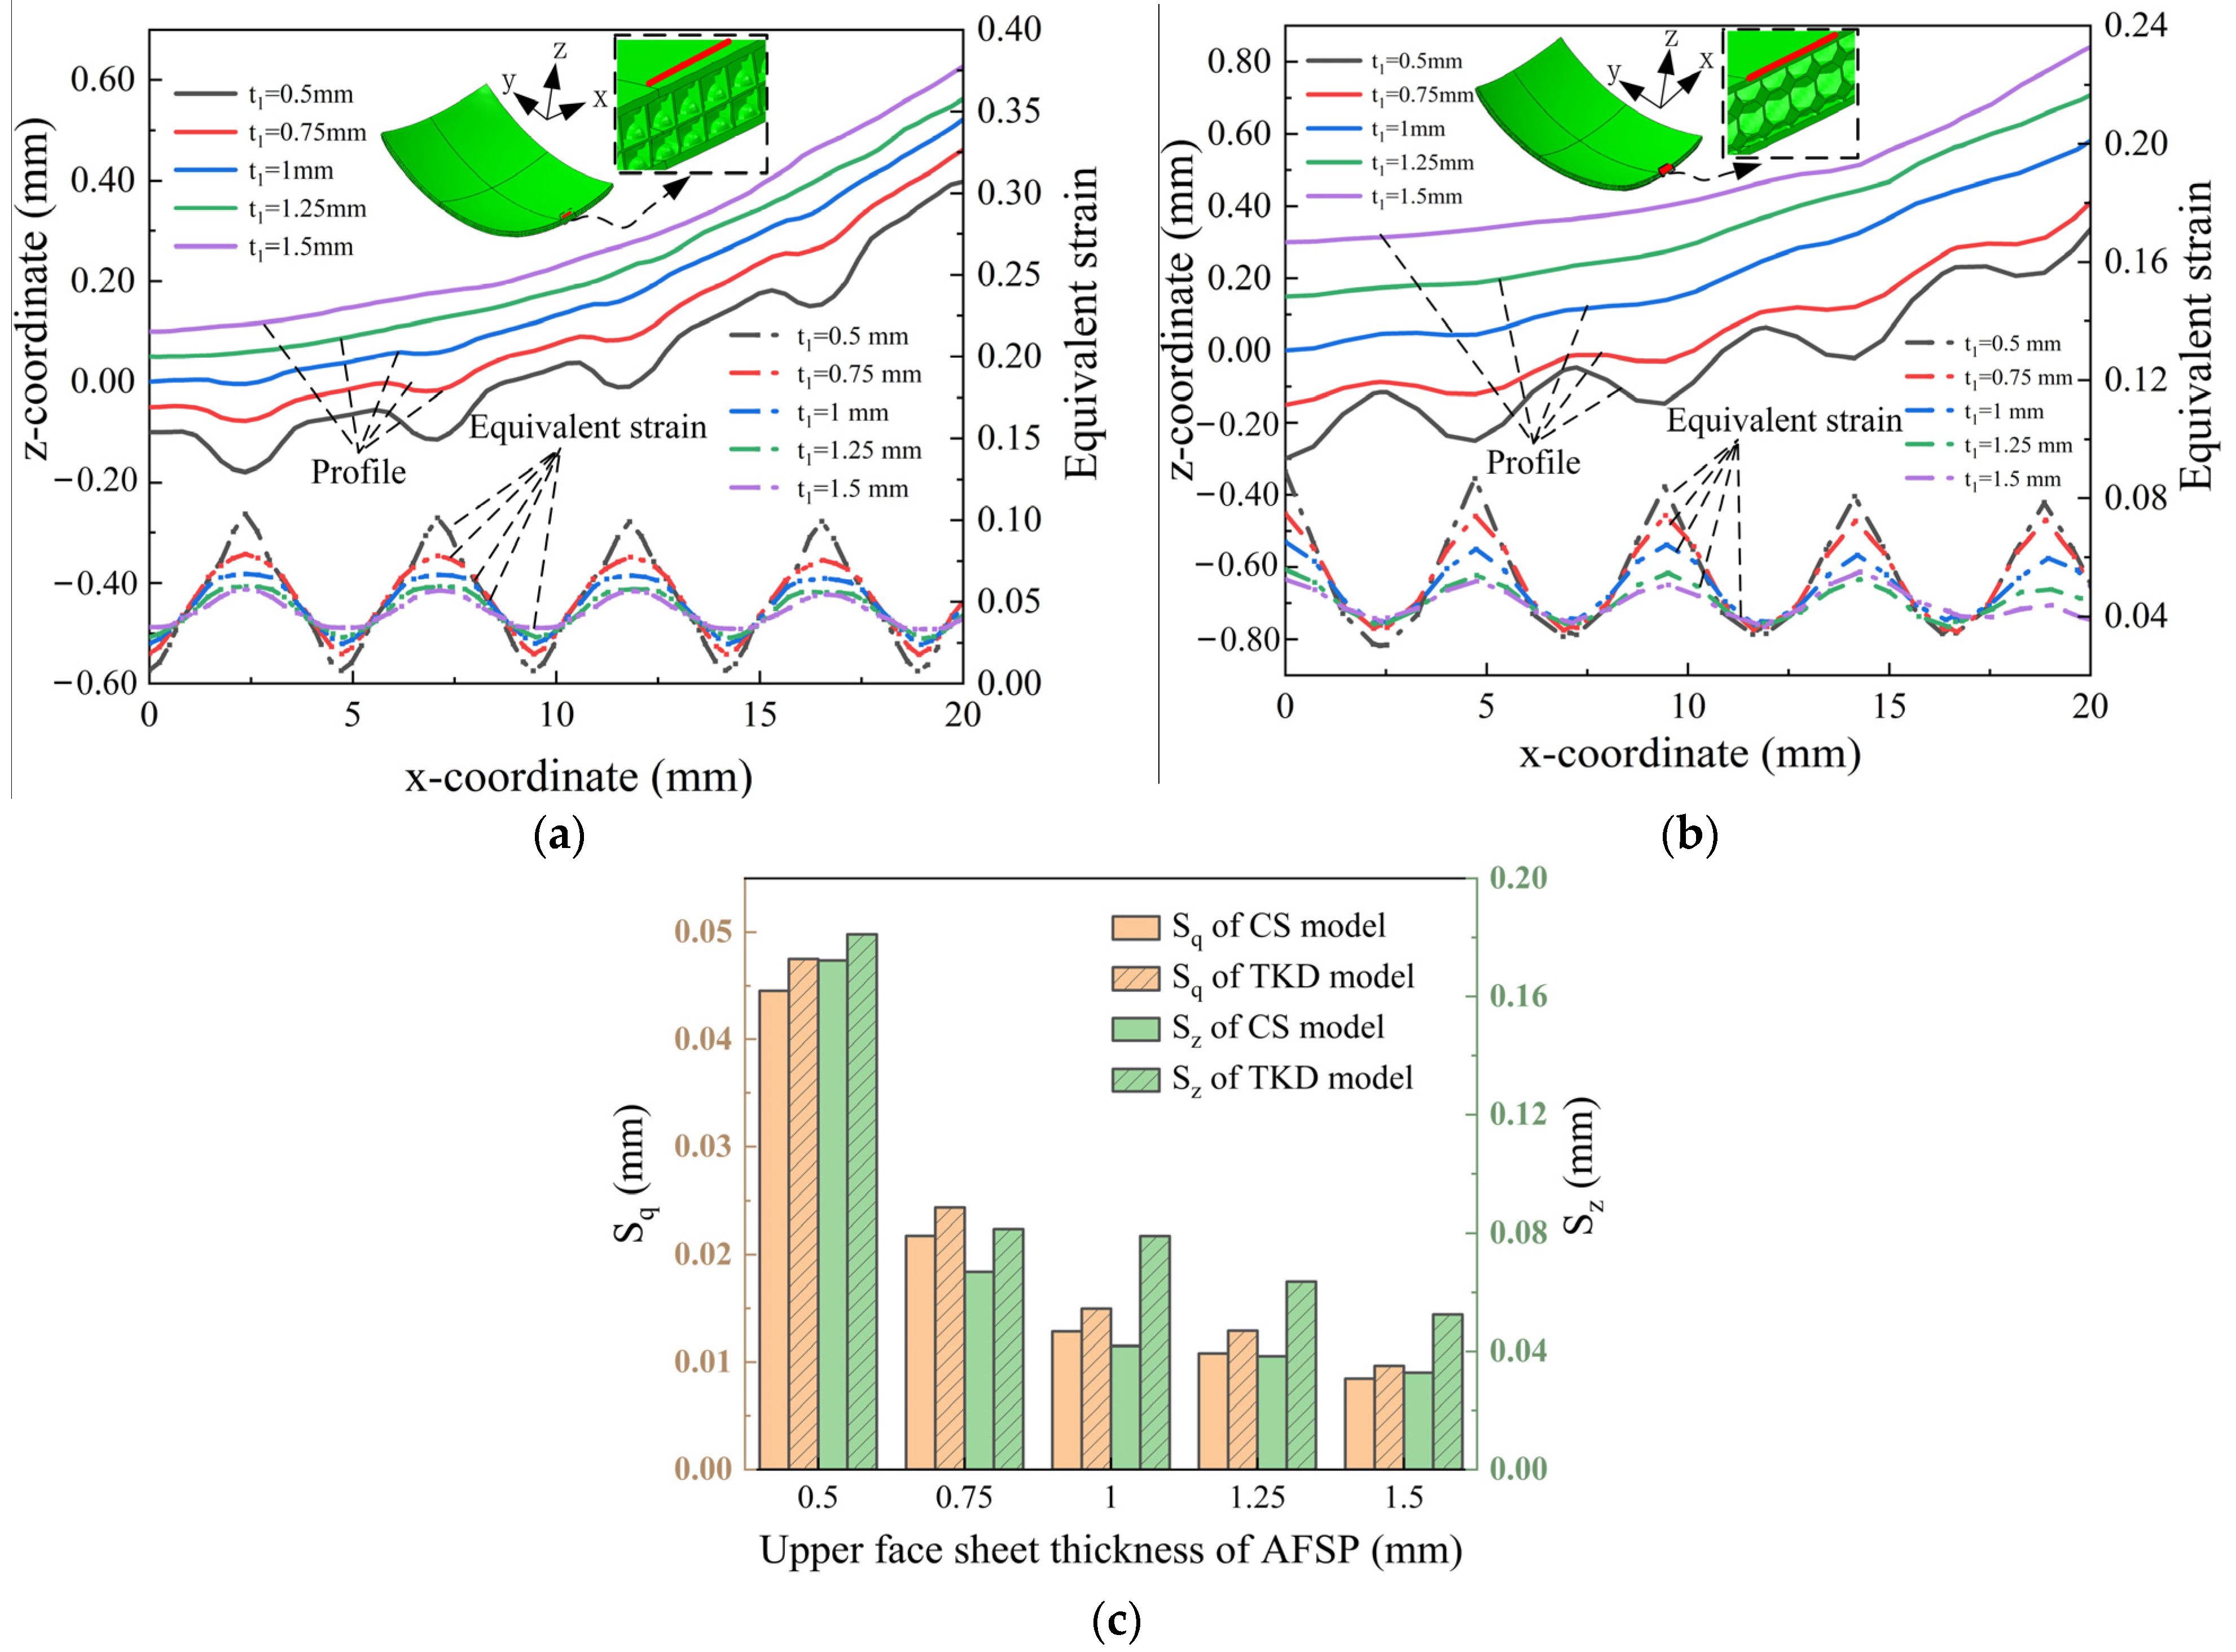
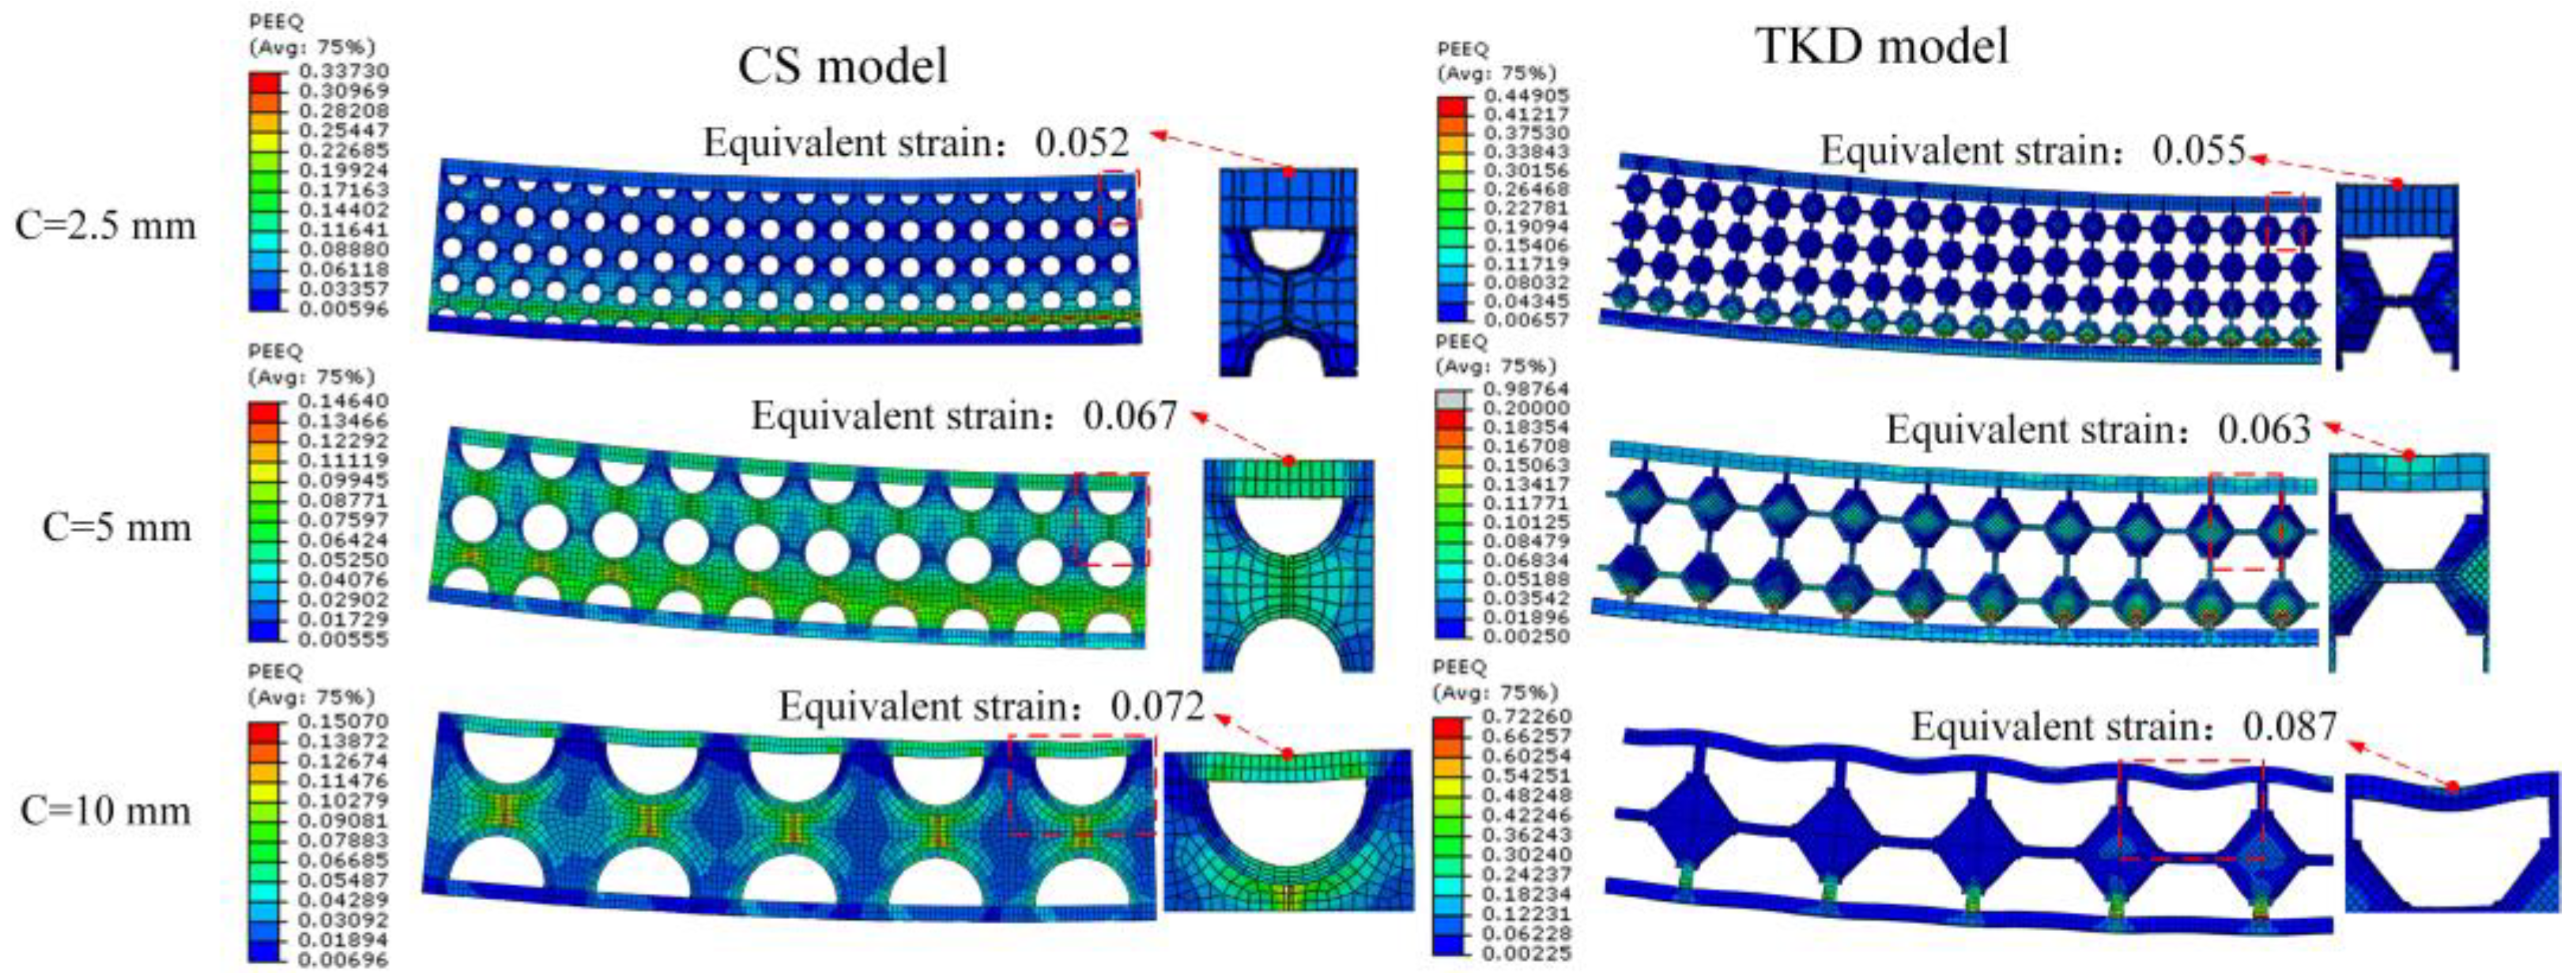
  • In AFSP plastic forming, the distribution of the AFSP equivalent strain of the CS model and the TKD model shows a similar trend. The equivalent strain of the face sheet in the pore area is larger than that of the face sheet with core wall support. When forming spherical AFSP, the strain of the upper face sheet subjected to biaxial compression force at the four edges is large, and the strain of the lower face sheet subjected to biaxial tension force at the center is large. When forming saddle-shaped AFSP, there are large equivalent strains in the four boundary and central regions of the upper and lower face sheet.
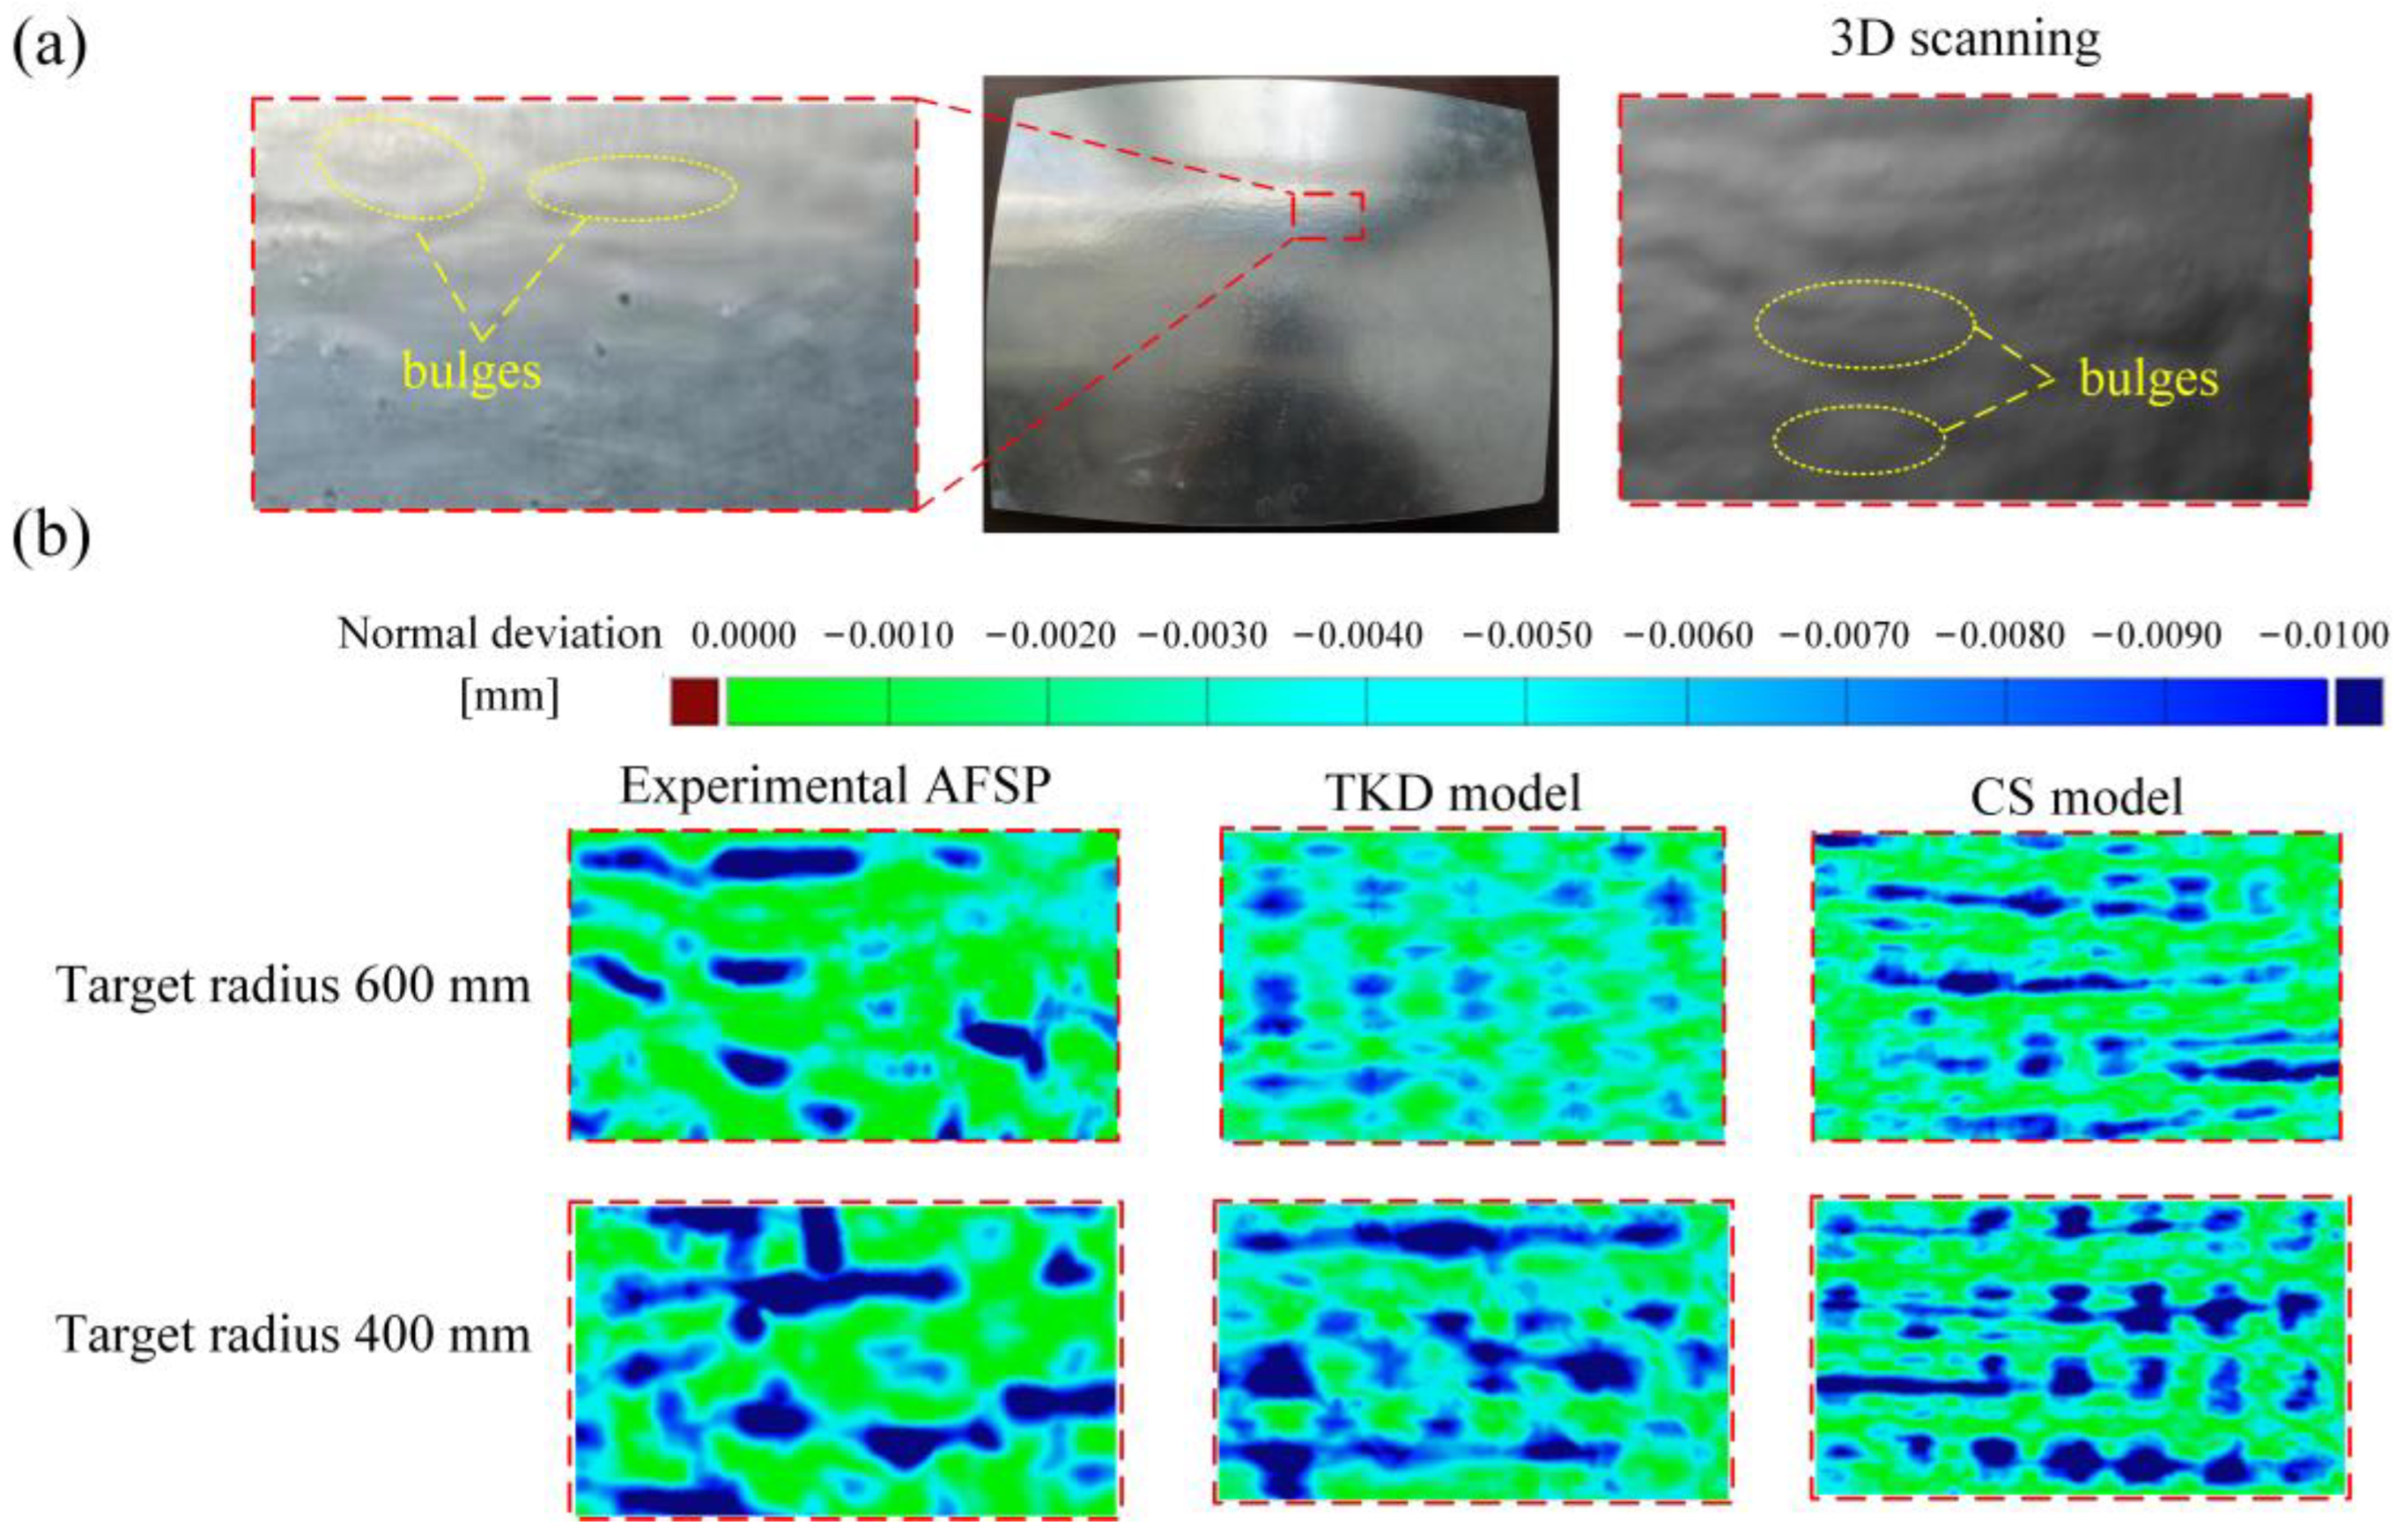
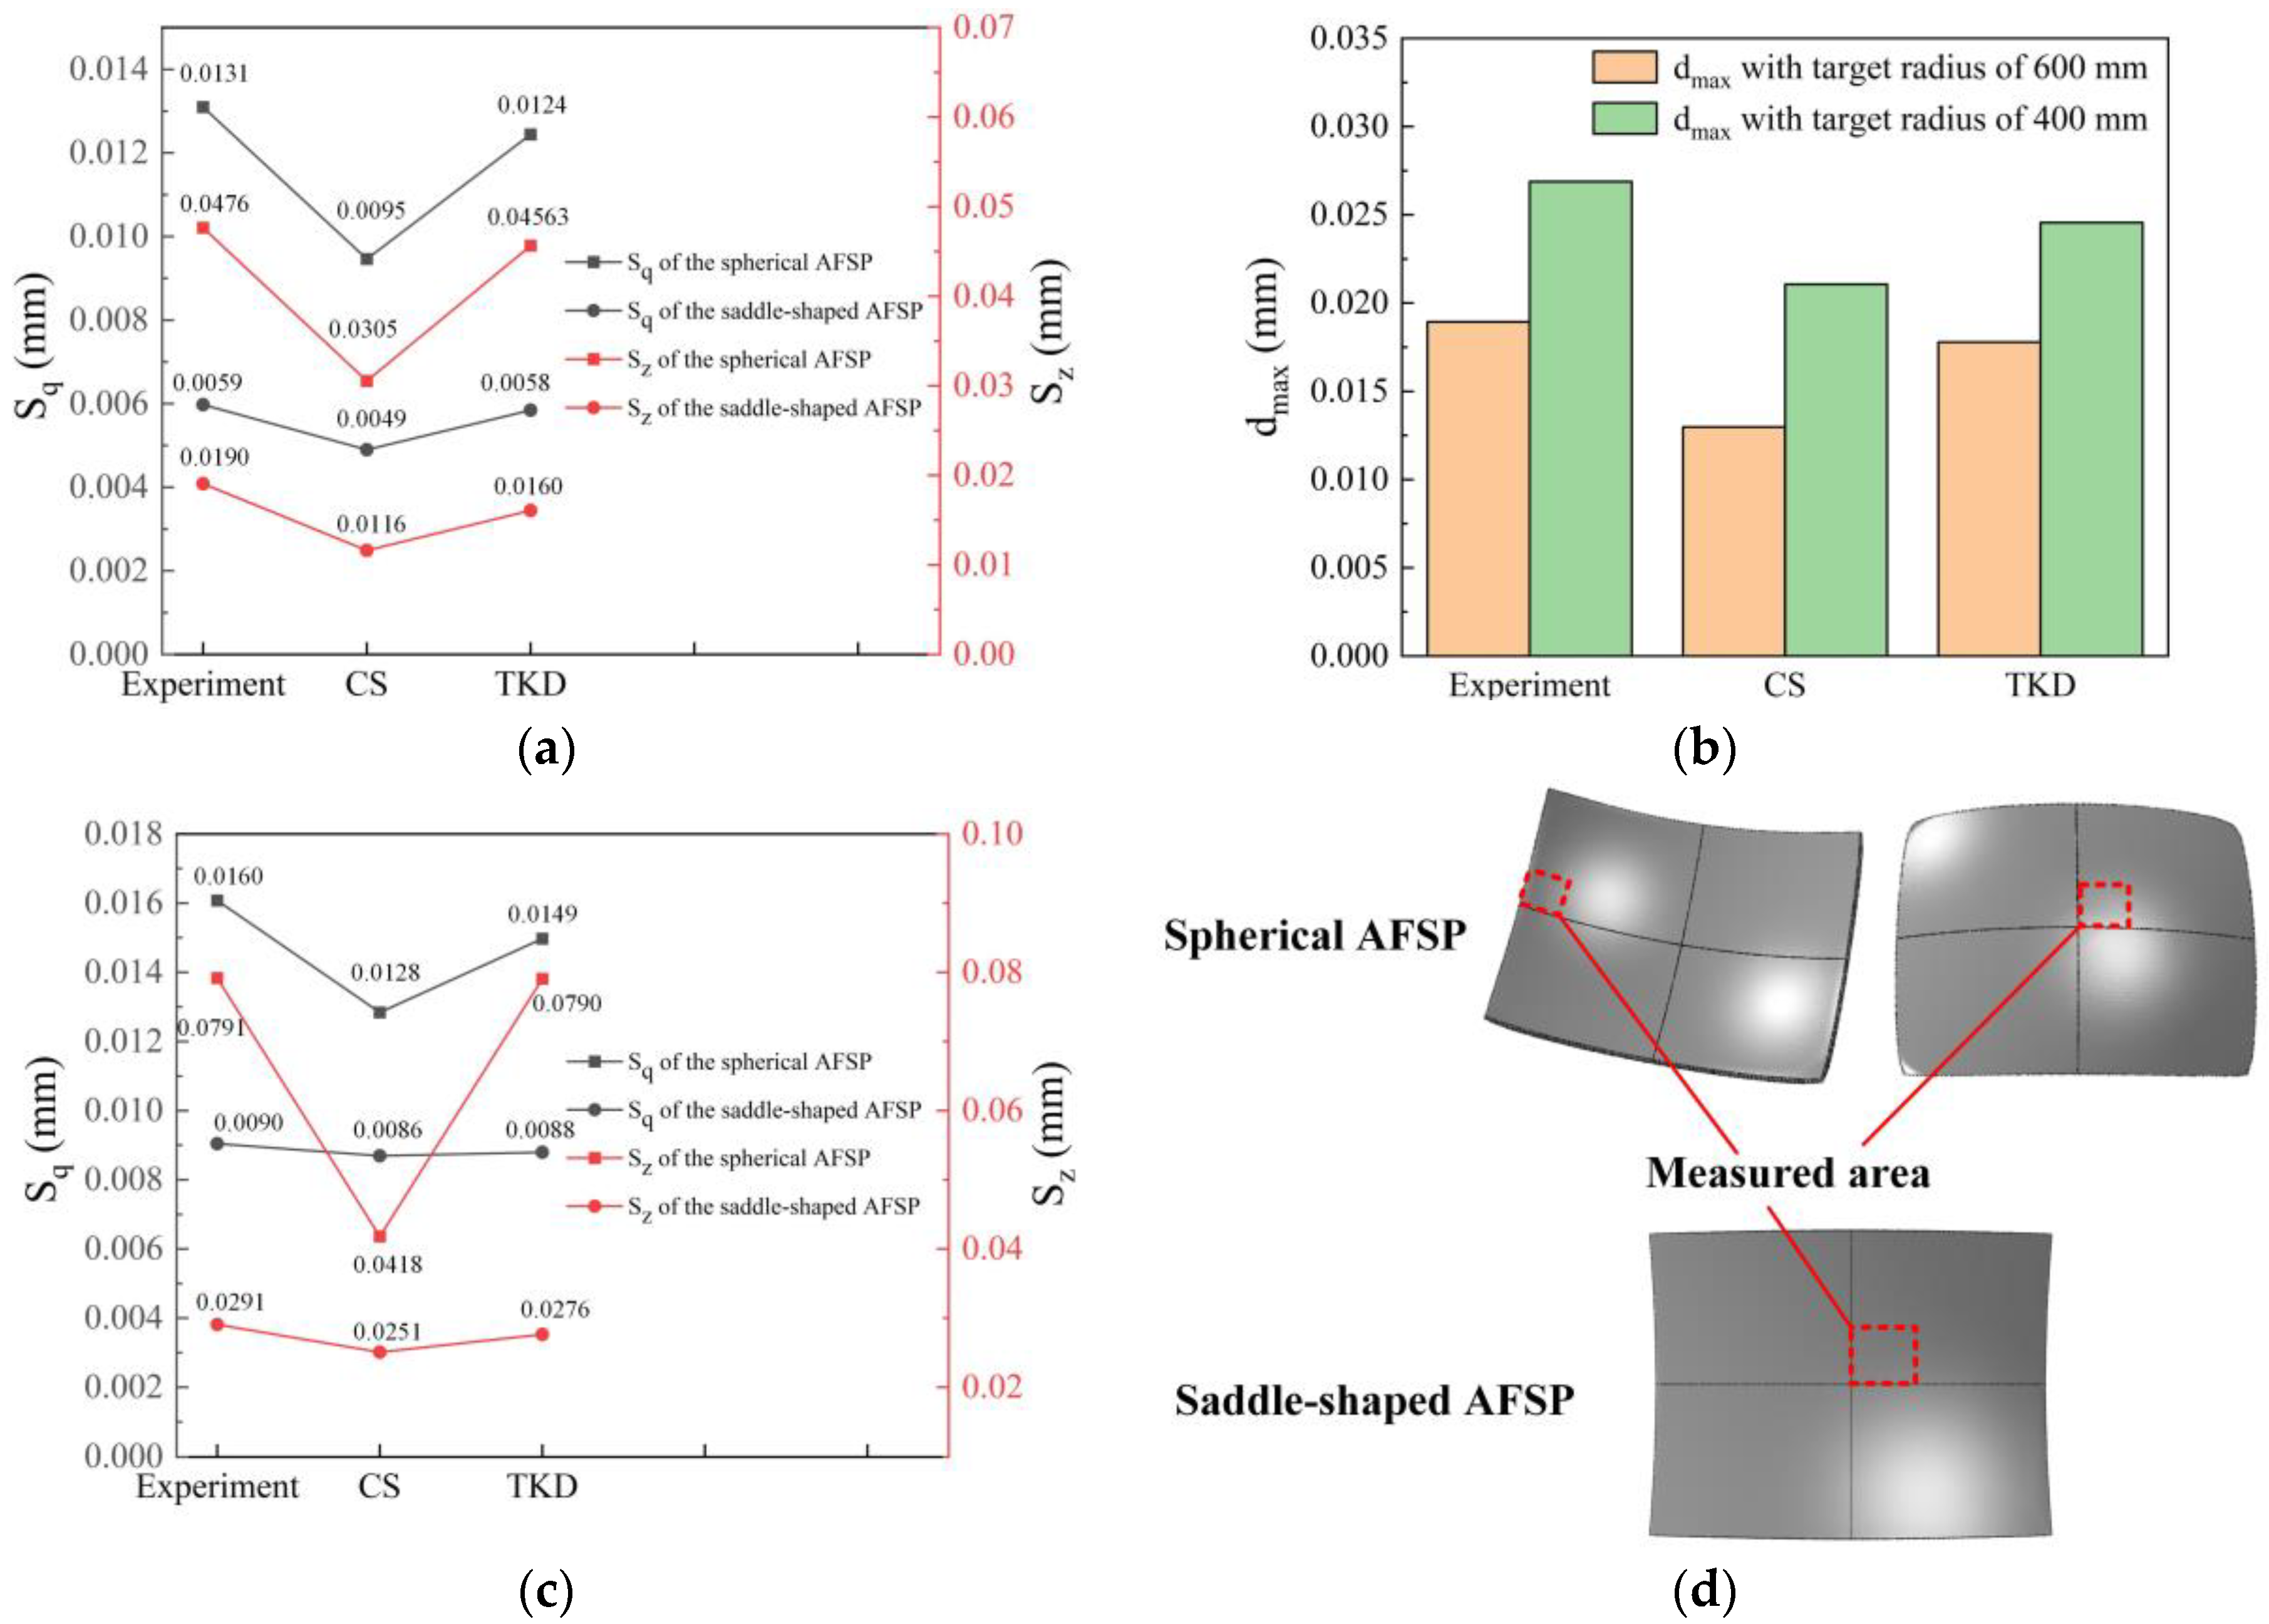
  • The AFSP numerical simulation results of CS model and TKD model show the same surface defects as the experimental AFSP after plastic forming, including surface wrinkles, local straight surface effects and surface depressions. From the results of normal deviation and surface quality evaluation parameters S q , S z and d max , the AFSP results of the TKD model are more consistent with the experimental AFSP results.
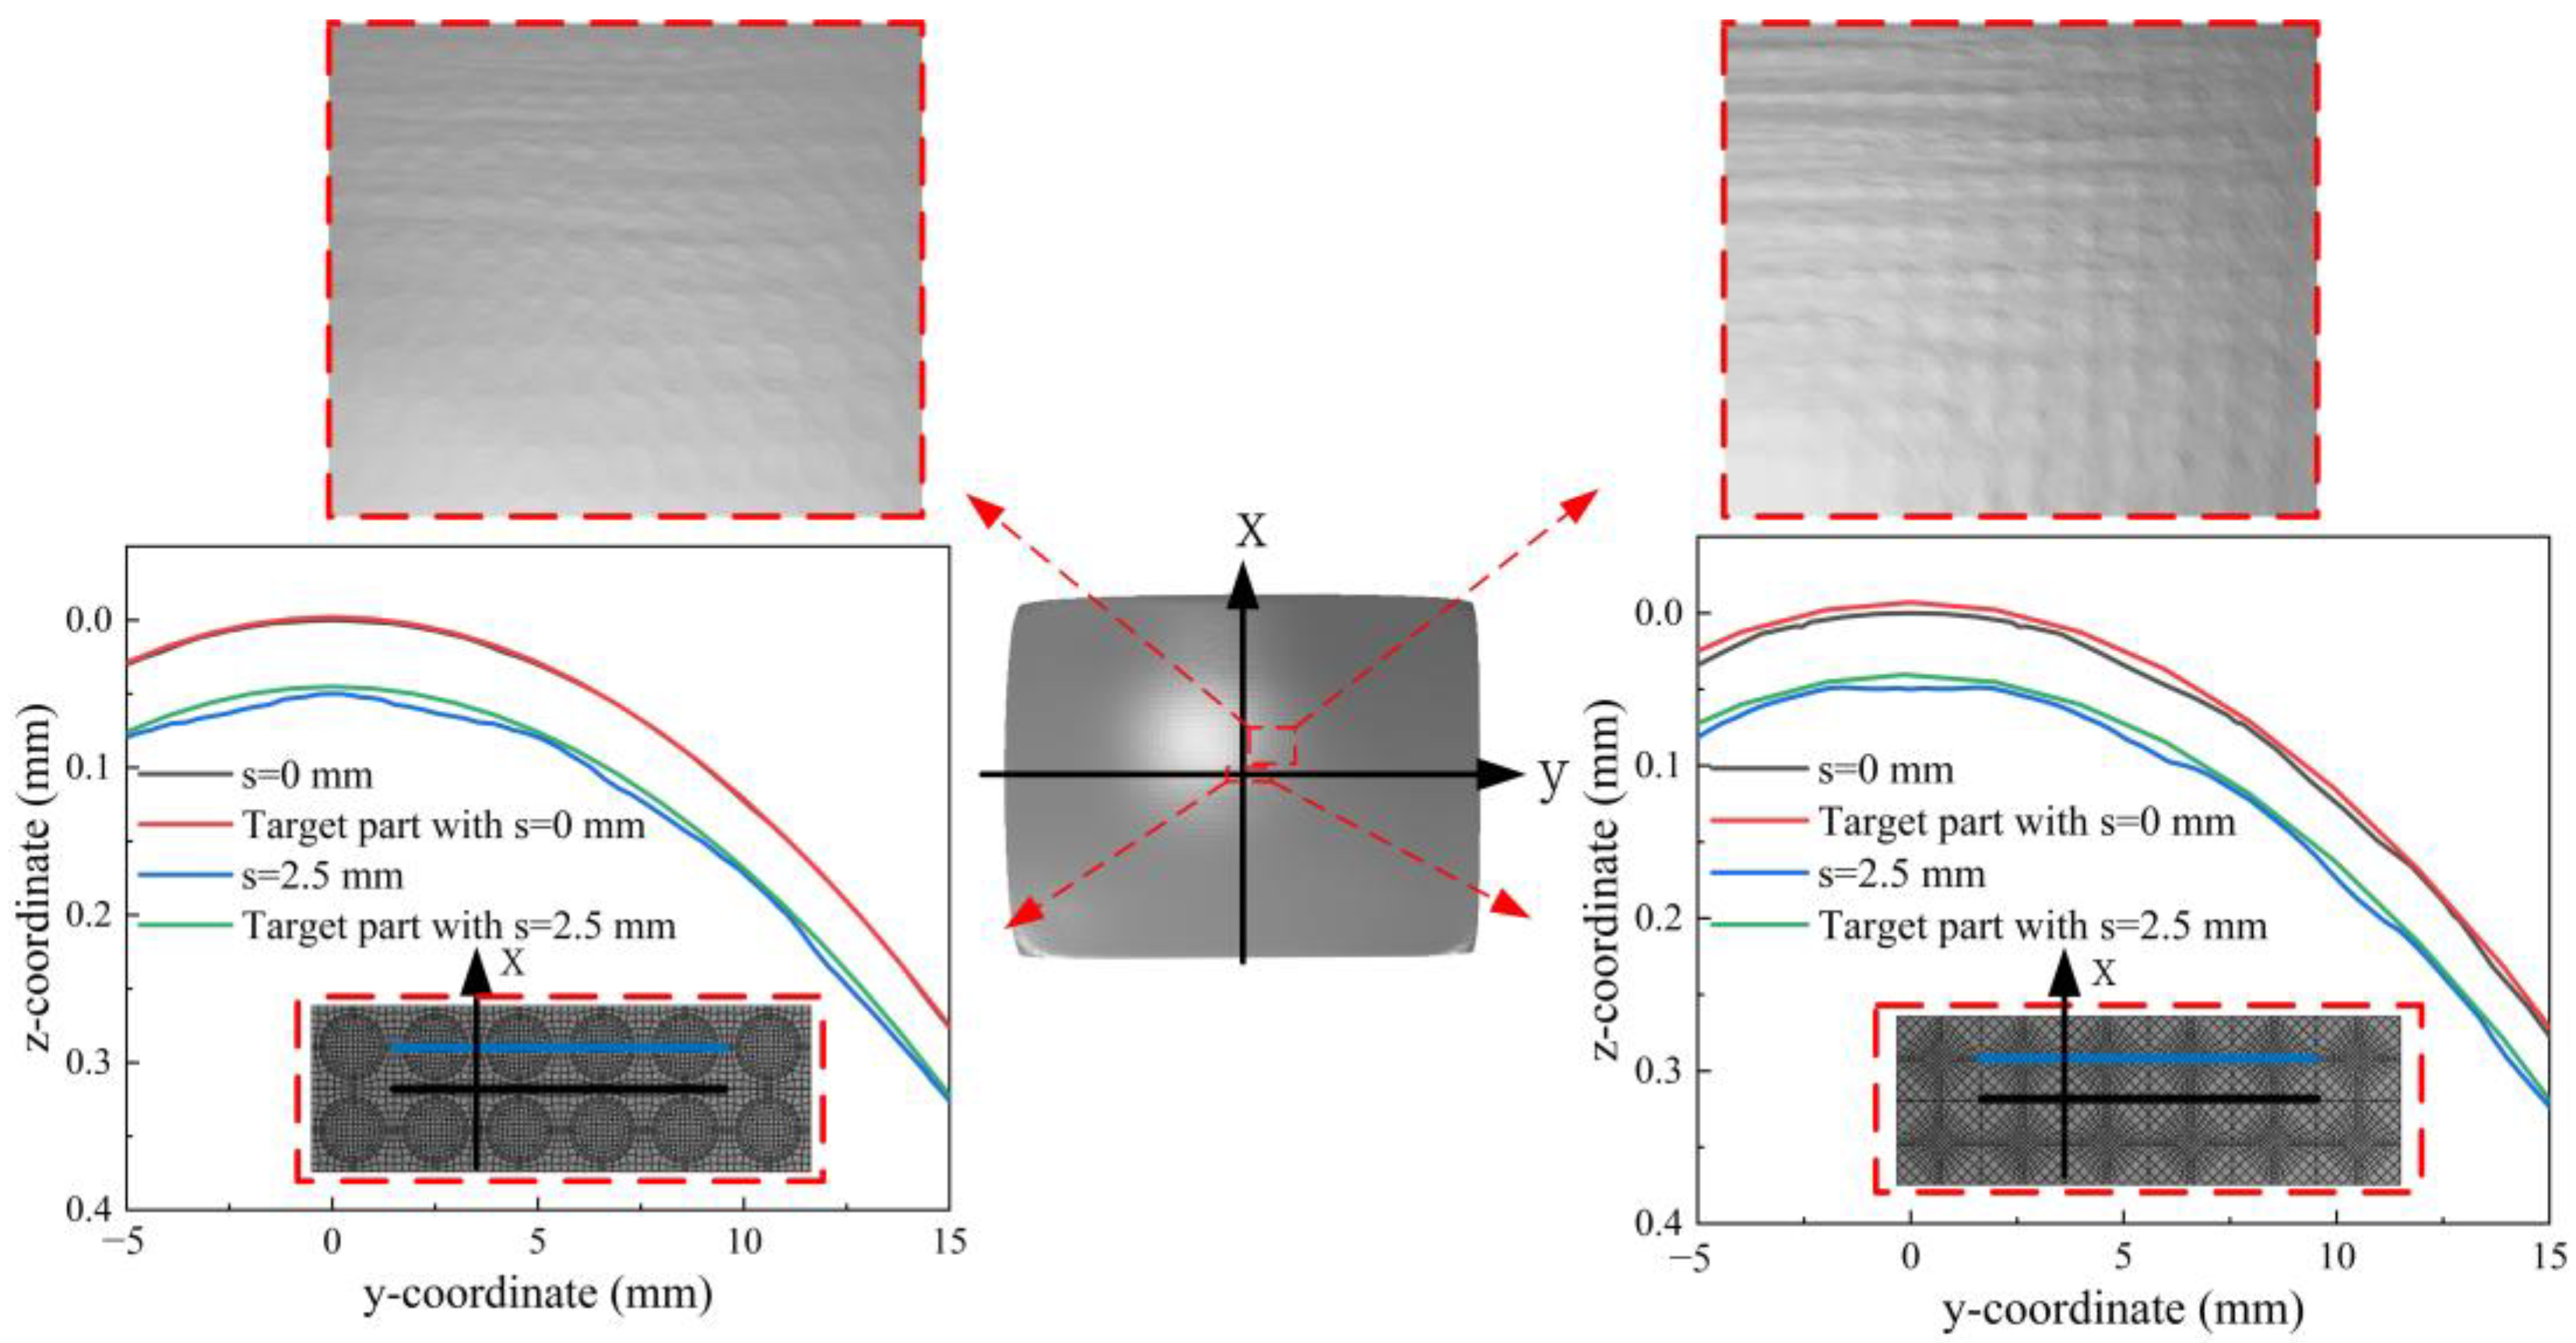
  • From the normal deviation and 3D scanning results, the values of the surface quality evaluation parameters S q , S z and d max can well correspond to the normal deviation degree and can be used to quantitatively evaluate the surface quality of AFSP. Under the same target radius, the equivalent strain and surface quality evaluation parameters of saddle-shaped AFSP are smaller than those of spherical AFSP. For spherical AFSP forming, the larger the target radius, the smaller the normal deviation, and the better the surface quality of AFSP.
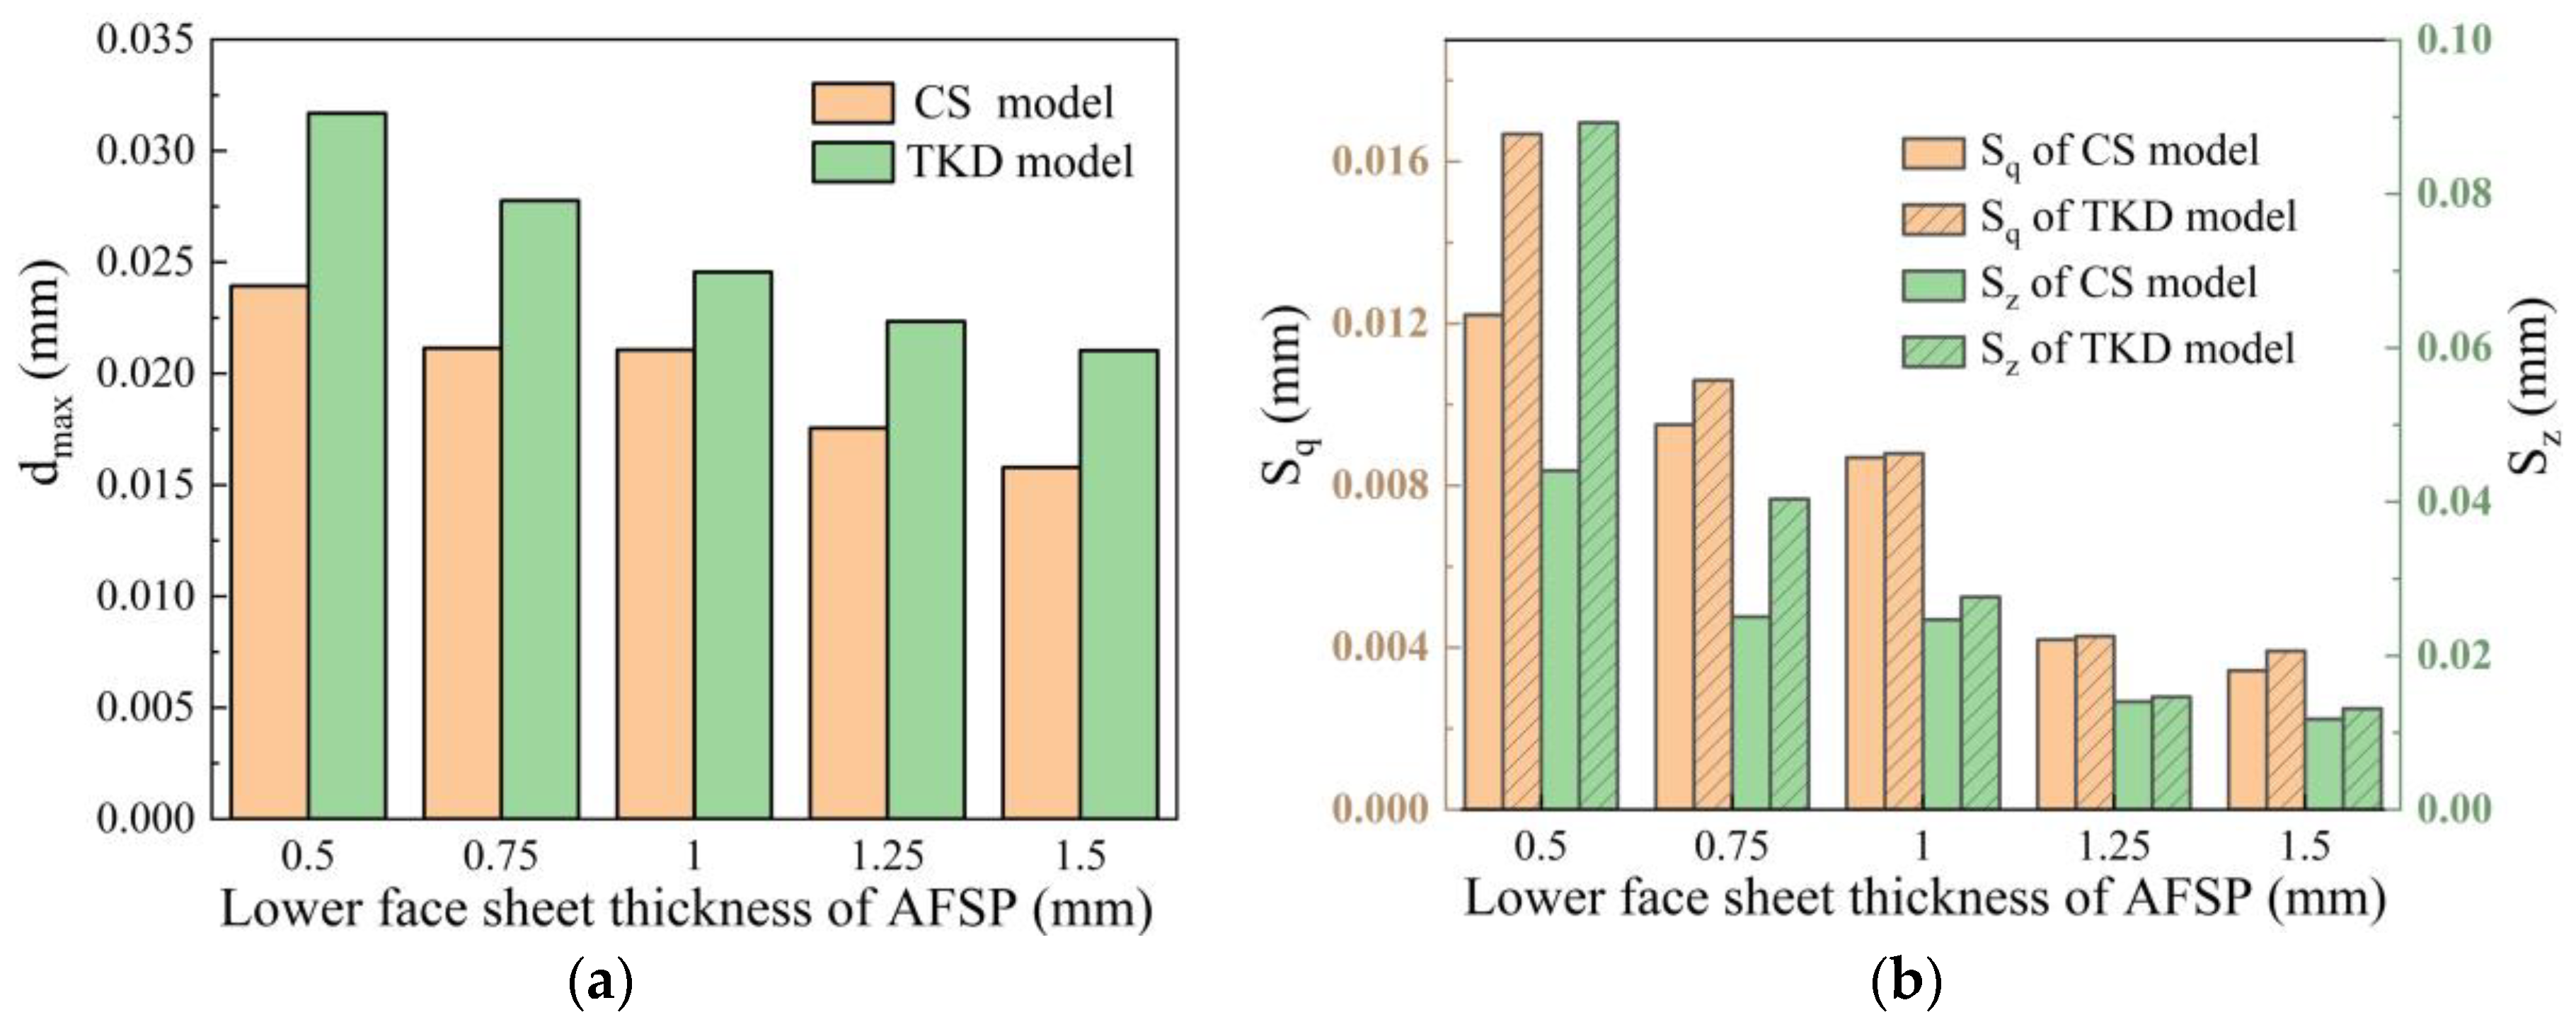
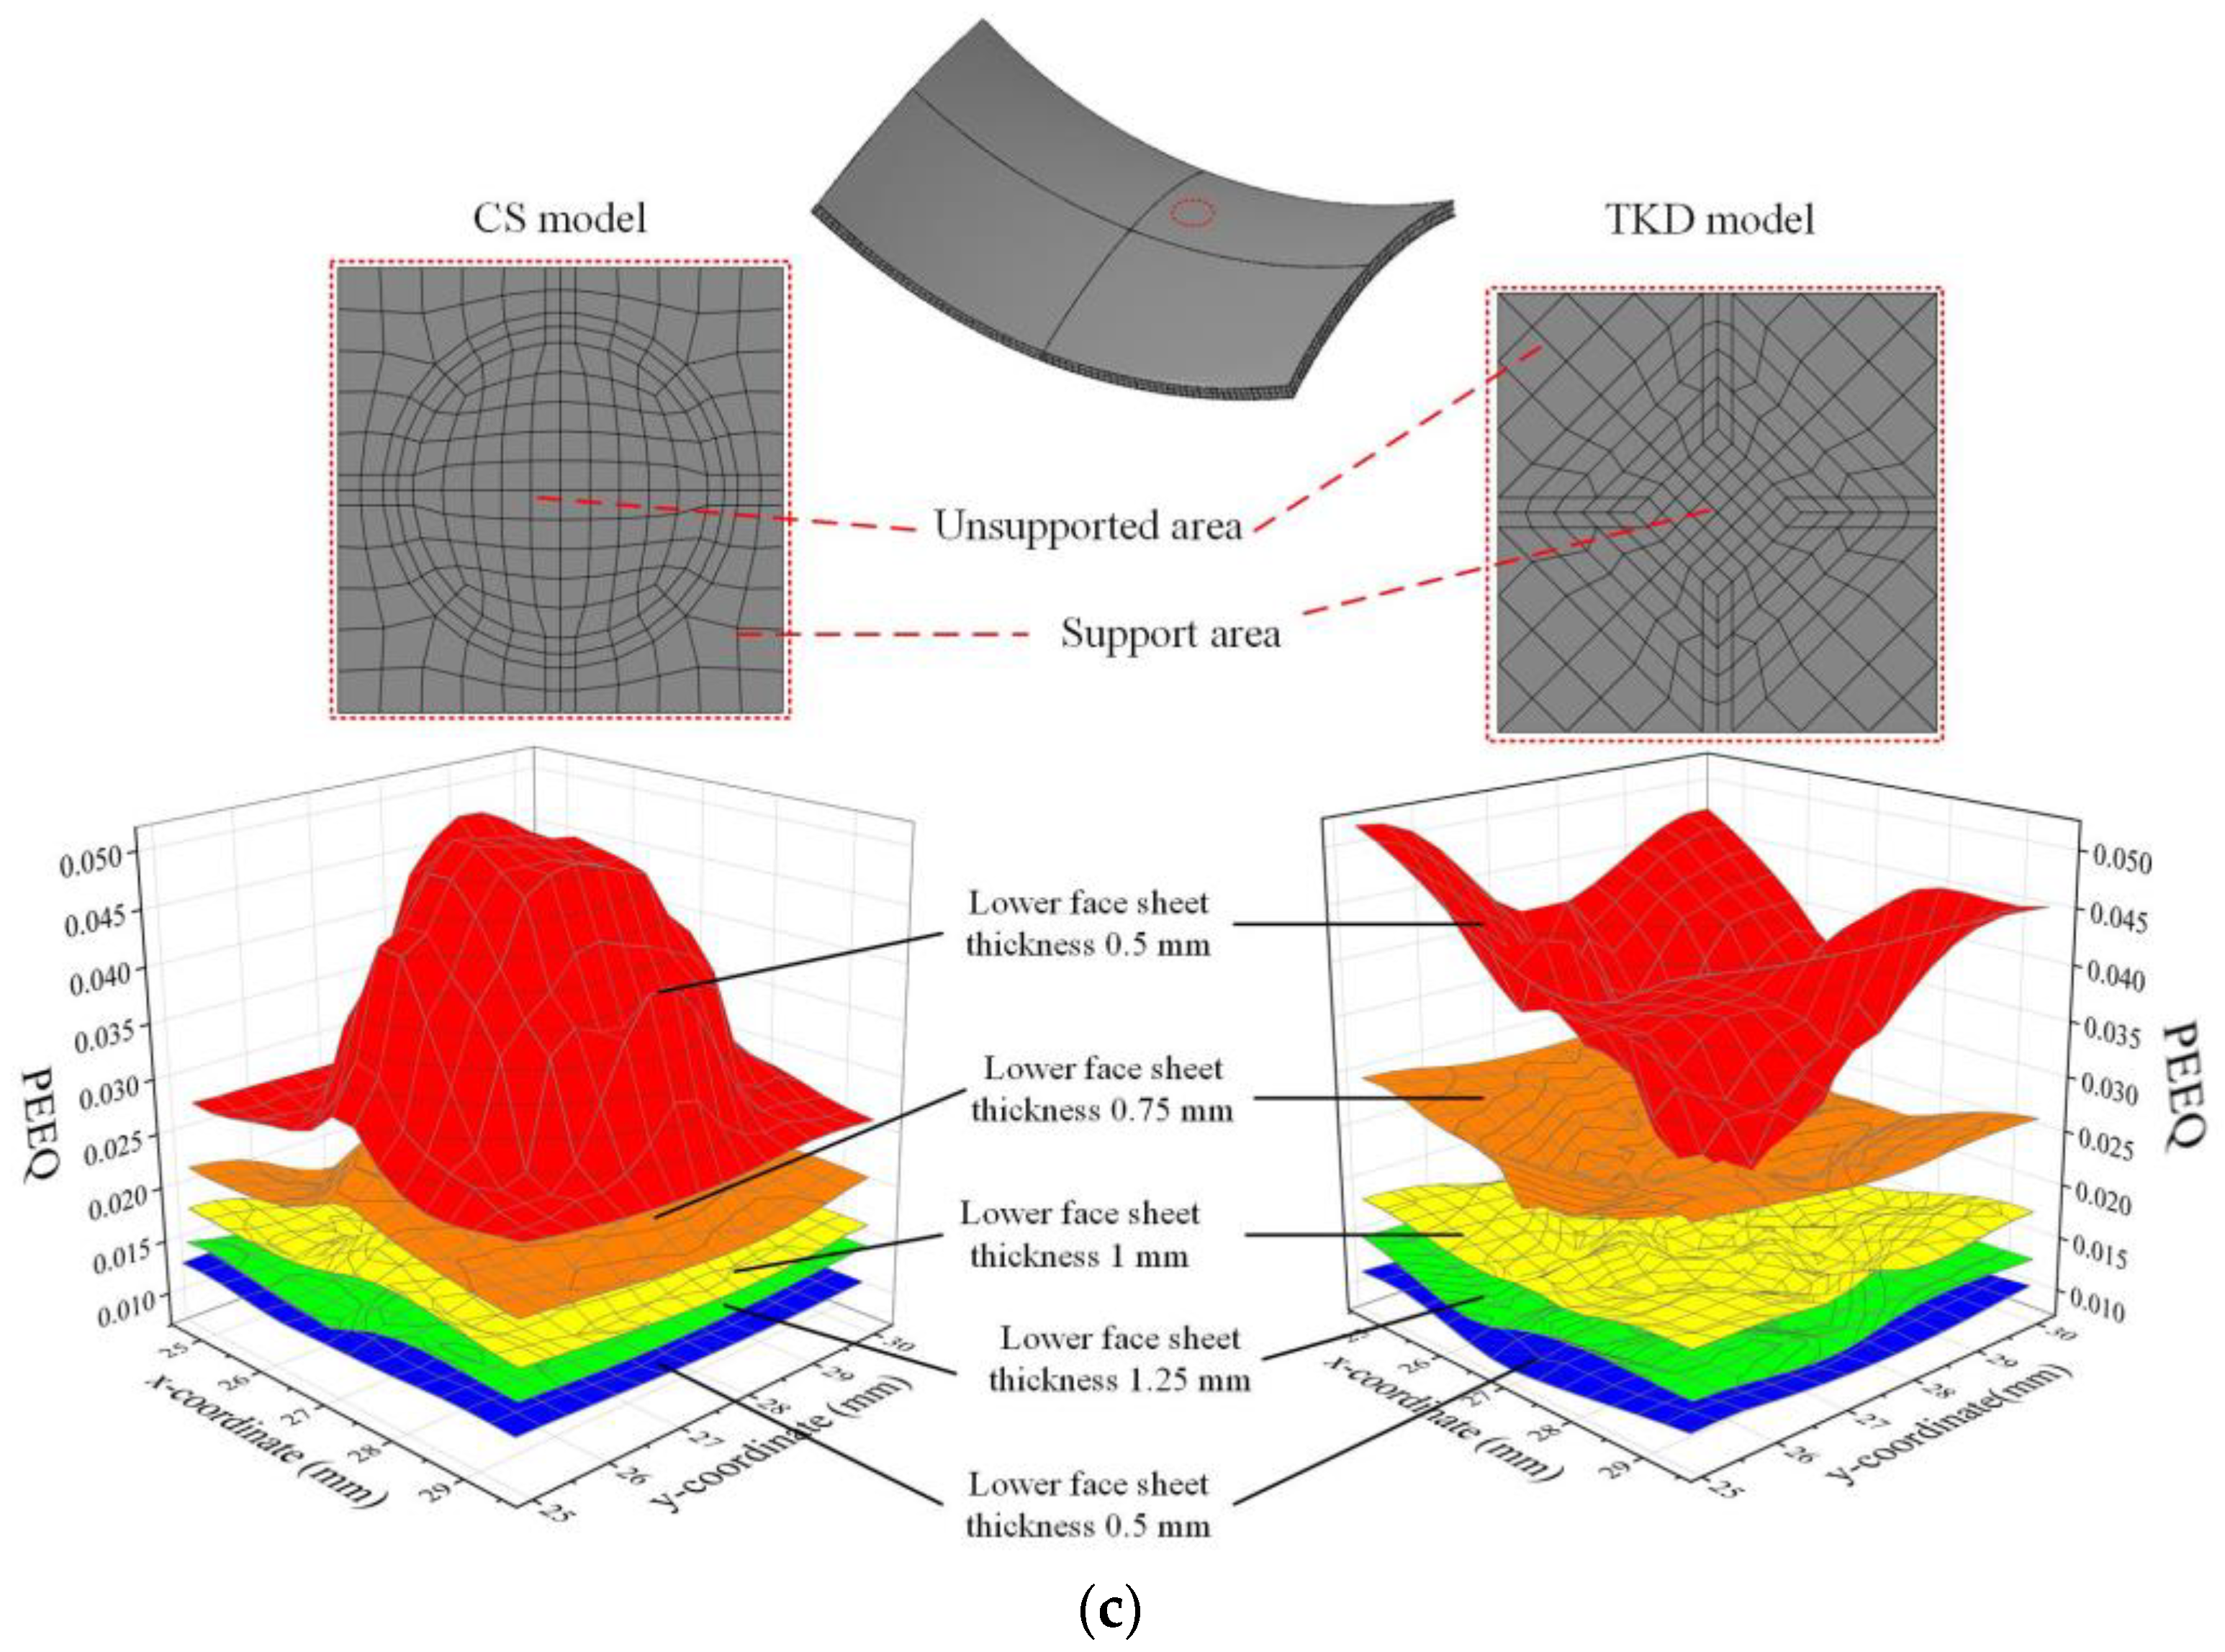
  • When the thickness of the upper face sheet increases, the variation range of the distribution curve of the equivalent strain decreases, the values of S q and S z decrease, and the surface quality improves. When the thickness of the upper face sheet is larger than 1 mm, the surface of the AFSP is smooth, and the AFSP with a large core cell size shows a larger equivalent strain in the unsupported area, showing obvious surface wrinkles. When the thickness of the lower face sheet increases, the values of S q , S z and d max decrease for both the formed spherical AFSP and saddle-shaped AFSP. Increasing the thickness of the upper and lower face sheets of the AFSP and reducing the size of the core cell can effectively improve the surface quality.

Author Contributions

Conceptualization, W.Z. and Z.C.; methodology, W.Z. and Z.C.; software, W.Z.; validation, W.Z. and X.Z.; formal analysis, W.Z. and M.W.; investigation, W.Z.; resources, Z.C. and Q.C.; data curation, W.Z.; writing—original draft preparation, W.Z.; writing—review and editing, Z.C. and Q.C.; visualization, W.Z. and J.G.; supervision, Z.C. and Q.C.; project administration, Z.C. and Q.C.; funding acquisition, Z.C. All authors have read and agreed to the published version of the manuscript.

Funding

This research was funded by National Science Foundation of China (Grant No. 51975248) and Graduate Innovation Fund of Jilin University (Grant No. 101832020CX140).

Data Availability Statement

Not applicable.

Conflicts of Interest

The authors declare no conflict of interest.

References

  1. Damghani, M.N.; Gonabadi, A.M. Numerical study of energy absorption in aluminum foam sandwich panel structures using drop hammer test. J. Sandw. Struct. Mater. 2019, 21, 3–18. [Google Scholar] [CrossRef]
  2. Banhart, J.; Seeliger, H.W. Recent Trends in Aluminum Foam Sandwich Technology. Adv. Eng. Mater. 2012, 14, 1082–1087. [Google Scholar] [CrossRef]
  3. Claar, T.D.; Yu, C.J.; Hall, I.; Banhart, J.; Seeliger, W. Ultra-Lightweight Aluminum Foam Materials for Automotive Applications. Int. J. Powder Metall. 2000, 109, 98–106. [Google Scholar]
  4. Vodenitcharova, T.; Hoffman, M. Response of aluminium foam-cored sandwich panels to bending load. Compos. Part B Eng. 2014, 64, 24–32. [Google Scholar]
  5. Contorno, D.; Filice, L.; Fratini, L.; Micari, F. Forming of aluminum foam sandwich panels: Numerical simulations and experimental tests. J. Mater. Process. Technol. 2006, 177, 364–367. [Google Scholar] [CrossRef]
  6. Zhang, W.; Qin, Q.; Li, J.; Li, K.; Zhao, J. Deformation and failure of hybrid composite sandwich beams with a metal foam core under quasi-static load and low-velocity impact. Compos. Struct. 2020, 242, 112175. [Google Scholar] [CrossRef]
  7. Sun, Z.Z.; He, W.F.; Chen, H.B.; Chen, S.G.; Li, R.Y. Study on V-Bending of Aluminium Foam Sandwich Panels. Adv. Mater. Res. 2011, 181–182, 281–286. [Google Scholar] [CrossRef]
  8. Weiss, M.; Abeyrathna, B.; Pereira, M. Roll formability of aluminium foam sandwich panels. Int. J. Adv. Manuf. Technol. 2018, 97, 953–965. [Google Scholar] [CrossRef]
  9. Wang, J.; Yang, C.-K. Failure analysis of hydroforming of sandwich panels. J. Manuf. Process. 2013, 15, 256–262. [Google Scholar] [CrossRef]
  10. Nassar, H.; Albakri, M.; Pan, H.; Khraisheh, M. On the gas pressure forming of aluminium foam sandwich panels: Experiments and numerical simulations. CIRP Ann.-Manuf. Technol. 2012, 61, 243–246. [Google Scholar] [CrossRef]
  11. Jackson, K.P.; Allwood, J.M.; Landert, M. Incremental forming of sandwich panels. J. Mater. Process. Technol. 2008, 204, 290–303. [Google Scholar] [CrossRef]
  12. Guglielmotti, A.; Quadrini, F.; Squeo, E.A.; Tagliaferri, V. Laser Bending of Aluminum Foam Sandwich Panels. Adv. Eng. Mater. 2009, 11, 902–906. [Google Scholar] [CrossRef]
  13. Jaafar, M.; Makich, H.; Nouari, M. A new criterion to evaluate the machined surface quality of the Nomex® honeycomb materials. J. Manuf. Process. 2021, 69, 567–582. [Google Scholar] [CrossRef]
  14. Reyno, T.; Marsden, C.; Wowk, D. Surface damage evaluation of honeycomb sandwich aircraft panels using 3D scanning technology. NDT E Int. 2018, 97, 11–19. [Google Scholar] [CrossRef]
  15. Harhash, M.; Palkowski, H. Incremental sheet forming of steel/polymer/steel sandwich composites. J. Mater. Res. Technol. 2021, 13, 417–430. [Google Scholar] [CrossRef]
  16. Chang, Z.; Chen, J. Analytical model and experimental validation of surface roughness for incremental sheet metal forming parts. Int. J. Mach. Tools Manuf. 2019, 146, 103453. [Google Scholar] [CrossRef]
  17. Doluk, E.; Rudawska, A.; Kuczmaszewski, J.; Pieśko, P. Influence of Cutting Parameters on the Surface Quality of Two-Layer Sandwich Structures. Materials 2020, 13, 1664. [Google Scholar] [CrossRef] [Green Version]
  18. Cai, Z.-Y.; Zhang, X.; Liang, X.-B. Multi-point forming of sandwich panels with egg-box-like cores and failure behaviors in forming process: Analytical models, numerical and experimental investigations. Mater. Des. 2018, 160, 1029–1041. [Google Scholar] [CrossRef]
  19. Liang, X.-B.; Cai, Z.-Y.; Zhang, X.; Gao, J.-X. Plastic forming of the doubly curved surfaces of sandwich plates with bi-directionally trapezoidal cores of different sizes. Thin-Walled Struct. 2020, 146, 106188. [Google Scholar] [CrossRef]
  20. Kundrak, J.; Gyani, K.; Bana, V. Roughness of ground and hard-turned surfaces on the basis of 3D parameters. Int. J. Adv. Manuf. Technol. 2008, 38, 110–119. [Google Scholar] [CrossRef]
  21. Nwaogu, U.C.; Tiedje, N.S.; Hansen, H.N. A non-contact 3D method to characterize the surface roughness of castings. J. Mater. Process. Technol. 2013, 213, 59–68. [Google Scholar] [CrossRef]
  22. Dong, W.P.; Sullivan, P.J.; Stout, K.J. Comprehensive study of parameters for characterising three-dimensional surface topography: III: Parameters for characterising amplitude and some functional properties. Wear 1994, 178, 29–43. [Google Scholar] [CrossRef]
  23. Zhang, X.; Chen, Q.-M.; Cai, Z.-Y. Prediction and prevention of fracture defect in plastic forming for aluminum foam sandwich panel. J. Mater. Res. Technol. 2021, 15, 1145–1154. [Google Scholar] [CrossRef]
  24. Chai, H.W.; Xie, Z.L.; Xiao, X.H.; Xie, H.L.; Huang, J.Y.; Luo, S.N. Microstructural characterization and constitutive modeling of deformation of closed-cell foams based on in situ x-ray tomography. Int. J. Plast. 2020, 131, 102730. [Google Scholar] [CrossRef]
  25. Zhang, Y.; Chen, Q.; Wang, M.; Zhang, X.; Cai, Z. Plastic Forming of Sandwich Panels and Numerical Analyses of the Forming Processes Based on Elastoplastic Equivalent Model. Materials 2021, 14, 4955. [Google Scholar] [CrossRef] [PubMed]
  26. Sun, G.; Wang, E.; Zhao, T.; Zheng, G.; Li, Q. Inverse identification of cell-wall material properties of closed-cell aluminum foams based upon Vickers nano-indentation tests. Int. J. Mech. Sci. 2020, 176, 105524. [Google Scholar] [CrossRef]
  27. Hasan, M.D.A. An Improved Model for FE Modeling and Simulation of Closed Cell Al-Alloy Foams. Adv. Mater. Sci. Eng. 2010, 2010, 567390. [Google Scholar] [CrossRef] [Green Version]
  28. Ye, W.; Barbier, C.; Zhu, W.; Combescure, A.; Baillis, D. Macroscopic multiaxial yield and failure surfaces for light closed-cell foams. Int. J. Solids. Struct. 2015, 69–70, 60–70. [Google Scholar] [CrossRef]
  29. Zhang, X.; Cai, Z.-Y.; Liang, X.-B.; Gao, J.-X. Numerical investigation on the plastic forming of aluminum foam sandwich panel based on three-dimensional mesoscopic and macroscopic models. Int. J. Adv. Manuf. Technol. 2020, 109, 1431–1445. [Google Scholar] [CrossRef]
  30. Zhang, Q.; Dean, T.A.; Wang, Z.R. Numerical simulation of deformation in multi-point sandwich forming. Int. J. Mach. Tools Manuf. 2006, 46, 699–707. [Google Scholar] [CrossRef]
  31. Cai, Z.-Y.; Wang, S.-H.; Li, M.-Z. Numerical investigation of multi-point forming process for sheet metal: Wrinkling, dimpling and springback. Int. J. Adv. Manuf. Technol. 2008, 37, 927–936. [Google Scholar] [CrossRef]
Figure 1. (a) Schematic diagram of MPF of AFSP (b) surface defects of AFSP.
Metals 13 00065 g001
Figure 2. Finite element model of MPF.
Metals 13 00065 g002
Figure 3. (a) Equivalent strain of cross section in the central region of spherical AFSP. (b) Equivalent strain of upper and lower face sheet of spherical AFSP.
Metals 13 00065 g003
Figure 4. (a) Equivalent strain of cross section in the central region of saddle-shaped AFSP (b) Equivalent strain of upper and lower face sheet of saddle-shaped AFSP.
Metals 13 00065 g004
Figure 5. (a) Illumination maps of upper face sheet of spherical AFSP (b) Profile lines of upper face sheet of spherical AFSP.
Metals 13 00065 g005
Figure 6. Local straight face effect of lower face sheet of spherical AFSP.
Metals 13 00065 g006
Figure 7. Surface dimpling of lower face sheet of saddle-shaped AFSP.
Metals 13 00065 g007
Figure 8. (a) MPF of AFSP (b) 3D scanning of AFSP.
Metals 13 00065 g008
Figure 9. (a) Illumination map and 3D scanning diagram of spherical AFSP upper face sheet. (b) Normal deviation of spherical AFSP surface under different target radii.
Metals 13 00065 g009
Figure 10. (a) Illumination map and 3D scanning diagram of spherical AFSP lower face sheet (b) Normal deviation of spherical AFSP surface under different target radii.
Metals 13 00065 g010
Figure 11. (a) S q and S z of AFSP with spherical and saddle-shaped target radius of 600 mm (b) d max of AFSP with spherical target radii of 600 mm and 400 mm (c) S q and S z of AFSP with spherical and saddle-shaped target radius of 400 mm (d) Measurement area obtained by surface quality evaluation parameters.
Metals 13 00065 g011
Figure 12. (a) CS model AFSP profile lines and equivalent strain with different upper face sheet thickness (b) TKD model AFSP profile lines and equivalent strain with different upper face sheet thickness (c) S q and S z of AFSP with different upper face sheet thicknesses.
Metals 13 00065 g012
Figure 13. (a) d max with different lower face sheet thickness of spherical AFSP (b) S q and S z with different lower face sheet thickness of saddle-shaped AFSP (c) Equivalent strain of lower face sheet of saddle-shaped AFSP with different thickness.
Metals 13 00065 g013aMetals 13 00065 g013b
Figure 14. Equivalent strain of spherical AFSP with different core cell sizes.
Metals 13 00065 g014
Figure 15. (a) S q and S z of spherical AFSP with different core cell sizes (b) d max of spherical AFSP with different core cell sizes (c) S q and S z of saddle-shaped AFSP with different core cell sizes.
Metals 13 00065 g015
Table 1. Three-dimensional amplitude parameters.
ParameterDefinitionEquation
S a Arithmetic mean deviation of measuring points S a = 1 m x n y i = 1 m x j = 1 n y E ( x i , y i )
S q Root mean square deviation of measuring point S q = 1 m x n y i = 1 m x j = 1 n y E 2 ( x i , y i )
S z Ten points height in the evaluation area S z = i = 1 5 e p i + i = 1 5 e v i 5
S s k Skewness of topography height distribution in the evaluation area S s k = 1 m x n y S q 3 i = 1 m x j = 1 n y E 3 ( x i , y i )
S k u Kurtosis of topography height distribution in the evaluation area S k u = 1 m x n y S q 4 i = 1 m x j = 1 n y E 4 ( x i , y i )
Table 2. Material parameters of AFSP and elastic cushion.
Density (g/cm3)Young’s Modulus (MPa)Yield Stress (MPa)Poisson’s Ratio
Face sheet2.7170,3001930.330
Form Core2.7063,000630.330
Elastic cushion1.26100/0.499
Table 3. AFSP with different geometrical parameters.
No.Upper Face Sheet
Thickness (mm)
Lower Face Sheet Thickness (mm)Core Cell Size (mm)
1115
20.515
30.7515
41.2515
51.515
610.55
710.755
811.255
911.55
10112.5
111110
Disclaimer/Publisher’s Note: The statements, opinions and data contained in all publications are solely those of the individual author(s) and contributor(s) and not of MDPI and/or the editor(s). MDPI and/or the editor(s) disclaim responsibility for any injury to people or property resulting from any ideas, methods, instructions or products referred to in the content.

