Article

Investigation of Medium Range Order Defects in CuxZr100-x (x = 50, 56, 60, 64) Metallic Glasses Using Reverse Monte Carlo Modeling

1
Department of Modern Mechanics, University of Science and Technology of China, Hefei 230026, China
2
Institute of Systems Engineering, China Academy of Engineering Physics, Mianyang 621999, China
*
Author to whom correspondence should be addressed.
Metals 2023, 13(1), 70; https://doi.org/10.3390/met13010070
Submission received: 6 December 2022 / Revised: 23 December 2022 / Accepted: 24 December 2022 / Published: 27 December 2022
(This article belongs to the Special Issue Deformation Dynamics of Heterogeneous Metallic Materials)

Abstract

:
The identification of glassy defects in amorphous materials is a long-standing but imperative problem which hinders our deep understanding of the structural origin of mechanical behavior in metallic glasses (MGs). Here, a combination of experiments and numerical simulations were used to reconstruct the atomic packing of MGs. Using the integration of synchrotron X-ray diffraction (XRD) datasets, ab initio molecular dynamics simulations, as well as reverse Monte Carlo simulation, we determined the three-dimensional atomic positions of a series of binary MGs CuxZr100-x (x = 50, 56, 60, 64). Then we uncovered the connection of short-range clusters as well as the nature of the medium range order (MRO). It turns out that full icosahedral tend to connect to each other forming the back bones, with dimensions positively correlated with the Cu content. By quantifying the discontinuity of full icosahedral networks, we identified the MRO defects which were found to be highly influenced by the macroscopic chemical contents. Here, the density of MRO defects is growing with the decrease of Cu contents. These results suggest the reason for the stable kinetic properties and good glass forming ability of the Cu64Zr36 system, which is rich in full icosahedral clusters <0,0,12,0> but a lack of MRO defects.

1. Introduction

Since their discovery in the 1960s [1], metallic glasses with disordered structures inherited from molten liquid via a fast quenching process have attracted significant research interest due to their outstanding elastic limit, yielding strength and fracture toughness when compared with their crystalline counterparts [2,3,4,5,6]. To understand in depth the hidden mechanism of the glass forming process and the macroscopic mechanical behavior of MGs, it is an urgent need to investigate the microscopic structures tracing back to the possible atomic level [7,8,9,10]. However, due to their unique disordered structure, which lacks long-range translational and rotational order, the packing manners of MGs cannot be effectively described by a particular type of unit in the literature [11]. It is only in recent decades that the introduction of the Voronoi analysis has led to a clearer understanding, where short-range order clusters such as full icosahedral are observed [9,12,13,14,15]. Based on the Voronoi analysis, Voronoi index [9,11], local five-fold symmetry parameters (LFFS) [16,17,18], etc. have been proposed in an attempt to build the one-to-one correspondence between structure and properties in MGs.
In addition to short-range order, the medium range order (MRO) which involves atoms beyond the nearest neighbors were discovered and extensively discussed in recent years. Such MRO is usually defined as the networks formed by connected short range order clusters via shared shell atoms (face sharing, edge sharing or vertex sharing) [15,19,20]. Thus, the structural fingerprints are not limited in the first peak of the pair distribution function but up to 1–2 nm. It is generally accepted that the structural features on a larger scale are more responsive to the mechanical behavior of the materials [14,21,22,23,24]. This may also be due to the fact that MRO range covers several hundred atoms, which is already comparable to the size of the shear transformation zone (or the length scale of β -relaxation) [11,25,26,27]. However, since neat arrangement and irregular arrangements are two sides of the same coin, there will inevitably be MRO defects among the MRO framework. Such structural defects, such as the dislocations or grain boundaries [28] in crystals, can be identified by the break of the connectivity of the MRO network. It is expected that such defects are responsible for the localized plastic events of MGs. Up to this point, a number of MRO description parameters have also been proposed, for example, dominant polyhedral ratio [29] ( F n ), local yield stresses gradients of the minimum energy path of the STZs along the potential energy landscape (PEL) [30], etc. which can somewhat describe the plastic flow pattern of the structure. In our recent work [31], we have proposed an identification of MRO defects in CuZr MGs, and also provided more direct evidence for the existence of MRO defects on the basis of discontinuity of the stiff icosahedral network. MRO defects are directly related to the cooling history during the formation of MGs. In addition, it has been shown that MRO defects can be an effective predictor of void nucleation for samples with varying cooling rates. However, whether the effect of this MRO defect extends to other components of the amorphous alloy, and what the distribution pattern is in the other components, remains an open question.
To investigate the structure and properties of MGs, it is essential to build an accurate and realistic molecular model. Usually, three-dimensional molecular models using classical molecular dynamics (MD) have been widely used to characterize the plastic deformation and dynamics of amorphous alloys [32,33,34]. However, it is doubtful whether purely numerical simulations are representative of experimental conditions because of its limitation in space as well as time durations. Despite the recent development of ab initio molecular dynamics methods based on density flooding theory (DFT) to solve the electronic structure and interatomic interactions with high accuracy (which permits us to capture the main features of real-world glasses by observation of g(r) curves [35]) it alone is often inadequate in building a larger simulation box and reconstructing the structure of a multi-component MGs [11]. Taking into account the above reasons, the reverse Monte Carlo (RMC) algorithm [36] was proposed to compensate for the problem of simulation detachment from experimental data. The RMC algorithm uses the least squares to drive the simulated configuration toward the experimental data, which obtain the solution that most closely resembles the real structure. It is generally accepted that using both extended X-ray absorption fine structure spectroscopy (EXAFS) and synchrotron X-ray diffraction datasets to model the structure increases the confidence of the final structure, as the information of either long-range or short-range collocation can be well included [37,38,39,40]. Nevertheless, the partial pair distribution function (PDF) solved by the RMC is still implausible [41]. The main concern is that the K-edge spectrum of EXAFS does not perfectly represent the one-to-one correspondence. To address this issue, ab initio molecular dynamics data (partial PDFs) was introduced to join the RMC simulation in place of EXAFS [42,43], which greatly improved the efficiency of RMC simulation and the reliability of the model [44,45]. In this case, the RMC simulations seem to be an extension of the ab initio molecular dynamics which extend the simulation system to tens of thousands of atoms and provided a reliable model for our subsequent analysis.
In this work, three-dimensional atomic models for analysis have been obtained using the RMC algorithm strongly integrating synchrotron XRD data and ab initio molecular dynamics data. Then, comparison between the K-edge spectrum of EXAFS and the theoretical spectrum of the final structure enhances the reliability of the reconstructed model. Through a self-developed program to extract icosahedral clusters, the MRO defects were successfully identified based on the discontinuities in the icosahedral network. Finally, comparison of samples with different composition ratios revealed the dependence of the distribution pattern of MRO defects on the chemical composition. This also reflects to some extent that the reason for the stable kinetic properties and the good glass forming ability of amorphous alloys is related to the density and distribution of MRO defects.

2. Methods

2.1. Experiment

Alloys with composition CuXZr100−X (x = 50, 56, 60, 64) were prepared by arc-melting elemental high purity metals Cu (99.9 wt%) and Zr (99.9 wt%) in chemical proportions under purified argon atmosphere. Every sample was melted 4 times throughout the process to reach homogeneity and ensure that the mass loss is less than 0.05 wt% after the arc melting. The melting liquid was then rapidly ejected through a 48 mm long, 3.5 mm orifice (inlet pressure 7 Mpa) and liquid metal streams were crushed into small droplets for rapid cooling (approximately 102–103 K/s) in an Ar atmosphere. After the quench process, sample powders were obtained using a 900 mesh (15 μm particle size) sieve. The amorphous nature of the obtained samples was verified using Cu Kα XRD and differential scanning calorimetry (DSC).
Synchrotron XRD datasets were collected on a high-resolution powder diffraction beam with an energy of 17.9 keV (λ = 0.693 Å). The same test conditions were later used for capillary testing to obtain background data. After deducting background, sample absorption, polarization and elimination of incoherent scattering (Compton scattering) and multiple scattering, the obtained coherent scattering intensity I c o h ( Q ) was converted into the total structure factor S E x p ( Q ) by Faber-Ziman formula [46]. The whole data processing process was performed by PDFgetX3 2.0.0 software [47].
EXAFS spectra of Cu and Zr K-edge were collected in transmission mode under ambient temperature. Calibration of the energy was obtained using Cu and Zr foils after ensuring repeatability by averaging the data collected three times. The data processing process was implemented through Athena 0.9.26 [48] software. The theoretical EXAFS spectra of RMC simulations were statistically calculated by RMC_POT 1.8.1 software [49], where the table of backscattering coefficients (amplitude + phase) of the atoms adjacent to the central atom was obtained using the FEFF 8.5L code [50]. It is worth mentioning that the signals of high k region are weighted by the weighting factor kn (n = 3).

2.2. Ab Initio Molecular Dynamics Simulation

All the ab initio molecular dynamics computations were conducted by using the QUICKSTEP code which is implemented in the CP2K Open Source Molecular Dynamics package [51]. We employed DZVP-MOLOPT-GTH basis sets, a 600 Ry cutoff for the auxiliary plane wave expansion of the charge density, and Goedecker-Teter-Hutter (GTH) norm-conserving pseudopotentials to represent the core electrons. The calculations were conducted using the generalized gradient approximation (GGA) and the Perdew-Burke-Ernzerhof (PBE) functional [52]. Ab initio molecular dynamics methods were used in this work. Each ab initio molecular dynamics box was assigned to put in 256 atoms. All the dynamics simulations were first carried out in the NPT ensemble with a CSVR thermostat controlling the temperature at 1500 K to keep the molten state. The duration of this process was 3 ps and the time step was set as 1.5 fs. After that, we obtained the CuZr solid model glass by quenching the well relaxed melting liquid from 1500 K to 300 K with a cooling rate of 30 K/ps and the obtained glass was further relaxed at 300 K for 10 ps at last.

2.3. RMC Simulation

To reconstruct the three-dimensional configurations based on the experimental glass, RMC modeling was carried out using RMC_POT 1.8.1 software [49]. Here, the reliability of the obtained structural model was verified by the experimental data which was characterized by the measured S E x p ( Q ) from synchrotron XRD and quantum mechanical information quantified by the three partial PDFs from ab initio molecular dynamics. Each model glass, with specific chemical composition as CuXZr100−X (x = 50, 56, 60, 64), contains ~20,000 atoms with dimensions of 7 × 7 × 7 nm3. In RMC procedure, the fitting process was corrected by observing error coefficient χ 2 which denotes the deviation between the experimental and simulation data and drives the simulation process.
χ 2 = i m ( S C a l ( Q i ) S E x p ( Q i ) ) 2 / σ ( Q i ) 2
where S E x p ( Q i ) is structure factor from synchrotron XRD and S C a l ( Q i ) is the calculated values from the current model. i is the intersection point of the two data about Q , and, m is the number of such intersections.   σ ( Q i ) is the experimental error for the ith data point. If the partial PDFs were fitted, accordingly replace S E x p ( Q i ) in Equation (1) with g E x p ( r i ) . When the calculation begins, the system randomly moves the atoms and starts calculating χ 2 . If χ o l d 2 > χ n e w 2 , the new configuration is accepted. Conversely, the move is accepted with probability exp ( χ n e w 2 χ o l d 2 ) / 2 . If there are atoms in the configuration that are too close (closer than their hard sphere cutoff) and the move is to move them above the hard sphere cutoff, or at least to increase their distance, then the move is accepted regardless of the change in the χ 2 .During the fitting process, χ 2 gradually decreases until it converges to a certain value. It is worth mentioning here that the configuration of RMC does not have an equivalent cooling rate.

3. Results and Discussion

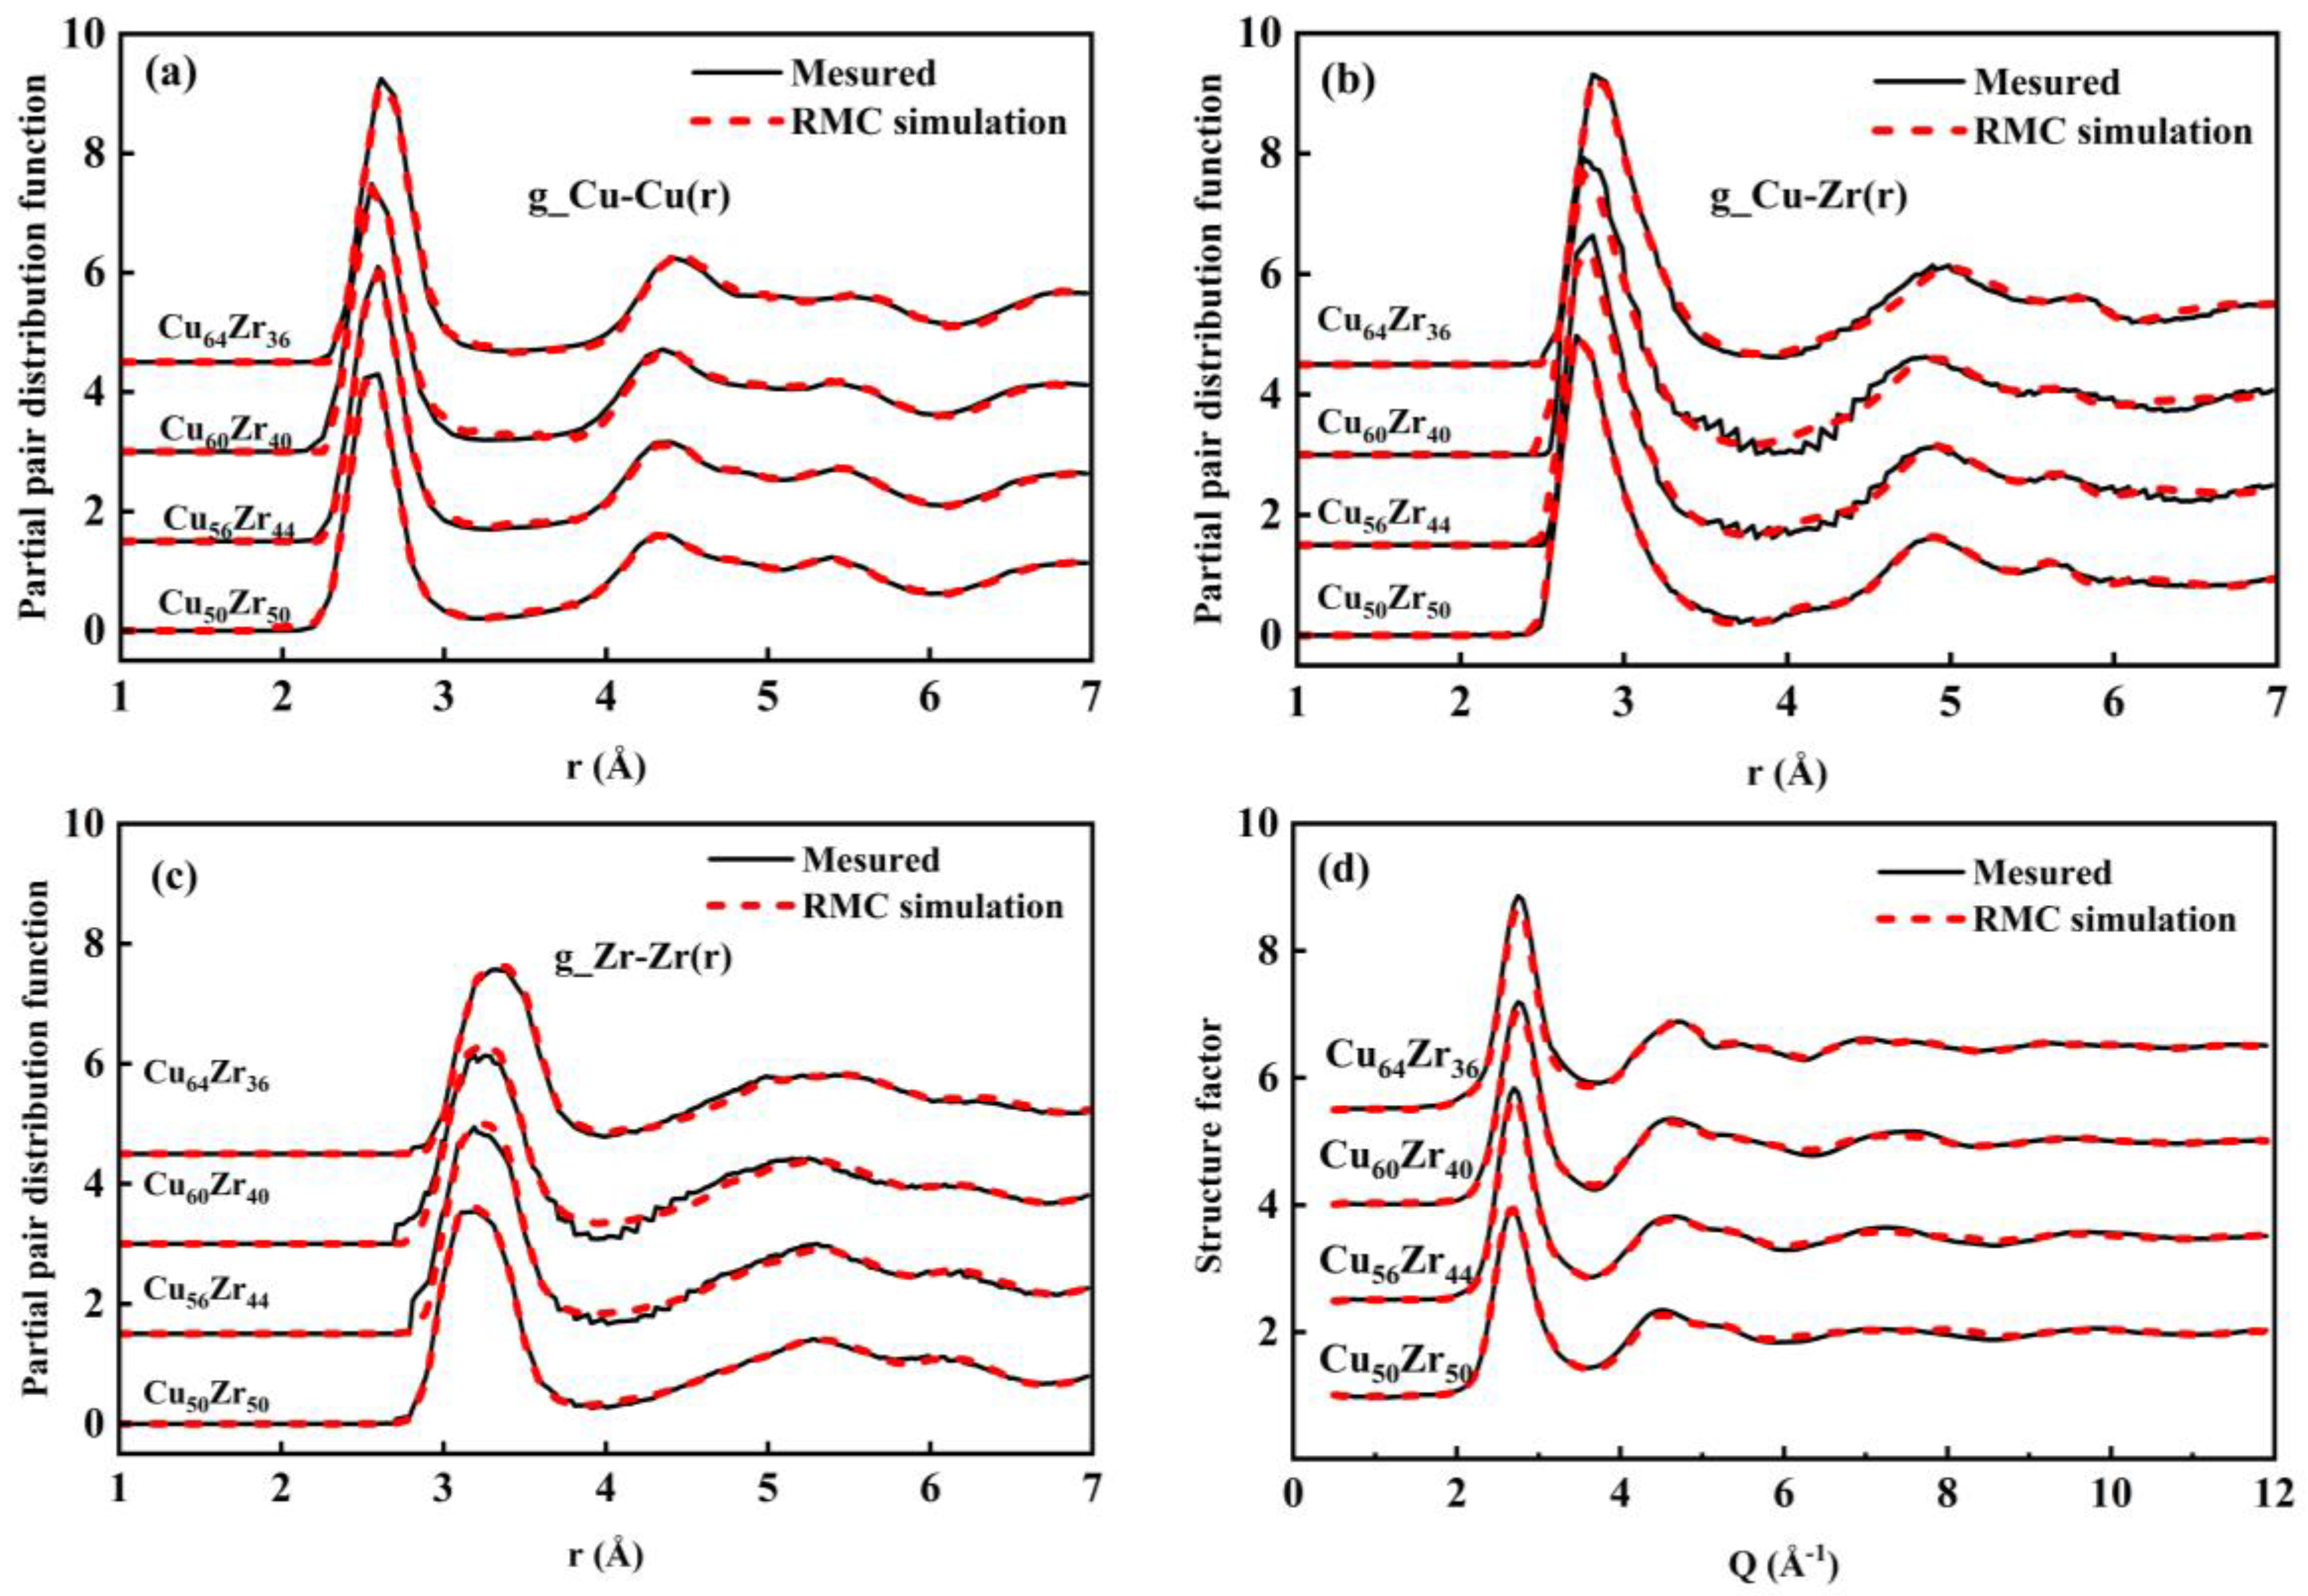
3.1. Reverse Monte Carlo Model

To ensure the reliability of the simulated configurations obtained from RMC modeling, we directly compared the RMC results and the diffraction data from experiments. The results are shown in Figure 1. Here, the generally accepted structural descriptions such as partial PDFs and structural factors are used to quantify the structural fingerprints of the tested four MGs CuXZr100−X (x = 50, 56, 60, 64). It is intuitive to observe the almost perfect consistence between the RMC simulation and the measured data. Such good overlap with the reality provides direct evidence that the utilization of RMC procedure leads to a reasonable configuration with atomic arrangements matching the packing manners of the experimental glass. Subsequent Figure 2 shows the comparison between the K-edge spectrum of EXAFS and the theoretical spectrum of RMC configurations. Such comparison also confirms this point. Here, Figure 2a shows the K-edge spectrum of Cu and Figure 2b shows the K-edge spectrum of Zr. Although there are some differences in the high-k region of the Zr-edge spectrum (which may come from the experimental error being amplified by the k-3th power weight), the main few peaks we need in the front are in good agreement with each other. In addition, it should be noted that the K-edge spectrums of EXAFS has been phase correction.

3.2. Short Range Structure Analysis

To characterize the atomic scale structure of MGs, the Voronoi tessellation analysis was carried out [53]. Figure 3 shows the distribution of the 12 most frequent Voronoi polyhedron for the four CuXZr100−X (x = 50, 56, 60, 64) MGs, respectively. It is intuitive to see that icosahedral or icosahedral-like clusters such as <0,2,8,2>, <0,3,6,4>, <0,0,12,0>, <0,1,10,2>, <0,2,8,1> have the dominating fraction which show the directly experimental evidence to validate the previous simulated results [54,55]. It should be mentioned here that there is no considerable content of crystal-like clusters [56] (such as <0,4,4,6>,<0,4,4,5> which express a high degree of quadratic and hexagonal symmetry clusters.) in our configuration, which may be due to the fact that the amorphous state of the configuration we obtained is better. In addition, the fraction of Frank-Kasper polyhedra, such as <0,0,12,0> and <0,1,10,2> shows a growing trend with the increasing of the Cu content. As extensively reported in the literature [9,55,57], such Voronoi motifs are geometrically favored with a high degree of symmetry as well as dense packing and thus the strong deformation resistance under thermal or loading stimuli. In this connection, the observed highest fraction of these solid-like clusters in the Cu64Zr36 MGs implies that it is best correlated with ordered atomic packings, which are expected to be the most resistant to deformation when compared with the other three MGs. This may also be one of the reasons for the great glass formation capacity of Cu64Zr36 system.
The effect of Cu content on the exact manners of atomic packings can then be intuitively uncovered by the spatial distribution of structural indicators. For example, we plotted sample snapshots of CuXZr100−X (x = 50, 56, 60, 64) glasses, with atoms color coded via the atomic number density, as shown in Figure 4. Since color blue represents local regions with low density, whereas color red corresponds to areas with high density, Figure 4 gives the visualized evidence for the inherent inhomogeneous structural field in MGs. In addition, it is intuitive to see that the most uniform and loose atomic packing appears in Cu50Zr50 MGs. As the Cu content rises, CuXZr100−X MGs are accompanied with an increase in the atomic density which are placed in a more inhomogeneous manner. This observation is further verified by the statistical calculation, which shows that the average atomic number density for CuXZr100−X (x = 50, 56, 60, 64) MGs are 0.05770 Å−3, 0.5787 Å−3, 0.05788 Å−3 and 0.05788 Å−3, respectively. Such phenomena indicate that more Cu contents will reduce the content of free volume [58] which quantifies the structural defects in glasses and is usually negatively correlated with the atomic number density, and thus makes the microstructure denser.
More evidence to demonstrate the effect of Cu contents on inducing stable clusters is in light of the spatial distribution of local five-fold symmetry (LFFS). Here, LFFS is defined as the fraction of pentagons in each short-range cluster. Based on the Voronoi index which has the form < n 3 , n 4 , n 5 , n 6 , , n i , >, LFFS can be calculated as L F T S = n 5 /   n i . Figure 5 shows the spatial distribution of LFFS for the four model glasses CuXZr100−X (x = 50, 56, 60, 64). It shows that LFFS field is also inhomogeneous with full icosahedral clusters (usually represents <0,0,12,0>) yielding the maximum value of LFFS which is marked by the color red. In addition, it is intuitive that the number of full icosahedral clusters shows a growing trend with the increase of Cu content in CuXZr100−X (x = 50, 56, 60, 64) MGs. Moreover, the spatial spacing between full icosahedral clusters is smaller in Cu50Zr50 when compared with the other three systems, while the full icosahedral clusters in Cu64Zr36 are more likely to aggregate and connect with each, thus forming the hard backbone network.

3.3. MRO and Its Defects Characterization

As is widely discussed in the community, the structural fingerprints of dynamics, thermal features and plastic deformation in MGs are not fully embedded in the short-range order, but rather the structural origin of these processes can be traced back to the several shells of the radial distribution functions, namely medium range order (MRO). To investigate the MRO structure, we first introduced the dominant polyhedra ratio ( F n ) [29] in the four tested glasses. The definition of F n is as follows:
F n = N n / N c u t o f f
where F n is the fraction of the n major dominant polyhedra among all polyhedra in the local range, N n denotes the number of all dominant polyhedra within the cut-off distance, and N c u t o f f is the total number of atoms within the cutoff distance which is set as 7.6 Å for the Cu-Zr MGs in this work. Here, n = 10   is used to calculate the value of F n . In terms of its definition, the value of F n quantifies the degree of aggregation of dominating clusters in a local region. Since the dominating cluster in the present CuZr MGs is full icosahedral clusters, see Figure 6, it is expected that F n can characterize the connection of full icosahedral clusters and thus reflect the orderliness of the structure in the local region, which also can be used to classify liquid-like and solid-like regions. Here, high F n regions are marked by the color red while regions with relatively low value of F n are represented by blue atoms. It is obvious that all of the model glasses show an inhomogeneous distribution of F n . Additionally, for MGs with lower content, the length scale of the weak regions characterized by the low fraction of   F n is wider, while the size of the strong regions grows significantly with increasing Cu content. This implies that the distribution of F n can reflect the MRO characteristics which are more representative of the overall structure when compared with short range order.
Subsequently, we have developed a procedure to quantify the MRO (the extracted MRO did not distinguish between isotropic and anisotropic) by identifying the number of connected full icosahedral clusters in MGs. Here, we employed this procedure to demonstrate the glass configurations obtained from the combination of experiments and simulations. The results are shown in Figure 7. All of the full icosahedral clusters <0,0,12,0> have been extracted as the basic unit. It should be noted that the largest hard network with the maximum number of icosahedral clusters is marked by the color white. As shown in Figure 7, in addition to the hard backbone, there are also separated <0,0,12,0> clusters, namely the supercluster groups. Naturally, the full icosahedral network does not fill the whole space; there are also some other cluster groups, such as the space in the gap as shown in Figure 7e which is 1 nm slice from Cu60Zr40 MGs. Direct comparison among the four glasses indicates that the number of superclusters shows a decreasing trend with the increasing of the Cu contents, leading to continuously expanding bones that fill most of the space. This is evidenced by the maximum areas occupied by white backbones in Cu64Zr36 glasses when compared with the other three models. In reality, the existence of these superclusters implies the disconnection and interface between icosahedral clusters. In our previous work [29,31], such interface is formed via the generation of soft regions (clusters with poor kinetic stability) and can be used to characterize the MRO defect. To be more specific, the MRO defects are the interrupted connectivity of the full icosahedral bones [31], as shown in Figure 8 (structure extracted from the interruption of full icosahedral clusters of the Cu60Zr40 sample). In other words, the weak connection between the agglomerates leads to an increase in the free volume content of the local soft zone and manifests itself as an MRO defect in metallic glass. As discussed in Reference [29] and Reference [31], these MRO defects play a key role in the mechanical failure process of metallic glass. It should be noted that the cavity in Figure 8 is not devoid of atoms; actually, it is the consequence of the visualization of only icosahedral clusters as Figure 8 shows only the atoms involved in the complete icosahedral cluster and the boundary atoms that break the bones. Such an apparent void is thus a reflection of the interface that breaks the hard backbone. In order to statistically show the distribution of MRO defects in CuZr MGs with different compositions, the number of <0,0,12,0> cluster and the number of networks formed by icosahedral clusters have been counted and shown in Table 1. As is widely reported [11,59], the addition of Cu atoms gives rise to a greater number of full icosahedral clusters which then drives to the higher degree of connection among them, and thus leads to greater hard network and MRO. In this case, more full icosahedral clusters are assembled to form the major solid-like network with larger length scale, causing the annihilation of separated full icosahedral clusters as evidenced by the increasing number of networks. It should be mentioned here that the number of atoms in bones for Cu50Zr50 MGs is much lower than for the other MGs with different components. This is because only the atomic number of the largest bone is counted here. The number of hard networks is proportional to the density of MRO defects, and it can be intuitively found from the data that the increase in Cu content has significantly reduced the number of hard networks. Such phenomena also reflect the reduction in the density of structural MRO defects. From the statistical results, Cu64Zr36 has the least number of defects, (although comparable to Cu60Zr40, its main bone atoms are more abundant). This can be assumed as the reason for the stable kinetic properties and good glass formation ability of Cu64Zr36 MGs. In addition to the high content of full icosahedral clusters <0,0,12,0>, their close connection with each other to form a major hard backbone with fewer MRO defects is also an important reason.

4. Conclusions

In summary, through a combination of RMC, ab initio molecular dynamics simulations data and synchrotron X-ray diffraction, we obtained atomic packings of four model glasses CuXZr100−X (x = 50, 56, 60, 64) in reality. The agreement between theoretical EXAFS spectra of RMC models and experimental data obtained from EXAFS ensure the reliability of these obtained atomic configurations. Further structural characterizations via Voronoi Polyhedron, atomic number density, LFFS, F n and MRO defects indicators were conducted to analyze the effect of chemical composition on the short to medium range structural features in MGs. The exact conclusions are listed below:
(1)
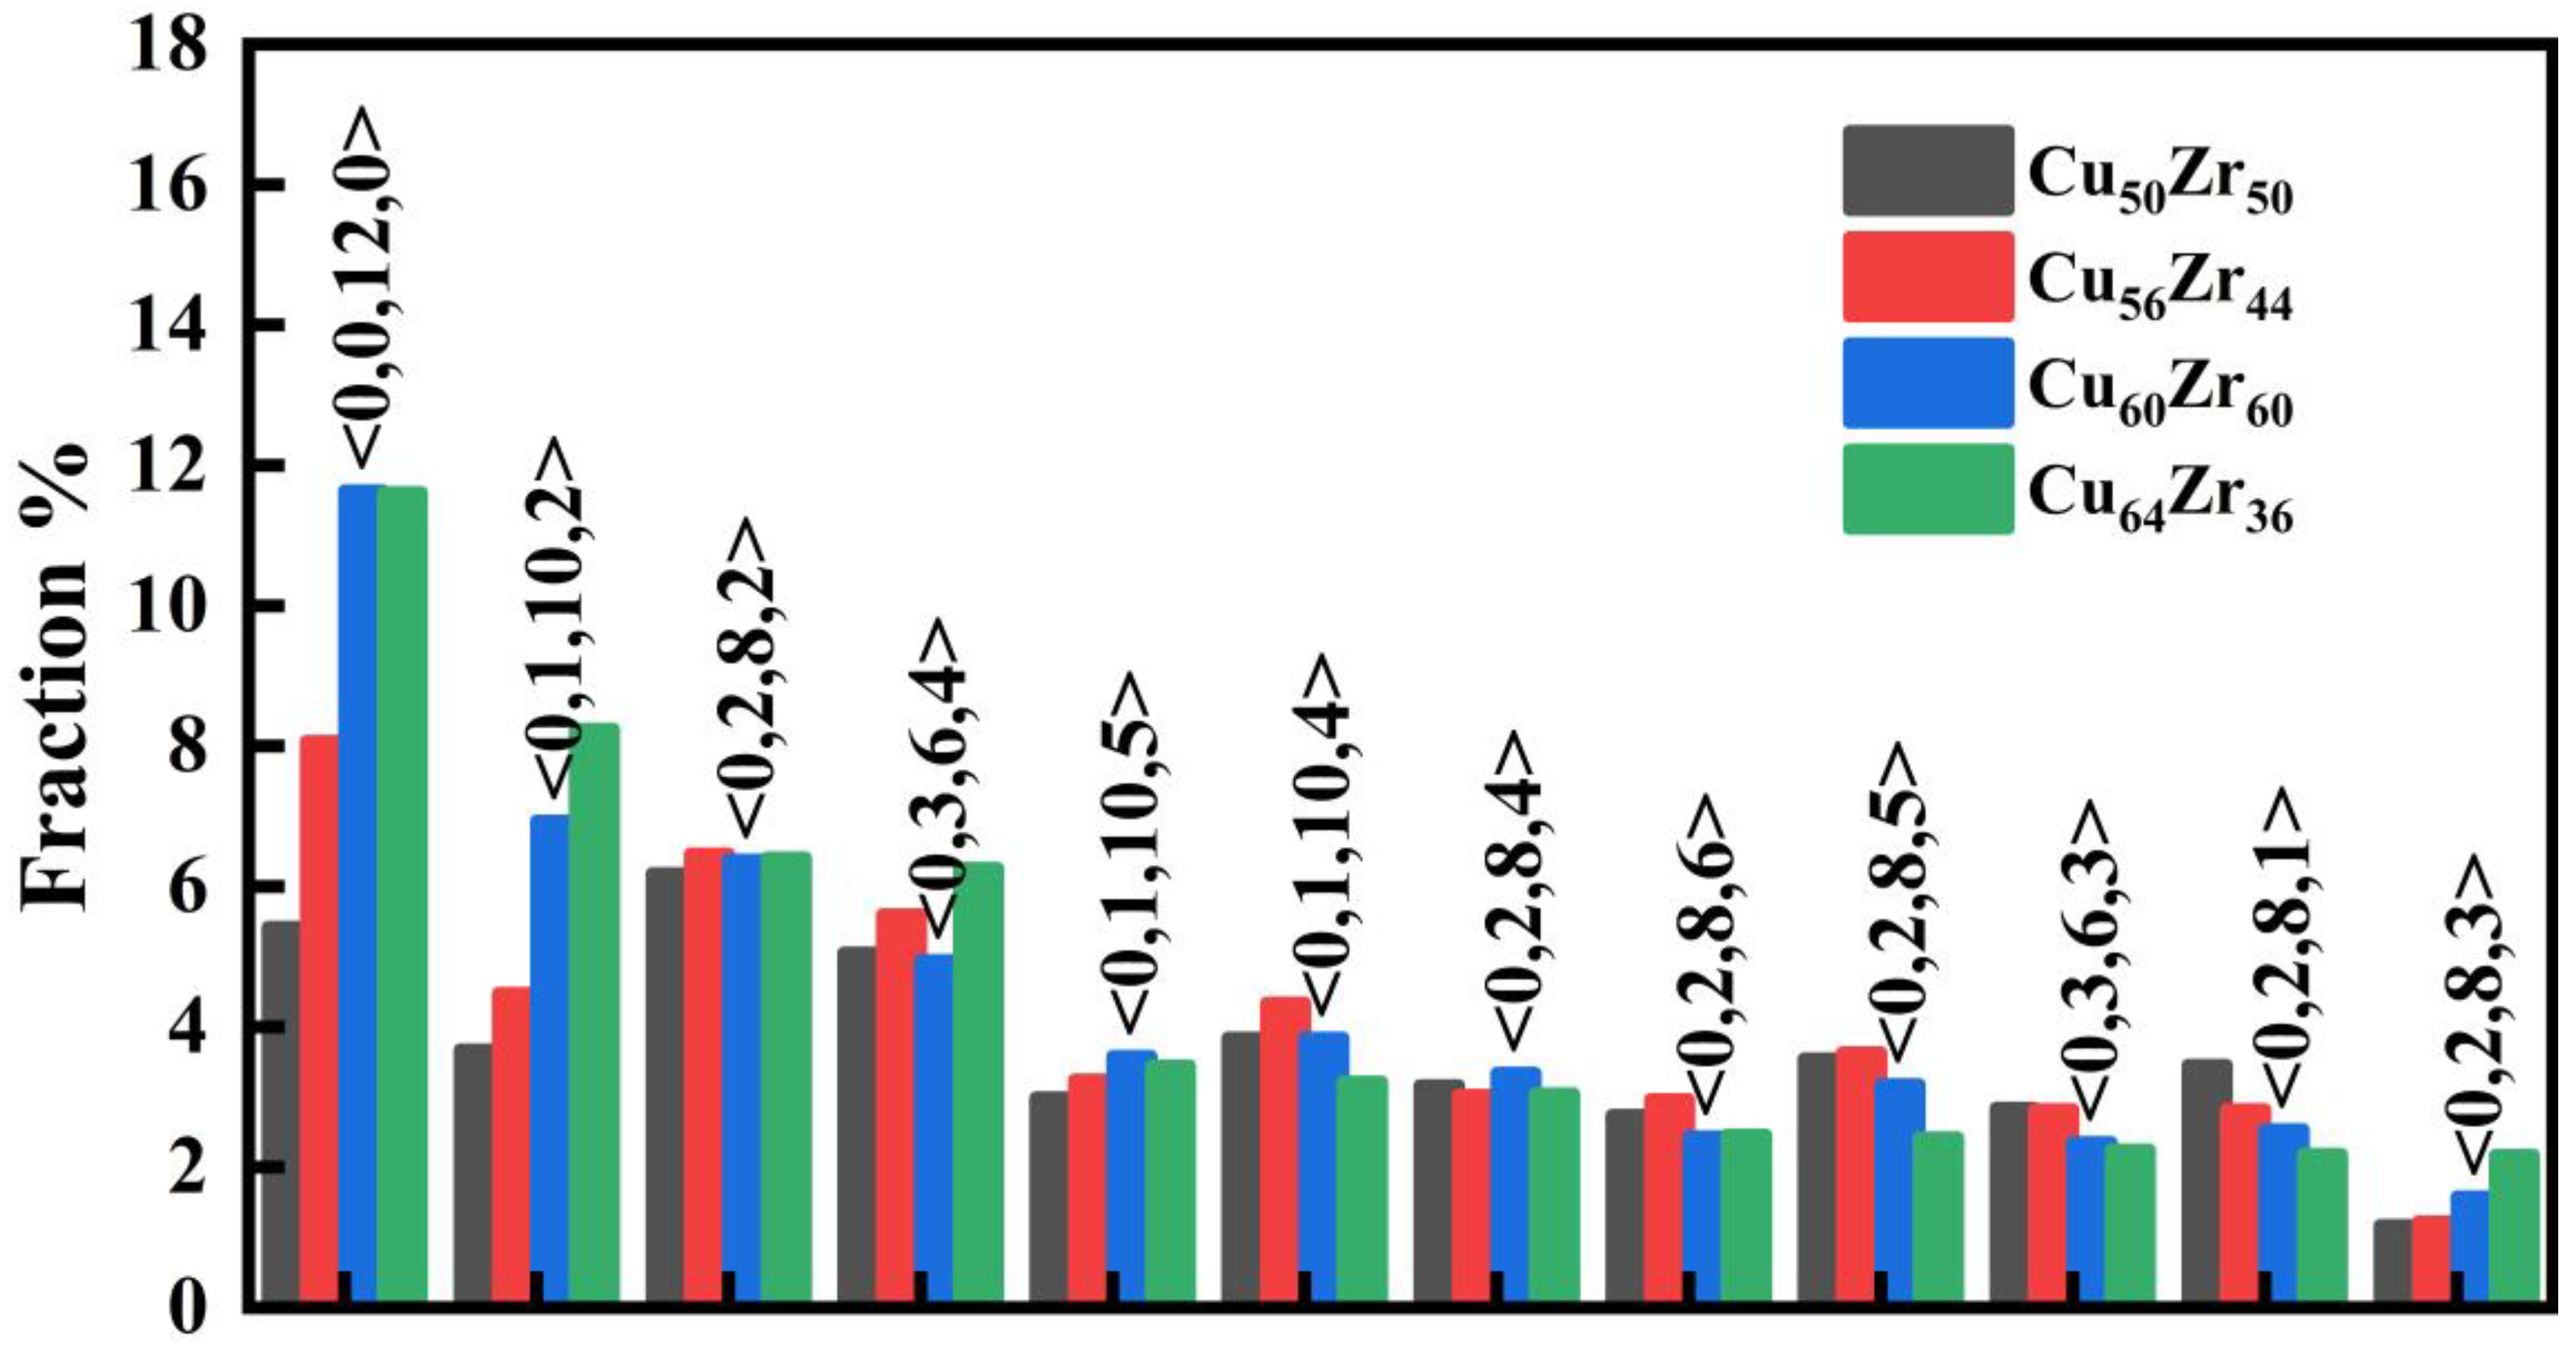
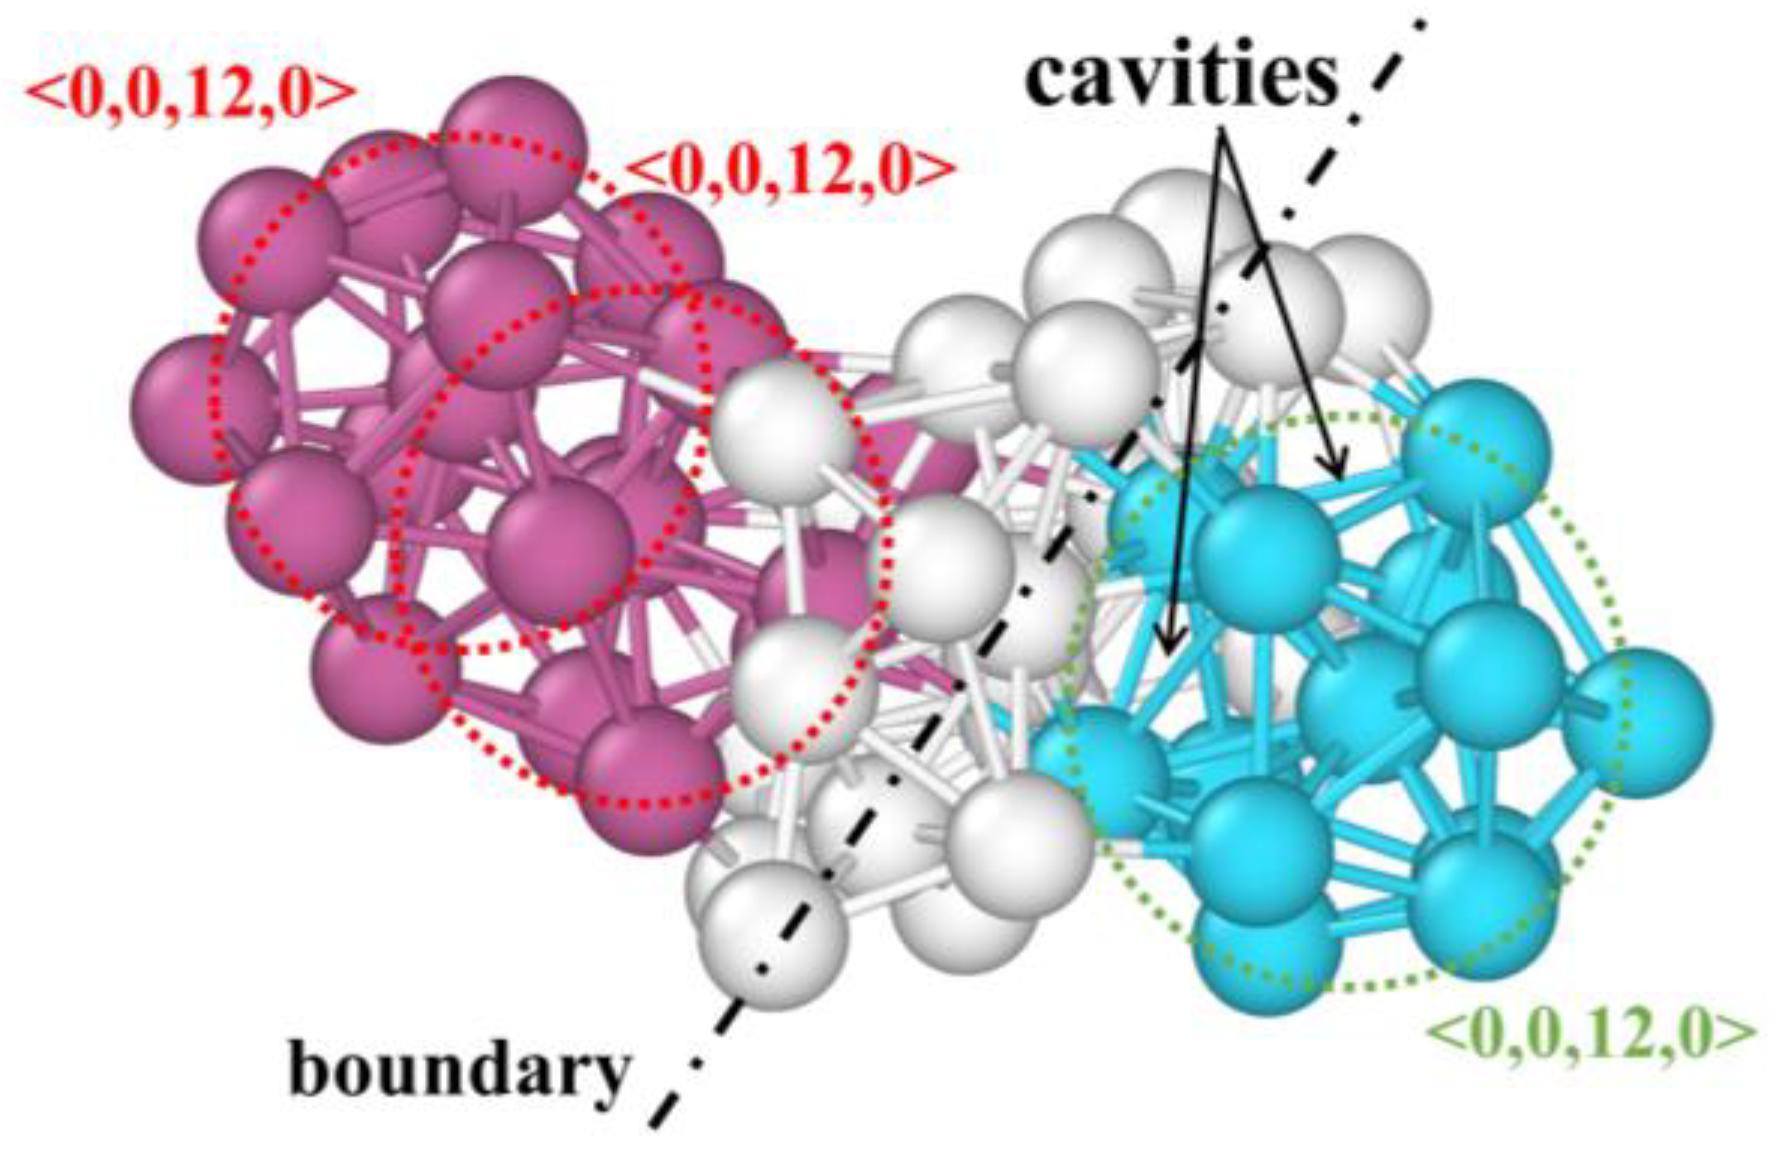
In RMC models, <0,0,12,0> and <0,1,10,2> dominates in MGs, and becomes more abundant with increasing Cu content, which makes the structures of MGs more stable.
(2)
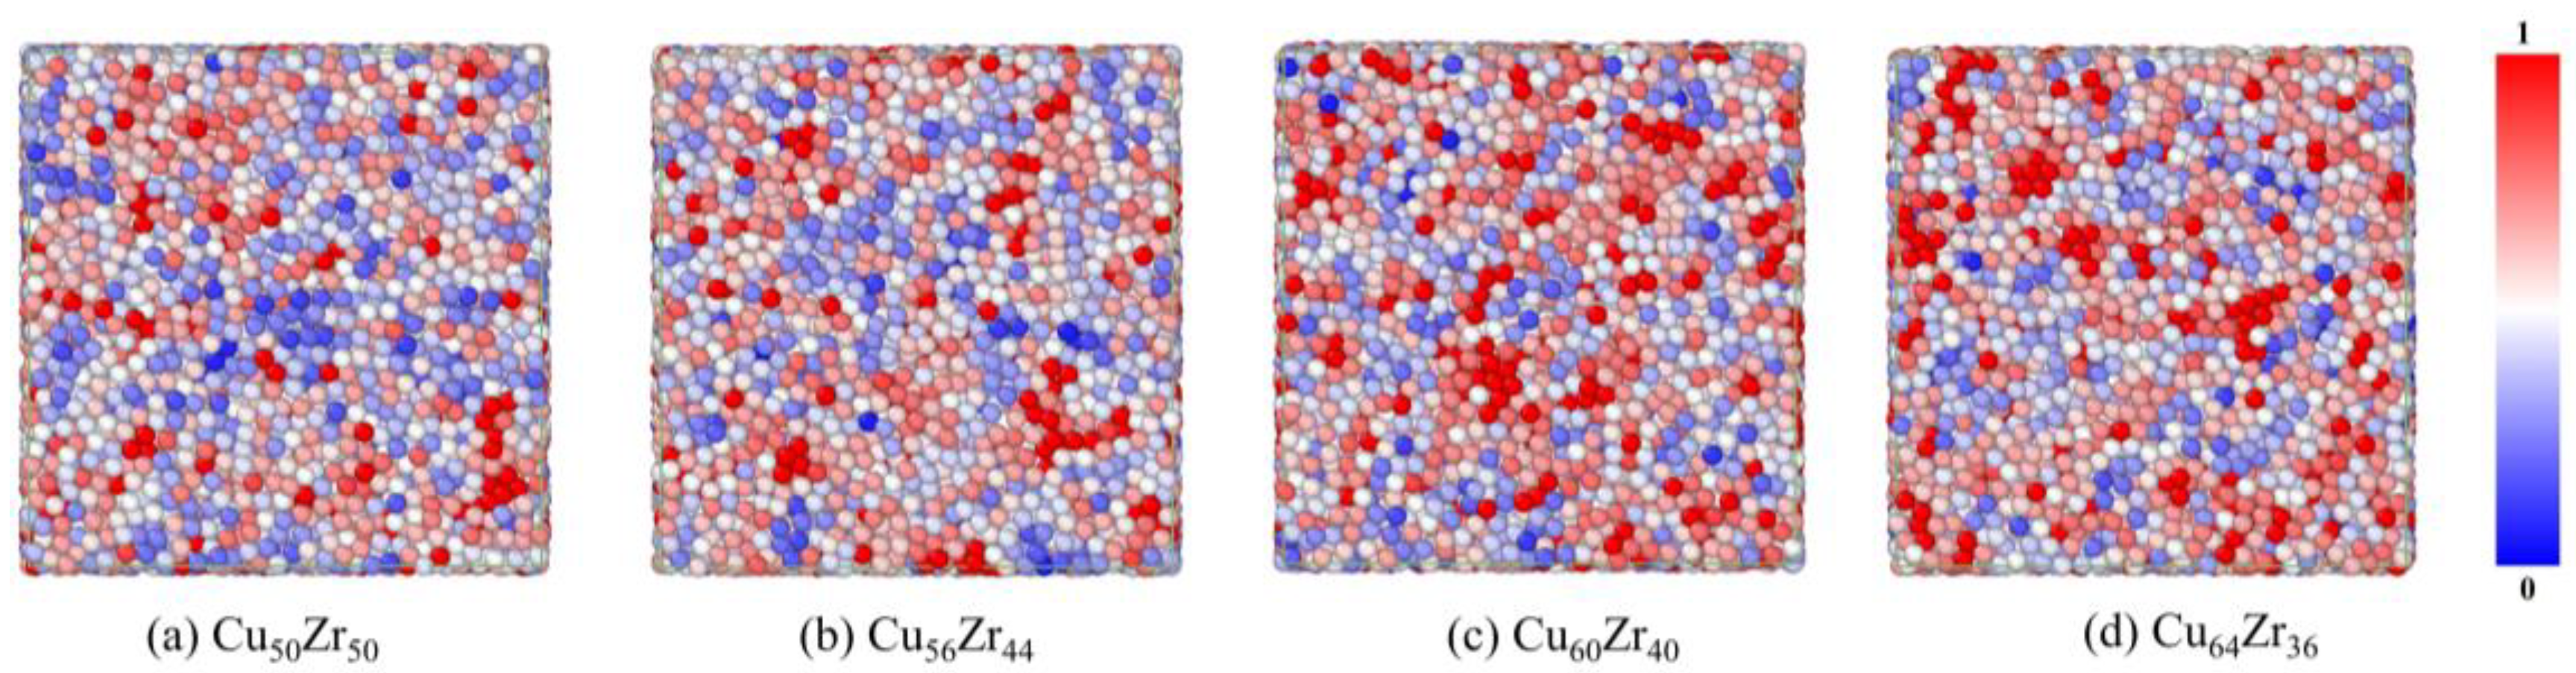
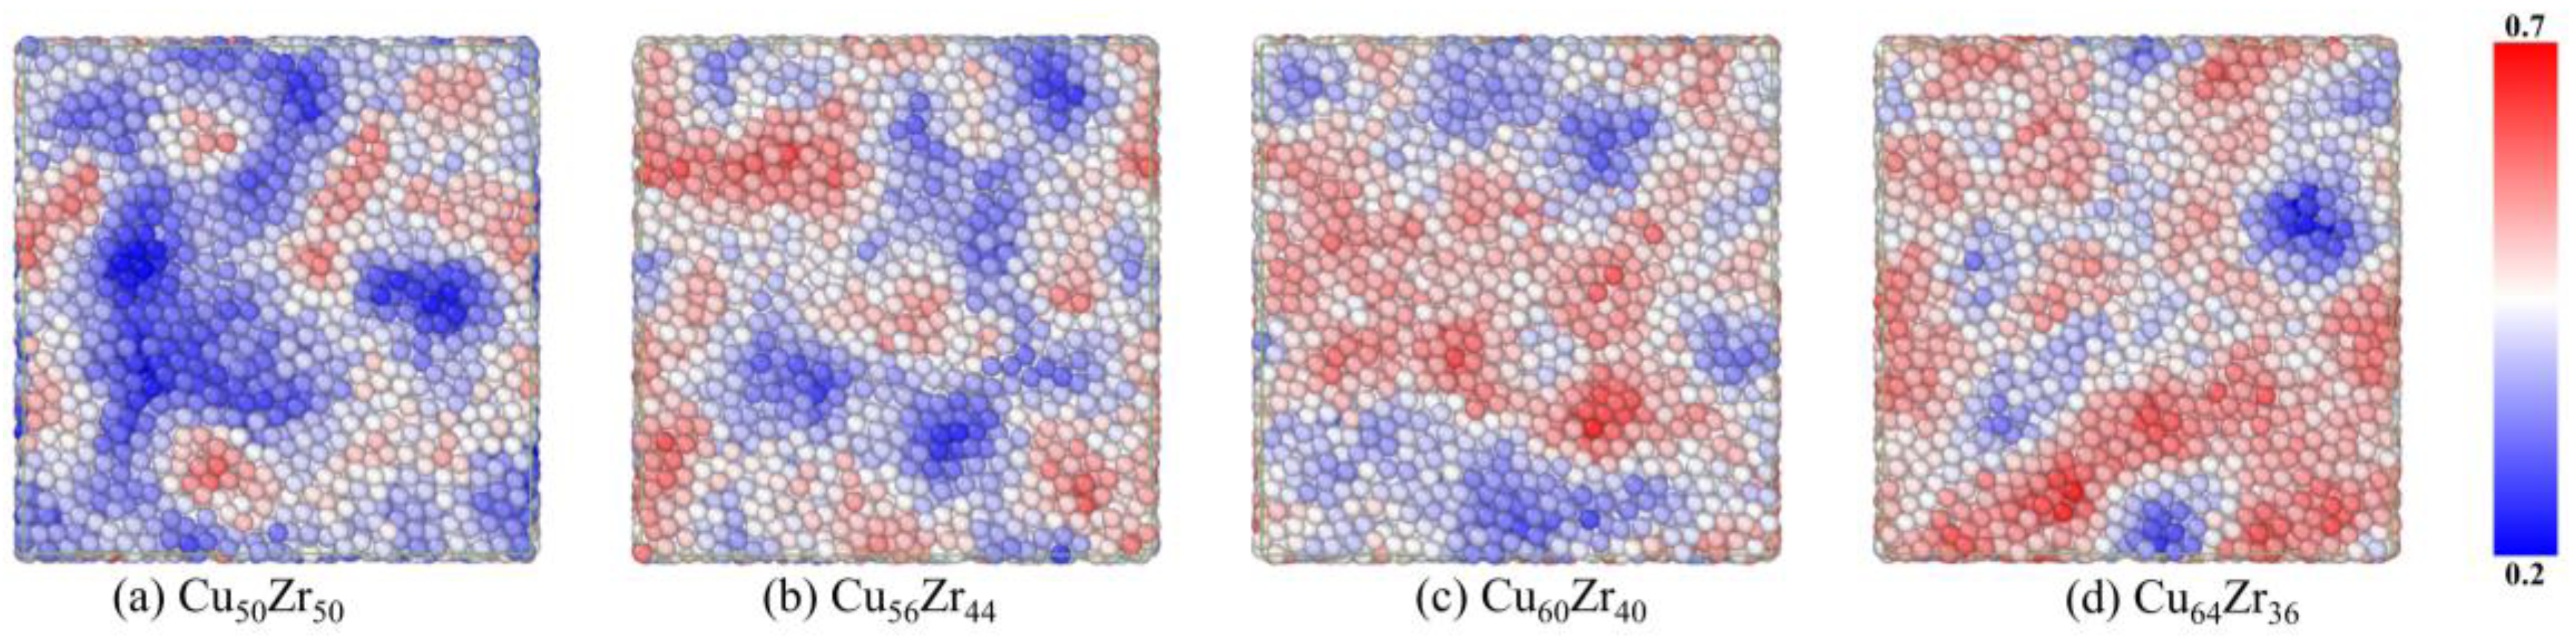
Relative to the short-range order characteristic indicators (LFFS and atomic number density), new methods of describing the MRO were developed, of which F n as well as MRO defects show some effectiveness.
(3)
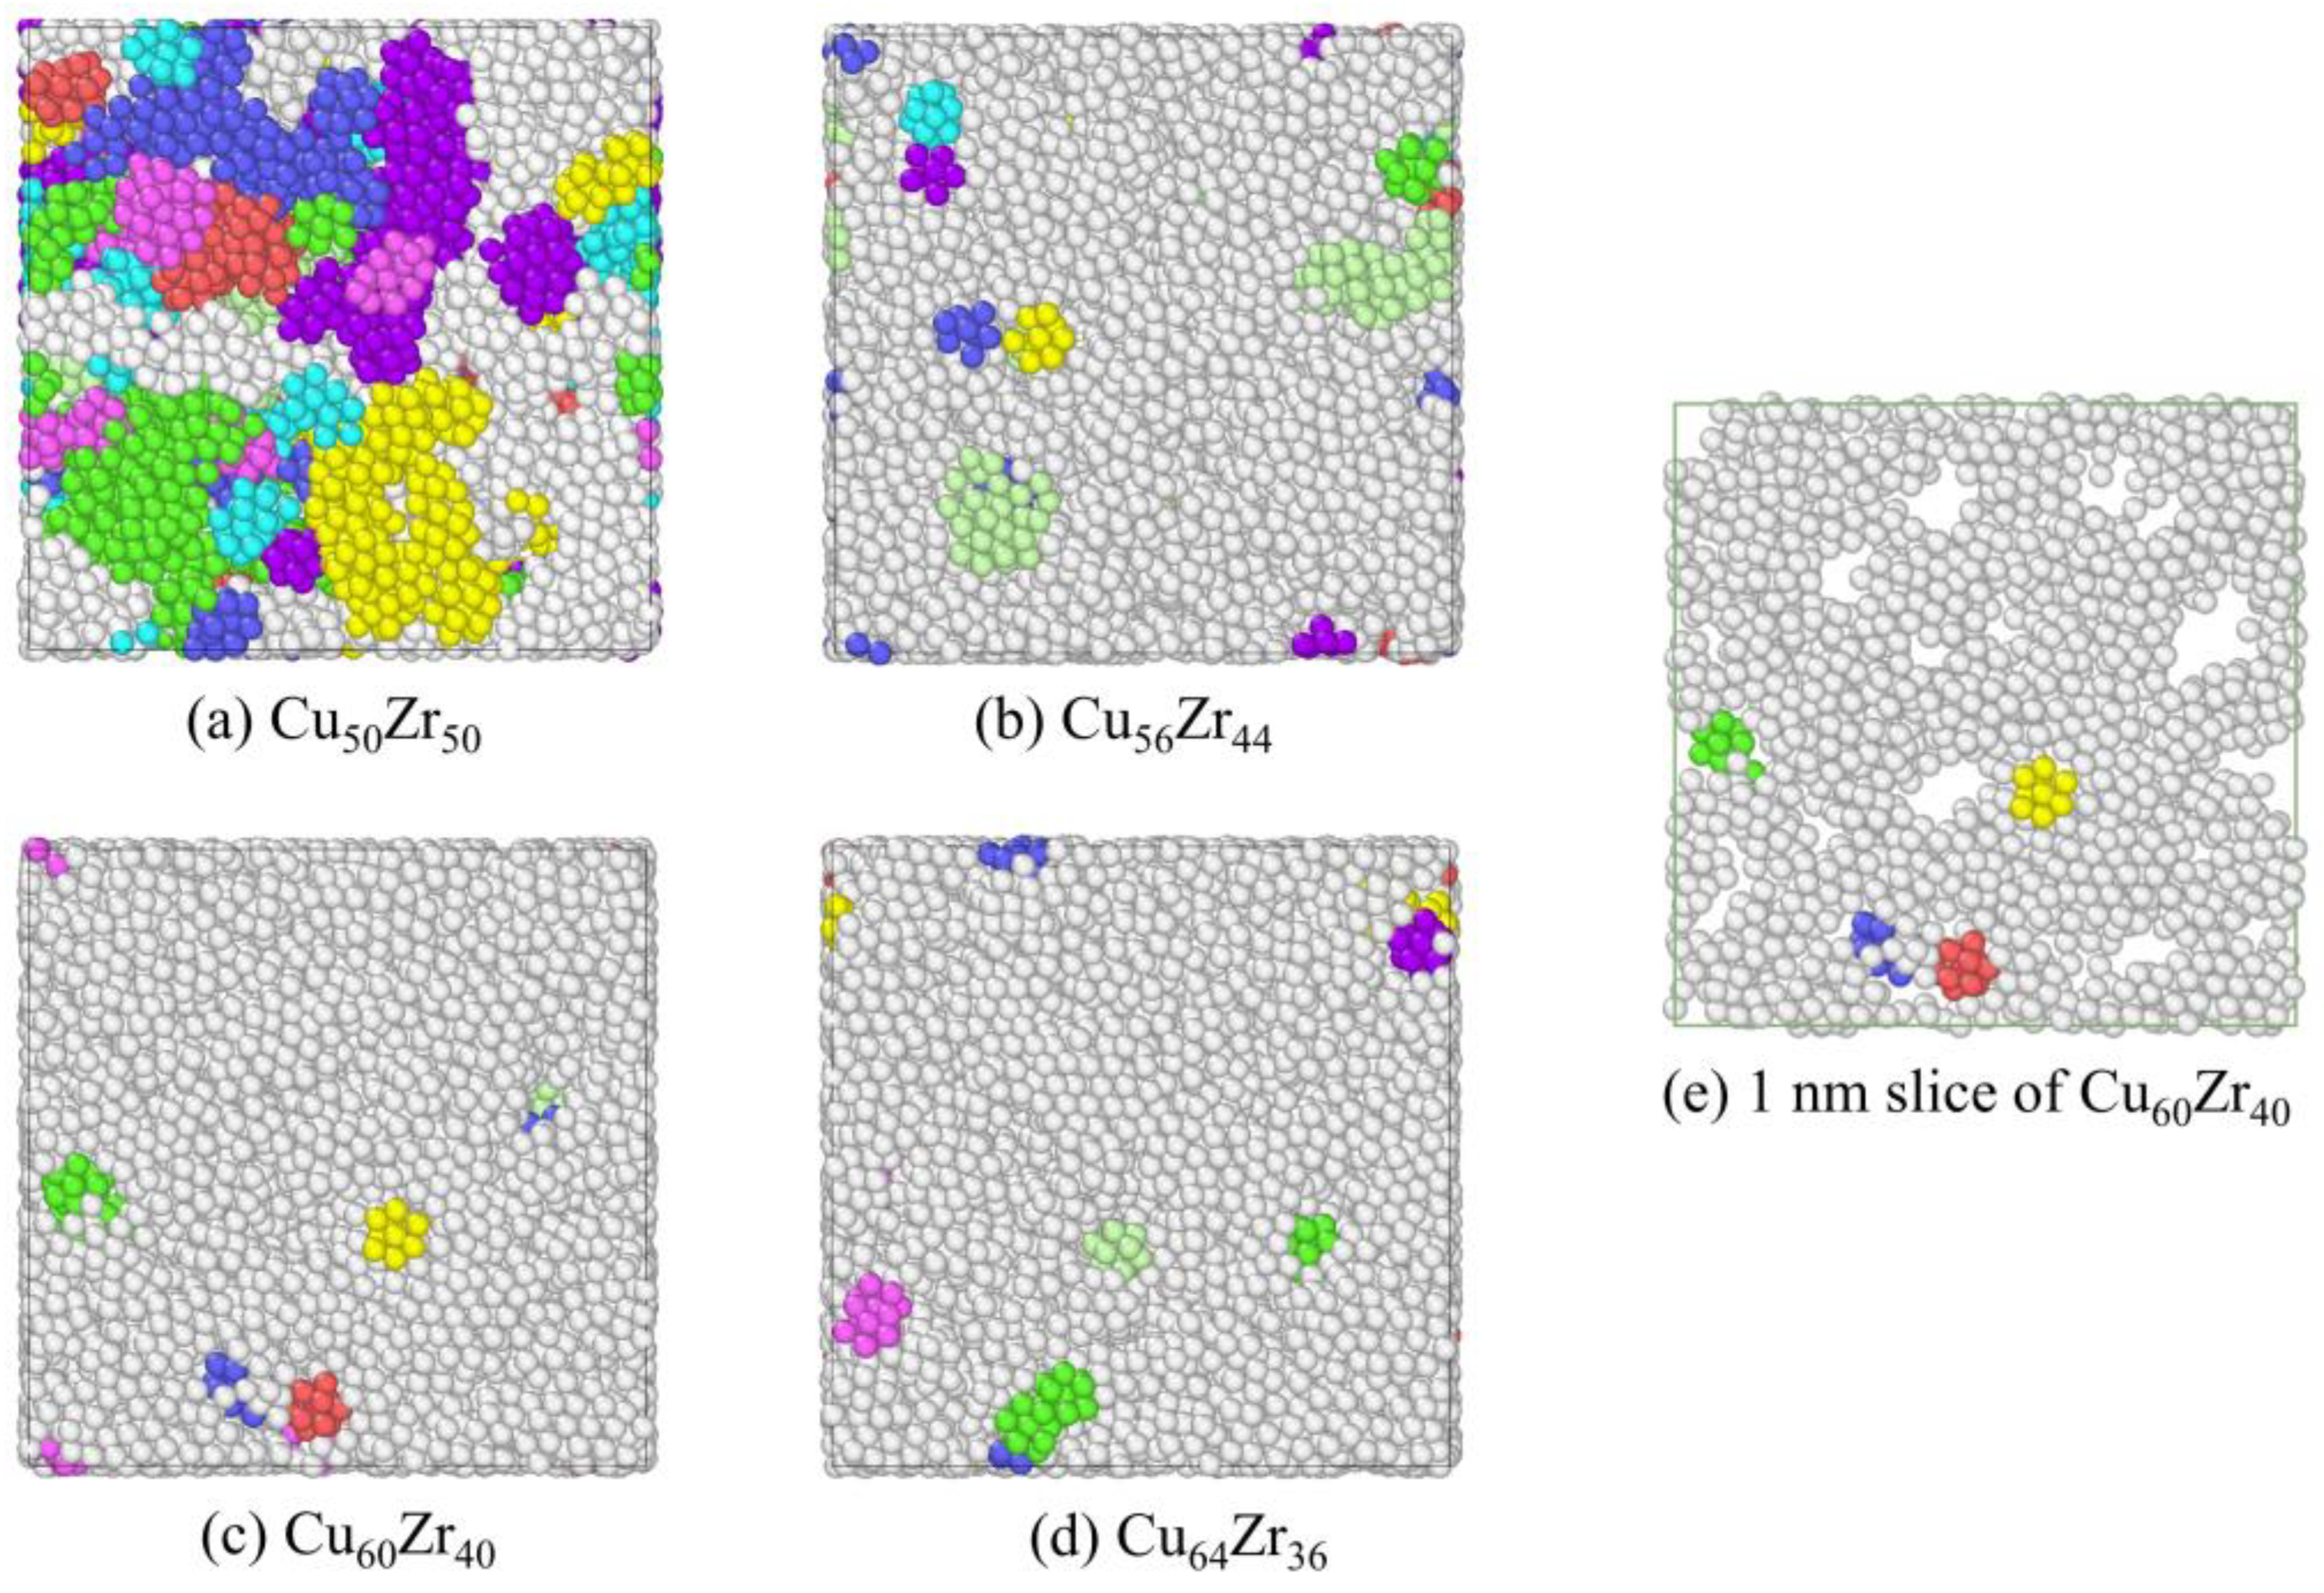
Using the developed MRO identification procedure, it was found that an increase in Cu content leads to an increase in full icosahedral clusters and a tendency to interconnect to form large bone regions, thus reducing the density of MRO defects. It implies that lower MRO defects may also be an important reason for the higher glass forming ability and more stable kinetic properties of Cu64Zr36 MGs.

Author Contributions

Conceptualization, X.H. and J.L.; Methodology, Y.L.; Software, Y.L. and S.H.; Validation, X.H. and J.L.; Formal Analysis, Y.L.; Investigation, Y.L.; Resources, Y.L.; Data Curation, Y.L and H.H.; Writing—Original Draft Preparation, Y.L. and S.H.; Writing—Review & Editing, X.H.; Visualization, Y.L.; Supervision, J.L.; Project Administration, X.H.; Funding Acquisition, X.H. All authors have read and agreed to the published version of the manuscript.

Funding

The work is financially supported by National Natural Science Foundation of China (grant no. 11772313).

Data Availability Statement

Data will be made available on request.

Conflicts of Interest

The authors declare no conflict of interest.

References

  1. Klement, W.K.; Willens, R.H.; Duwez, P. Non-Crystalline Structure in Solidified Gold–Silicon Alloys. Nature 1960, 187, 869–870. [Google Scholar] [CrossRef]
  2. Schuh, C.A.; Hufnagel, T.C.; Ramamurty, U. Mechanical behavior of amorphous alloys. Acta Mater. 2007, 55, 4067–4109. [Google Scholar] [CrossRef]
  3. Falk, M.L.; Langer, J.S. Deformation and Failure of Amorphous Solidlike Materials. Annu. Rev. Condens. Matter Phys. 2010, 2, 353–373. [Google Scholar] [CrossRef] [Green Version]
  4. Wei, H.W. The Elastic Properties, Elastic Models and Elastic Perspectives of Metallic Glasses. Prog. Mater. Sci. 2012, 57, 487–656. [Google Scholar] [CrossRef]
  5. Wang, Q.; Ding, D.; Xia, L. Formability and Magnetic Properties of the Binary Nd-Co Amorphous Alloys. Metals 2021, 11, 1730. [Google Scholar] [CrossRef]
  6. Hitit, A.; Yazici, Z.O.; Şahin, H.; Öztürk, P.; Eryeşil, B.; Barut, N. Microstructure and Mechanical Properties of CoWB Based Composites Produced by Crystallization of Ni-Co-Zr-Ta-W-B Bulk Metallic Glass. Metals 2022, 12, 251. [Google Scholar] [CrossRef]
  7. Hirata, A.; Kang, L.J.; Fujita, T.; Klumov, B.; Matsue, K.; Kotani, M.; Yavari, A.R.; Chen, M.W. Geometric frustration of icosahedron in metallic glasses. Science 2013, 341, 376–379. [Google Scholar] [CrossRef]
  8. Liu, Y.H.; Wang, G.; Wang, R.J.; Zhao, D.Q.; Pan, M.X.; Wang, W.H. Super Plastic Bulk Metallic Glasses at Room Temperature. Science 2007, 315, 1385–1388. [Google Scholar] [CrossRef]
  9. Sheng, H.W.; Luo, W.K.; Alamgir, F.M.; Bai, J.M.; Ma, E. Atomic packing and short-to-medium-range order in metallic glasses. Nature 2006, 439, 419–425. [Google Scholar] [CrossRef]
  10. Yang, Z.-Y.; Wang, Y.-J.; Dai, L.-H. Susceptibility of shear banding to chemical short-range order in metallic glasses. Scr. Mater. 2019, 162, 141–145. [Google Scholar] [CrossRef]
  11. Cheng, Y.Q.; Ma, E. Atomic-level structure and structure–property relationship in metallic glasses. Prog. Mater. Sci. 2011, 56, 379–473. [Google Scholar] [CrossRef]
  12. Sun, Y.L.; Shen, J. Icosahedral ordering in Cu60Zr40 metallic glass: Molecular dynamics simulations. J. Non-Cryst. Solids 2009, 355, 1557–1560. [Google Scholar] [CrossRef]
  13. Wakeda, M.; Shibutani, Y. Icosahedral clustering with medium-range order and local elastic properties of amorphous metals. Acta Mater. 2010, 58, 3963–3969. [Google Scholar] [CrossRef]
  14. Wu, Z.W.; Li, M.Z.; Wang, W.H.; Liu, K.X. Correlation between structural relaxation and connectivity of icosahedral clusters in CuZr metallic glass-forming liquids. Phys. Rev. B 2013, 88, 054202. [Google Scholar] [CrossRef]
  15. Ding, J.; Cheng, Y.-Q.; Ma, E. Full icosahedra dominate local order in Cu64Zr34 metallic glass and supercooled liquid. Acta Mater. 2014, 69, 343–354. [Google Scholar] [CrossRef]
  16. Hu, Y.C.; Li, F.X.; Li, M.Z.; Bai, H.Y.; Wang, W.H. Five-fold symmetry as indicator of dynamic arrest in metallic glass-forming liquids. Nat. Commun. 2015, 6, 8310. [Google Scholar] [CrossRef] [Green Version]
  17. Peng, H.L.; Li, M.Z.; Wang, W.H. Structural signature of plastic deformation in metallic glasses. Phys. Rev. Lett. 2011, 106, 135503. [Google Scholar] [CrossRef] [Green Version]
  18. Tian, Z.-L.; Wang, Y.-J.; Chen, Y.; Dai, L.-H. Strain gradient drives shear banding in metallic glasses. Phys. Rev. B 2017, 96, 10. [Google Scholar] [CrossRef] [Green Version]
  19. Lee, M.; Lee, C.-M.; Lee, K.-R.; Ma, E.; Lee, J.-C. Networked interpenetrating connections of icosahedra: Effects on shear transformations in metallic glass. Acta Mater. 2011, 59, 159–170. [Google Scholar] [CrossRef]
  20. Wu, Z.W.; Kob, W.; Wang, W.H.; Xu, L. Stretched and compressed exponentials in the relaxation dynamics of a metallic glass-forming melt. Nat. Commun. 2018, 9, 5334. [Google Scholar] [CrossRef]
  21. Shen, Y.; Perepezko, J.H. Al-based amorphous alloys: Glass-forming ability, crystallization behavior and effects of minor alloying additions. J. Alloy. Compd. 2017, 707, 3–11. [Google Scholar] [CrossRef] [Green Version]
  22. Ren, L.; Gao, T.; Ma, R.; Xie, Q.; Tian, Z.; Chen, Q.; Liang, Y.; Hu, X. The connection of icosahedral and defective icosahedral clusters in medium-range order structures of CuZrAl alloy. J. Non-Cryst. Solids 2019, 521, 119475. [Google Scholar] [CrossRef]
  23. Ding, J.; Cheng, Y.Q.; Ma, E. Correlating local structure with inhomogeneous elastic deformation in a metallic glass. Appl. Phys. Lett. 2012, 101, 33–36. [Google Scholar] [CrossRef]
  24. Hilke, S.; Rösner, H.; Wilde, G. The role of minor alloying in the plasticity of bulk metallic glasses. Scr. Mater. 2020, 188, 50–53. [Google Scholar] [CrossRef]
  25. Argon, A.S. Plastic deformation in metallic glasses. Acta Metall. 1979, 27, 47–58. [Google Scholar] [CrossRef]
  26. Falk, M.L.; Langer, J.S. Dynamics of viscoplastic deformation in amorphous solids. Phys. Rev. E 1998, 57, 7192–7205. [Google Scholar] [CrossRef] [Green Version]
  27. Davani, F.A.; Hilke, S.; Rösner, H.; Geissler, D.; Gebert, A.; Wilde, G. Correlations between the ductility and medium-range order of bulk metallic glasses. J. Appl. Phys. 2020, 128, 015103. [Google Scholar] [CrossRef]
  28. Curran, D. Dynamic failure of solids. Phys. Rep. 1987, 147, 253–388. [Google Scholar] [CrossRef]
  29. Huang, X.; Ling, Z.; Wang, Y.J.; Dai, L.H. Intrinsic structural defects on medium range in metallic glasses. Intermetallics 2016, 75, 36–41. [Google Scholar] [CrossRef] [Green Version]
  30. Xu, B.; Falk, M.L.; Li, J.F.; Kong, L.T. Predicting Shear Transformation Events in Metallic Glasses. Phys. Rev. Lett. 2018, 120, 125503. [Google Scholar] [CrossRef]
  31. Liu, Y.; Luo, J.; Huang, X. Identification of medium range order defects and their critical effect on spallation of Cu64Zr36 metallic glass. J. Alloy. Compd. 2023, 932, 167591. [Google Scholar] [CrossRef]
  32. Zhang, Y.; Zhang, F.; Wang, C.Z.; Mendelev, M.I.; Kramer, M.J.; Ho, K.M. Cooling rates dependence of medium-range order development inCu64.5Zr35.5metallic glass. Phys. Rev. B 2015, 91, 064105. [Google Scholar] [CrossRef] [Green Version]
  33. Nosé, S. A unified formulation of the constant temperature molecular dynamics methods. J. Chem. Phys. 1984, 81, 511–519. [Google Scholar] [CrossRef] [Green Version]
  34. Feng, S.; Qi, L.; Wang, L.; Pan, S.; Ma, M.; Zhang, X.; Li, G.; Liu, R. Atomic structure of shear bands in Cu64Zr36 metallic glasses studied by molecular dynamics simulations. Acta Mater. 2015, 95, 236–243. [Google Scholar] [CrossRef]
  35. Yu, Q.; Wang, X.D.; Lou, H.B.; Cao, Q.P.; Jiang, J.Z. Atomic packing in Fe-based metallic glasses. Acta Mater. 2016, 102, 116–124. [Google Scholar] [CrossRef]
  36. McGreevy, L.R. Reverse Monte Carlo modelling. J. Phys. Condens. Matter 2001, 13, R877. [Google Scholar] [CrossRef]
  37. Harada, M.; Ikegami, R.; Kumara, L.S.R.; Kohara, S.; Sakata, O. Reverse Monte Carlo modeling for local structures of noble metal nanoparticles using high-energy XRD and EXAFS. RSC Adv. 2019, 9, 29511–29521. [Google Scholar] [CrossRef] [Green Version]
  38. Frenkel, A.I.; Rodriguez, J.A.; Chen, J.G. ChemInform Abstract: Synchrotron Techniques for in situ Catalytic Studies: Capabilities, Challenges, and Opportunities. ChemInform 2013, 44, 2269–2280. [Google Scholar] [CrossRef]
  39. Clausen, B.S.; Grbk, L.; Steffensen, G.; Hansen, P.L.; Topse, H. A combined QEXAFS/XRD method for on-line, in situ studies of catalysts: Examples of dynamic measurements of Cu-based methanol catalysts. Catal. Lett. 1993, 20, 23–36. [Google Scholar] [CrossRef]
  40. Guo, G.-Q.; Wu, S.-Y.; Luo, S.; Yang, L. Detecting Structural Features in Metallic Glass via Synchrotron Radiation Experiments Combined with Simulations. Metals 2015, 5, 2093–2108. [Google Scholar] [CrossRef]
  41. Blodgett, M.E.; Kelton, K.F. Estimated partial pair correlation functions in Cu–Zr liquids. J. Non-Cryst. Solids 2015, 412, 66–71. [Google Scholar] [CrossRef] [Green Version]
  42. Mauro, N.A.; Fu, W.; Bendert, J.C.; Cheng, Y.Q.; Ma, E.; Kelton, K.F. Local atomic structure in equilibrium and supercooled liquid Zr(75.5)Pd(24.5). J. Chem. Phys. 2012, 137, 044501. [Google Scholar] [CrossRef] [PubMed]
  43. Andolina, C.M.; Williamson, P.; Saidi, W.A. Optimization and validation of a deep learning CuZr atomistic potential: Robust applications for crystalline and amorphous phases with near-DFT accuracy. J. Chem. Phys. 2020, 152, 154701. [Google Scholar] [CrossRef]
  44. Opletal, G.; Petersen, T.C.; Barnard, A.S.; Russo, S.P. On reverse Monte Carlo constraints and model reproduction. J. Comput. Chem. 2017, 38, 1547–1551. [Google Scholar] [CrossRef] [PubMed]
  45. Fang, X.W.; Huang, L.; Wang, C.Z.; Ho, K.M.; Ding, Z.J. Structure of Cu64.5Zr35.5 metallic glass by reverse Monte Carlo simulations. J. Appl. Phys. 2014, 115, 053522. [Google Scholar] [CrossRef]
  46. Ziman, J.M. A theory of the electrical properties of liquid metals. I: The monovalent metals. Philos. Mag. 1961, 6, 1013–1034. [Google Scholar] [CrossRef]
  47. Juhás, P.; Davis, T.; Farrow, C.L.; Billinge, S.J.L. PDFgetX3: A rapid and highly automatable program for processing powder diffraction data into total scattering pair distribution functions. J. Appl. Crystallogr. 2013, 46, 560–566. [Google Scholar] [CrossRef] [Green Version]
  48. Ravel, B.; Newville, M. ATHENA, ARTEMIS, HEPHAESTUS: Data analysis for X-ray absorption spectroscopy using IFEFFIT. J. Synchrotron. Radiat. 2005, 12, 537–541. [Google Scholar] [CrossRef] [Green Version]
  49. Gereben, O.; Jóvári, P.; Temleitner, L.; Pusztai, L. A new version of the RMC++ Reverse Monte Carlo programme, aimed at investigating the structure of covalent glasses. Optoelectron. Adv. Mater.-Rapid Commun. 2007, 9, 3021–3027. [Google Scholar] [CrossRef]
  50. Ankudinov, A.L.; Ravel, B.; Rehr, J.J.; Conradson, S.D. Real-space multiple-scattering calculation and interpretation of x-ray-absorption near-edge structure. Phys. Rev. B 1998, 58, 7565–7576. [Google Scholar] [CrossRef]
  51. Kuhne, T.D.; Iannuzzi, M.; Del Ben, M.; Rybkin, V.V.; Seewald, P.; Stein, F.; Laino, T.; Khaliullin, R.Z.; Schutt, O.; Schiffmann, F.; et al. CP2K: An electronic structure and molecular dynamics software package—Quickstep: Efficient and accurate electronic structure calculations. J. Chem. Phys. 2020, 152, 194103. [Google Scholar] [CrossRef] [PubMed]
  52. Perdew, J.P.; Burke, K.; Ernzerhof, M. Generalized Gradient Approximation Made Simple. Phys. Rev. Lett. 1996, 77, 3865–3868. [Google Scholar] [CrossRef] [PubMed] [Green Version]
  53. Voronoi, G. Nouvelles applications des paramètres continus à la théorie des formes quadratiques. Premier mémoire. Sur quelques propriétés des formes quadratiques positives parfaites. J. Für Die Reine Und Angew. Math. (Crelles J.) 1908, 1908, 97–102. [Google Scholar] [CrossRef]
  54. Peng, H.L.; Li, M.Z.; Wang, W.H.; Wang, C.Z.; Ho, K.M. Effect of local structures and atomic packing on glass forming ability in CuxZr100−x metallic glasses. Appl. Phys. Lett. 2010, 96, 021901. [Google Scholar] [CrossRef]
  55. Cheng, Y.Q.; Sheng, H.W.; Ma, E. Relationship between structure, dynamics, and mechanical properties in metallic glass-forming alloys. Phys. Rev. B 2008, 78, 014207. [Google Scholar] [CrossRef]
  56. Hwang, J.; Melgarejo, Z.H.; Kalay, Y.E.; Kalay, I.; Kramer, M.J.; Stone, D.S.; Voyles, P.M. Nanoscale structure and structural relaxation in Zr50Cu45Al5 bulk metallic glass. Phys. Rev. Lett. 2012, 108, 195505. [Google Scholar] [CrossRef] [Green Version]
  57. Maldonis, J.J.; Banadaki, A.D.; Patala, S.; Voyles, P.M. Short-range order structure motifs learned from an atomistic model of a Zr50Cu45Al5 metallic glass. Acta Mater. 2019, 175, 35–45. [Google Scholar] [CrossRef] [Green Version]
  58. Spaepen, F. A microscopic mechanism for steady state inhomogeneous flow in metallic glasses. Acta Metall. 1977, 25, 407–415. [Google Scholar] [CrossRef]
  59. Lu, B.F.; Kong, L.T.; Laws, K.J.; Xu, W.Q.; Jiang, Z.; Huang, Y.Y.; Ferry, M.; Li, J.F.; Zhou, Y.H. EXAFS and molecular dynamics simulation studies of Cu-Zr metallic glass: Short-to-medium range order and glass forming ability. Mater. Charact. 2018, 141, 41–48. [Google Scholar] [CrossRef]
Figure 1. Comparison of partial PDFs from ab initio molecular dynamics (solid black line) with RMC (red dashed line) simulation data for (a) g_Cu-Cu(r), (b) g_Cu-Zr(r), (c) g_Zr-Zr(r), respectively. (d) denotes the comparison of S(Q) from synchrotron XRD (solid black line) and RMC simulations (red dashed line). (ad) demonstrate the four tested metallic glasses CuXZr100−X (x = 50, 56, 60, 64), respectively.
Metals 13 00070 g001
Figure 2. EXAFS k3χ(k) spectra of CuXZr100−X (x = 50, 56, 60, 64) MGs obtained by experiments (solid blue line) and FEFF8.5L calculations using the RMC configurations (red dotted line). (a) Cu K-edge; (b) Zr K-edge.
Metals 13 00070 g002
Figure 3. Frequency distribution of the 12 most frequent Voronoi polyhedron of CuXZr100−X (x = 50, 56, 60, 64) MGs.
Metals 13 00070 g003
Figure 4. Atomic number density distribution of different component amorphous alloys. Here color red represents the high density region and color blue represents the low density region. (a) Cu50Zr50, (b) Cu56Zr44, (c) Cu60Zr40, (d) Cu64Zr36.
Metals 13 00070 g004
Figure 5. Local five times symmetry distribution of different component amorphous alloys, with the color red representing atoms with high LFFS and the color blue representing atoms with low LFFS. (a)Cu50Zr50, (b) Cu56Zr44, (c) Cu60Zr40, (d) Cu64Zr36.
Metals 13 00070 g005
Figure 6. The evolution of the ratio of dominant polyhedra ratio ( F n ) of different component specimens, with the color red representing the region with high dominant polyhedra content and the color blue representing the region with low dominant polyhedra content. (a) Cu50Zr50, (b) Cu56Zr44, (c) Cu60Zr40, (d) Cu64Zr36.
Metals 13 00070 g006
Figure 7. (ad) are the cube bone of CuXZr100−X (x = 50, 56, 60, 64) MGs, respectively. The clusters connected together were colored using the same color. (e) 1 nm slice of Cu60Zr40.
Metals 13 00070 g007
Figure 8. Local atomic structure of MRO defects.
Metals 13 00070 g008
Table 1. CuXZr100−X (X = 50, 56, 60, 64) MGs full icosahedral bones parameters statistics.
Sample ComponentsCu50Zr50Cu56Zr44Cu60Zr40Cu64Zr36
Number of <0,0,12,0> cluster1065158622872282
Number of solid-like regions115411515
Number of atoms of <0,0,12,0> cluster834910,82313,20013,745
Number of atoms of bone2376998812,93613,490
Disclaimer/Publisher’s Note: The statements, opinions and data contained in all publications are solely those of the individual author(s) and contributor(s) and not of MDPI and/or the editor(s). MDPI and/or the editor(s) disclaim responsibility for any injury to people or property resulting from any ideas, methods, instructions or products referred to in the content.

