Article

On the Determination of Elastic Properties of Indium Nitride Nanosheets and Nanotubes by Numerical Simulation

by
Nataliya A. Sakharova
1,2,*,
André F. G. Pereira
1,2,
Jorge M. Antunes
1,2,3,
Bruno M. Chaparro
3 and
José V. Fernandes
1,2
1
Centre for Mechanical Engineering, Materials and Processes (CEMMPRE), Department of Mechanical Engineering, University of Coimbra, Rua Luís Reis Santos, Pinhal de Marrocos, 3030-788 Coimbra, Portugal
2
ARISE—Advanced Production and Intelligent Systems Associated Laboratory, 4200-465 Porto, Portugal
3
Abrantes High School of Technology, Polytechnic Institute of Tomar, Quinta do Contador, Estrada da Serra, 2300-313 Tomar, Portugal
*
Author to whom correspondence should be addressed.
Metals 2023, 13(1), 73; https://doi.org/10.3390/met13010073
Submission received: 21 November 2022 / Revised: 16 December 2022 / Accepted: 23 December 2022 / Published: 27 December 2022

Abstract

:
Among the semiconductors formed by a 13th group element and nitrogen, indium nitride (InN) has promising electronic and optical properties, which make it an appropriate material for light-emitting devices and high-speed electronic applications. One-dimensional and two-dimensional InN structures, such as nanotubes and nanosheets, respectively, are expected to present novel advanced characteristics different from those of bulk InN, bringing new prospects in the designs of electronic and optical nanodevices. Despite the difficulties in the synthesis and mass production of the indium nitride nanotubes and nanosheets, the understanding of their properties, including mechanical ones, deserves more research attention, taking into account future perspectives. In this context, the present work is an exploratory study on the numerical evaluation of elastic properties of InN nanosheets and nanotubes, using the nanoscale continuum modelling (also called molecular structural mechanics) approach. The results obtained constitute a solid base for further investigation on the mechanical behaviour of the InN nanostructures, where studies are at an early stage or almost absent.

1. Introduction

Boron nitride (BN), aluminium nitride (AlN), gallium nitride (GaN) and indium nitride (InN) semiconductors have been recognised as fundamental constituents of numerous electronic and optoelectronics devices [1]. Indium nitride has high electron mobility [2] and the smallest energy gap [3] among the 13th group elements–nitride compounds, which led to its promising electron transport and optical properties. This indicates that InN is a more advantageous material than BN, AlN and GaN for light-emitting devices (LED) and high-speed field-effect transistors (FETs) [1,4,5]. In addition, InN-based alloys fused with broadband gap GaN are considered key materials for green and blue LEDs and laser diodes [6,7].
Among other two-dimensional (2D) materials, with a graphene-like honeycomb lattice, the structural, thermal and mechanical stability of a hexagonal atomic layer sheet of InN were predicted using first-principles calculations within density functional theory (DFT) [4,8]. Le [9], in a molecular dynamic (MD) simulation study with Tersoff and Tersoff-like potentials for modelling interatomic interactions, investigated the tensile behaviour of hexagonal monolayer sheets, including InN, and calculated their Young’s modulus.
Concerning the one-dimensional (1D) InN tubular nanostructures, the successful synthesis of single-crystalline indium nitride nanotubes (InNNTs) was reported in the literature by Yin et al. [10] and Sardar et al. [11]. Yin et al. [10] synthesised InNNTs in mass quantity via controlled carbonitriding reaction in a vapor-solid (VS) route, using multi-walled carbon nanotubes (MWCNTs) or pure graphite powder as carbon source for the carbonitriding reaction. The synthesised InNNTs were straight, crystalline of highly pure, with a length of several micrometres and an external diameter of 450–550 nm. Sardar et al. [11] obtained the single-crystalline InNNTs, almost defect-free, with external diameter of about 300 nm, employing the low-temperature chemical reaction to reduce the appearance of defects and prevent decomposition. Concerning theoretical studies on InN nanotubes, Qian et al. [12] predicted the stability and electronic structure of single-walled InNNTs, using DFT calculations. The existence of a direct gap, calculated for zigzag nanotubes, suggests the potential application of InNNTs in red LEDs [12]. To the best of our knowledge, results on the mechanical properties of InNNTs are not available in the literature so far.
Despite the promising uses of InN nanostructures, there is an evident lack of studies on their properties, including the mechanical ones. In this context, the present study makes a systematic numerical evaluation of the elastic properties of one-layer indium nitride nanosheets (InNNSs) and single-walled indium nitride nanotubes (SWInNNTs) in a wide range of chiral indices and diameters. The force field constants, which provide input data for the finite element (FE) model of InN nanostructures, were evaluated by two different calculation methods. The effect of input parameters, used for the FE modelling and calculated based on two sets of force field constants, on the elastic properties of InNNSs and InNNTs was studied.

2. Materials and Methods

2.1. Atomic Structure of Indium Nitride Nanosheets and Nanotubes

The indium nitride sheet has a hexagonal lattice, where the In and N atoms are arranged in a honeycomb structure with planar geometry [8]. Figure 1 shows the InN sheet with hexagonal atomic arrangement characterised by the chiral vector, Ch, which is expressed as follows:
C h = n a 1 + m a 2 ,
where a 1 and a 2 are the unit vectors of the honeycomb diatomic InN lattice; n and m are the chiral indices, both integers. The length of the unit vector a is calculated by a = a In N 3 , where a In N is the equilibrium In-N bond length, equal to 0.206 nm [8]. The knowledge of the chiral indices, n and m, allows definition of the other fundamental characteristic of the hexagonal sheet of InN, which is the chiral angle, Θ, determined by following expression:
Θ = sin 1 3 2 m n 2 + nm + m 2 .
The single-walled InNNT can be understood as a rolled-up InN sheet, with the chiral angle, Θ, varying in the range of 0° to 30°. As a consequence, three main symmetry groups of nanotubes are defined through the value of Θ: zigzag (n, 0) configuration, where Θ = 0° (m = 0); armchair (n, n) configuration, where Θ = 30° (n = m); chiral (n, m) configuration, where 0° < Θ < 30° (n ≠ m ≠ 0). The two limiting structures, (n, 0) zigzag and (n, n) armchair (see Figure 1), are called non-chiral nanotubes. SWInNNTs are characterised by the nanotube diameter, D n , expressed as follows:
D n = a In N 3 n 2 + nm + m 2 π ,
where n and m are the chiral indices and a In N is the equilibrium bond length.
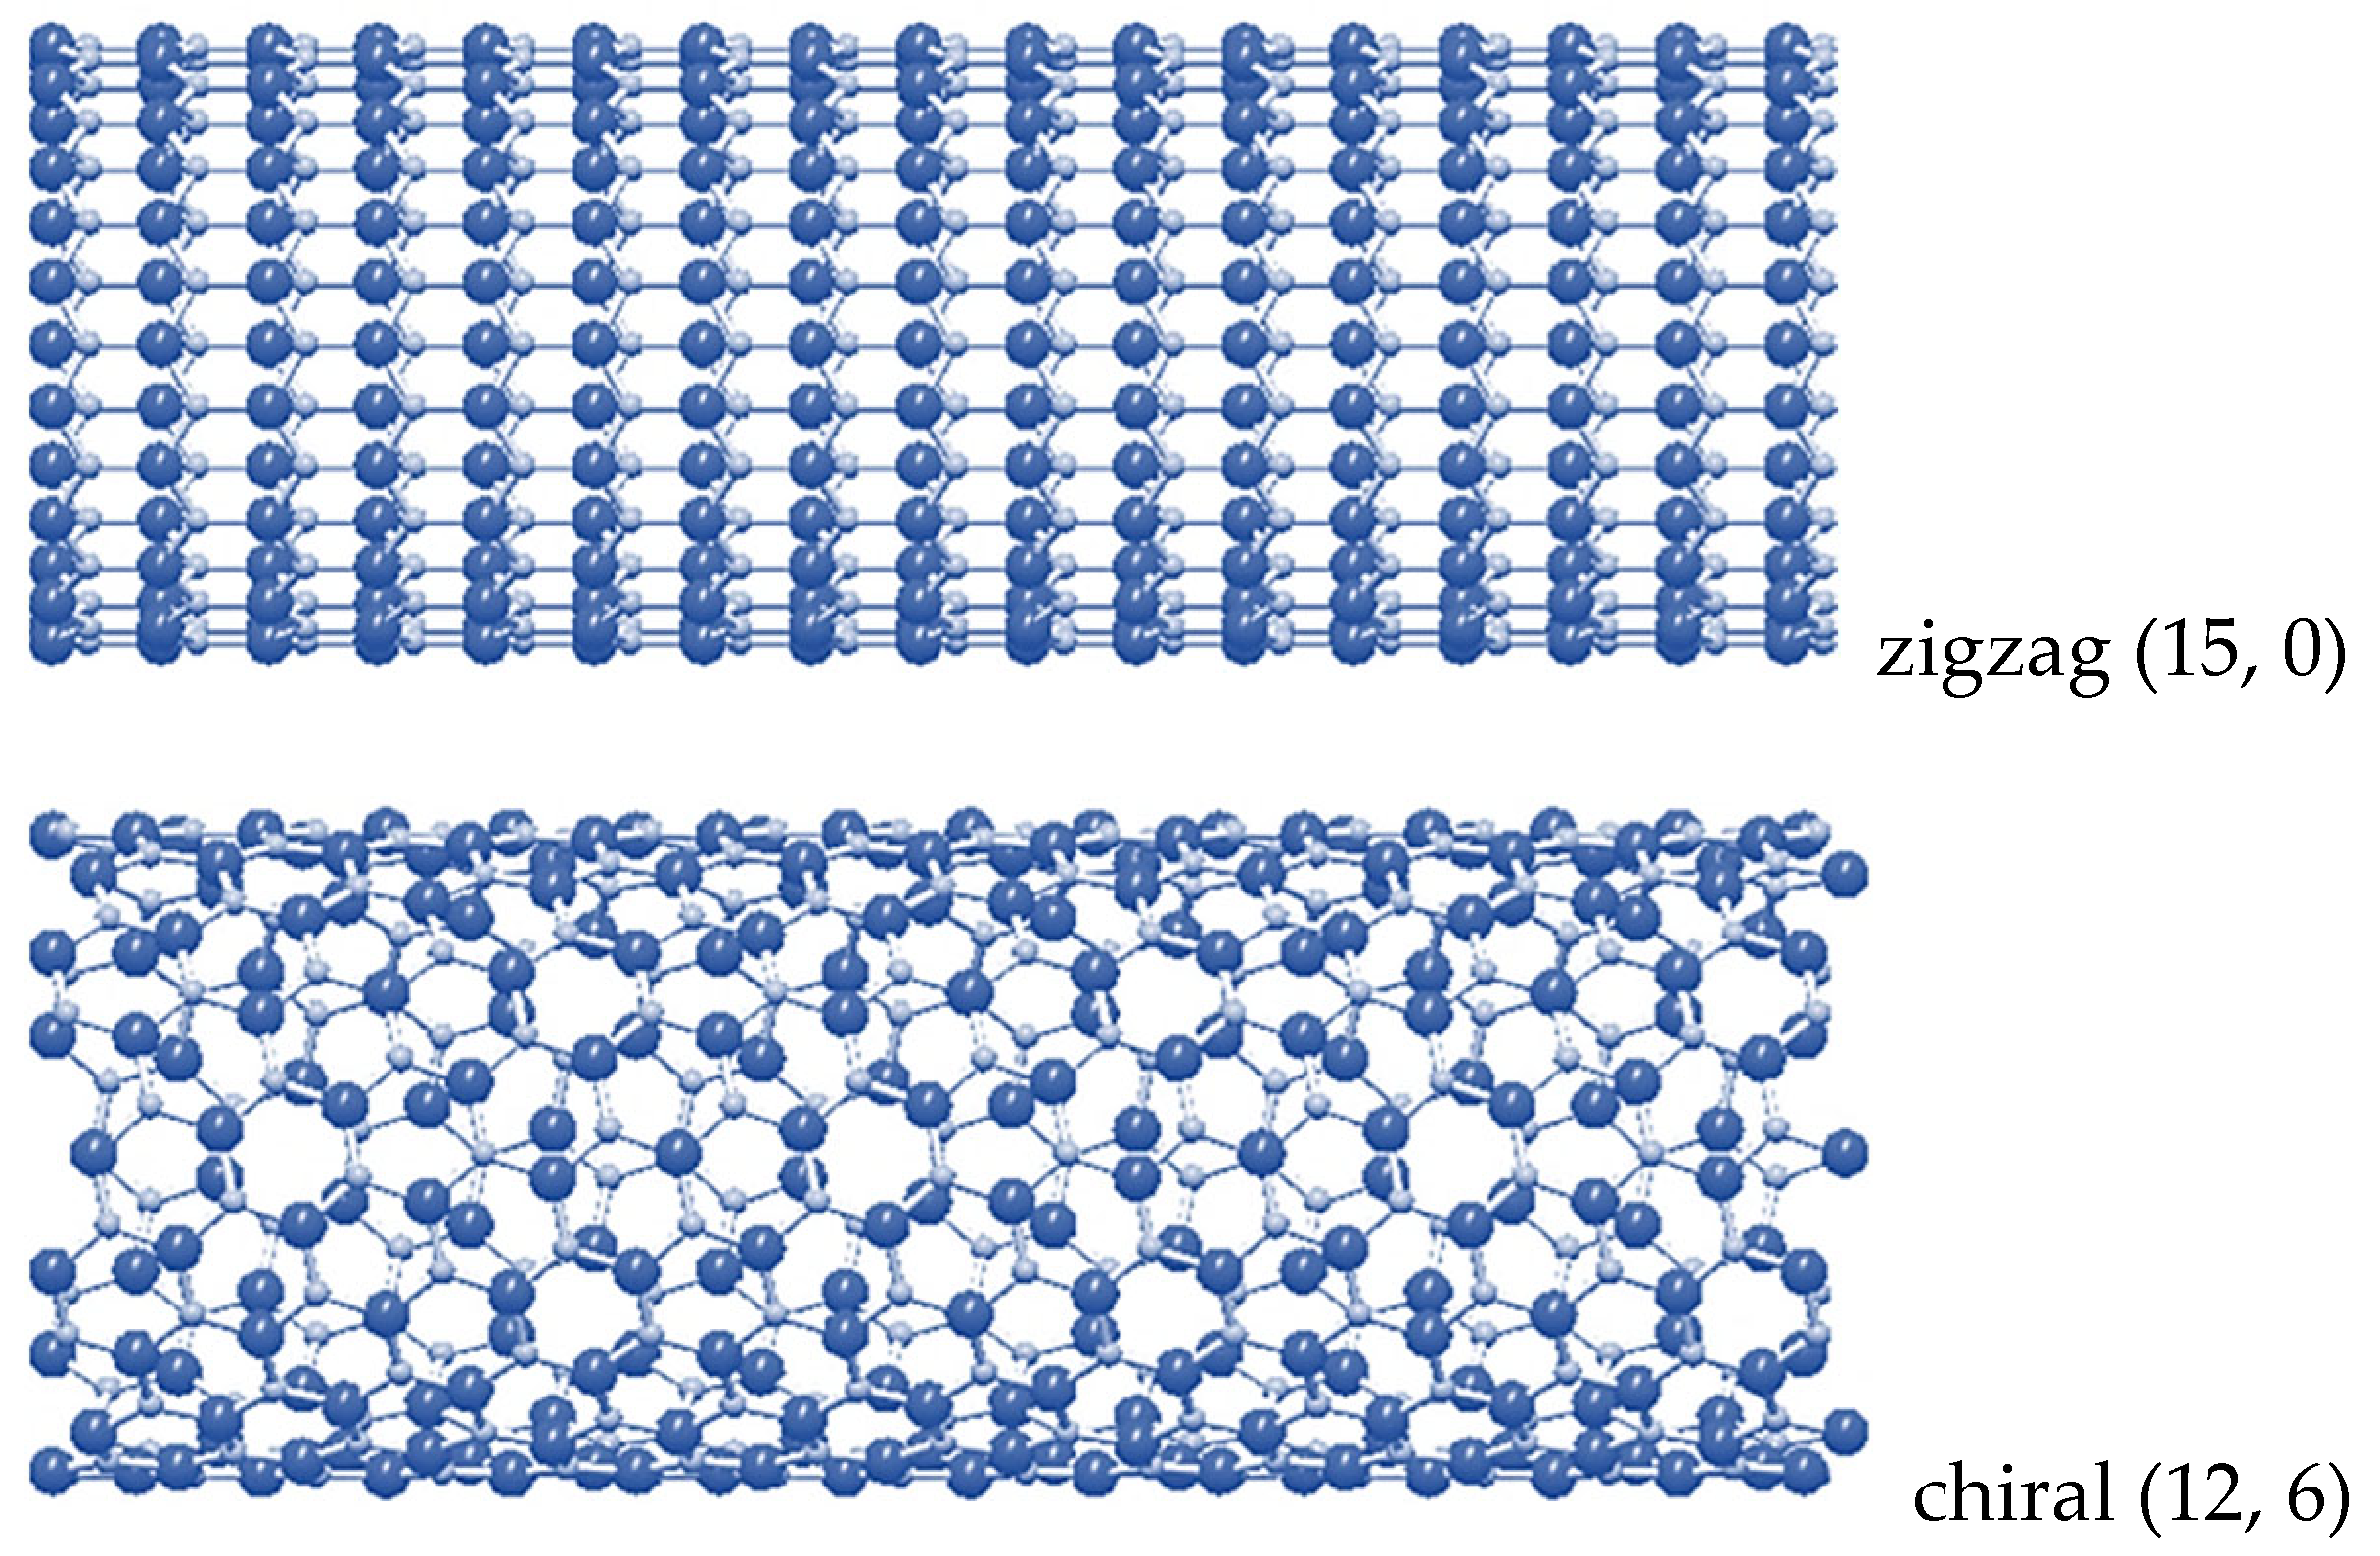
Examples of non-chiral and chiral SWInNNTs with comparable diameters, D n , are shown schematically in the Figure 2.

2.2. Numerical Modeling of Elastic Properties of InNNSs and SWInNNTs

2.2.1. Input for FE Model of InN Nanostructures

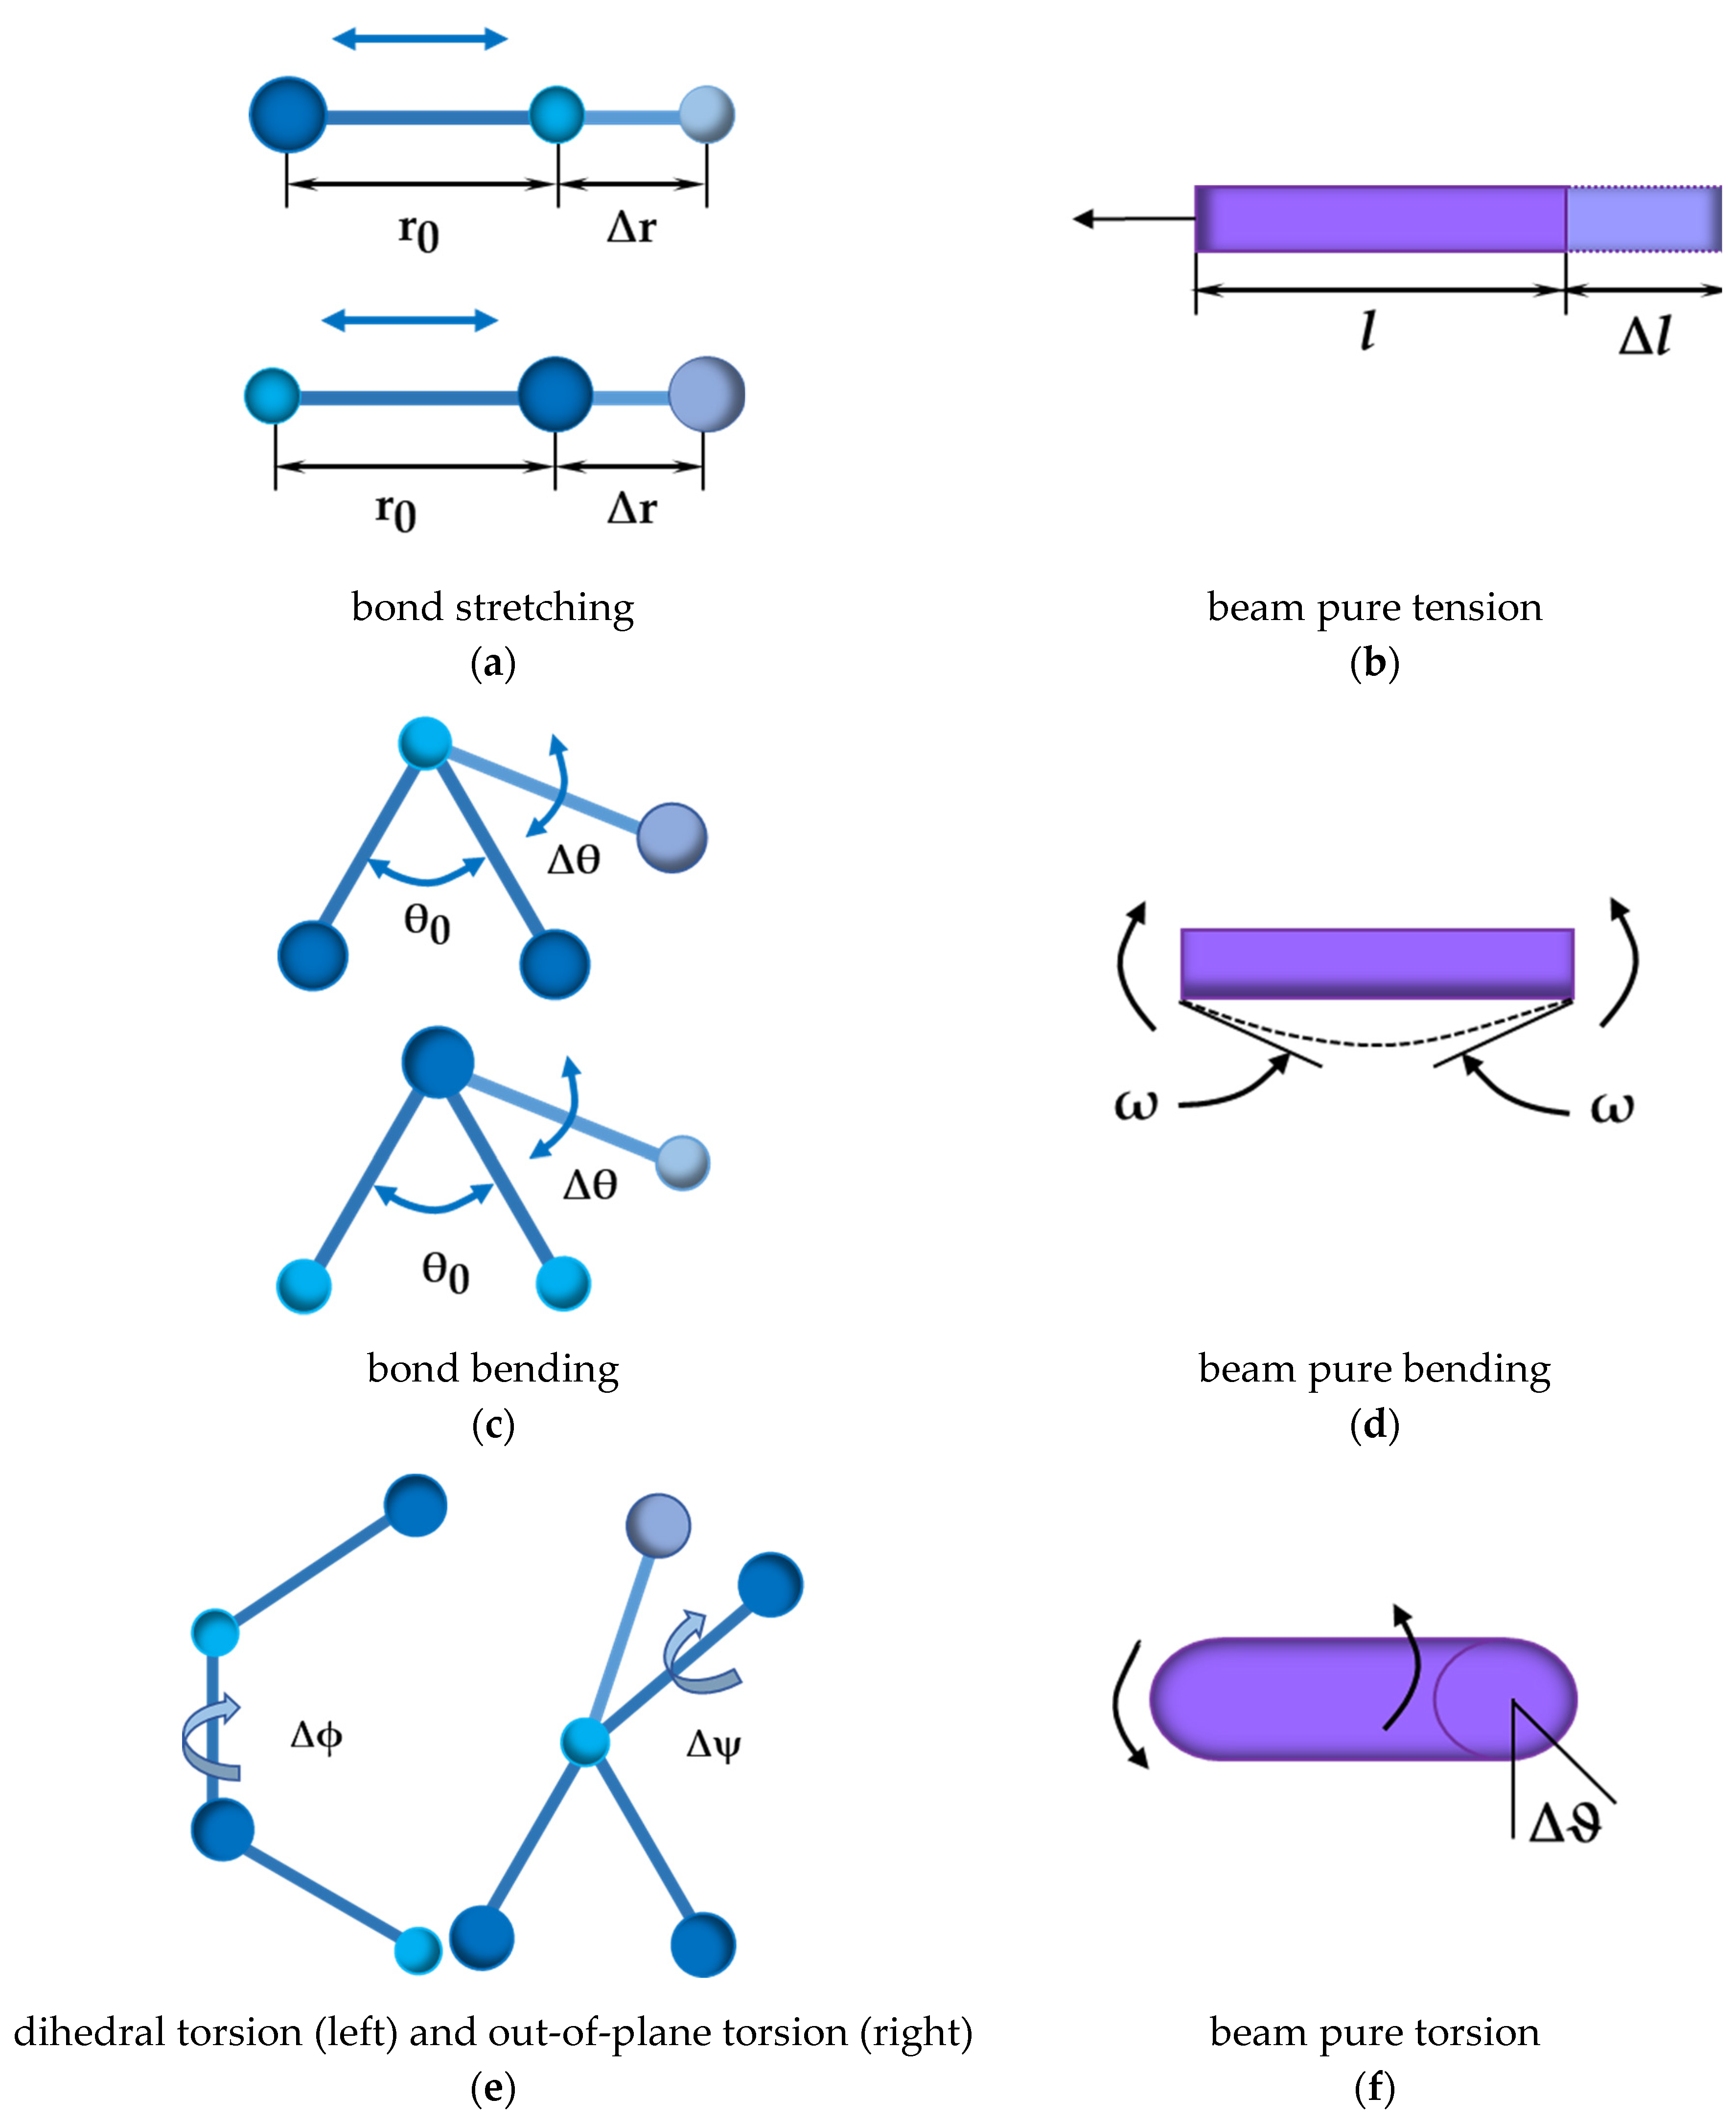
In the current work, the nanoscale continuum modelling (NCM) approach, also known as molecular structural mechanics (MSM), was employed to assess the elastic properties of InN nanostructures. This approach uses the equivalence between bonding interactions in the hexagonal diatomic lattice and elastic deformations of beam elements (see Figure 3).
Taking into account that the energies related to dihedral angle torsion, Uϕ, and out-of-plane torsion, Uψ, can be merged into a single term with the assumption of small deformations, the potential energies of bond stretching, bond stretching, Ur, bond bending, Uθ, and bond torsion, Uτ, can be written as follows [13,14]:
U r = 1 2 k r Δ r 2 ,
U θ = 1 2 k θ Δ θ 2 ,
U τ = U ϕ + U ψ = 1 2 2 k ϕ + k ψ Δ ϕ 2 = 1 2 k τ Δ ϕ 2 ,
where k r , k θ , k ϕ and k ψ are the bond stretching, bond bending, dihedral torsion and inversion force constants, respectively; k τ = 2 k ϕ + k ψ is the torsional resistance force constant; Δ r , Δ θ and Δ ϕ are the bond stretching increment, bending variation of the bond angle and angle variation of the twist bond, respectively.
On the other hand, the strain energies related to axial, UA, bending, UB, and torsional, UT, elastic deformations of equivalent beams are given by following expressions:
U A = 1 2 E b A b l Δ l 2 ,
U B = 1 2 E b I b l 2 ω 2 ,
U T = 1 2 G b J b l Δ ϑ 2 ,
where E b A b is the beam tensile rigidity, E b I b is the beam bending rigidity and G b J b is the beam torsional rigidity; Δl is the axial tensile displacement of the beam, ω is the rotational angle at the beam ends and Δ ϑ is the relative rotation between the ends of the beam.
Equating U r = U A , U θ   = U B and U τ = U T , from expressions (4)–(6) and (7)–(9), it is possible to link the beam E b A b , E b I b and G b J b rigidities with the k r , k θ and k τ force constants [15], respectively, as follows:
E b A b   = l k r ,
E b I b = l k θ ,
G b J b = l k τ ,
where, l, is the beam length equal to the bond length, a In N .
Equations (10)–(12) permit calculating the input parameters for the numerical simulation, provided that the values of the force constants are known. As there are no values in the literature for the bond stretching, kr, and bond bending, kθ, force constants of InN nanostructures, two established methods for calculating kr and kθ of diatomic nanostructures were used for this purpose in the present study. One of these methods makes use of universal force fields (UFF) [14] and the other is based on the combination of ab initio DFT calculations and the analytical expressions derived from molecular mechanics (MM) for the surface Young’s modulus, E s , and the Poisson’s ratio, ν [16]. The UFF method, based only on the chemical element and its connectivity, provides simple relationships for molecular force field functional forms and parameters regardless of the specific atomic configuration. The DFT + MM method allows taking into account the geometric parameters of the diatomic hexagonal nanostructure. The calculation of the bond stretching, kr, and bond bending, kθ, force constants for InN nanostructures is detailed below.
(1)
UFF
The bond stretching, kr, and bond bending, kθ, force constants in the UFF method are evaluated using the generalisation of Badger’s rules. For the calculation of the bond stretching constant, k r , the following expression was used [14]:
k r = 664 . 12 Z i * Z j * r ij 3 ,
where Z i * and Z j * are the effective charges of the N and In atoms and where r ij and r ik are the lengths of In-N and N–In bonds, respectively, with r ij = r ik   = a In N , as illustrate in Figure 4.
The bond bending constant, k θ , was calculated as follows [14]:
k θ   = 664 . 12 Z i * Z j * r jk 5 3 r ij r ik 1   cos 2 θ 0 r jk 2 cos θ 0 ,
where θ 0 is the angle between adjacent bonds in the InN nanostructure (Figure 4) and r jk   2 = r ij   2 + r ik 2 2 r ij r ik cos θ 0 .
It is worth noting that according to Rappé et al. [14], the kθ force constant of the diatomic nanostructure, depends on the effective charges of the atoms In and N and the three-body angles between the bond pairs, in the case of the present study, In–N–In and N–In–N, as can be seen in Figure 3c. This leads to two different values for the bond bending constant: kθ1 and kθ2. The following relationship between the two values, kθ1 and kθ2, and the effective charges of the atoms ( Z 1 , 2 * ) was also suggested [14]:
k θ 1 k θ 2 = Z 2 * 2 Z 1 * 2 .
(2)
DFT + MM
To determine the bond stretching, k r , and the bond bending constants, k θ 1 and k θ 2 , of the InN nanostructure the following expressions were used [17]:
k r = 9 E s 3 1 ν ,
k θ 1 2   = E s r ij 2 1 + Z 1 2 * 2 Z 2 1 * 2 3 1 + 3 ν ,
where E s and ν are the surface Young’s modulus and the Poisson’s ratio of the InN sheet, respectively, which can be obtained experimentally or from ab initio DFT computations; Z 1 * and Z 2 * are the effective charges of In and N atoms; r ij = a In N is the In–N bond length. The equation (15) was taken into account to derive the expression (17) for k θ 1 2 .
Values from the literature, required to calculate the k r , k θ 1 and k θ 2 values, using UFF and DFT + MM methods, are a In N = 0.206 nm [8], Z 1 * = 2.070 charge for In atom [14], Z 2 * = 2.544 charge for N atom [14], E s = 67 nN/nm [8] and ν = 0.59 [8]. The E s and ν values by Şahin et al. [8] were assessed using first-principles plane-wave calculations within the DFT calculations for strain energy. Moreover, Peng at al. [4] using ab initio MD simulations obtained similar values of E s = 62 nN/nm and ν = 0.586. With the exception of these two studies, as far as we know, the surface Young’s modulus and the Poisson’s ratio are not available together for InN nanostructures.
To calculate the torsional force constant, k τ , the DREIDING force field [13] was used, where the torsional properties of the diatomic nanostructure are estimated based on hybridisation regardless of the specific atoms involved. DREIDING provides k ϕ = 25 kcal / mol and k ψ = 40 kcal / mol / rad 2 , and the torsional resistance force constant can be calculated through k τ = 2 k ϕ + k ψ .
The bond stretching, k r , bond bending, k θ 1 and k θ 2 , force constants, obtained with the help of the aforementioned calculation methods (Case 1 corresponding to UFF and Case 2 to DFT + MM), as well the torsional resistance force constant, k τ , obtained using DREIDING, for InN nanostructures, are given in Table 1.
The discrepancy between the k r , k θ 1 and k θ 2 , values calculated by the UFF and DFT + MM methods, observed in Table 1, can be attributed to the different calculation approaches used. However, the dissimilarity in k r values is relatively small when compared to that observed for k θ values. This can possibly be explained by the fact that the DFT + MM method uses Equation (15), whose assumption may not be fully satisfied when applied to some diatomic nanostructures [16]. It should be noted that the difference, between the force constants, k r , k θ 1 and k θ 2 , obtained by the UFF and DFT + MM methods, was previously reported for phosphide nanotubes [17]. The values of the force field constants, k r , k θ 1 and k θ 2 , and k τ , from Table 1, allow calculation of the geometrical and elastic properties of the beams, as presented in Table 2. In turn, these properties of the beams provide the input values for the numerical simulation.

2.2.2. Geometrical Characteristics of InNNSs and SWInNNTs

Single-layer InN nanosheets with four different sizes were chosen for finite element analysis (FEA), as shown in Table 3. Regarding InN nanotubes, three main configurations, zigzag (Θ = 0°), chiral (family of Θ = 19.1°) and armchair (Θ = 30°) of SWInNNTs were used in the FEA. Table 4 shows the SWInNNTs geometric characteristics, including their chiral indices, (n, m), diameter, D n , and length, L n . The number of beam elements and mesh nodes used in FEA are also indicated in Table 3 and Table 4. The aspect ratio L n / D n ≈ 30 was chosen to guarantee that the elastic response of nanotube did not depend on L n [18].

2.2.3. Finite Element Analysis and Elastic Properties of InNNSs and SWInNNTs

The meshes of InNNSs and SWInNNTs used in FEA were built using the Nanotube Modeler© software (version 1.8.0, ©JCrystalSoft, http://www.jcrystal.com, accessed on 10 November 2022), which generates Program Database files. To convert these files into the format compatible with the ABAQUS® code, the in-house application InterfaceNanotubes.NM [18] was utilised.
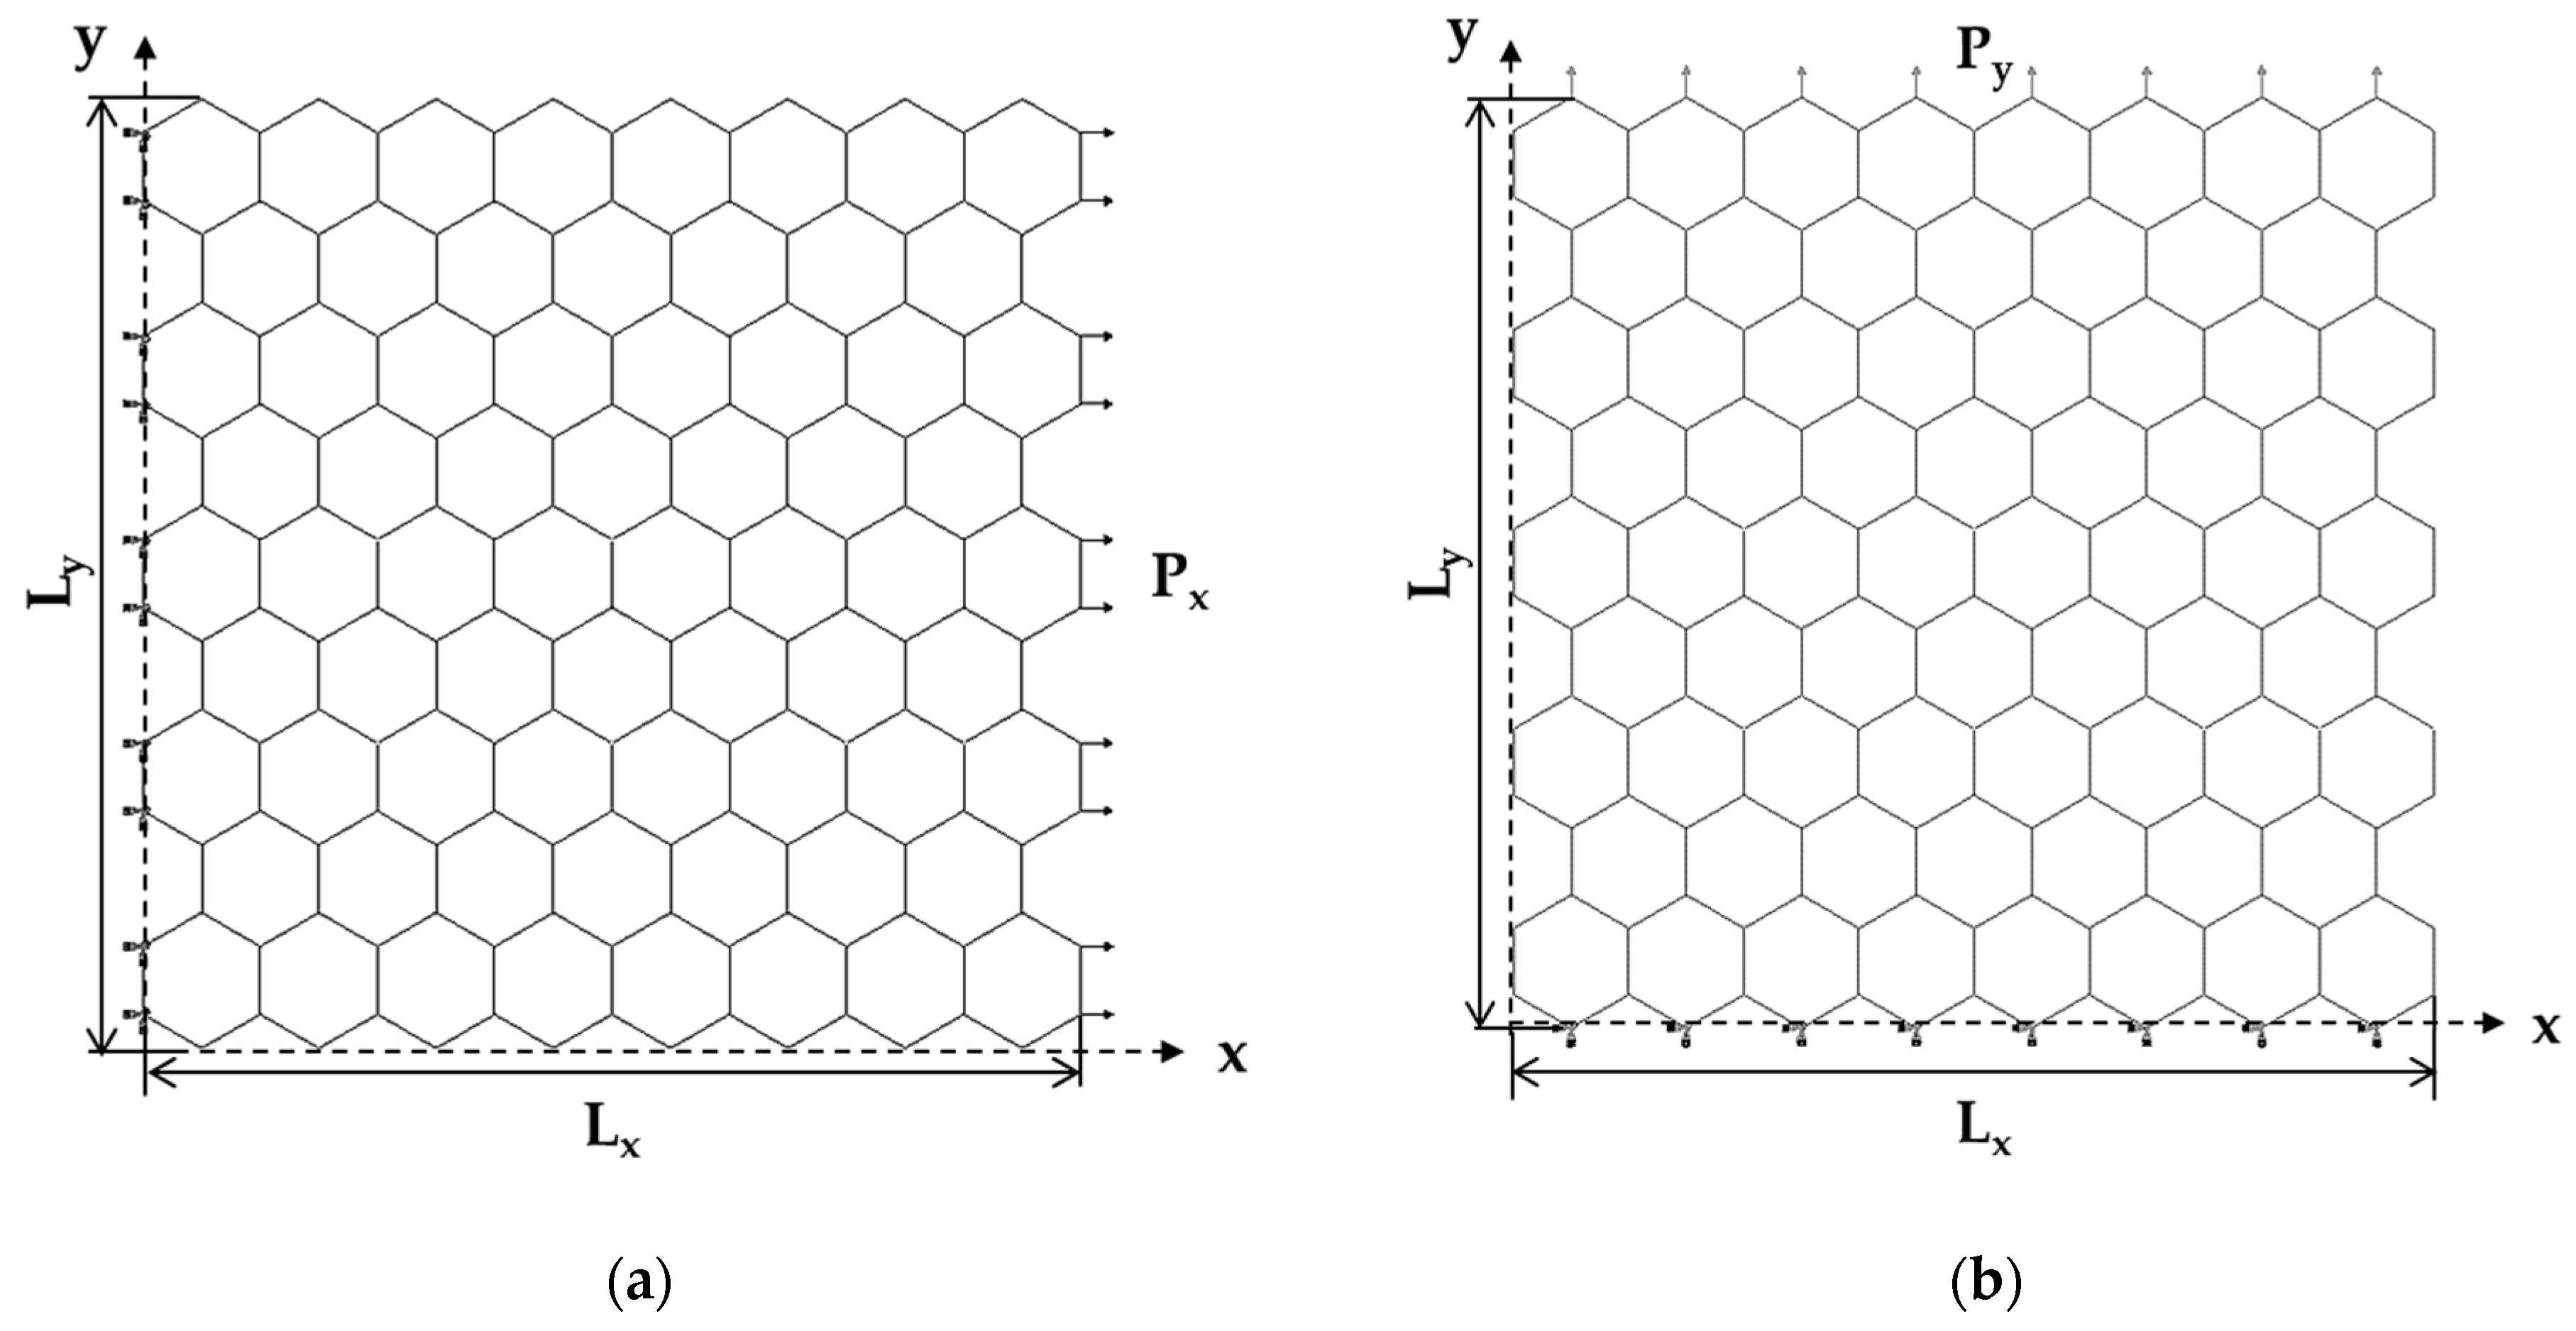
The ABAQUS® FE code was used to study the elastic response of InNNSs under the tensile test. In this code, 2-node cubic beam elements were used. Two loading cases were considered as shown in Figure 5, which illustrates the boundary and loading conditions used. In the first case, an axial tensile force, Px, was applied to the edge nodes of the right side of the nanosheet (NS), while the edge nodes of the opposite side were fixed (Figure 5a). In the second loading case, the axial transverse force, Py, was applied at the upper side of the NS, leaving the opposite side fixed (Figure 5b).
Consequently, the displacements in the x direction (corresponding to zigzag configuration–Figure 5a), v x , and in the y direction (corresponding to armchair configuration–Figure 5b), v y , taken from the FEA, permit the calculating of the Young’s moduli along the x-axis, Ex, and along the y-axis, Ey, making use of the following expressions, respectively [19]:
E x = P x L x L y v x t n ,
E y = P y L y L x v y t n ,
where P x , y , L x , y and v x , y are the axial tensile force, the sheet side length and the axial displacement, respectively; the indices x and y are related to the x-axis and y-axis, respectively; and t n is the nanosheet thickness.
In view of the uncertainty regarding the value of nanosheet thickness, t n , the surface Young’s moduli (the product of the Young’s modulus by the nanosheet thickness) along the x-axis, E sx , and y-axis, E sy , were considered in the present study:
E sx = E x t n = P x L x L y v x ,
E sy = E y t n = P y L y L x v y .
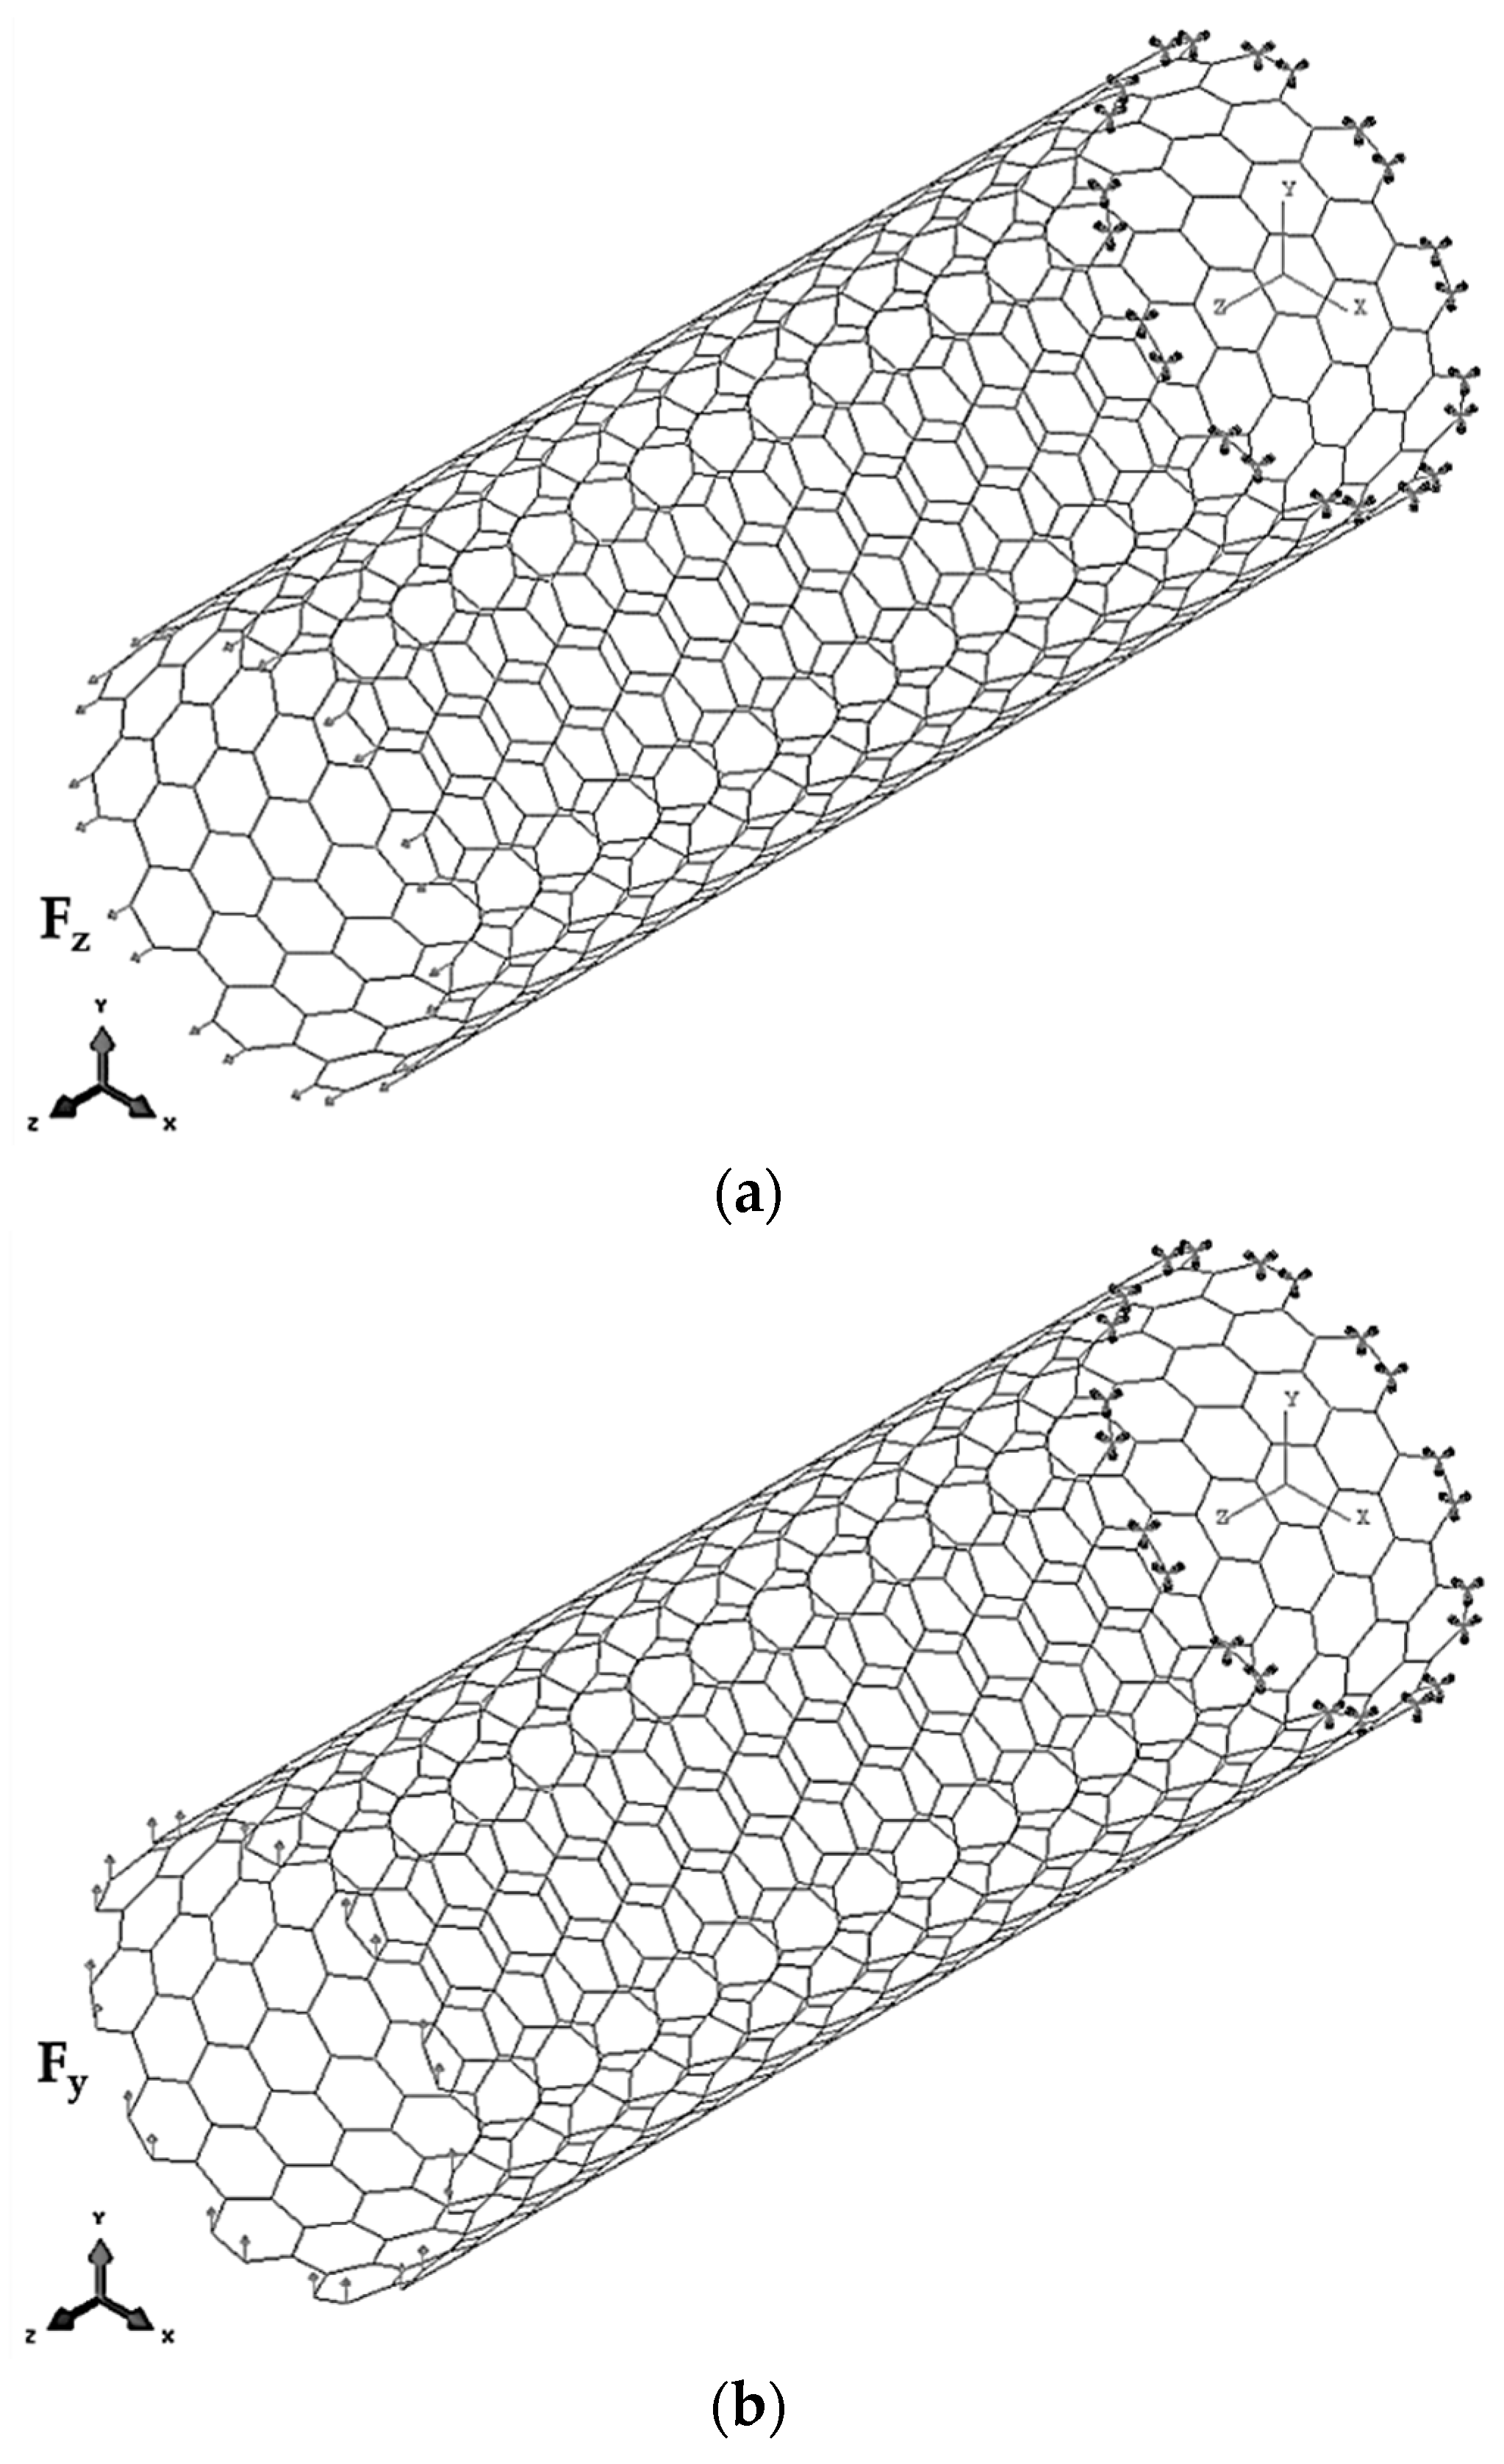
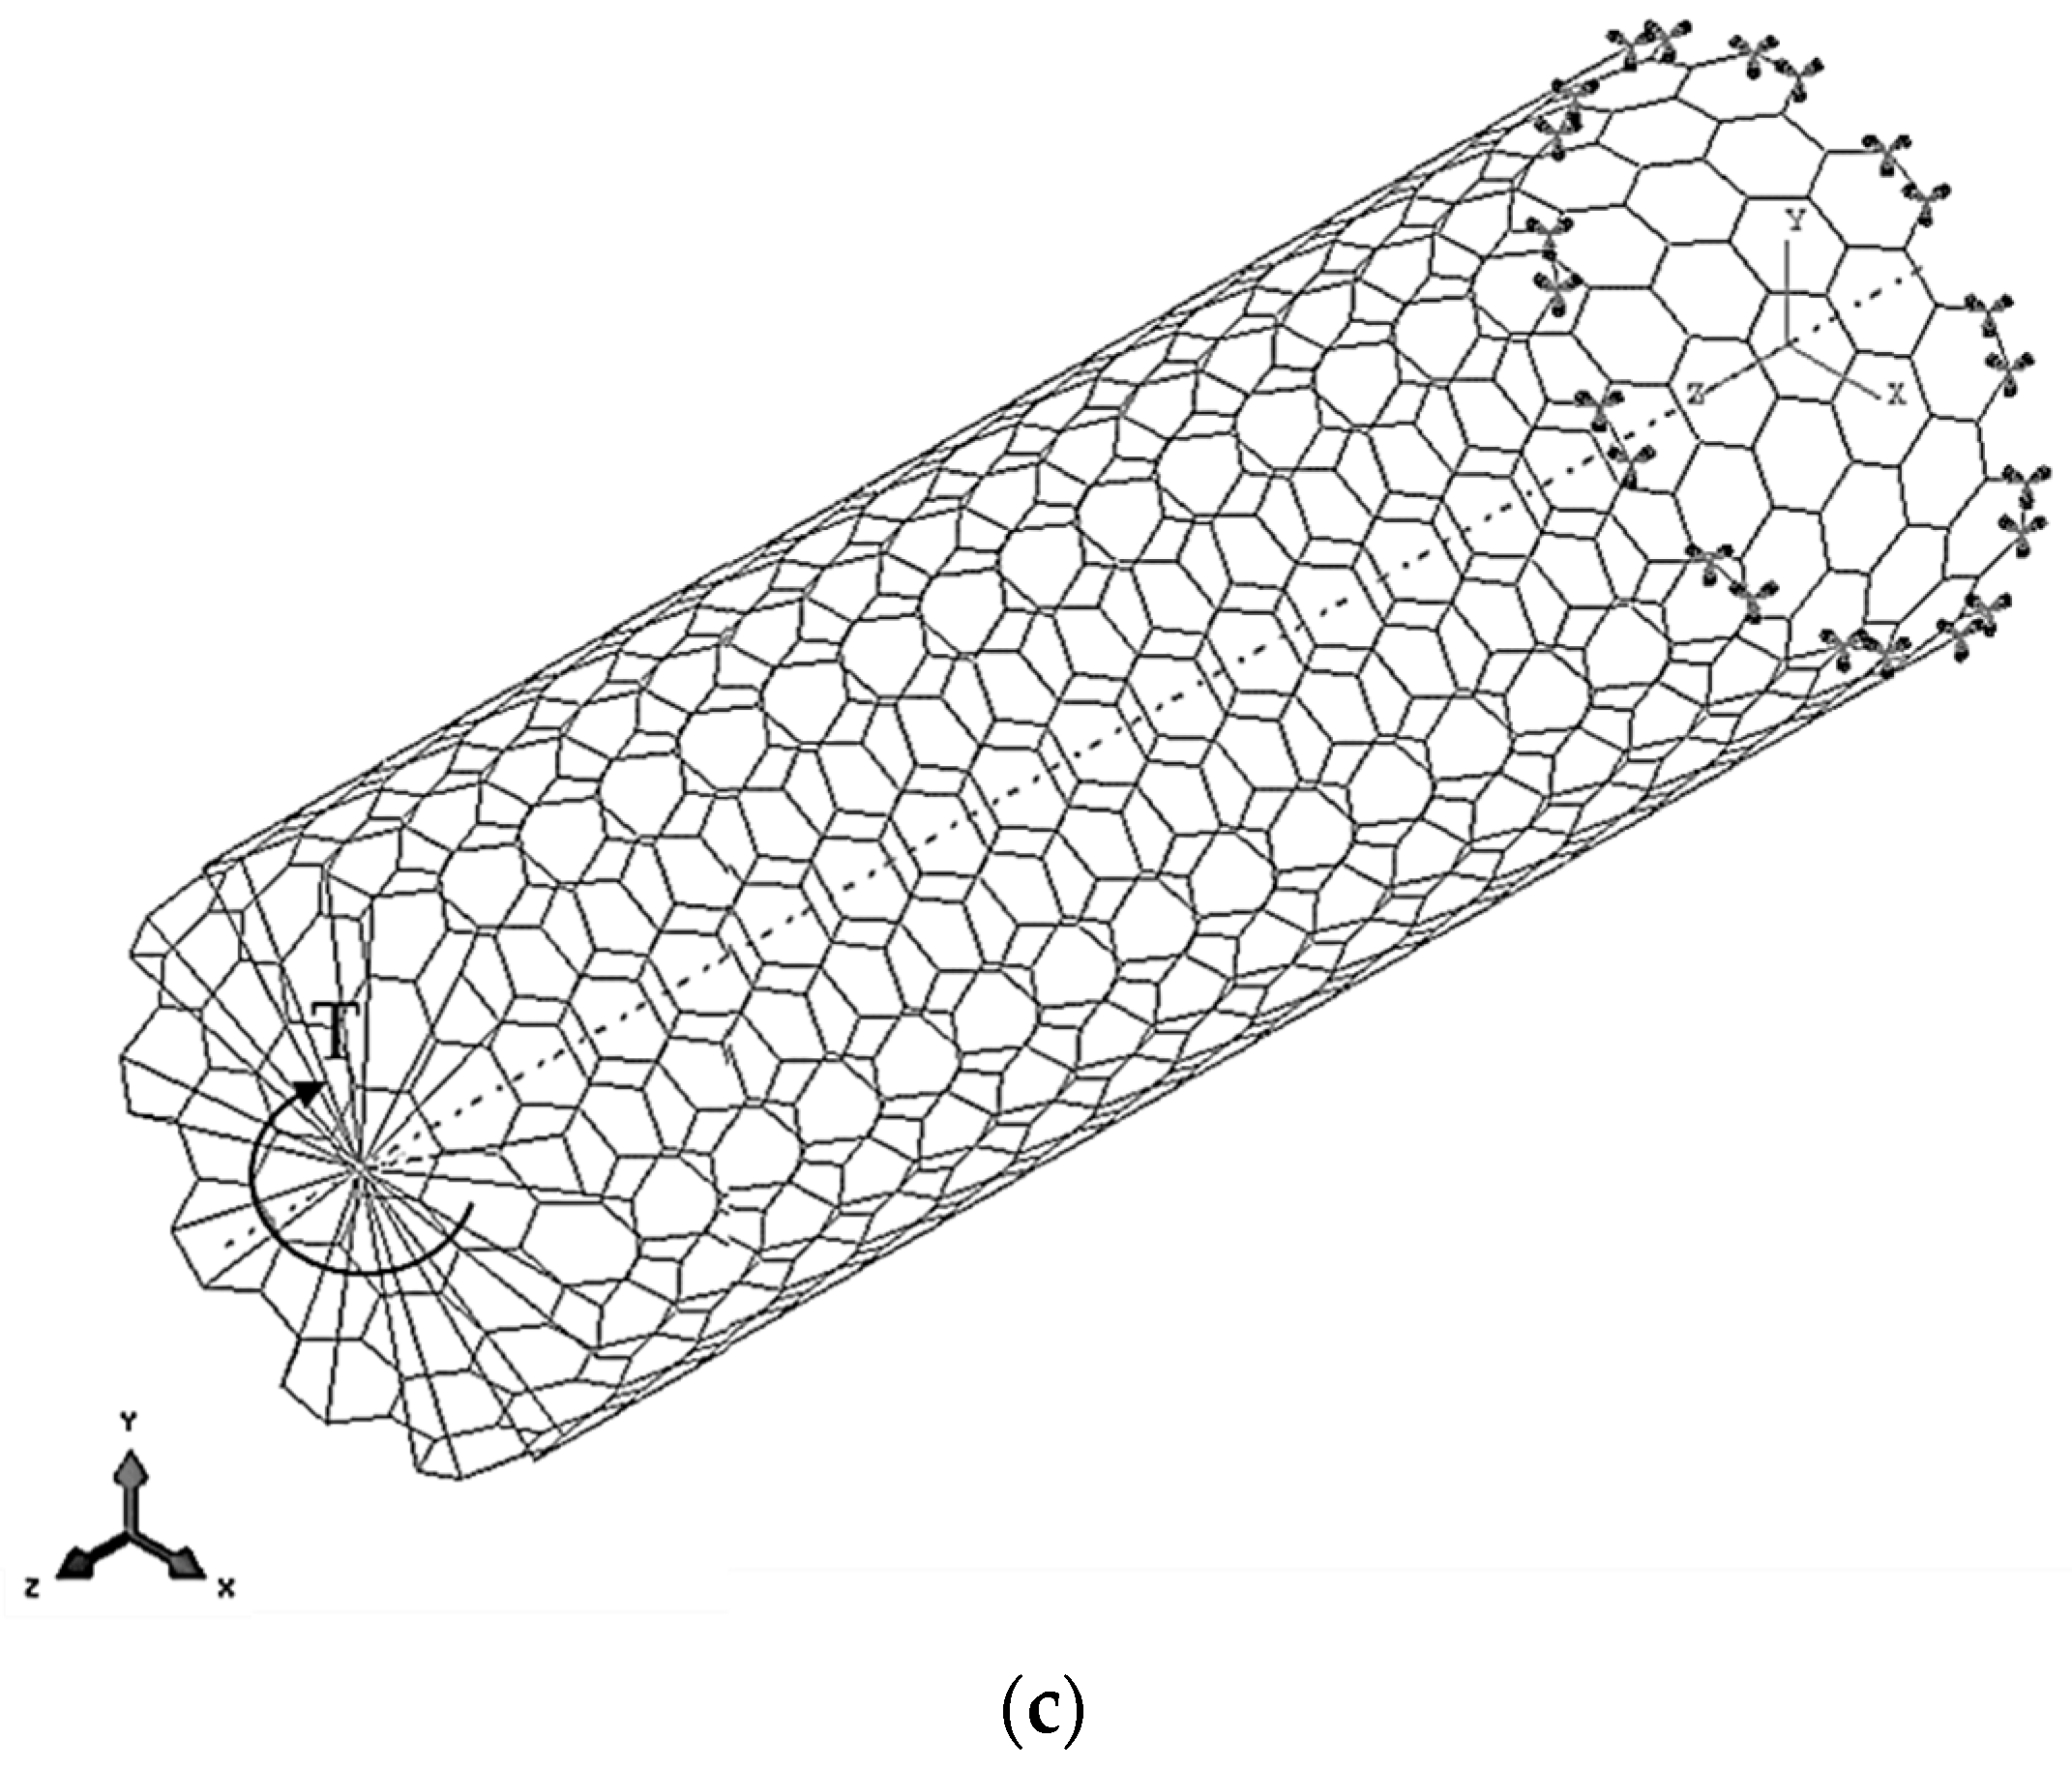
The ABAQUS® FE code was also used to study the elastic behaviour of SWInNNTs under tensile, bending and torsion tests as shown in Figure 6.
To perform each corresponding test, the axial tensile force, F z , the transverse force, F y , and the torsional moment, T, were applied to the one edge of the nanotube (NT), when the opposite NT edge was constrained, suppressing all degrees of freedom of the respective nodes. To carry out the torsion test, the edge nodes were prevented from movement in the radial direction (see Figure 6c). Thus, the tensile, bending and torsion tests allowed the axial displacement, u z , the transverse displacement, u y , and the twist angle, ϕ, to be obtained from the FEA. The results obtained from the FEA allow calculation of the tensile, EA, bending, EI, and torsional, GJ, rigidities of the SWInNNTs using the following expressions:
EA = F z L n u z ,
EI = F y L n 3 3 u y ,
GJ = TL n φ ,
where L n is the NT length.
The three rigidities, EA, EI and GJ, determined by Equations (22)–(24) are the basis for calculating the elastic properties of the SWInNNTs. Thus, the Young’s, E, and shear, G, moduli, and the Poisson’s ratio, ν, can be assessed, respectively, by the following expressions [20,21]:
E = EA π t n 8 EI EA t n 2 ,
G = GJ 2 π t n EI EA 8 EI EA t n 2 ,
ν = E 2 G 1 = EI GJ 1 ,
where t n is the nanotube wall thickness, which in the present model is the same parameter as the nanosheet thickness.
The calculation of the SWInNNTs Young’s, E, and shear, G, moduli by Equations (25) and (26) presumes the knowledge of the valid value of t n . This makes the surface Young’s ( E s = Et n ) and shear ( G s = Gt n ) moduli, which are independent of the wall thickness, more reliable elastic constants to characterise the mechanical behaviour of the InN nanotubes. Assuming that the term t n 2 in Equations (25) and (26) can be neglected, as t n 2     8 EI EA , the SWInNNTs surface Young’s, E s , and shear, G s , moduli are determined, respectively, as follows:
E S = Et n = EA π 8 EI EA ,
G S = Gt n = GJ 2 π EI EA 8 EI EA .

3. Results

3.1. Young’s Modulus of InNNSs

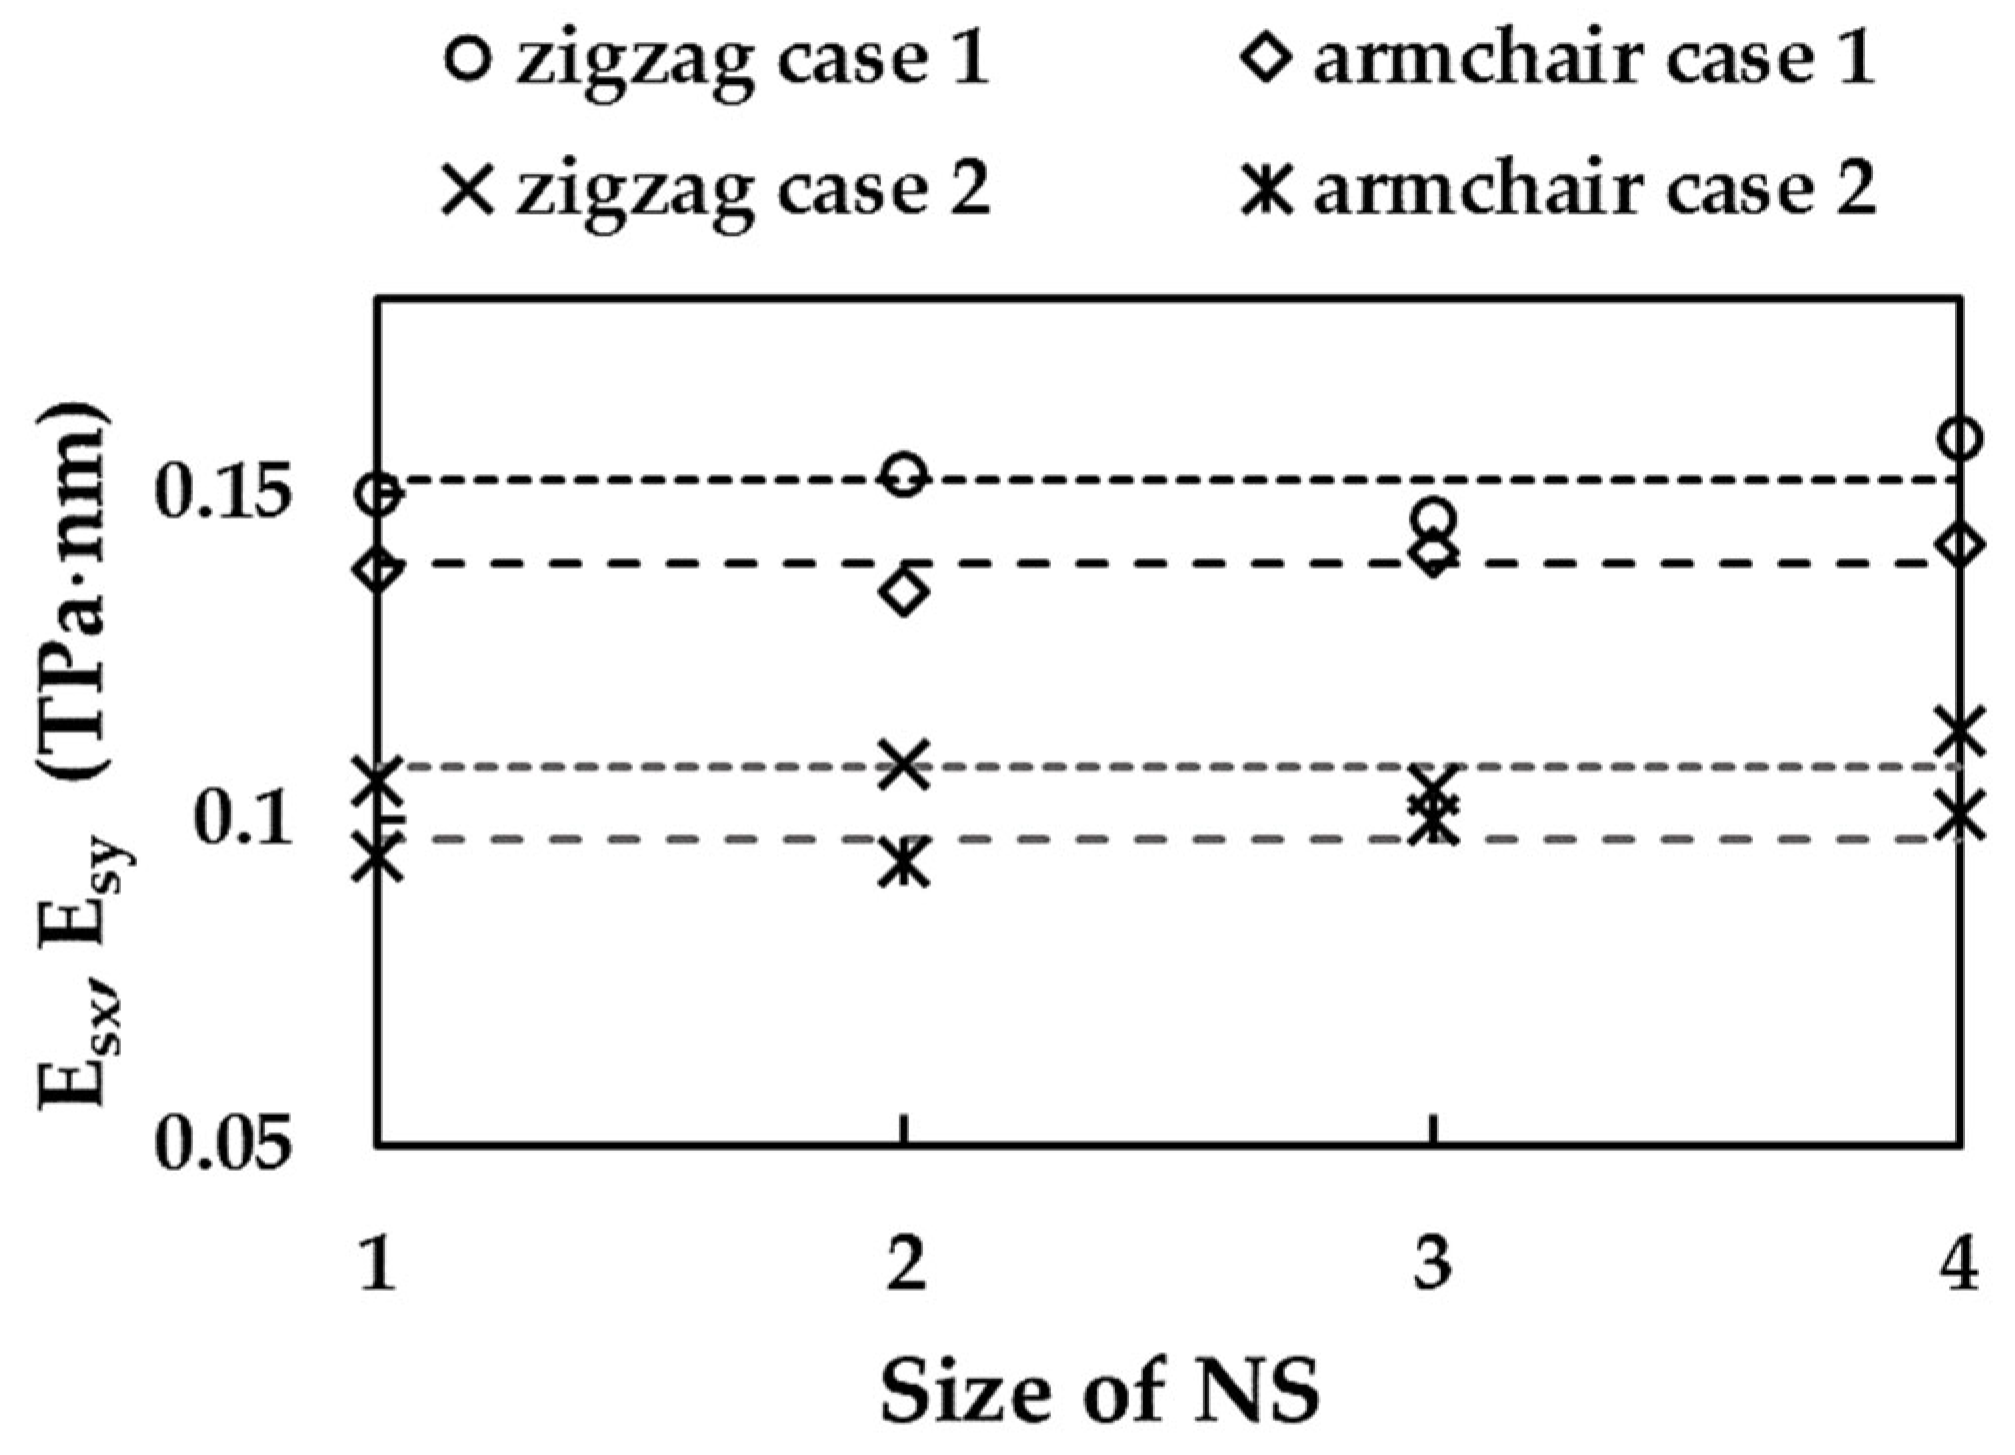
Figure 7 shows the surface Young’s moduli, E sx (zigzag) and E sy (armchair), calculated by Equations (20) and (21), respectively, for the InNNSs with different sizes (see Table 3), considering the two cases of input parameters for numerical simulation (Cases 1 and 2 in Table 2).
It can be seen that both E sx and E sy values were almost constant for all NS sizes studied, with the exception of the largest nanosheet for which a slight increase of E sx and E sy was observed. The surface Young modulus for zigzag NS configuration, E sx , was about 9.2% and 12.5% higher, for Cases 1 and 2, respectively, than that calculated for the armchair NS configuration, E sy . The average values of the surface Young’s moduli, represented in Figure 7 by dashed lines, are E sx = 0.152 TPa⋅nm and E sy = 0.139 TPa⋅nm for Case 1, and E sx = 0.108 TPa⋅nm and E sy = 0.095 TPa⋅nm for Case 2. The ratio between the surface Young’s moduli along the zigzag and armchair directions was E sx / E sy ≈ 1.1, whether the case was Case 1 or Case 2. Regarding the influence of the input parameters, the mean difference between the surface Young’s modulus values evaluated for case 1 (UFF) and case 2 (DFT+MM) was 40.6% and 44.5% for E sx and E sy , respectively.
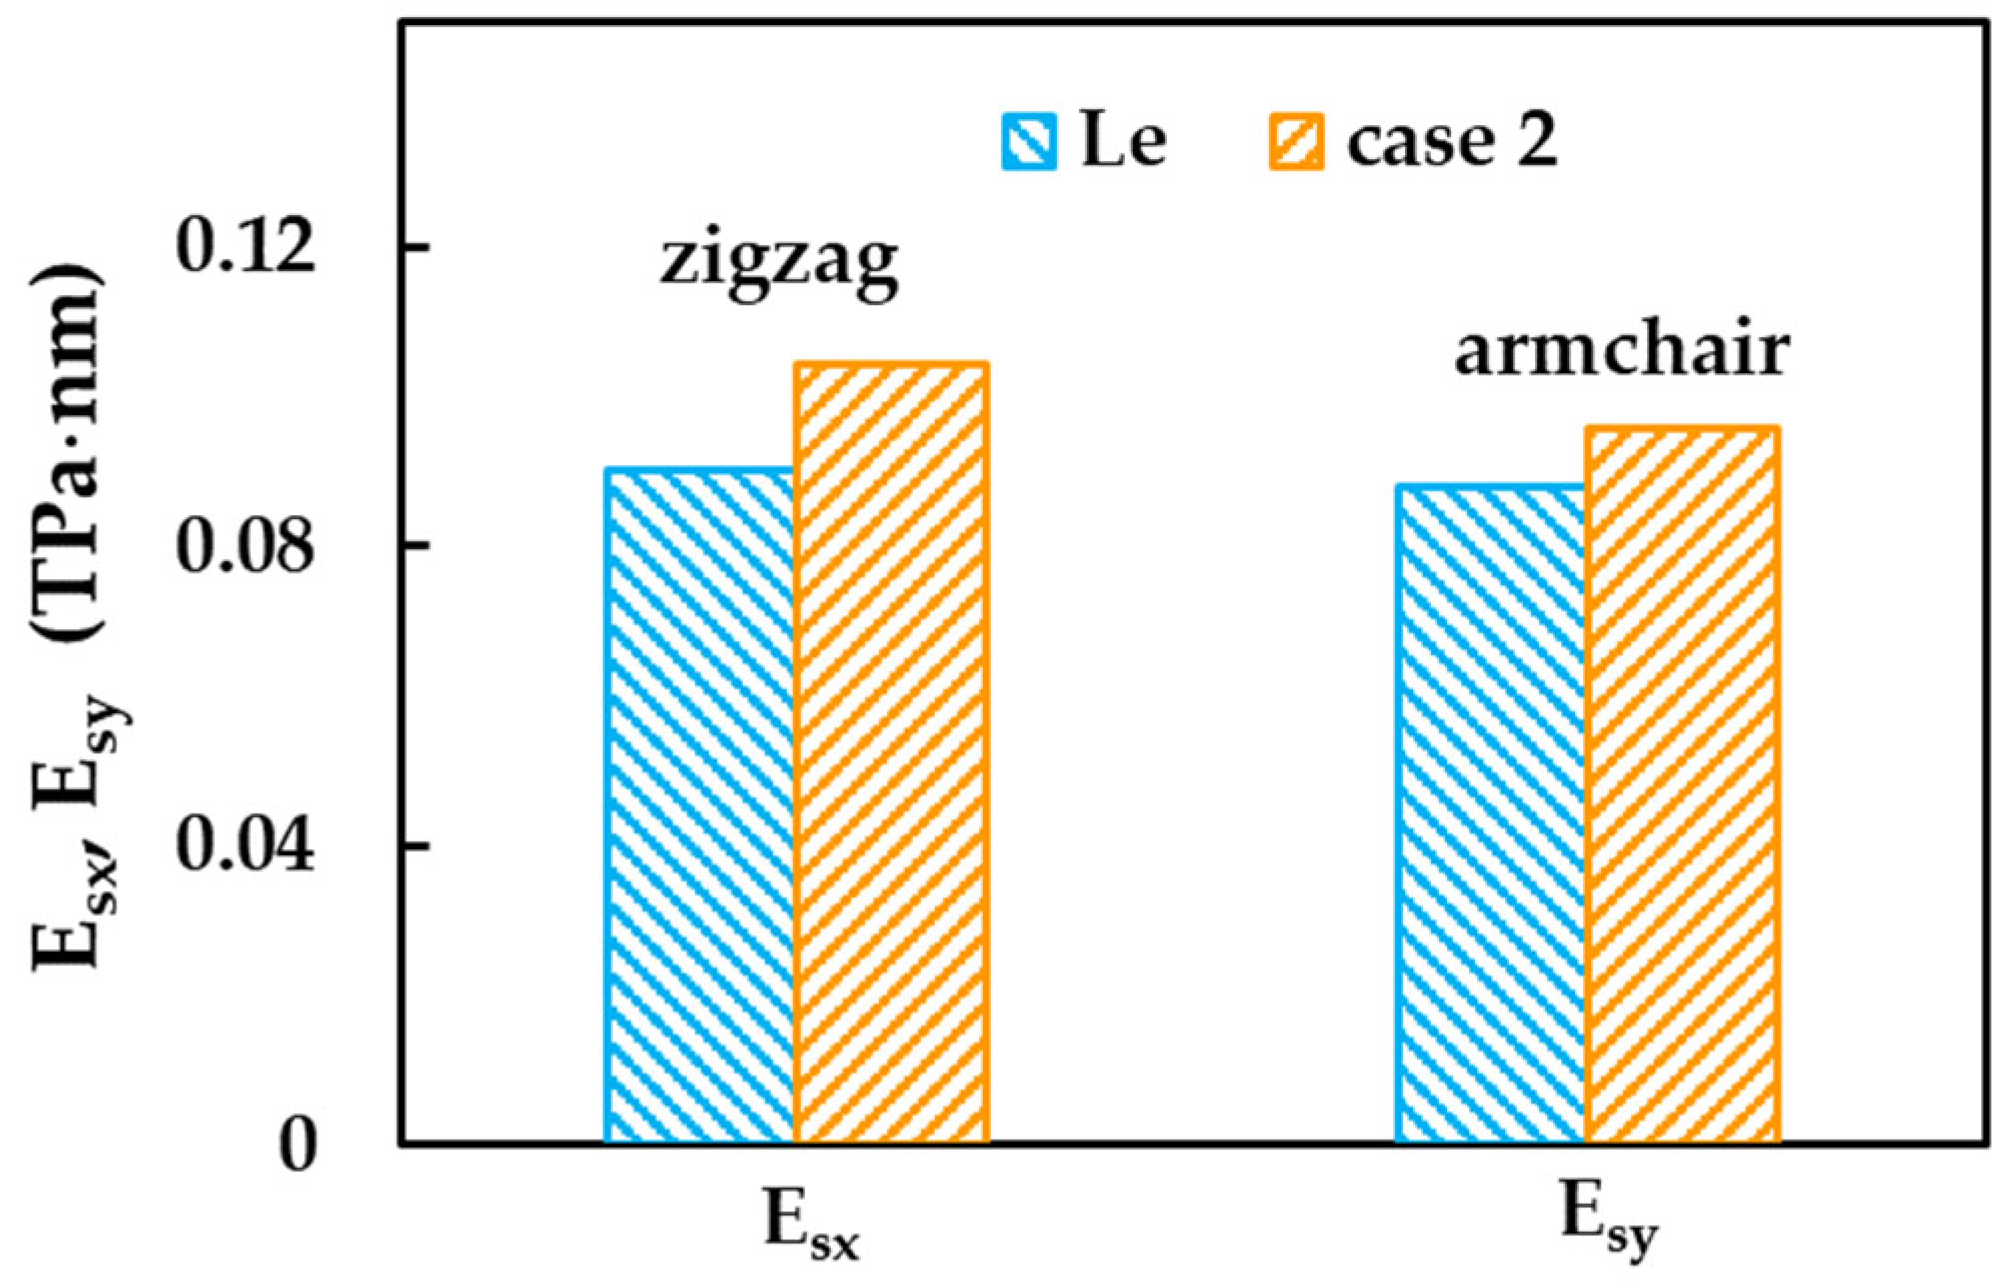
Although the studies evaluating the elastic properties of InN nanosheets are scarce in the literature, it was possible to compare the values of the surface Young’s modulus calculated for Case 2 (DFT + MM) of input parameters with those reported by Le [9], as shown in Figure 8.
A reasonable agreement was found between the current E sx and E sy values evaluated for the InNNS of size 3 (see Table 3) and those obtained in the MD simulation study by Le [9] for the InNNS with size of 15.17 nm × 14.98 nm, with the smallest difference of 8.4% being observed for the surface Young’s modulus along the y-axis (armchair direction). Moreover, Le [9] reported E sx (zigzag direction) slightly higher than E sy , being the ratio E sx / E sy ≈ 1.03, which is not significantly lower than the 1.1 value observed in the present study. The dissimilarities found can be possibly attributed not only to the differences with the simulation and calculation approach used in the work by Le [9] but also to the greater value of the InN bond length, equal to 0.211 nm, used by Le [9].
To our knowledge, no experimental values of the elastic moduli of the hexagonal InN sheets have been reported so far. Nevertheless, such results regarding InN bulk material and thin films can be found in the literature (see, for example, [22,23]). Ueno et al. [22], in their X-ray diffraction study, reported the bulk modulus equal to 0.1255 ± 0.0046 TPa for crystalline InN. Benzarti et al. [23] carried out the nanoindentation tests on InN epilayers and determined its Young’s modulus as E InN = 0.171 ± 0.008 TPa. To calculate the Young’s moduli, E x and E y , using Equations (18) and (19), according to the present model, it is necessary to know the precise value of the nanosheet thickness, t n . Sardar et al. [11] observed by high resolution electron microscopy (HRTEM) images an interlayer spacing (which is considered equal to t n ) of 0.308 nm for single-crystalline InNNTs. This value is lower than the 0.34 nm which is commonly expected as the interlayer spacing of graphite, and, consequently, as sheet thickness for carbon NSs or wall thickness in the case of carbon NTs. On the other hand, Ueno et al. [22] measured the van der Waals distance between layers equal to 0.570 nm for the bulk InN crystalline structure, using in situ X-ray diffraction experiments. Thus, Young’s moduli along the zigzag direction, E x , and armchair direction, E y , were evaluated by Equations (18) and (19), respectively, for t n = 0.308 nm and 0.570 nm. Then, the average value, E InN = E x + E y / 2 , was considered for comparison purpose. The Young’s modulus results obtained were: for Case 1 (UFF), E InN = 0.473 TPa and 0.331 TPa for the nanosheet thickness t n = 0.308 nm and 0.507 nm, respectively; for Case 2 (DFT+MM), E InN = 0.256 TPa and 0.179 TPa, when t n = 0.308 nm and 0.570 nm, respectively. It can be concluded that there is very good agreement when comparing the current E InN value assessed for Case 2 and t n = 0.570 nm with that reported by Benzarti et al. [23] for InN thin films.

3.2. Rigidities of SWInNNTs

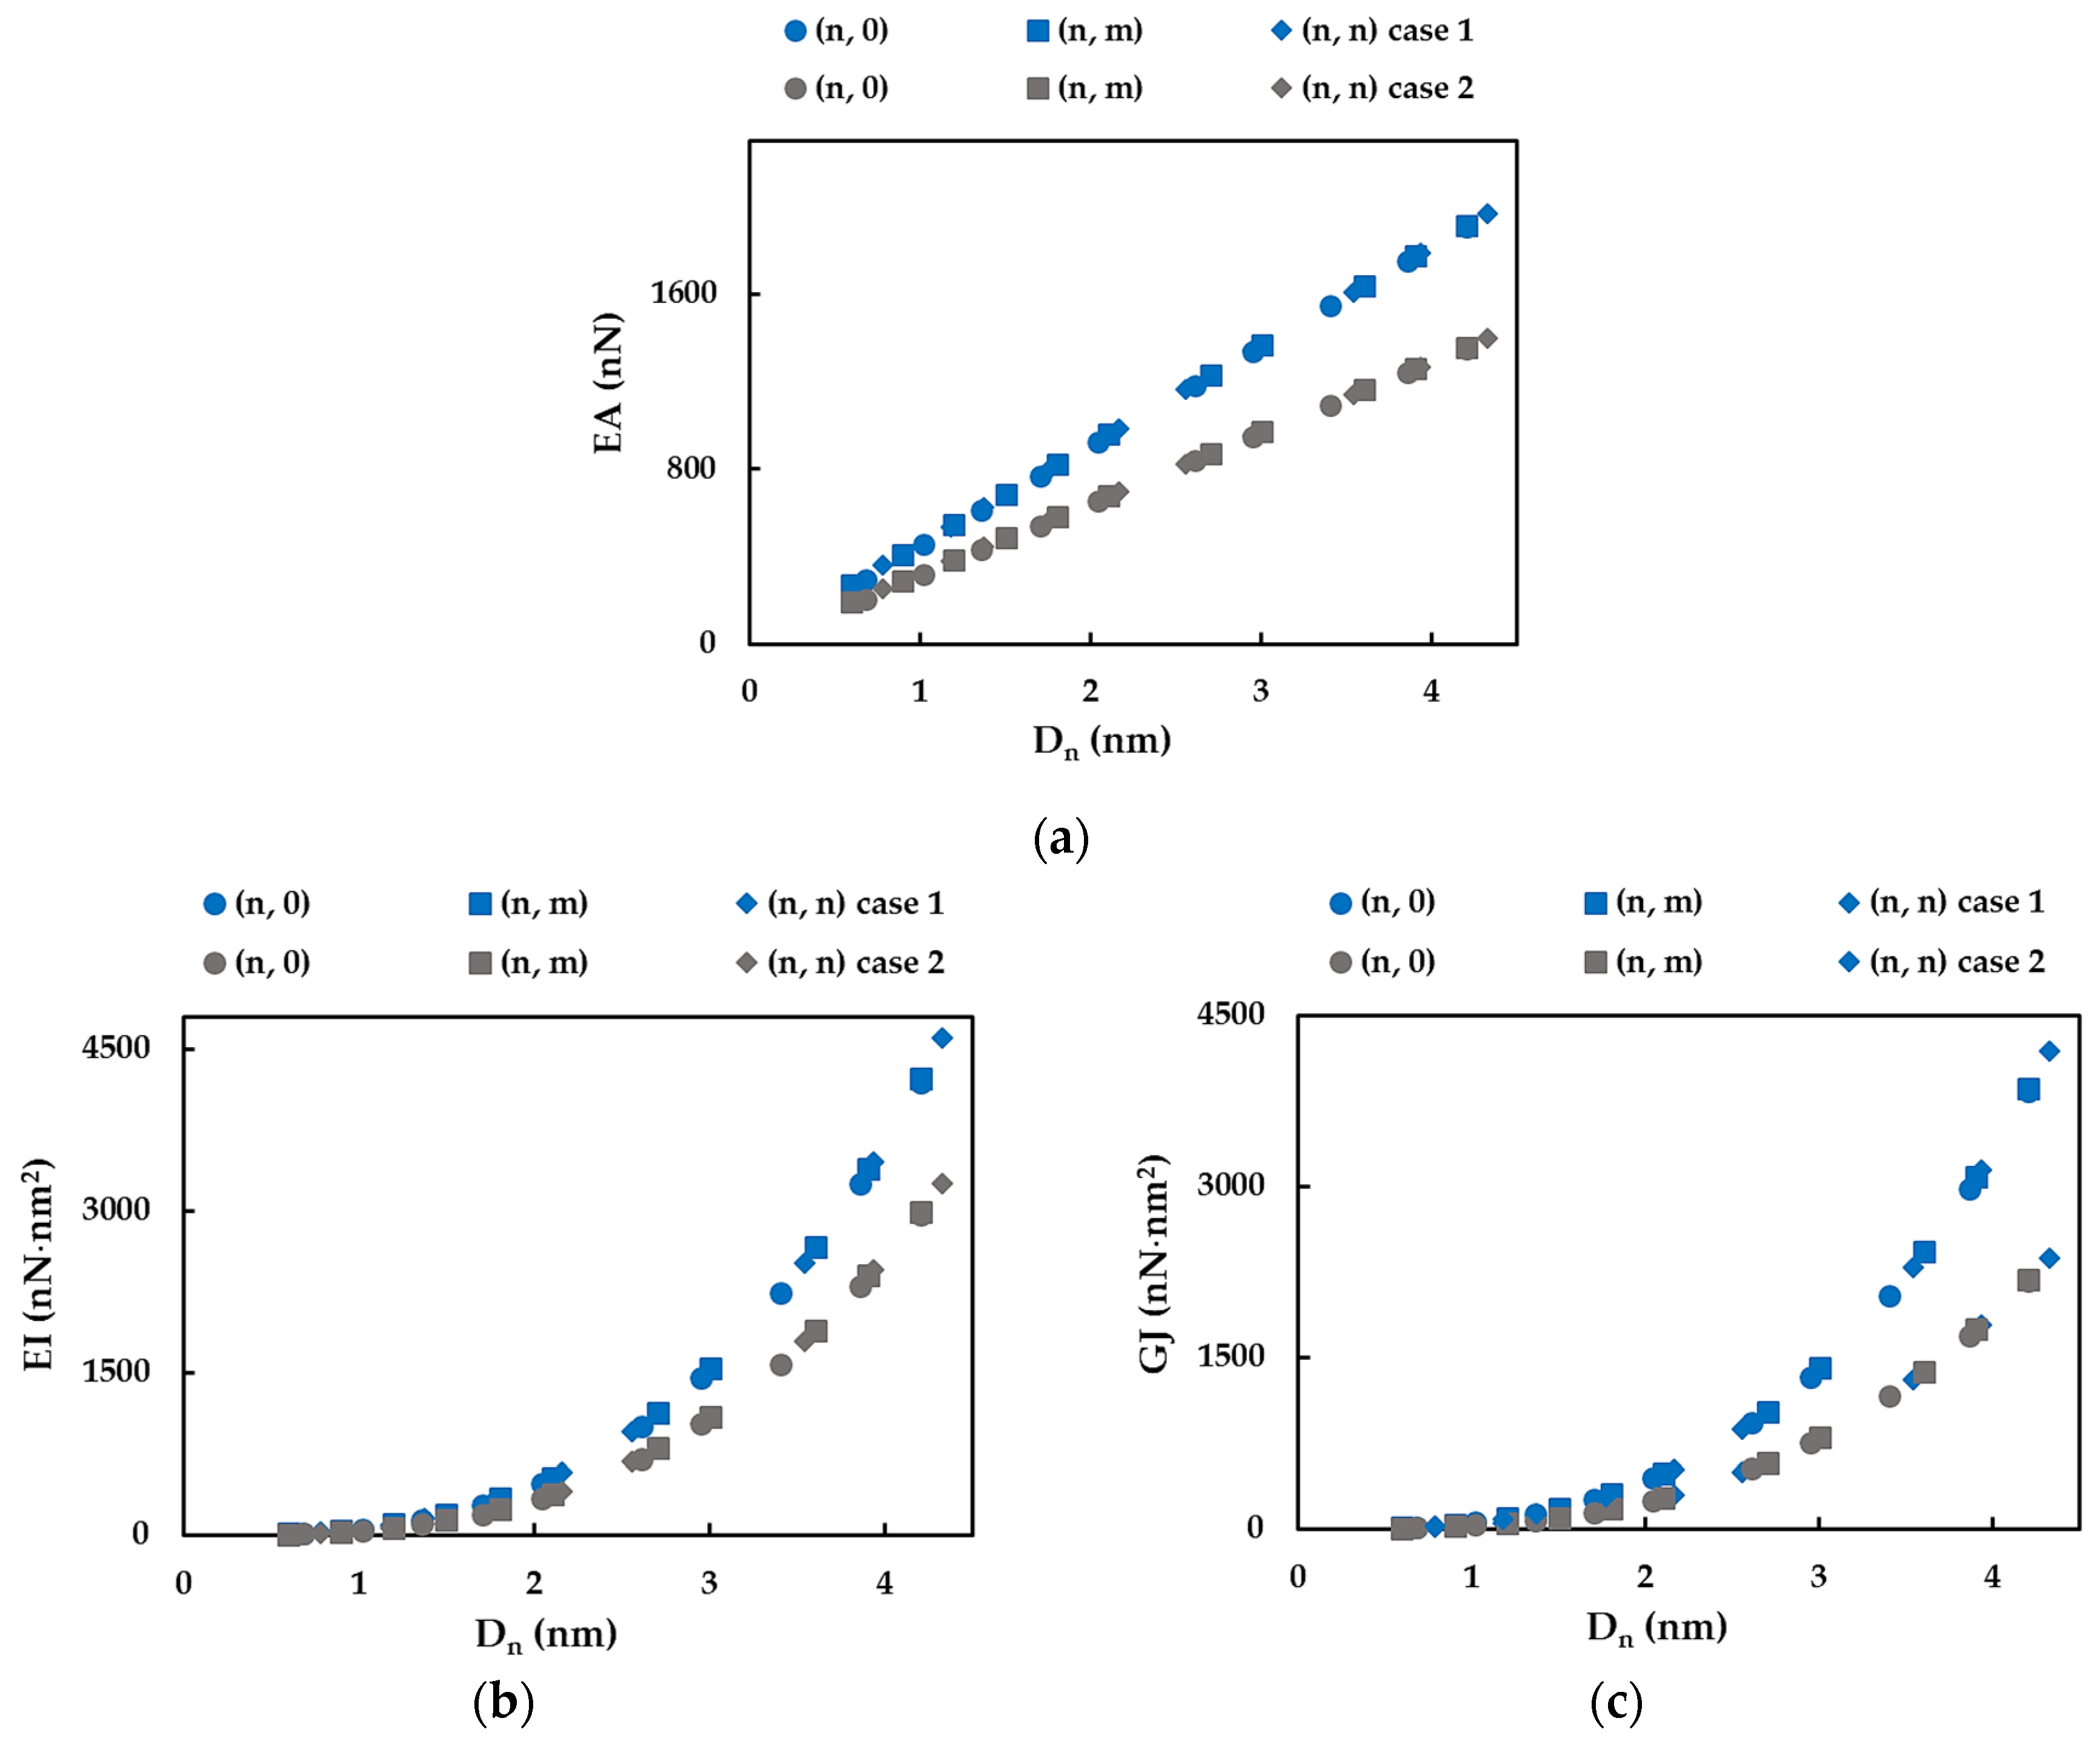
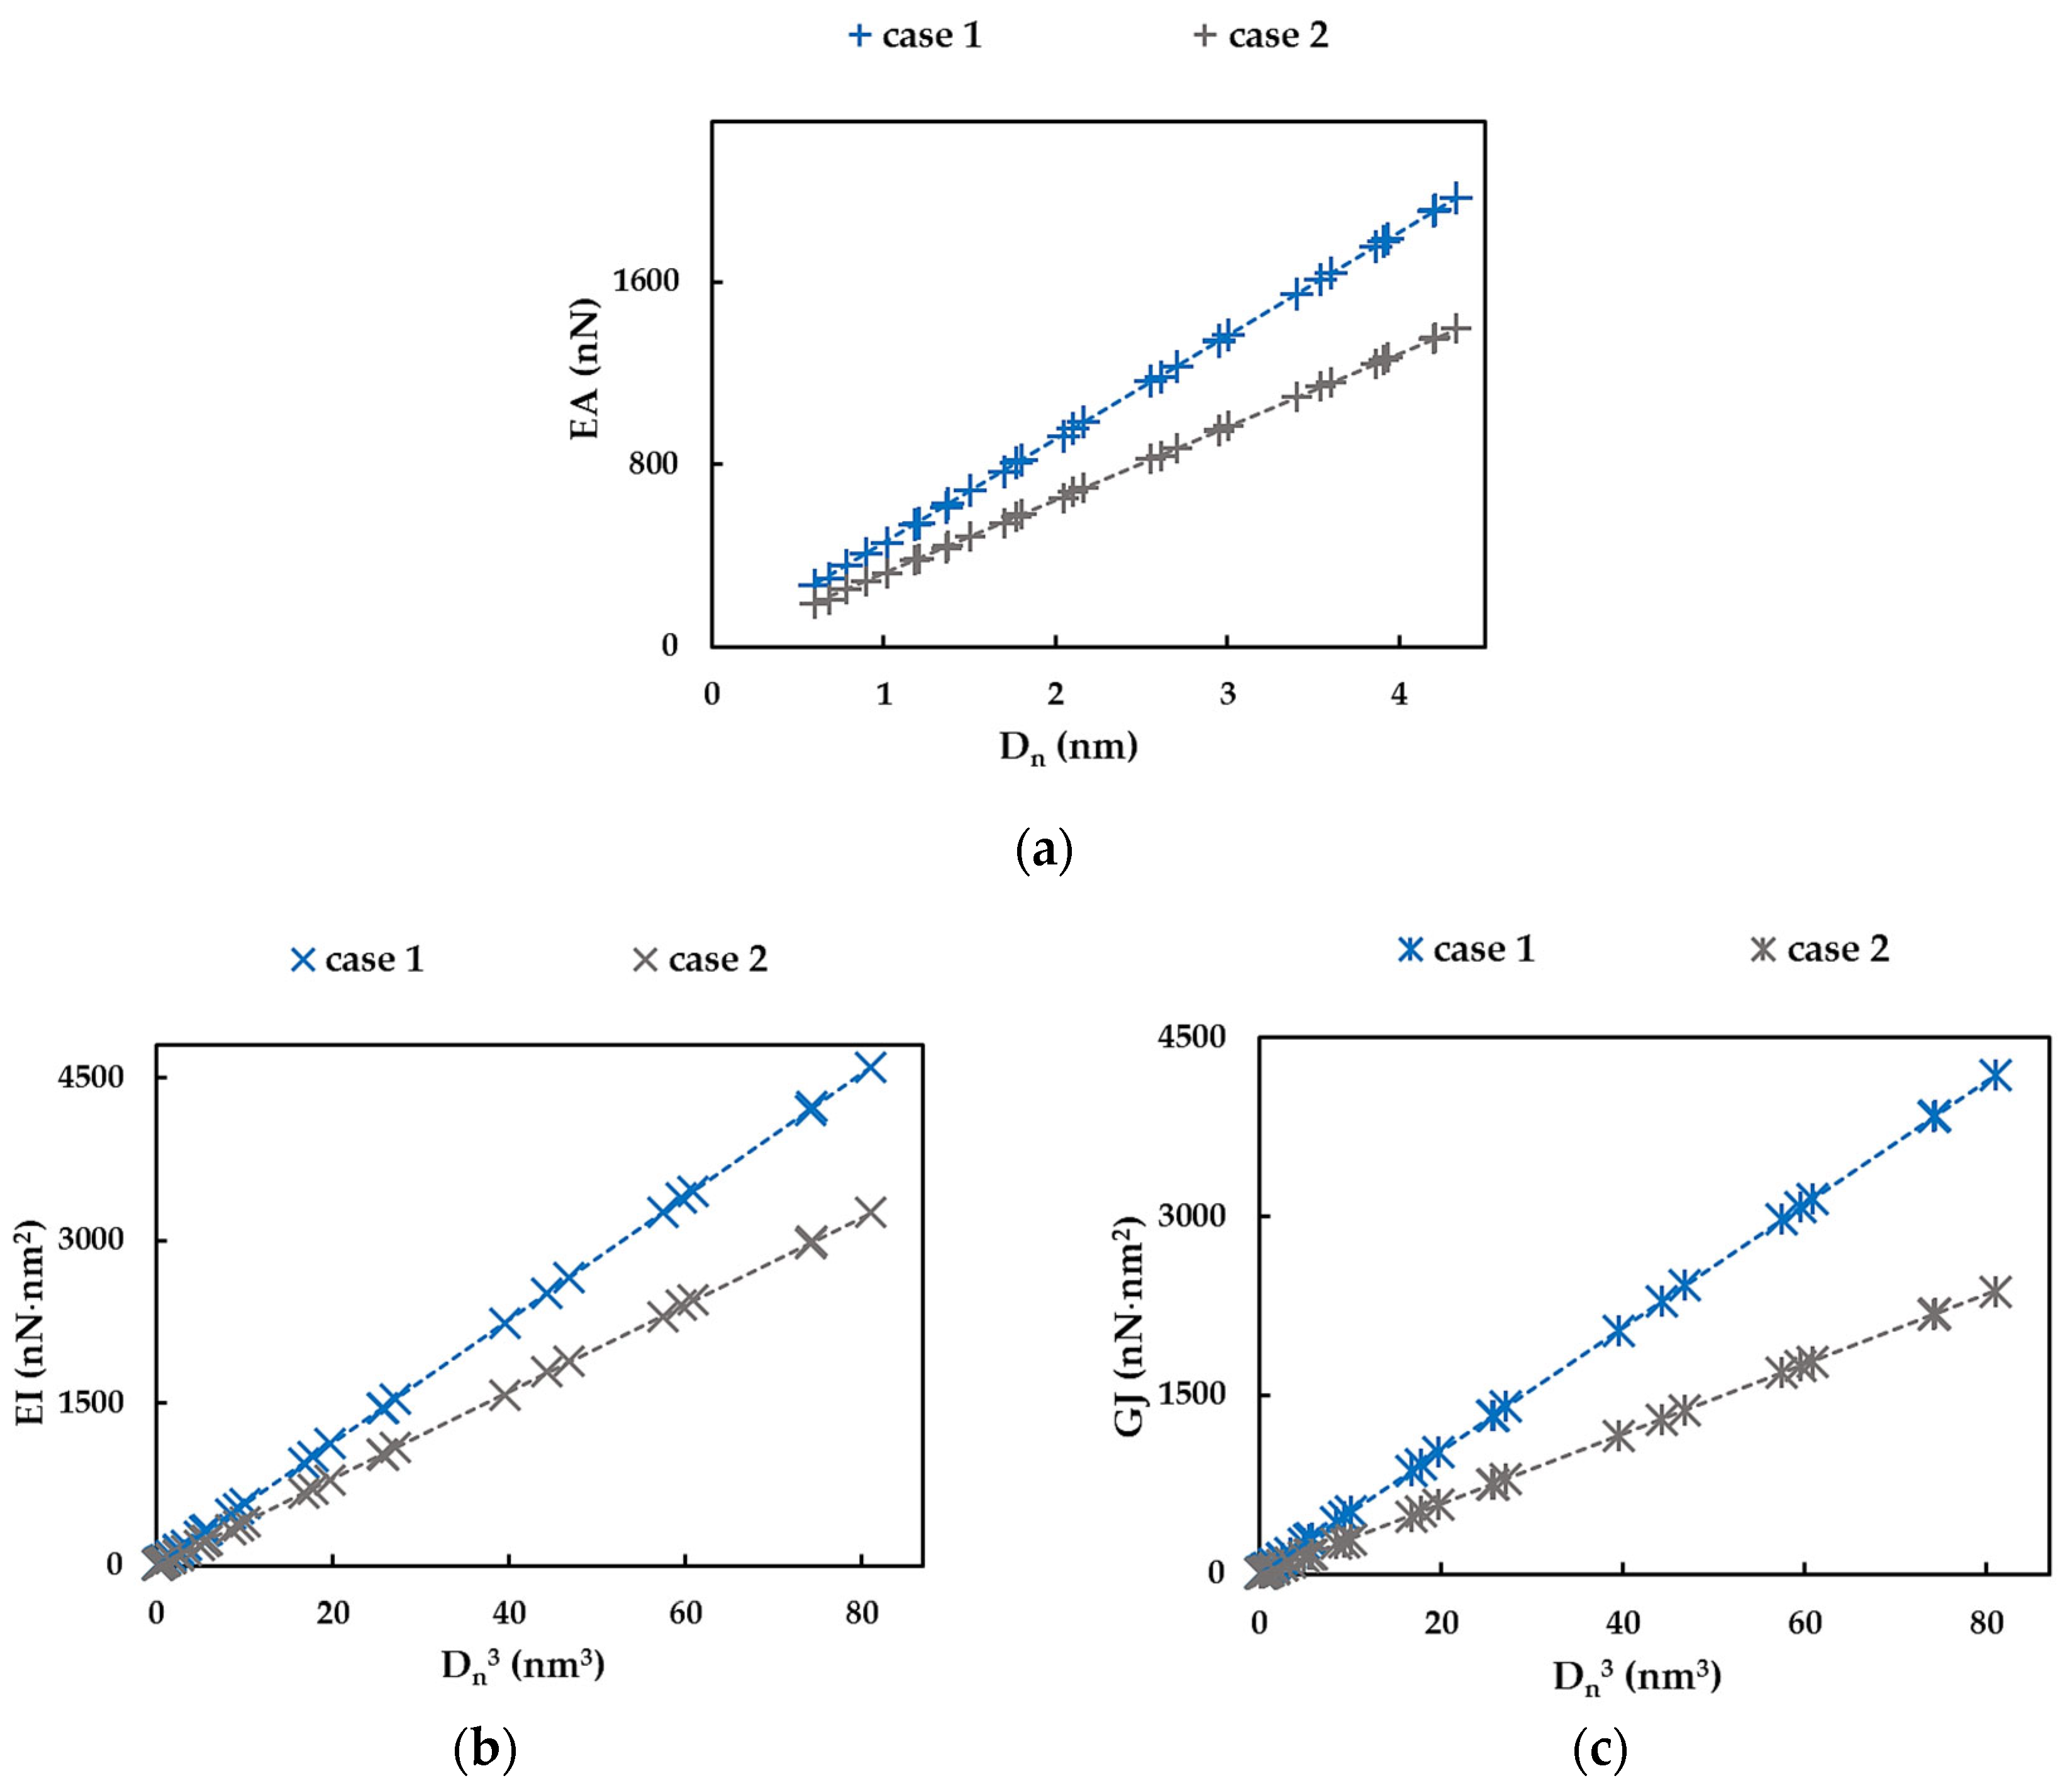
In this section, three rigidities, tensile, EA, bending, EI, and torsional, GJ, are evaluated with the aid of Equations (22)–(24), using the methodology established in previous studies by the authors [17,18,20,21]. To this end, the evolutions of EA, EI and GJ rigidities are presented in Figure 9 as a function of the NT diameter, D n .
For Cases 1 and 2 of the input parameters chosen for the FE simulation (see Table 2), and regardless of the NTs symmetry group, whether zigzag, chiral Θ = 19.1° or armchair, the EA, EI and GJ values are represented by the same trend with increasing NT diameter. It is worth mentioning that the tensile, bending and torsional rigidities evaluated for Case 1 (UFF) are greater than the EA, EI and GJ values, for case 2 (DFT+MM). As for the cases of the single-walled carbon [20,21], boron nitride [18] and 13th group element–phosphide [17]–nanotubes, for SWInNNTs, the EA rigidity can be described by a linear function of D n (Figure 10a) and the EI and GJ rigidities can be described by a linear function of D n 3 (Figure 10b,c).
The straight lines in Figure 10a–c can be represented by the following expressions:
EA = α InN D n ,
EI = β InN D n 3 ,
GJ = γ InN D n 3 ,
where   α InN ,   β InN and γ InN are the fitting parameters for SWInNNTs. The values of these parameters, defined as the inclination of dash lines on the graphs in Figure 10a–c, as well as the mean differences between the EA, EI and GJ values evaluated analytically by Equations (30)–(32) and those calculated by Equations (22)–(24), based on the data obtained from the FE analysis, are shown in Table 5. It can be concluded that the Equations (30)–(32) allow for an accurate assessment of the SWInNNTs rigidities. The knowledge of the fitting parameters,   α InN ,   β InN and γ InN , and NT diameter, D n , is the basis for the accurate evaluation of the elastic properties of InN nanotubes without resorting to numerical simulation. These data complement a fitting parameters selection, already composed by results previously obtained for nanotubes of carbon [20,21] and other non-carbon, such as boron nitride [18], phosphide [17] and silicon carbide [24] nanotubes.

3.3. Young’s Modulus of SWInNNTs

The Young’s modulus, E, of the SWInNNTs was evaluated by Equation (25). Furthermore, replacing in Equation (25) the tensile, EA, and bending, EI, rigidities with the expressions (30) and (31) and knowing the parameters   α InN and   β InN , the SWInNNTs diameter,   D n , and the wall thickness, t n , E can be calculated as follows:
E = α InN D n π t n 8 β InN α InN D n 2 t n 2 .
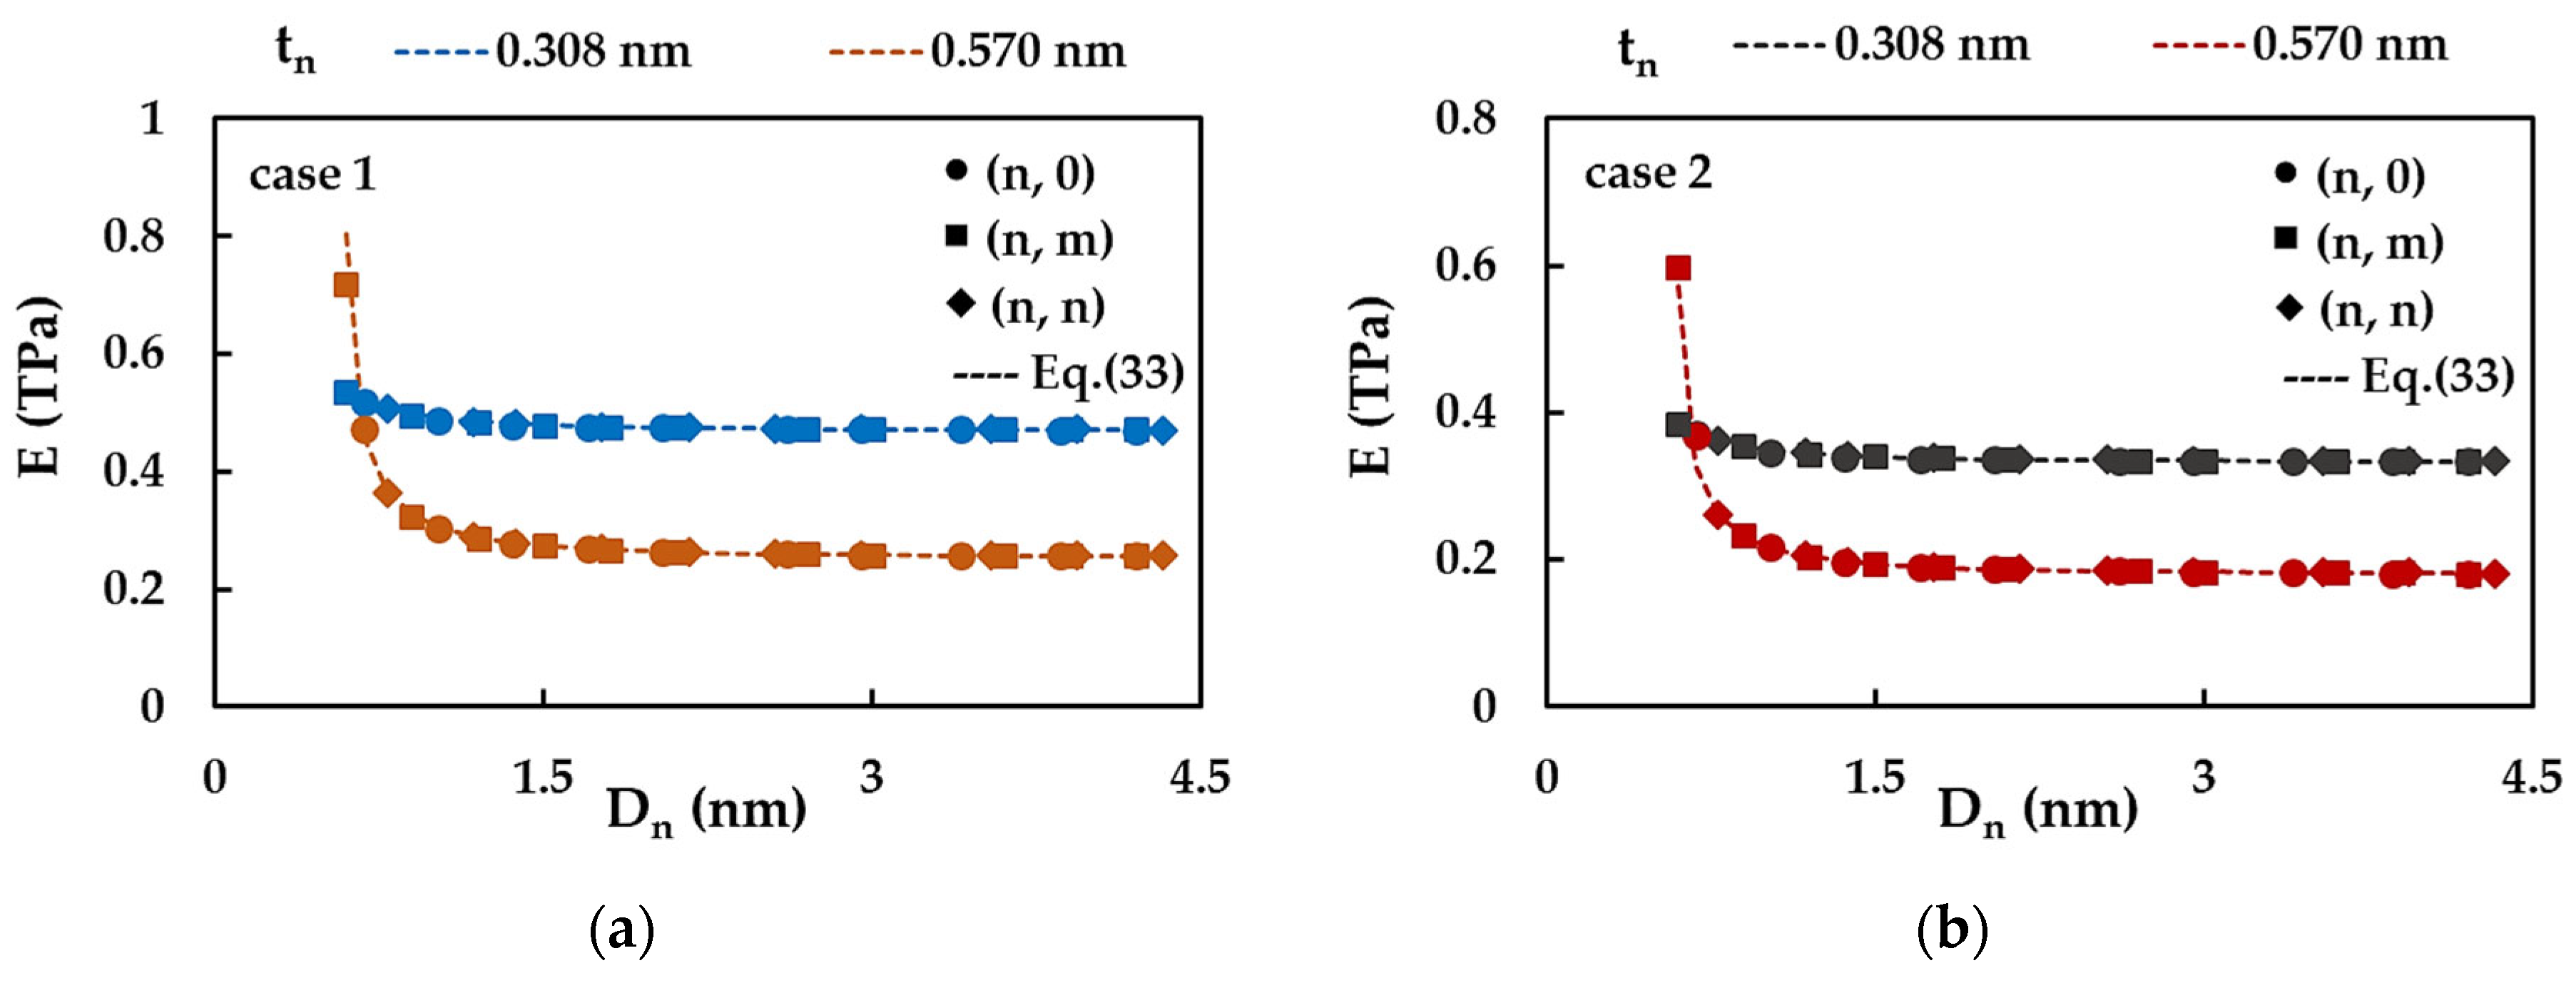
Figure 11 shows the evolutions of the Young’s modulus, E, as a function of the nanotube diameter, D n , for t n = 0.308 nm and 0.570 nm, obtained for Case 1 (Figure 11a) and 2 (Figure 11b) of the input parameters (Table 1). The E values calculated by Equation (33) are also plotted in Figure 11.
Regardless of the value of t n , the case of input parameters and the symmetry group of NT, non-chiral or chiral, the value of E decreases at the beginning with increasing D n and then stabilises for nanotube diameters D n   > 1.35 nm. This decrease is more accentuated for the largest wall thickness of 0.570 nm, as can be seen in Figure 11. Furthermore, Equation (33) permits accurate evaluation of the Young’s modulus of SWInNNTs without the need to use numerical simulation. With respect to the accuracy of the Young’s modulus determination, a considerable dispersion of the E values is observed, depending on the input parameters and the wall thickness. This makes the Young’s modulus, E, not reliable enough for characterising the SWInNNTs elastic response. Consequently, the surface Young’s modulus, E S , evaluated by Equation (28), is analysed in the following.
By substituting EA and EI rigidities in Equation (28) with the correspondent relationships (30) and (31), it is possible to calculate the value of E S , which is independent of the NT diameter, as follows:
E S = α InN π 8 β InN α InN ,
where   α InN and   β InN are the fitting parameters from Table 5.
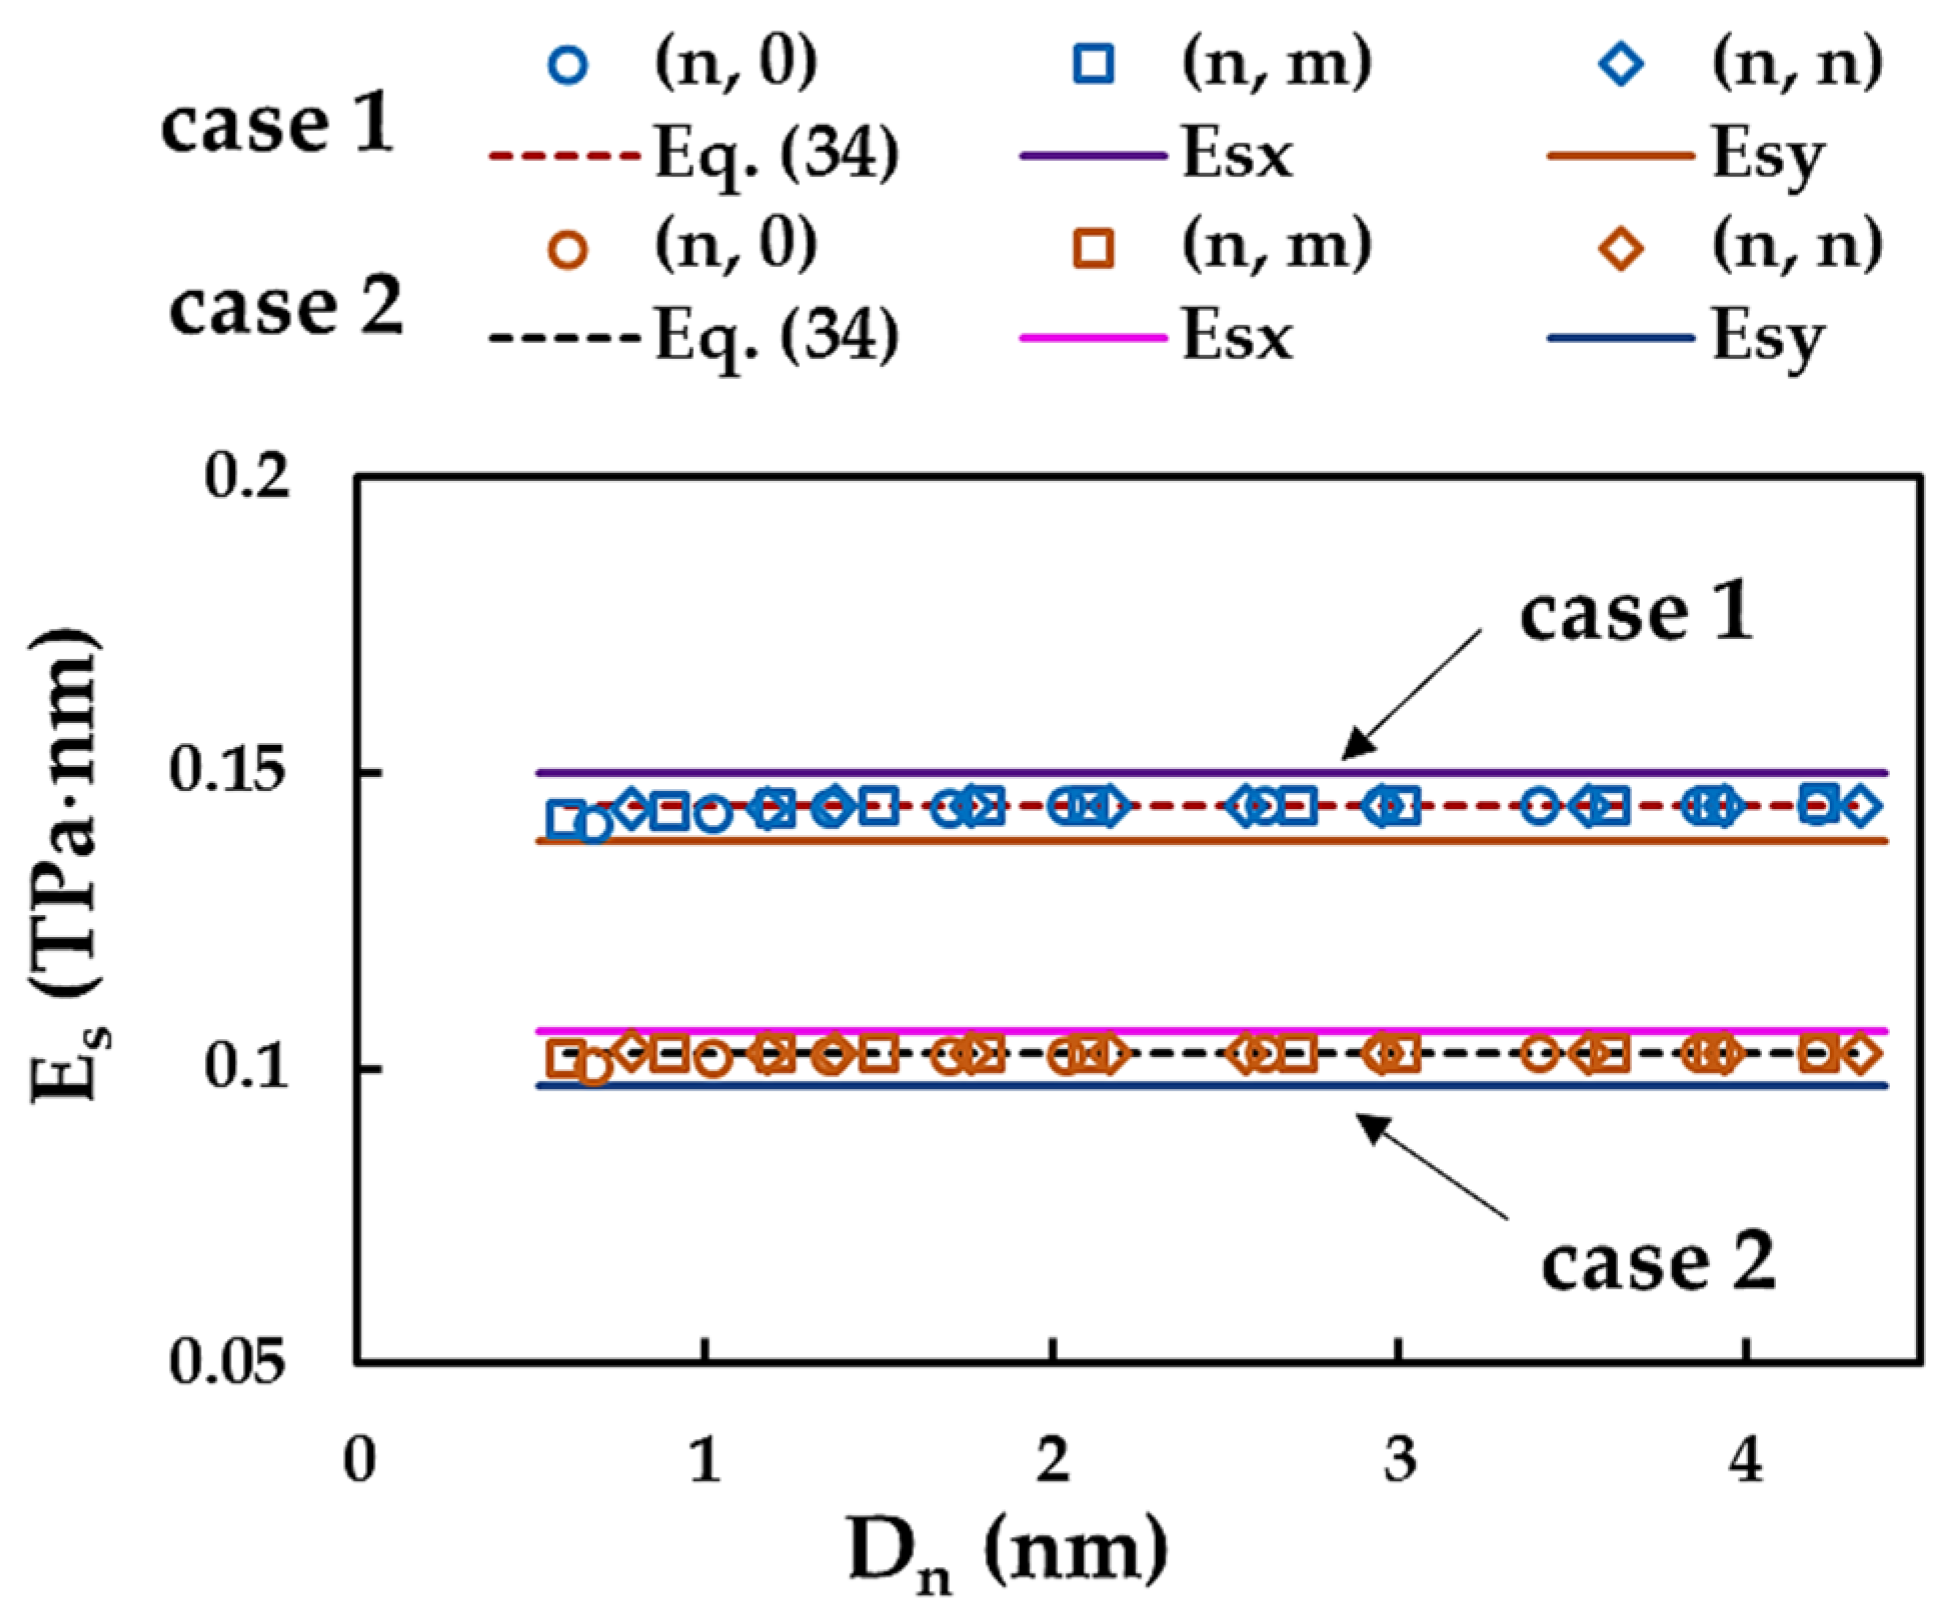
Figure 12 shows the evolutions of E S as a function of NT diameter, D n , for SWInNNTs, together with the values of the surface Young’s moduli, E sx (zigzag direction) and E sy (armchair direction), of single-layer InNNSs. The E S results obtained by Equation (34) are also shown in Figure 12.
Both Case 1 and 2 of the input parameters are considered in the analysis. The surface Young’s modulus of SWInNNTs is essentially stable over the entire diameter range of the NTs under study regardless of the case of the input parameters and symmetry group of the NTs. This quasi-constant value of E S is about the same as that calculated by Equation (34): 0.145 TPa⋅nm and 0.102 TPa⋅nm for Case 1 (UFF) and Case 2 (DFT + MM), respectively. Moreover, the surface Young’s modulus, E S , of SWInNNTs approaches the value of E sx determined along the zigzag direction for the InNNSs; on the other hand, E S is slightly greater than E sy along the armchair direction, considering both Cases 1 or 2. With regard to the influence of the input parameters on the results, the ratio between the surface Young’s moduli determined for Case 1 (UFF) and Case 2 (DFT + MM), was found to be E S UFF / E S DFT ≈ 1.41 for both nanostructures, InNNSs and SWInNNTs, regardless of the method used for the E S evaluation, numerical or analytical.

3.4. Surface Shear Modulus and Poisson’s Ratio of SWInNNTs

As shown in the previous section, the Young’s modulus has an ambiguous value and cannot be a reliable characteristic for describing the elastic behaviour of SWInNNTs. Thus, only the surface shear modulus results are presented below.
The surface shear modulus, G S , can be calculated by Equation (29), using the three rigidities obtained in the FE analysis. However, the EA, EI and GJ rigidities given by the analytical relationships (30)–(32), respectively, can be substituted in Equation (29), which converts into the following expression:
G S = γ InN π 32 β InN α InN 3 .
where   α InN ,   β InN and γ InN are the fitting parameters from Table 5. In this way, the surface shear modulus depends only on its values.
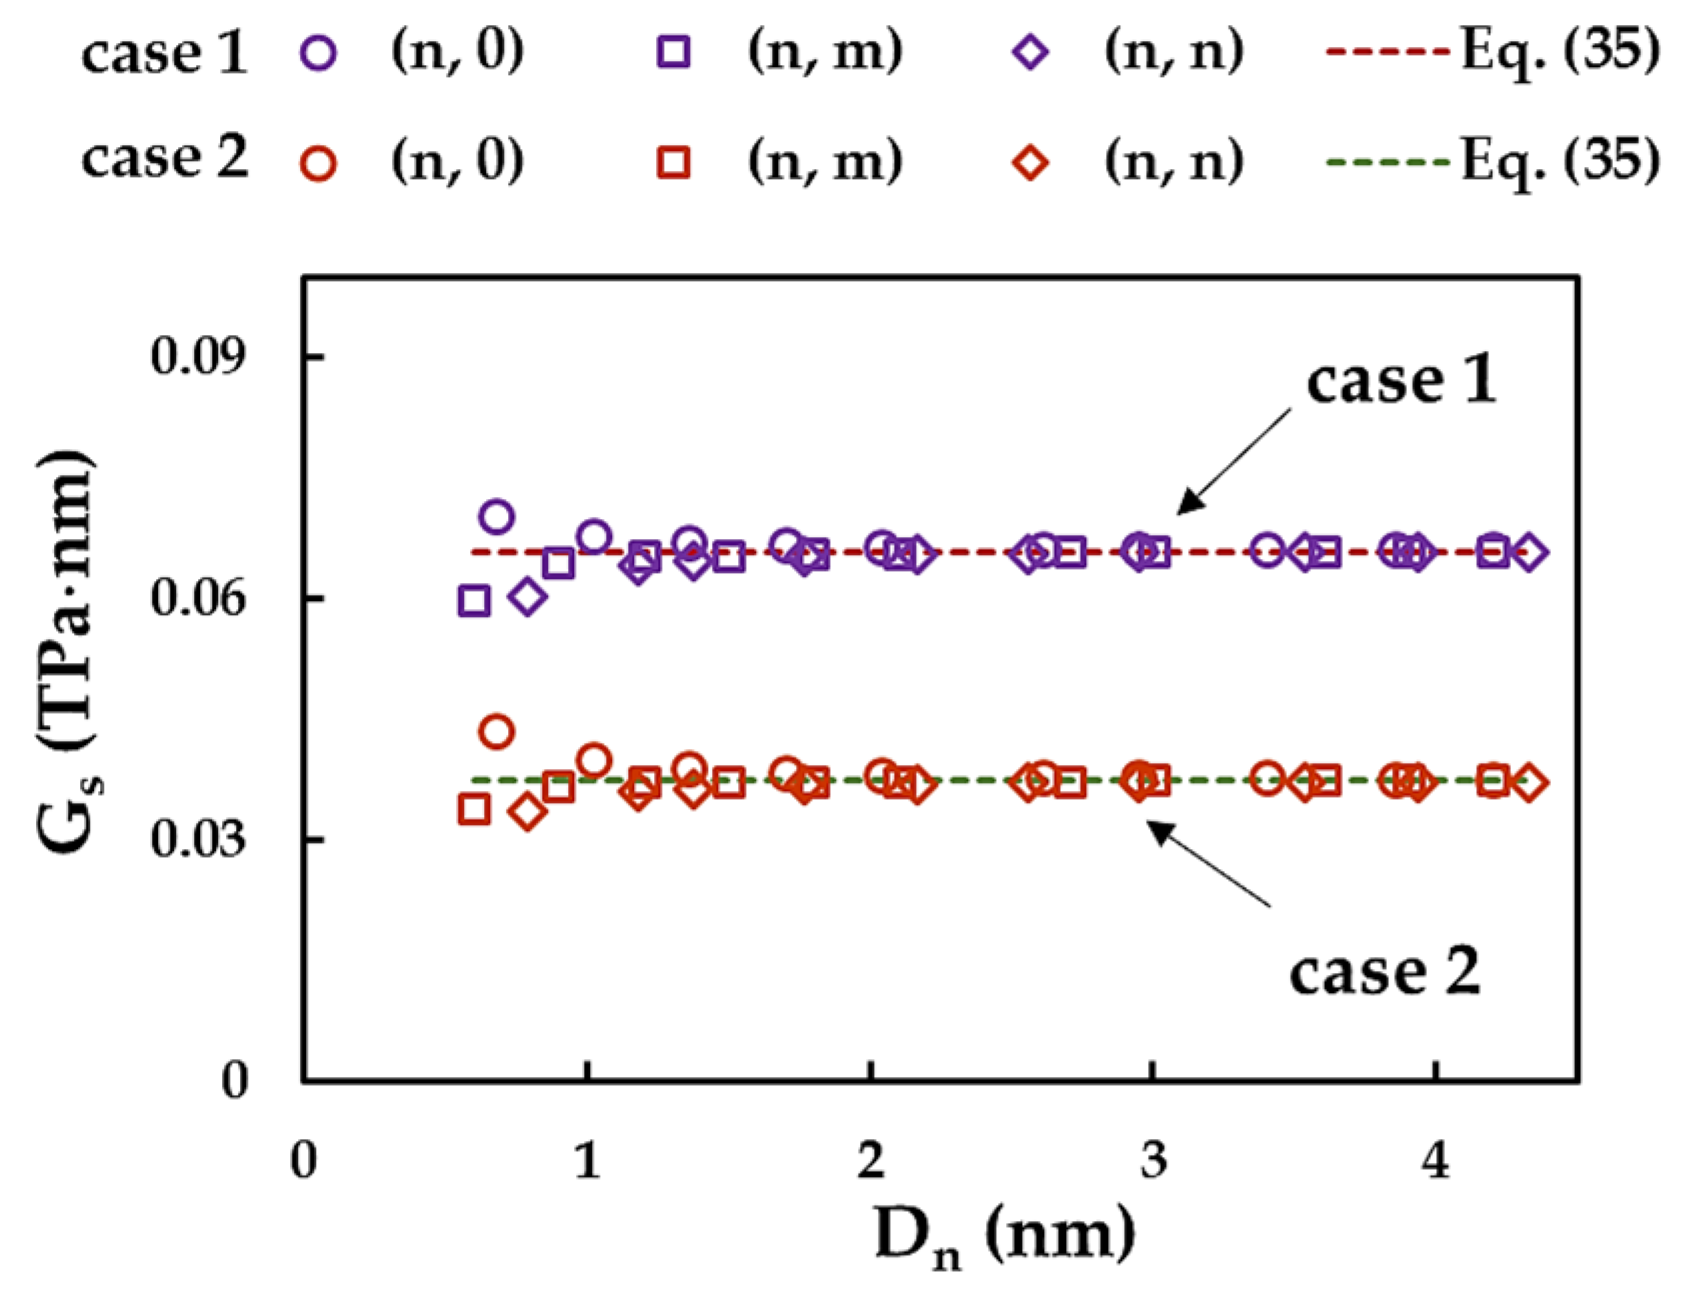
Figure 13 shows the evolution of G S , calculated by Equations (29) and (35), with the SWInNNTs diameter, D n , for Cases 1 and 2 of the input parameters.
For D n < 1.35 nm, the surface shear modulus, G S , decreases for zigzag (n, 0) nanotubes and increases for chiral (n, m) and armchair (n, n) nanotubes. As the NTs diameter increases, the value of G S stabilises and converges to an almost constant value for any the chiral angle (NTs symmetry group). The converged average values, G S = 0.066 TPa⋅nm and 0.037 TPa⋅nm for Case 1 (UFF) and Case 2 (DFT+MM), respectively, are equal to those calculated by Equation (35) for the respective input parameter case. It can be concluded that the analytical expression (35) allows for the accurate evaluation of the shear modulus for SWInNNTs with diameters, D n > 1.35 nm. The ratio G S UFF / G S DFT ≈ 1.76 indicates that the G S value determined for Case 1 is higher than that for Case 2.
The Poisson’s ratio, ν, of the SWInNNTs was evaluated with help of Equation (27). Furthermore, combining this equation with expressions (31) and (32) for EI and GJ rigidities, ν can be calculated as follows:
ν = β InN γ InN     1 ,
where   β InN and γ InN are the fitting parameters from Table 5. Thus, the Poisson’s ratio assessed by this equation is independent of the nanotube diameter.
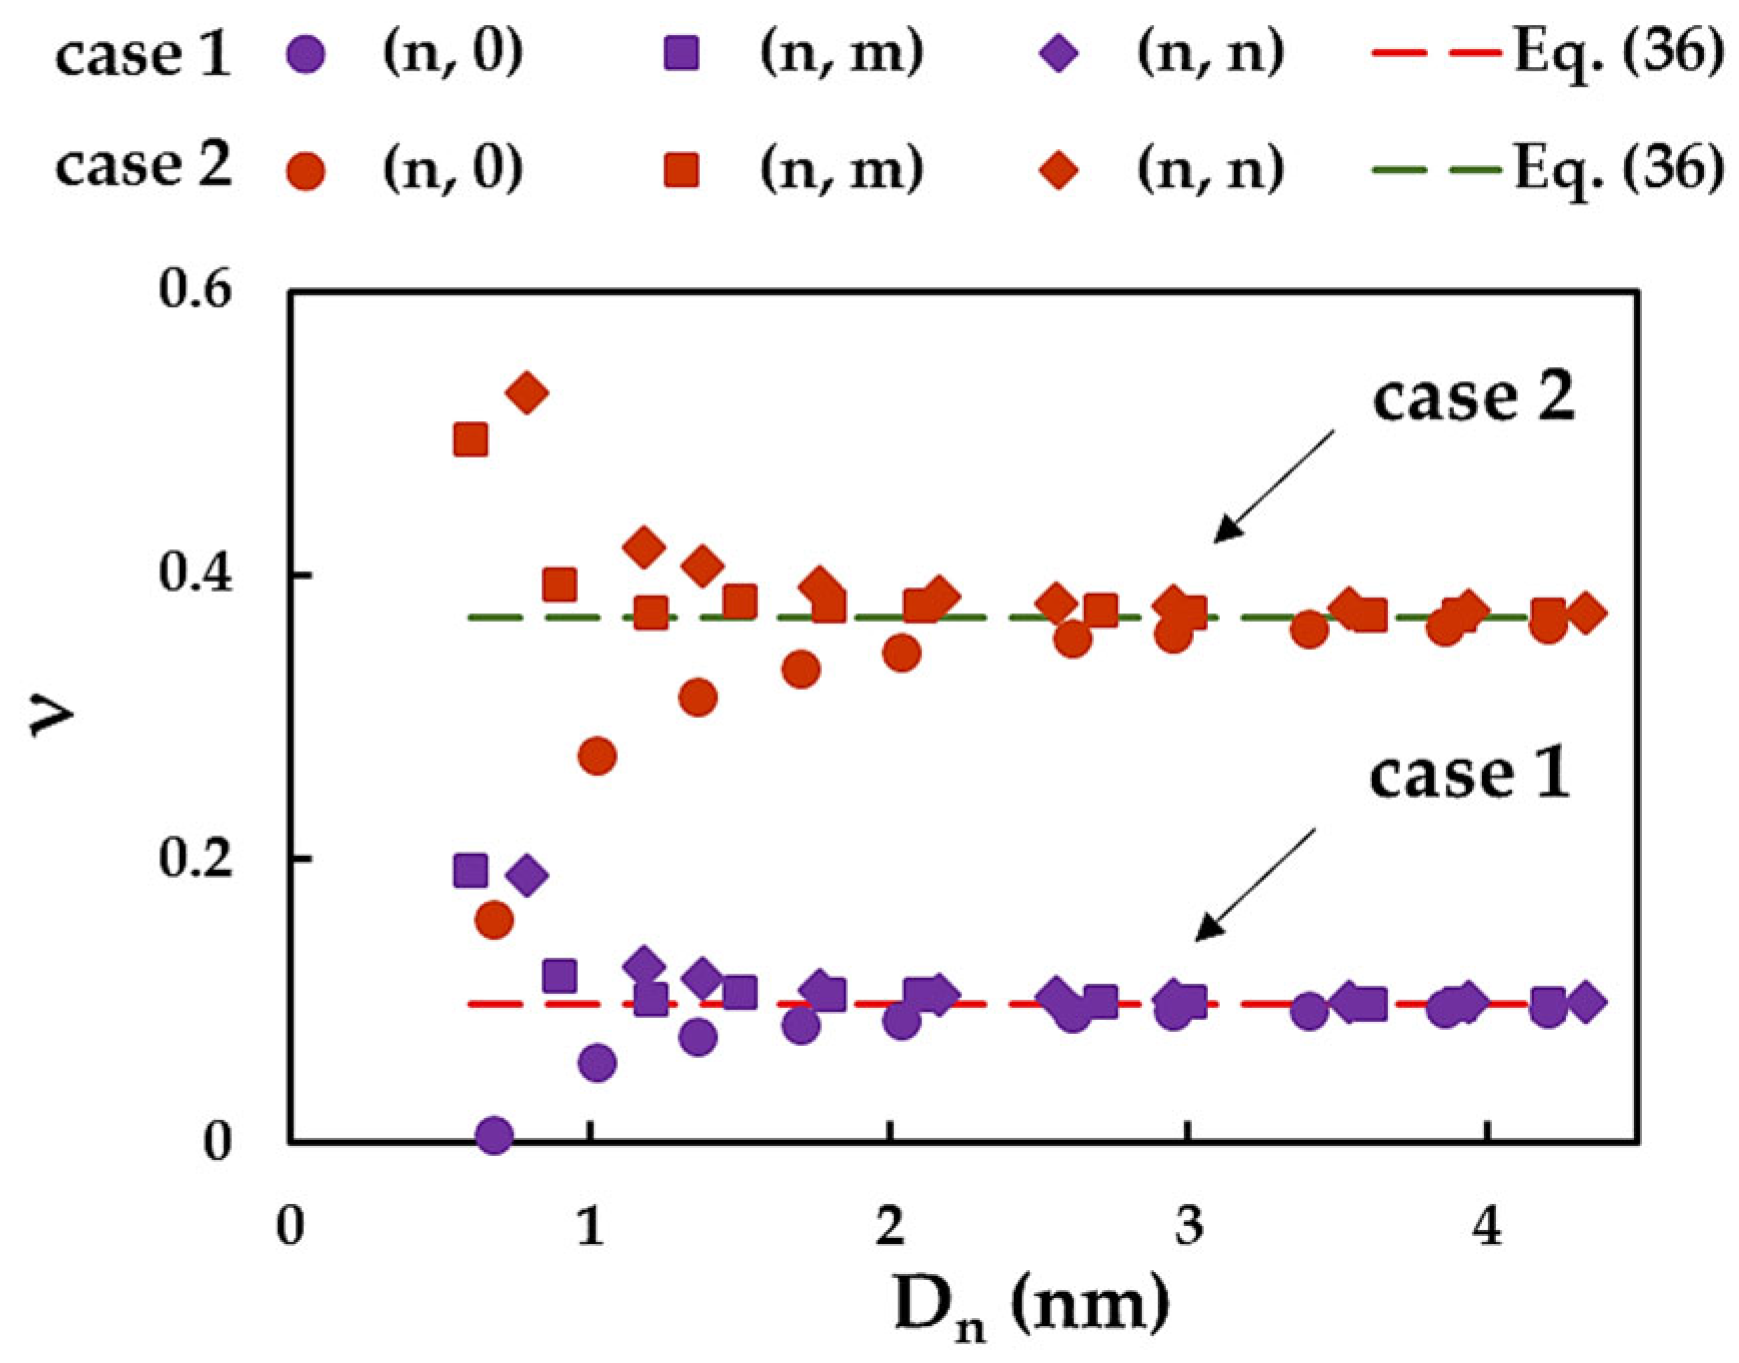
The evolutions of the SWInNNTs, determined by Equations (27) and (36), with the NTs diameter, D n , for Case 1 and 2 of the input parameters are shown in Figure 14.
For the SWInNNTs with D n up to approximately 2.55 nm, ν decreases for (n, m) and (n, n) NTs and increases for (n, 0) NTs. Then, for all InN nanotubes with diameters D n > 2.55 nm, the Poisson’s ratio converges to the constant value determined by Equation (36) regardless of the NTs symmetry group. The converged average value of ν obtained for Case 2, ν = 0.37, is higher than that for Case 1, ν = 0.10. As is evident from Figure 14, the Poisson’s ratio of the SWInNNTs is chiral angle sensitive only for NTs with small diameters, and the ν value can be accurately calculated by the analytical expression (36) for nanotubes with D n > 2.55 nm.

4. Conclusions

The elastic properties of indium nitride nanostructures with graphene-like lattice, single layer InNNSs and SWInNNTs, were assessed using the NCM/MSM approach. For the first time, the study of this mechanical behaviour was performed, consisting of the systematic evaluation of the rigidities, elastic moduli and Poisson’s ratio of the InN nanotubes. The main conclusions are summarised in the following.
The force field constants, necessary for the calculation of the input parameters for the numerical simulation, were defined by two approaches. The influence of the two resulting input sets on the elastic properties of the InNNSs (surface Young’s modulus) and SWInNNTs (three rigidities, Young’s modulus, surface Young’s and shear moduli and Poisson’s ratio) was analysed. The elastic properties of InN nanosheets and nanotubes, evaluated by numerical simulation with the input parameters from the UFF calculation method, showed values greater than those determined using the input set based on the DFT calculation; the only exception was the Poisson’s ratio of the SWInNNTs.
The surface Young’s modulus of the InNNSs was nearly independent of the nanosheet size, but it was sensitive to axial loading conditions, i.e., the surface Young’s modulus in the zigzag direction was greater than that in the armchair direction.
Based on the values of the nanosheet thickness found in the literature, the Young’s modulus of the InNNSs was compared with relevant results available for bulk and thin film InN. In the present model, there is a combination of the input dataset and the thickness of the nanosheet that obtains the best concordance with the literature results for the case of the Young’s modulus of the InN thin films [23].
Robust methodologies were proposed to calculate the surface Young’s modulus of SWInNNTs for a wide range of their diameters, and surface shear modulus and Poisson’s ratio of nanotubes with large diameter, without resourcing to numerical simulation. It should be noted that the surface Young’s modulus of SWInNNTs tends towards the value obtained for the single-layer InNNSs.
The results obtained constitute a benchmark for the evaluation of the elastic properties of the indium nitride nanosheets and nanotubes using theoretical methods.

Author Contributions

Numerical simulations, N.A.S.; software, B.M.C. with support of J.M.A.; methodology, N.A.S., J.M.A. and A.F.G.P.; formal analysis, N.A.S., J.M.A., J.V.F. and A.F.G.P.; writing—original manuscript, N.A.S. and J.V.F.; writing—review and editing, all the authors. All authors have read and agreed to the published version of the manuscript.

Funding

This research is sponsored by FEDER funds through the program COMPETE—Programa Operacional Factores de Competitividade—and by national funds through FCT, Fundação para a Ciência e a Tecnologia, under the project UIDB/00285/2020 and LA/P/0112/2020.

Data Availability Statement

The data presented in this study are available on request from the corresponding author after obtaining permission of authorised person.

Conflicts of Interest

The authors declare no conflict of interest. The funders had no role in the design of the study; in the collection, analyses, or interpretation of the data; in the writing of the manuscript; or in the decision to publish the results.

References

  1. Chattopadhyay, S.; Ganguly, A.; Chen, K.-H.; Chen, L.-C. One-Dimensional Group III-Nitrides: Growth, Properties, and Applications in Nanosensing and Nano-Optoelectronics. Crit. Rev. Solid State Mater. Sci. 2009, 34, 224–279. [Google Scholar] [CrossRef]
  2. Tansley, T.L.; Foley, C.P. Electron mobility in indium nitride. Electron. Lett. 1984, 20, 1066–1068. [Google Scholar] [CrossRef]
  3. Wu, J.; Walukiewicz, W.; Yu, K.M.; Ager, J.W.; Haller, E.E.; Lu, H.; Schaff, W.J.; Saito, Y.; Nanishi, Y. Unusual properties of the fundamental band gap of InN. Appl. Phys. Lett. 2002, 80, 3967–3969. [Google Scholar] [CrossRef] [Green Version]
  4. Peng, Q.; Sun, X.; Wang, H.; Yang, Y.; Wene, X.; Huang, C.; Liu, S.; De, S. Theoretical prediction of a graphene-like structure of indium nitride: A promising excellent material for optoelectronics. Appl. Mater. Today 2017, 7, 169–178. [Google Scholar] [CrossRef]
  5. Oseki, M.; Okubo, K.; Kobayashi, A.; Ohta, J.; Fujioka, H. Field-effect transistors based on cubic indium nitride. Sci. Rep. 2014, 4, 3951. [Google Scholar] [CrossRef] [Green Version]
  6. Nakamura, S.; Mukai, T.; Senoh, M. Candela-class high brightness InGaN/AlGaN double-heterostructure blue-light emitting diodes. Appl. Phys. Lett. 1994, 64, 1687–1689. [Google Scholar]
  7. Nakamura, S. The roles of structural imperfections in InGaN-based bluelight-emitting diodes and laser diodes. Science 1998, 281, 956–961. [Google Scholar] [CrossRef] [Green Version]
  8. Şahin, H.; Cahangirov, S.; Topsakal, M.; Bekaroglu, E.; Akturk, E.; Senger, R.T.; Ciraci, S. Monolayer honeycomb structures of group-IV elements and III-V binary compounds: First-principles calculations. Phys. Rev. B 2009, 80, 155453. [Google Scholar] [CrossRef] [Green Version]
  9. Le, M.-Q. Atomistic Study on the tensile properties of hexagonal AlN, BN, GaN, InN and SiC sheets. J. Comput. Theor. Nanosci. 2014, 11, 1458–1464. [Google Scholar] [CrossRef]
  10. Yin, L.; Bando, Y.; Golberg, D.; Li, M. Growth of single-crystal indium nitride nanotubes and nanowires by controlled-carbonitridation reaction route. Adv. Mater. 2004, 16, 1833–1838. [Google Scholar] [CrossRef]
  11. Sardar, K.; Deepak, F.L.; Govindaraj, A.; Seikh, M.M.; Rao, C.N.R. InN nanocrystals, nanowires, and nanotubes. Small 2005, 1, 91–94. [Google Scholar] [CrossRef] [PubMed]
  12. Qian, Z.; Hou, S.; Zhang, J.; Li, R.; Shen, Z.; Zhao, X.; Xue, Z. Stability and electronic structure of single-walled InN nanotubes. Physica E 2005, 30, 81–85. [Google Scholar] [CrossRef]
  13. Mayo, S.L.; Barry, D.; Olafson, B.D.; Goddard, W.A. DREIDING: A generic force field for molecular simulations. J. Phys. Chem. 1990, 94, 8897–8909. [Google Scholar] [CrossRef]
  14. Rappé, A.K.; Casewit, C.J.; Colwell, K.S.; Goddard, W.A.; Skid, W.M. UFF, a full periodic table force field for molecular mechanics and molecular dynamics simulations. J. Am. Chem. Soc. 1992, 114, 10024–10039. [Google Scholar] [CrossRef]
  15. Li, C.; Chou, T.W. A structural mechanics approach for the analysis of carbon nanotubes. Int. J. Solids Struct. 2003, 40, 2487–2499. [Google Scholar] [CrossRef]
  16. Genoese, A.; Genoese, A.; Rizzi, N.L.; Salerno, G. Force constants of BN, SiC, AlN and GaN sheets through discrete homogenization. Meccanica 2018, 53, 593–611. [Google Scholar] [CrossRef]
  17. Sakharova, N.A.; Antunes, J.M.; Pereira, A.F.G.; Chaparro, B.M.; Fernandes, J.V. Elastic properties of single-walled phosphide nanotubes: Numerical Simulation Study. Nanomaterials 2022, 12, 2360. [Google Scholar] [CrossRef]
  18. Sakharova, N.A.; Antunes, J.M.; Pereira, A.F.G.; Chaparro, B.M.; Fernandes, J.V. On the determination of elastic properties of single-walled boron nitride nanotubes by numerical simulation. Materials 2021, 14, 3183. [Google Scholar] [CrossRef]
  19. Tapia, A.; Cab, C.; Hernández-Pérez, A.; Villanueva, C.; Peñuñuri, F.; Avilés, F. The bond force constants and elastic properties of boron nitride nanosheets and nanoribbons using a hierarchical modeling approach. Physica E 2017, 89, 183–193. [Google Scholar] [CrossRef]
  20. Sakharova, N.A.; Pereira, A.F.G.; Antunes, J.M.; Brett, C.M.A.; Fernandes, J.V. Mechanical characterization of single-walled carbon nanotubes. Numerical simulation study. Compos. B-Eng. 2015, 75, 73–85. [Google Scholar] [CrossRef]
  21. Pereira, A.F.G.; Antunes, J.M.; Fernandes, J.V.; Sakharova, N.A. Shear modulus and Poisson’s ratio of single-walled carbon nanotubes: Numerical evaluation. Phys. Status Solidi B 2016, 253, 366–376. [Google Scholar] [CrossRef]
  22. Ueno, M.; Yoshida, M.; Onodera, A.; Shimomura, O.; Takemura, K. Stability of the wurtzite-type structure under high pressure: GaN and InN. Phys. Rev. B 1994, 49, 14–21. [Google Scholar] [CrossRef] [PubMed]
  23. Benzarti, Z.; Sekrafi, T.; Khalfallah, A.; Bougrioua, Z.; Vignaud, D.; Evaristo, M.; Cavaleiro, A. Growth temperature effect on physical and mechanical properties of nitrogen rich InN epilayers. J. Alloys Compd. 2021, 885, 160951. [Google Scholar] [CrossRef]
  24. Sakharova, N.A.; Pereira, A.F.G.; Antunes, J.M. Elastic Moduli of Non-Chiral Singe-Walled Silicon Carbide Nanotubes: Numerical Simulation Study. Materials 2022, 15, 8153. [Google Scholar] [CrossRef] [PubMed]
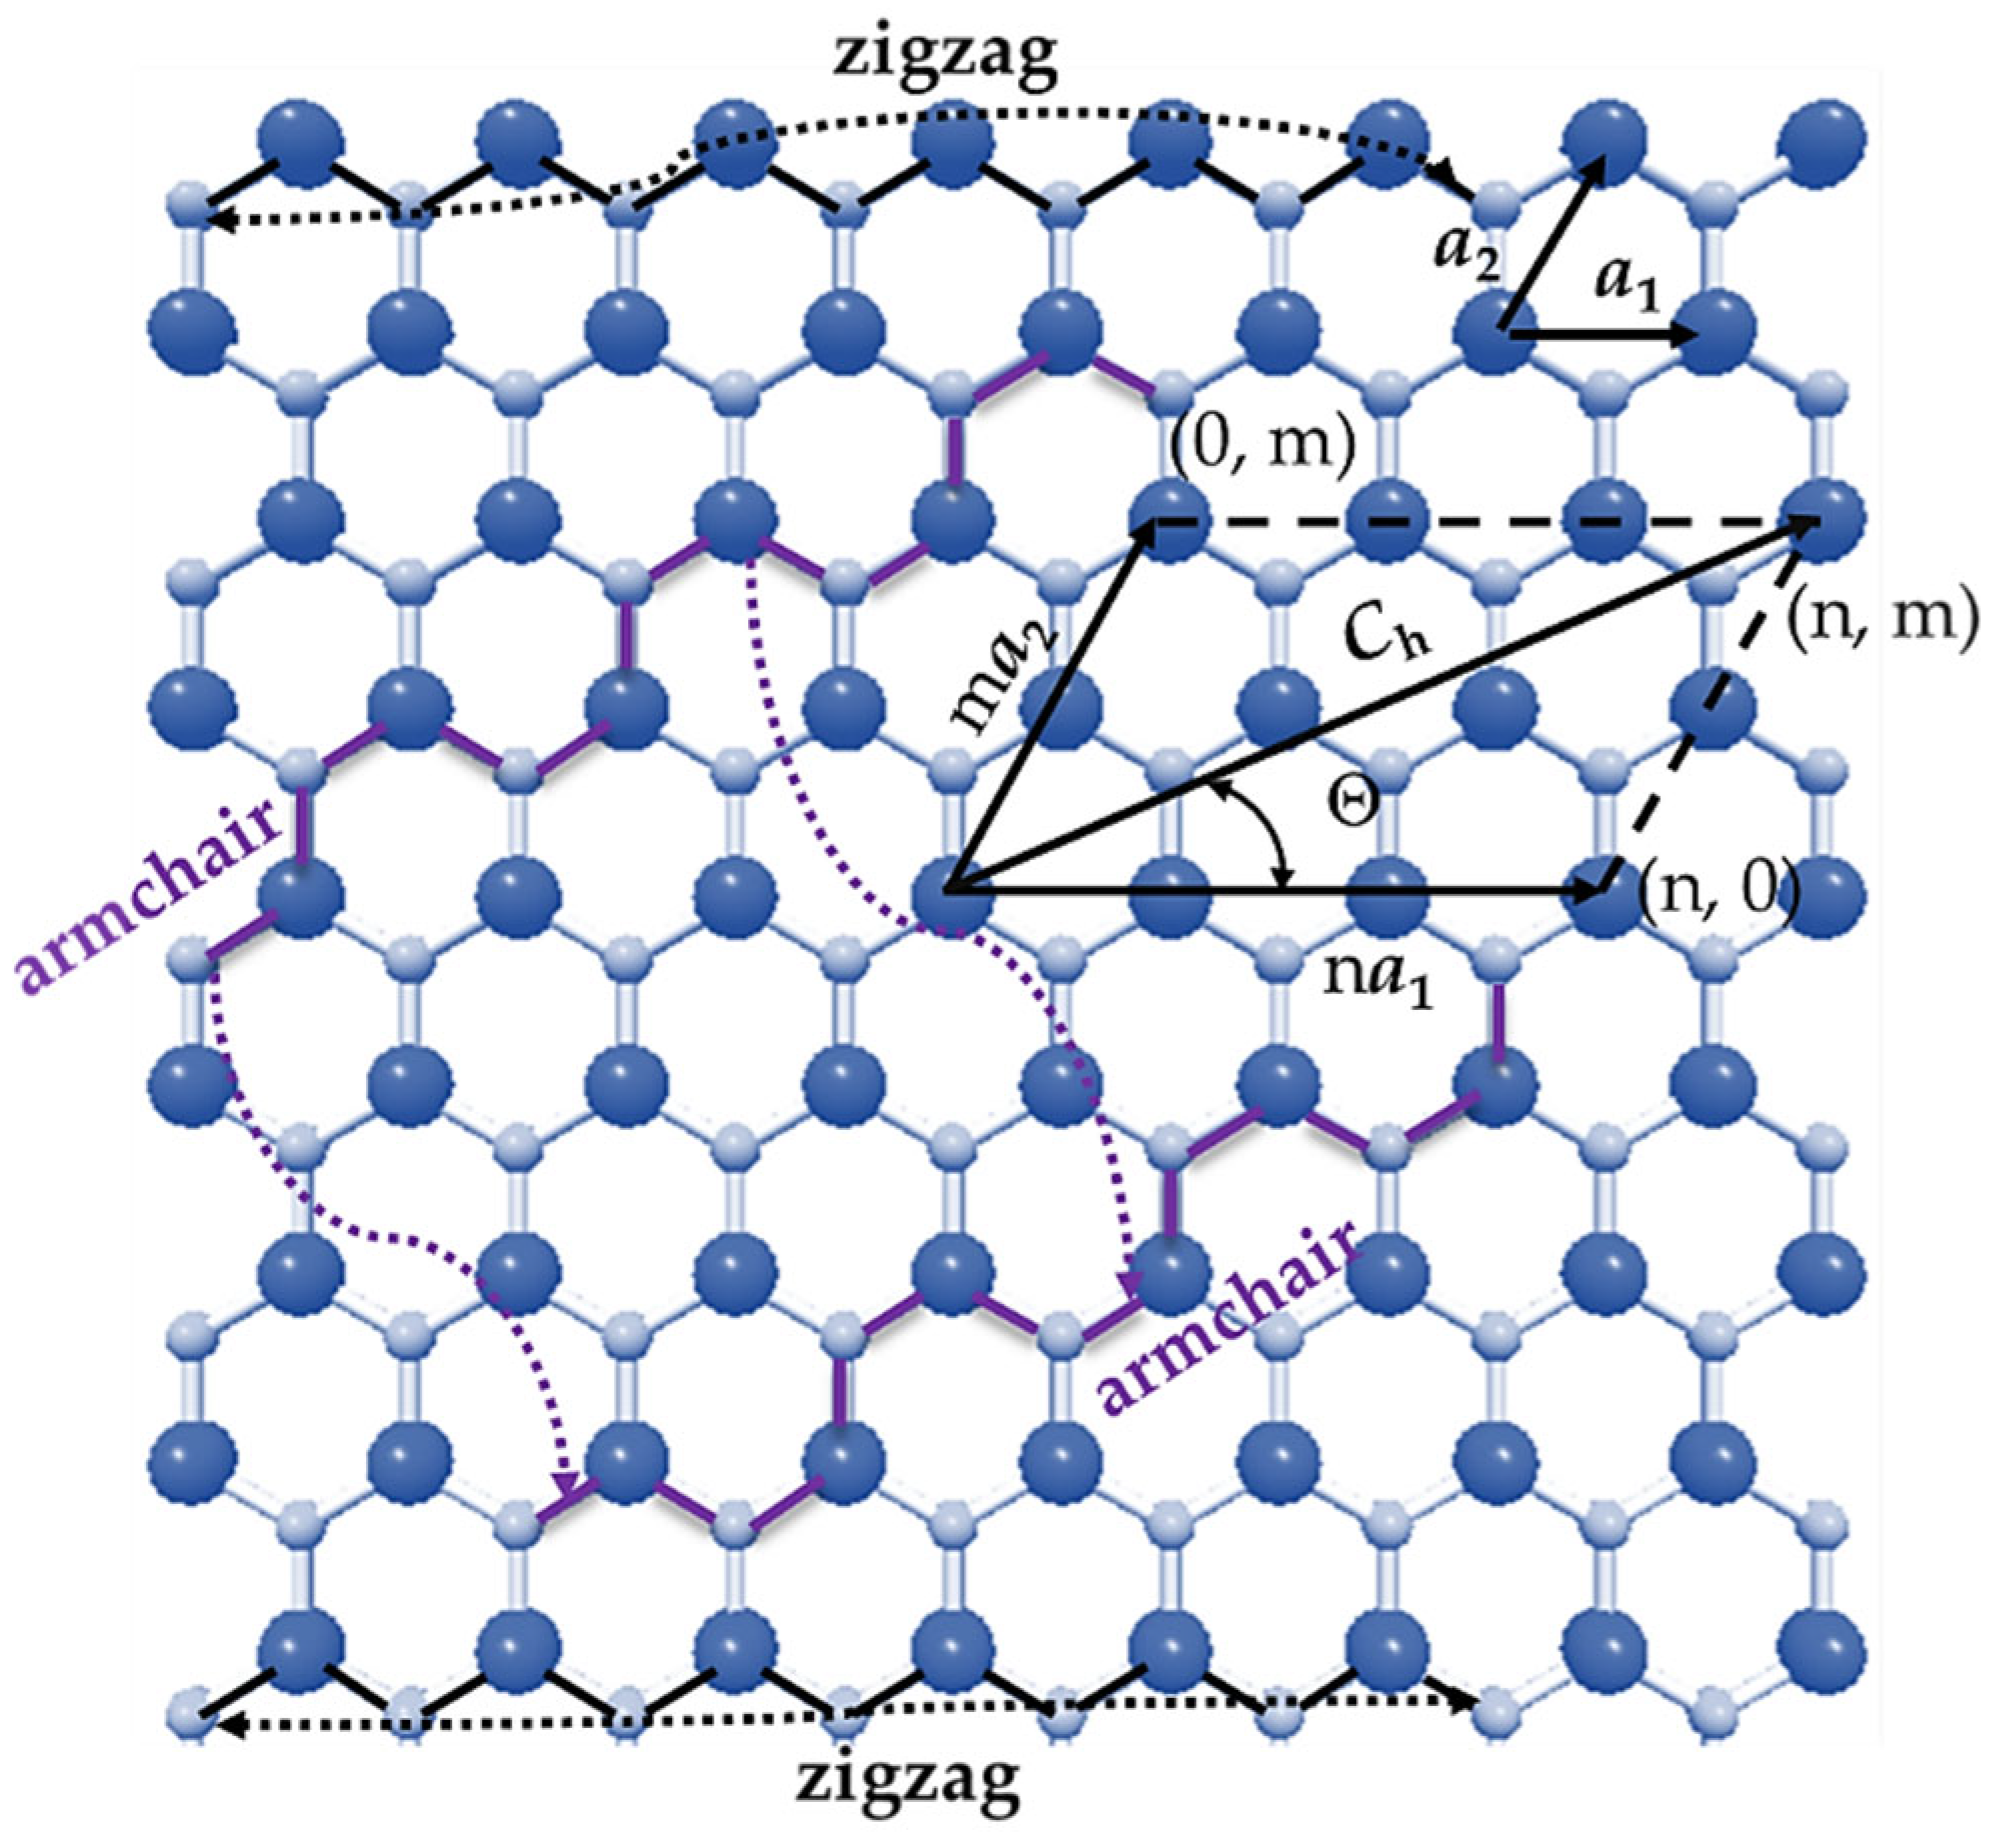
Figure 1. InN hexagonal sheet with definitions of the chiral vector, Ch, and the chiral angle, Θ, as well as the scheme for rolling up in zigzag and armchair nanotubes. In atoms are depicted in bright blue; N atoms in pale blue.
Metals 13 00073 g001
Figure 2. Configurations (15, 0) zigzag, (12, 6) chiral and (6, 6) armchair SWInNNTs, obtained using the software Nanotube Modeler©. In atoms are shown in bright blue; N atoms in pale blue.
Metals 13 00073 g002aMetals 13 00073 g002b
Figure 3. Equivalence between InN nanostructure bonding interactions and beam elements: (a) bond stretching; (b) pure tension of the beam; (c) bond bending; (d) pure bending of the beam; (e) dihedral torsion (right) and out-of-plane torsion or inversion (left); (f) pure torsion of the beam. In atoms are shown in bright blue; N atoms in pale blue.
Metals 13 00073 g003
Figure 4. Section of the InN nanostructure showing rij, rik and θ0. N atoms are represented in pale blue and In atoms are in bright blue.
Metals 13 00073 g004
Figure 5. Boundary and loading conditions for the InNNS of size 2 (see Table 3): (a) horizontal tension (zigzag configuration) and (b) vertical tension (armchair configuration). The geometrical parameters of NS are also shown.
Metals 13 00073 g005
Figure 6. Boundary and loading conditions for testing (11, 11) armchair SWInNNTs of: (a) Tension; (b) Bending; (c) Torsion.
Metals 13 00073 g006aMetals 13 00073 g006b
Figure 7. Surface Young’s moduli, E sx (zigzag) and E sy (armchair), of the InNNSs for the four sizes (Table 3) and the two cases of the input parameters (Table 2). The dash lines represent the average value of the respective surface Young’s modulus.
Metals 13 00073 g007
Figure 8. Comparison of the current surface Young’s moduli, E sx (zigzag direction) and E sy (armchair direction), for the InNNSs of Case 2, size 3, with those of Le [9]. The results obtained for NSs of similar size were chosen for comparison purposes.
Metals 13 00073 g008
Figure 9. Evolutions of: (a) tensile, EA, (b) bending, EI, and (c) torsional, GJ, rigidities as a function of the NT diameter, D n , for the SWInNNTs in Table 4.
Metals 13 00073 g009
Figure 10. Evolutions of: (a) tensile, EA, rigidity with D n and (b) bending, EI, and (c) torsional, GJ, rigidities with D n 3 for the SWInNNTs in Table 4.
Metals 13 00073 g010
Figure 11. Evolutions of the Young’s modulus, E, with D n , for SWInNNTs, considering the nanotube wall thicknesses, t n = 0.308 nm and 0.570 nm: (a) Case 1; (b) Case 2.
Metals 13 00073 g011
Figure 12. Evolutions of the surface Young’s modulus, E S , for SWInNNTs as a function of the nanotube diameter, D n , for Cases 1 and 2 of input parameters. The surface Young’s moduli, E sx and E sy , for InNNSs are also plotted for comparison purpose.
Metals 13 00073 g012
Figure 13. Evolutions of the surface shear modulus, G S , as a function of the NTs diameter, D n , for SWInNNTs.
Metals 13 00073 g013
Figure 14. Evolutions of the Poisson’s ratio, ν, as a function of the NT diameter, D n for SWInNNTs.
Metals 13 00073 g014
Table 1. k r , k θ and k τ force field constants for InN nanostructures.
Case k r ,   nN / nm k θ 1 ,   nN · nm / rad 2 k θ 2 ,   nN · nm / rad 2 k τ ,   nN · nm / rad 2
1 (UFF)2780.8220.5440.625
2 (DFT + MM)2830.3570.236
Table 2. Geometrical and elastic properties of the beams used as input parameters in FE simulations of InNNSs and InNNTs.
CaseDiameter,
d, nm
Formulation* Young’s Modulus,
Eb, GPa
Formulation* Shear Modulus,
Gb, GPa
Formulation * Poisson s   Ratio ,   ν b   Formulation
10.1983 d = 2 2 k θ 1 + k θ 2 k r 1856 E b = k r 2 l 2 π k θ 1 + k θ 2 849 G b = k r 2 k τ l 2 π k θ 1 + k θ 2 2 0.32 ν b = k r l 2   3 k θ 1 + k θ 2 k r l 2 + 9 k θ 1 + k θ 2
20.1294443246740.59
* The values were calculated for the beam length l = a In N = 0.206 nm.
Table 3. Geometry of the studied single-layer InN nanosheets.
SizeLx, nmLy, nmNumber of ElementsNumber of Nodes
12.852.88237170
25.715.15857594
317.1317.5083335626
428.5427.3821,56514,490
Table 4. Geometrical characteristics of the studied SWInNNTs.
NT Type(n, m)Θ° Diameter , D n ,   nm Length , L n ,   nm Number of ElementsNumber of Nodes
zigzag(6, 0)00.68120.811218816
(9, 0) 1.02231.3127451836
(12, 0) 1.36341.2048123216
(15, 0) 1.70452.3276355100
(18, 0) 2.04461.5910,7827200
(23, 0) 2.61278.2817,50311,684
(26, 0) 2.95389.4022,59415,080
(30, 0) 3.407102.3829,85019,920
(34, 0) 3.862115.3638,11425,432
(37, 0) 4.202126.4845,47330,340
chiral(4, 2)19.10.60120.81942632
(6, 3) 0.90131.3121061410
(8, 4) 1.20241.2037322496
(10, 5) 1.50252.3259703990
(12, 6) 1.80361.5984245628
(14, 7) 2.10378.2811,5927742
(18, 9) 2.70489.4019,06212,726
(20, 10) 3.005102.3823,28015,540
(24, 12) 3.606115.3633,48022,344
(26, 13) 3.906126.4839,54626,390
(28, 14) 4.20720.8145,52830,380
armchair(4, 4)300.70518.3816121080
(6, 6) 0.94027.2936242424
(7, 7) 1.40936.1349213290
(9, 9) 1.87946.4982175490
(11, 11) 2.11454.6612,0238030
(13, 13) 2.58464.4716,93911,310
(15, 15) 2.81982.4422,245148,50
(18, 18) 3.28990.6132,63421,780
(20, 20) 3.759108.5139,86026,600
(22, 22) 4.228118.3948,46632,340
Table 5. Fitting parameters   α InN , β InN and γ InN for SWInNNTs and mean difference between the EA, EI and GJ values evaluated with the aid of these parameters (Equations (30)–(32)) and the corresponding values acquired from the numerical simulation.
CaseFitting ParametersMean Difference, %
  α InN ,   nN / nm   β InN ,   nN / nm γ InN ,   nN / nm EA, nNEI, nN⋅nm2GJ, nN⋅nm2
1453.9656.7151.670.390.690.50
2321.6340.1429.290.470.820.53
Disclaimer/Publisher’s Note: The statements, opinions and data contained in all publications are solely those of the individual author(s) and contributor(s) and not of MDPI and/or the editor(s). MDPI and/or the editor(s) disclaim responsibility for any injury to people or property resulting from any ideas, methods, instructions or products referred to in the content.