Article

Hot Workability and Microstructural Evolution of Ti-5.5Al-5Mo-5V-2Nb-1Fe-1Zr Titanium Alloy Based on the Different Phase Zones during Plastic Deformation at High Temperatures

1
School of Materials Science and Engineering, Northwestern Polytechnical University, Xi’an 710072, China
2
Western Superconducting Technologies Co., Ltd., Xi’an 710018, China
3
National & Local Joint Engineering Laboratory for Special Titanium Alloy Processing Technologies, Xi’an 710018, China
4
Xi’an Key Laboratory of Special Titanium Alloy Processing and Simulation Technologies, Xi’an 710018, China
*
Authors to whom correspondence should be addressed.
Metals 2023, 13(1), 92; https://doi.org/10.3390/met13010092
Submission received: 3 December 2022 / Revised: 23 December 2022 / Accepted: 26 December 2022 / Published: 1 January 2023

Abstract

:
Hot workability and microstructural evolution of Ti-5.5Al-5Mo-5V-2Nb-1Fe-1Zr titanium alloy, which is also called Ti555211 titanium alloy, are investigated during compressive deformation at different temperatures and strain rates. It can be found that Ti555211 samples deformed at 750 and 850 °C comprised α and β phases, while Ti555211 samples deformed at 950 and 1050 °C consist of single β phase. When Ti555211 sample undergoes compressive deformation in the α + β phase region, microstructures of β phase vary more substantially than those of α phase, which means that plastic deformation of Ti555211 sample is governed by β phase. The process parameters are optimized by establishing processing maps based on dynamic material model. Ti555211 alloy generally possesses the better hot workability in the β phase zone. In the β phase zone of Ti555211 alloy, the best hot process area involves temperature range from 925 to 1025 °C and a strain rate range of 0.005 to 0.03 s−1.

1. Introduction

Titanium alloys act as a significant role in engineering fields of aerospace, nuclear power plant and biomedical application because they possess excellent corrosion resistance, high specific strength, outstanding thermal stability, good fatigue resistance, low elastic modulus and excellent biomedical compatibility [1,2,3,4]. According to the different phase compositions, titanium alloys are generally classified as α, β and α + β types. The microstructures of β titanium alloys comprise metastable β phase, where the addition of Mo, Cr and V elements leads to the stabilization of β phase and further results in the high melting point and the high strength of β titanium alloys. Furthermore, compared with titanium alloys of α and α + β, β titanium alloys possess higher plasticity and higher strength at room temperature [5]. When the content of elements for stabilizing β phase is slightly greater than the critical value in the titanium alloys, near-β titanium alloys are generated. Generally, near-β titanium alloys are a combination of the advantages of α + β and β titanium alloys and thus they possess high strength, outstanding hardenability, excellent tensile plasticity and high fracture toughness. Therefore, the near-β titanium alloys have been concerned extensively and they deal with Ti-10V-2Fe-3Al [6], Ti-55511 [7], Ti-5Al-2Sn-2Zr-4Mo-4Cr [8], Ti-13Nb-13Zr [9] and so on. Over the past few years, Western Superconducting Technologies Co., Ltd. (Xi’an, China) has developed a kind of new near-β Ti-5.5Al-5Mo-5V-2Nb-1Fe-1Zr (Ti555211) titanium alloy, which aims to possess high strength, high toughness, high hardenability as well as good compatibility of strength and plasticity and excellent compatibility of strength and toughness. In particular, Ti555211 titanium alloy possesses a tensile strength of 1300–1400 MPa and an elongation of 8% after experiencing solution treatment and aging and thus it possesses a good combination of mechanical properties as well as a considerable potential for engineering applications.
Hot working is an indispensable method that puts titanium alloys into engineering applications. In particular, hot working process plays an irreplaceable role in manufacturing some critical titanium alloy parts, such as wings and body frames, longerons, bone plates, stent and so on. Most titanium alloys can obtain high fracture toughness and high creep resistance after they experience hot working and subsequent heat treatment. In particular, hot working in α + β phase region contributes to enhancing the strength and plasticity of titanium alloys [10]. In addition, it is well known that hot working process parameters have an important impact on microstructural evolution of alloys and further they affect the mechanical properties of metal materials [11,12,13,14]. Ghosh et al. [15] investigated isothermal compressive deformation behavior of biomedical Ti-14C titanium alloy under the different conditions and they found that adiabatic shear bands are easily formed in the microstructures when Ti-14C alloy is subjected to deformation at low temperatures and high strain rates, whereas wedge cracks are easily generated at the grain boundaries when Ti-14C alloy undergoes deformation at high temperatures and low strain rates. Jin et al. [16] systematically investigated deformation behavior, mechanical properties and microstructural evolution of Ti-6.5Cr-4.5Sn-4.5Mo titanium alloy, which possesses tensile strength of 1305 MPa and total elongation of 13.4% by adjusting and controlling the microstructures of the alloy. Consequently, it is significant to investigate high-temperature deformation behavior and hot workability of Ti555211 alloy.
Dynamic materials model (DMM), which was developed by Prasad et al. [17], is a method to establish hot processing map of metal materials, which is further used for investigating hot workability of metal materials. Many researches have shown that hot processing map established according to DMM contributes to investigating hot workability of metal materials and further controlling the microstructures of metal materials in the course of hot working [18,19,20]. Especially, hot processing map based on DMM exhibits a high reliability in terms of the different metal materials. Zhang et al. [21] established processing map of 7A09 aluminum alloy on the basis of DMM and they optimized the processing parameters of the alloy during isothermal precision forging, where the high-quality forgings are obtained eventually. Majid et al. [22] established hot processing map of ECO-7175 aluminum alloy with various compositions based on DMM and they comparatively analyzed the influence of Cr element on the hot workability of the alloy. Chi et al. [23] established the hot processing map of Ni-based superalloy with a failure zone based on DMM, and they provided a good reference for obtaining the best hot working process window. Lei et al. [24] constructed hot processing maps based on DMM at various strains of Al-5Mg-3Zn-1Cu alloy, and distinguished the workable domains from the unstable domains. Ti555211 titanium alloy belongs to a new near-β titanium alloy and it acts as a promising candidate in the engineering fields. Therefore, it is of great significance to investigate the hot workability of Ti555211 alloy. An et al. established the processing maps at a strain rate ranging from 0.001 to 1.000 s−1 and deformation temperature ranging from 750 to 950 °C at strains of 0.3, 0.6 and 0.7, which lays the foundation for understanding the hot workability of Ti555211 alloy [25,26]. However, in the present study, plastic deformation behavior and hot workability of near-β Ti555211 alloy are systematically analyzed by combining high-temperature compressive test, microstructural characterization experiment and hot processing map based on DMM, where a higher strain rate, a higher deformation temperature and a larger plastic strain are selected by comparing with the work from An et al. [25,26]

2. Materials and Methods

In the current work, Ti555211 alloy of interest belongs to a near-β titanium alloy and it resulted from Western Superconducting Technologies Co., Ltd. Fractions of all the elements in the Ti555211 alloy were as follows: 80.6%Ti, 5.8%Al, 4.5%Mo, 5.3%V, 1.9%Nb, 1.0%Fe and 0.9%Zr. The as-received Ti555211 alloy bar was subjected to forging and subsequently it underwent homogenization annealing at 700 °C for 2 h, which was followed by cooling at atmosphere. Ti555211 alloy samples with diameter of 8 mm and height of 12 mm were obtained by means of wire electrical discharge machining. Subsequently, the involved cylindrical Ti555211 alloy specimens underwent uniaxial compressive test on the Gleeble3800 test machine by deformation degree of 60% at strain rates of 0.005, 0.05, 0.5 and 5 s−1 and temperatures of 750, 850, 950 and 1050 °C, respectively. In consideration of the effect of the friction between the edges of the compressive samples and the dies on the true stress-true strain curves, Ti555211 specimens used for compressive test were lubricated by graphite during compressive deformation [27,28]. The compressed Ti555211 specimens were quenched into water at room temperature after the compressive test was completed in order to retain high-temperature deformation microstructures of compressed Ti555211 samples. EBSD (Electron Backscattered Diffraction) experiment was used for characterizing the microstructures of the involved compressed Ti555211 samples. Before EBSD experiment, the involved samples for EBSD observation underwent electrolytic polishing by means of electrolyte, which consists of 10% perchloric acid and 90% alcohol, where polishing temperature was chosen as 20 °C and polishing time was determined as 60 s. In addition, the Ti555211 samples compressed at a strain rate of 5 s−1 and temperatures of 750, 850, 950 and 1050 °C, respectively, were used for TEM (Transmission Electron Microscope) observation by FEI TECNAI F200X. Furthermore, according to the true stress–strain data from high-temperature compressive experiment, hot processing maps of Ti555211 alloy corresponding to true strains of 0.3, 0.6 and 0.9, respectively, were established using DMM.

3. Results and Discussion

3.1. Establishing Processing Map of Ti555211 Alloy

Figure 1 shows true stress–strain curves of Ti555211 alloy at the various deformation temperatures and strain rates [29]. It can be found from Figure 1 that during hot working of Ti555211 alloy, flow stress rises with reducing temperature and it declines with a reducing strain rate. This means that Ti555211 alloy is sensitive to strain rate during compression at high temperatures. True stresses corresponding to true strains of 0.3, 0.6 and 0.9, respectively, are extracted from true stress–strain curves of Ti555211sample to establish processing map of Ti555211sample, as demonstrated in Table 1.
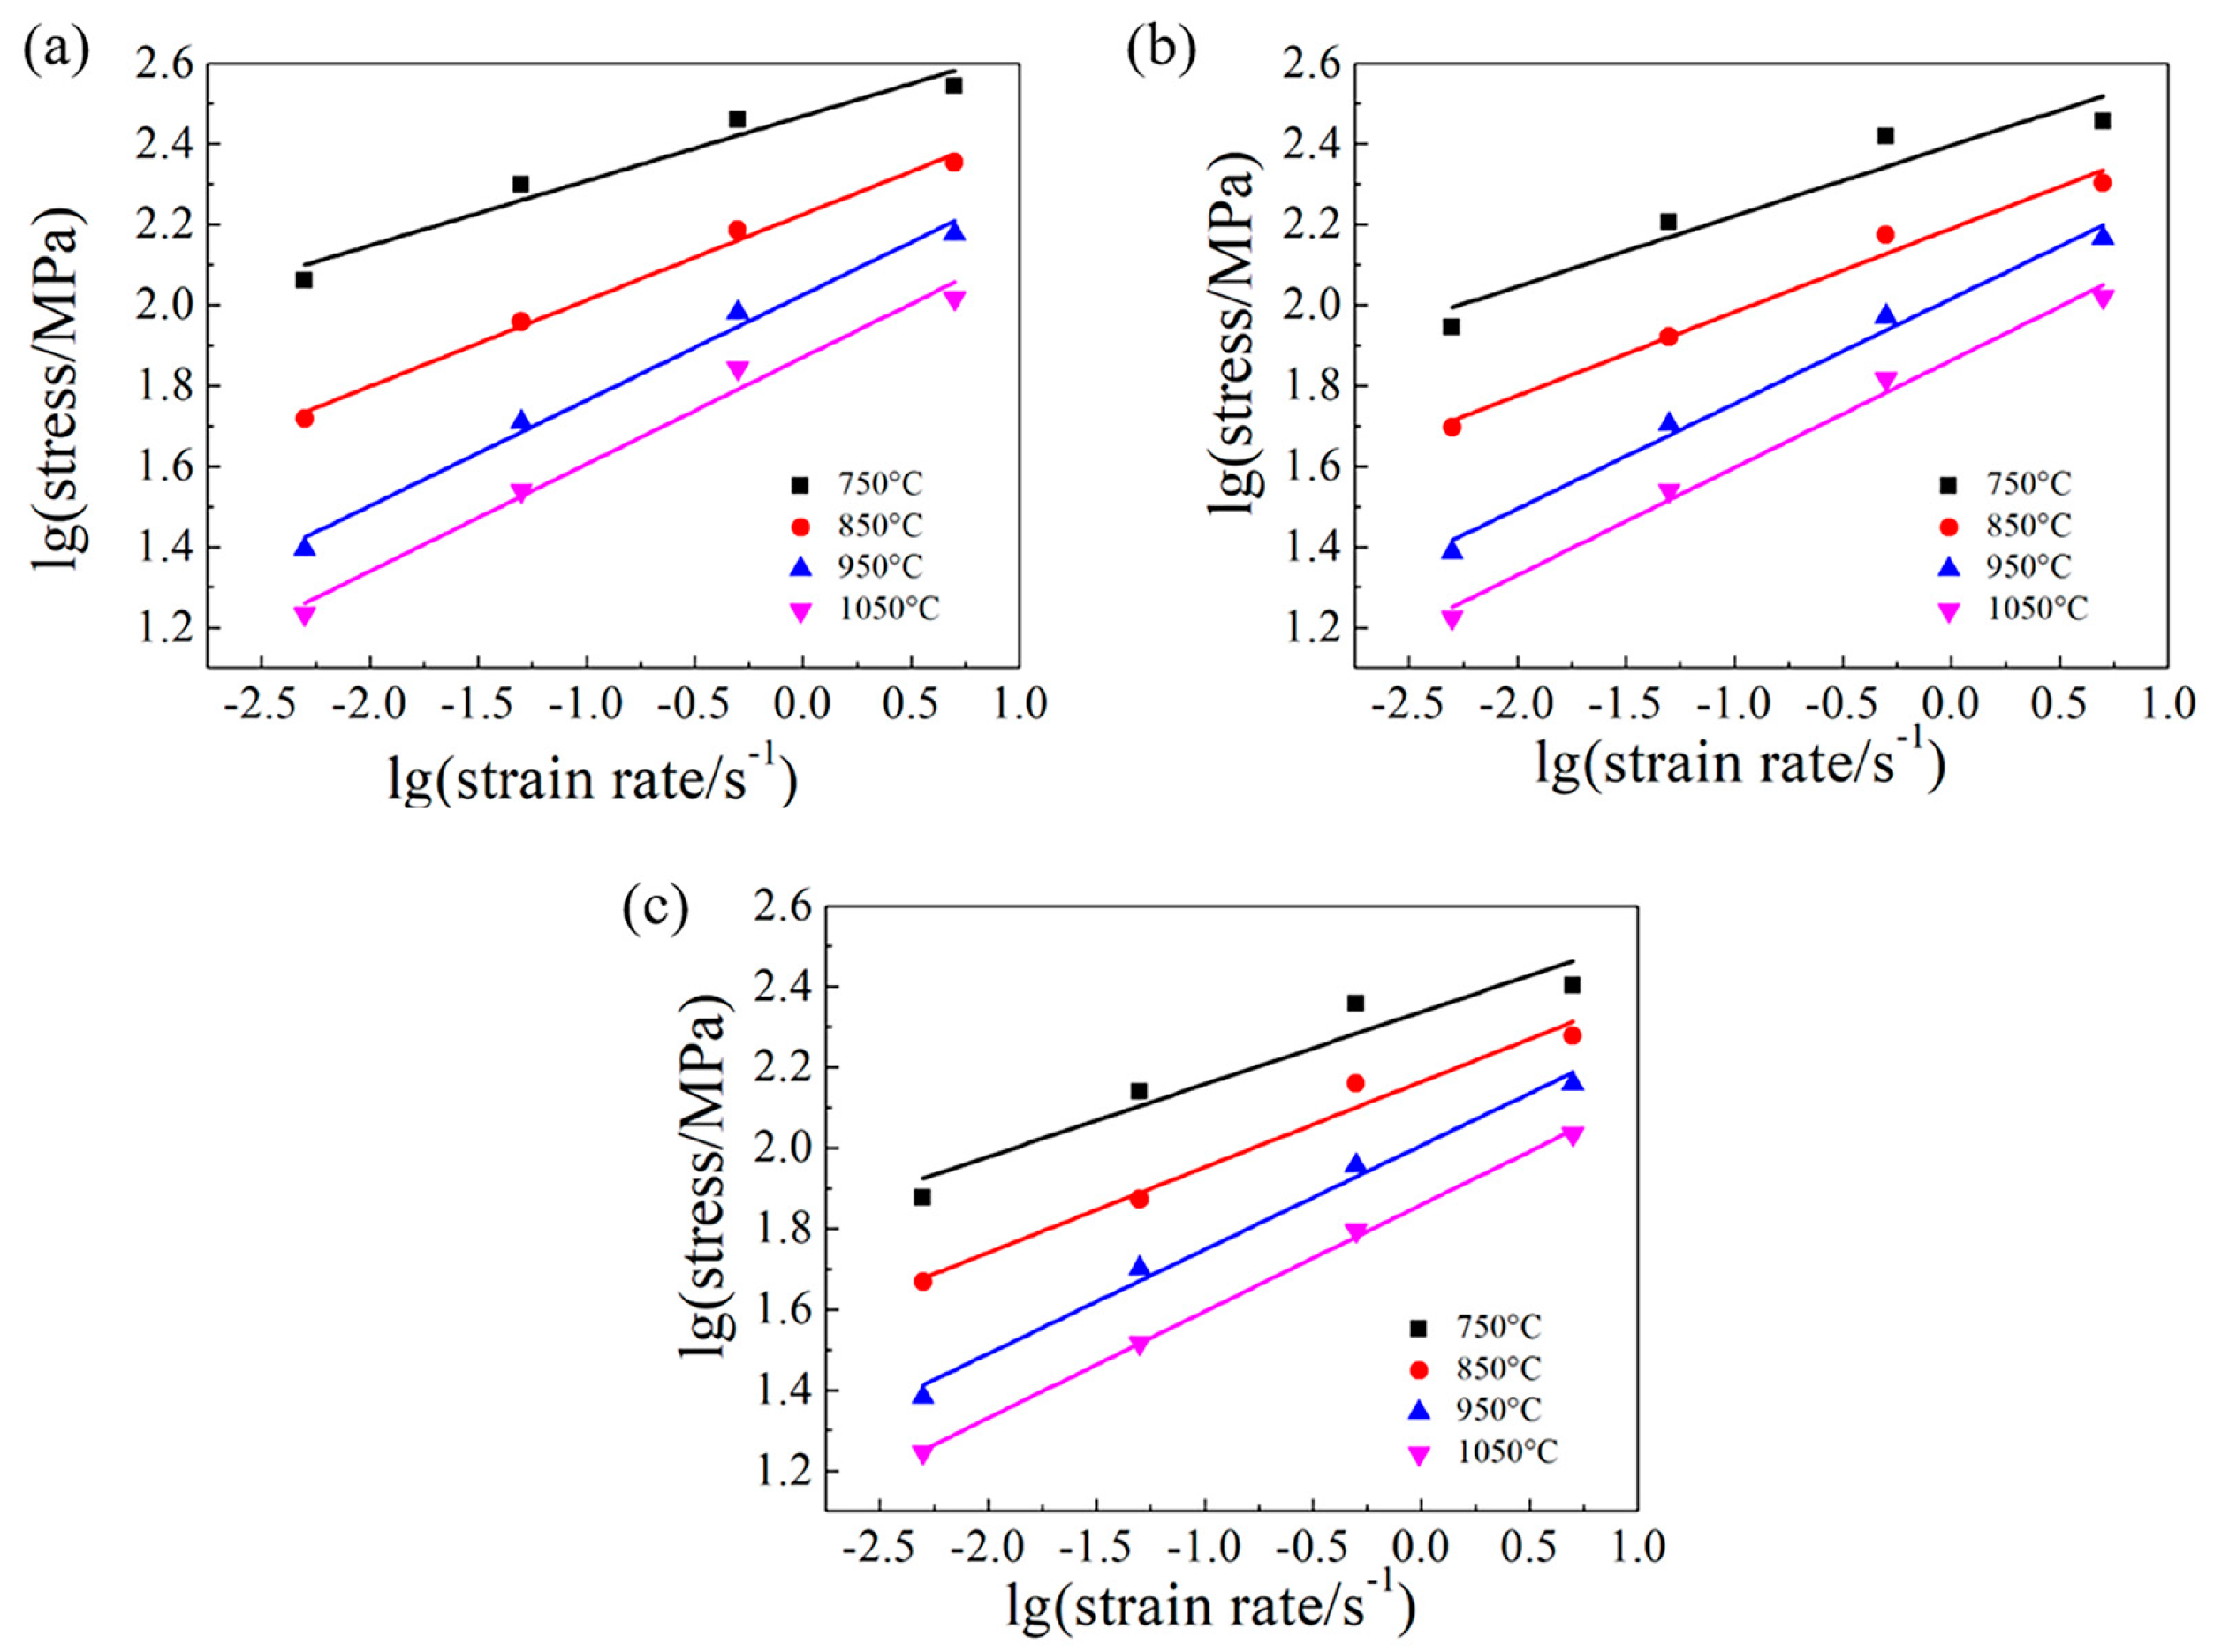
According to the stress and strain data in Table 1, the linear fitting between lg σ and lg ε ˙ is performed in the case of the various strains, as illustrated in Figure 2. It can be found in Figure 2 that lg σ shows an obvious linear dependence on lg ε ˙ during compressive deformation of Ti555211 samples at high temperatures. Therefore, DMM is used for analyzing hot workability of Ti555211 alloy.
During hot processing of Ti555211 samples, it can be viewed as a nonlinear power dissipation system, namely
P = σ ε ˙ = 0 ε ˙ σ d ε ˙ + 0 σ ε ˙ d σ = G + J
where P is the dissipation power, which is composed of the dissipated content G and the dissipated co-content J , and σ and ε ˙ represent flow stress (MPa) and strain rate ( s 1 ) of Ti555211 sample during compressive deformation at elevated temperature, respectively. In general, G results from plastic deformation of Ti555211 alloy, and J is attributed to microstructural evolution of Ti555211 sample during compressive deformation.
For a given strain and a constant temperature, the relationship between flow stress and strain rate is expressed as follows.
σ = C ε ˙ m
where C is material constant at a given stress and m is strain rate sensitivity exponent. Simultaneously, according to m, the proportion of J to G is obtained as follows.
m = J G = ε ˙ d σ σ d ε ˙ = ln σ ln ε ˙ ε , T
Combining Equations (1) and (2) leads to
J = 0 σ ε ˙ d σ = m m + 1 σ ε ˙
In the case of an ideal linear dissipation, m is set as 1, and J can achieve to the maximum value, namely J max = 0.5 σ ε ˙ . However, the value of m ranges 0 to 1 during genuine hot processing of Ti555211 alloy. Therefore, the ratio of the real dissipated co-content J to the ideal dissipated co-content J max is defined as power dissipation efficiency η , namely
η = J J max = 2 m m + 1
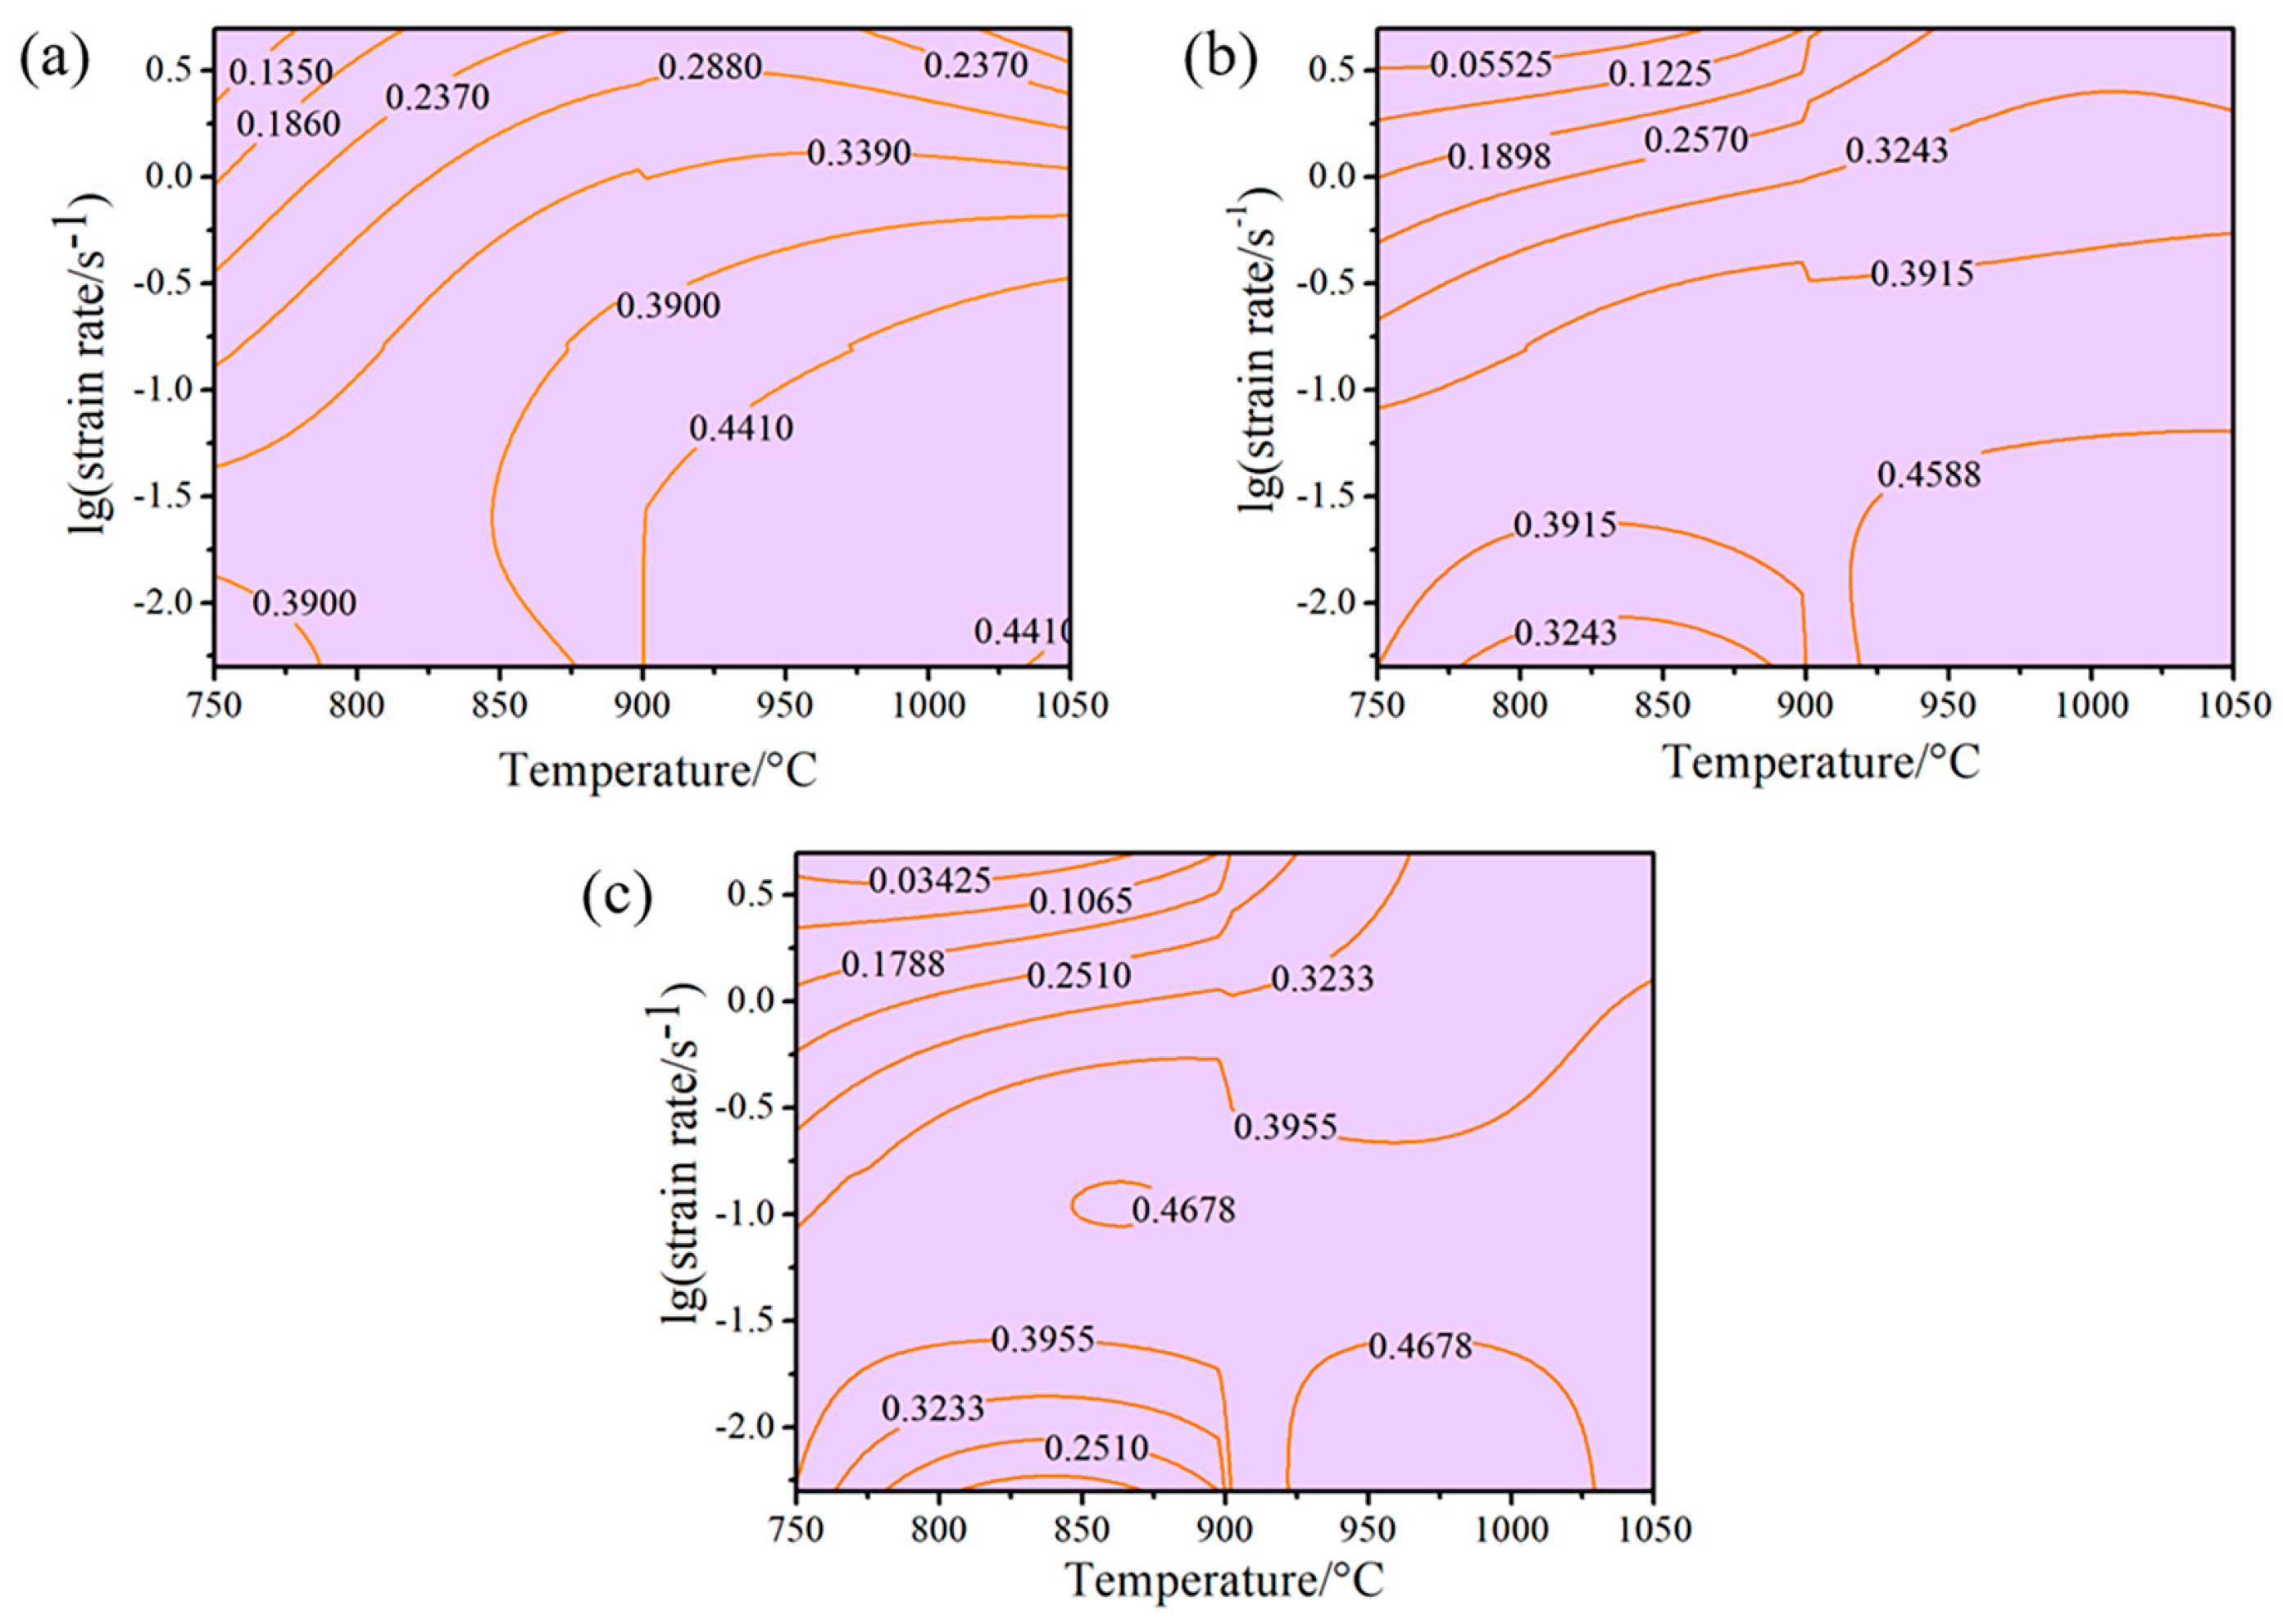
According to the aforementioned analysis, power dissipation efficiency η is solved according to m. Therefore, the power dissipation map is further acquired, as shown in Figure 3. It can be found from Figure 3a–c that all the values in the figures represent the ones of power dissipation efficiency corresponding to true strains of 0.3, 0.6 and 0.9, respectively. Deformation mechanisms of Ti555211 alloy are revealed based on the magnitude of power dissipation efficiency η . It can be generally accepted that dynamic recovery is responsible for microstructural evolution of metal materials when the power dissipation efficiency η ranges from 0.2 to 0.3, whereas microstructural evolution of metal materials is dominated by dynamic recrystallization when the power dissipation efficiency η ranges from 0.3 to 0.5. In addition, too small η value means that some defects are induced in the microstructures during plastic deformation of metal materials [30,31]. Furthermore, it can be found from Figure 3 that the maximum value of η is 0.4678, which appears at the strain of 0.9. Especially, the zone where the value of η is higher than 0.3955 at the strain of 0.9 is slightly greater than those at the strains of 0.3 and 0.6. The phenomenon indicates that hot workability of Ti555211 alloy is enhanced considerably with the increase of strain.
In addition, it can be found that power dissipation efficiency η presents a similar regularity in the case of the various strains. For the lower temperatures and the higher strain rates, power dissipation efficiency η possesses the smallest value. Furthermore, the power dissipation efficiency η increases with increasing temperature as well as a decreasing strain rate. In particular, for the smaller strain rate, the magnitude of power dissipation efficiency η presents a certain fluctuation with increasing temperatures, where power dissipation efficiency η possesses the largest value in the temperatures ranging from 925 to 1025 °C.
The instability maps reflect the distribution of the instability parameter ξ ε ˙ in the case of the various temperatures and strain rates, where instability parameter ξ ε ˙ is solved by means of the following equation [32]:
ξ ε ˙ = ln m / m + 1 ln ε ˙ + m
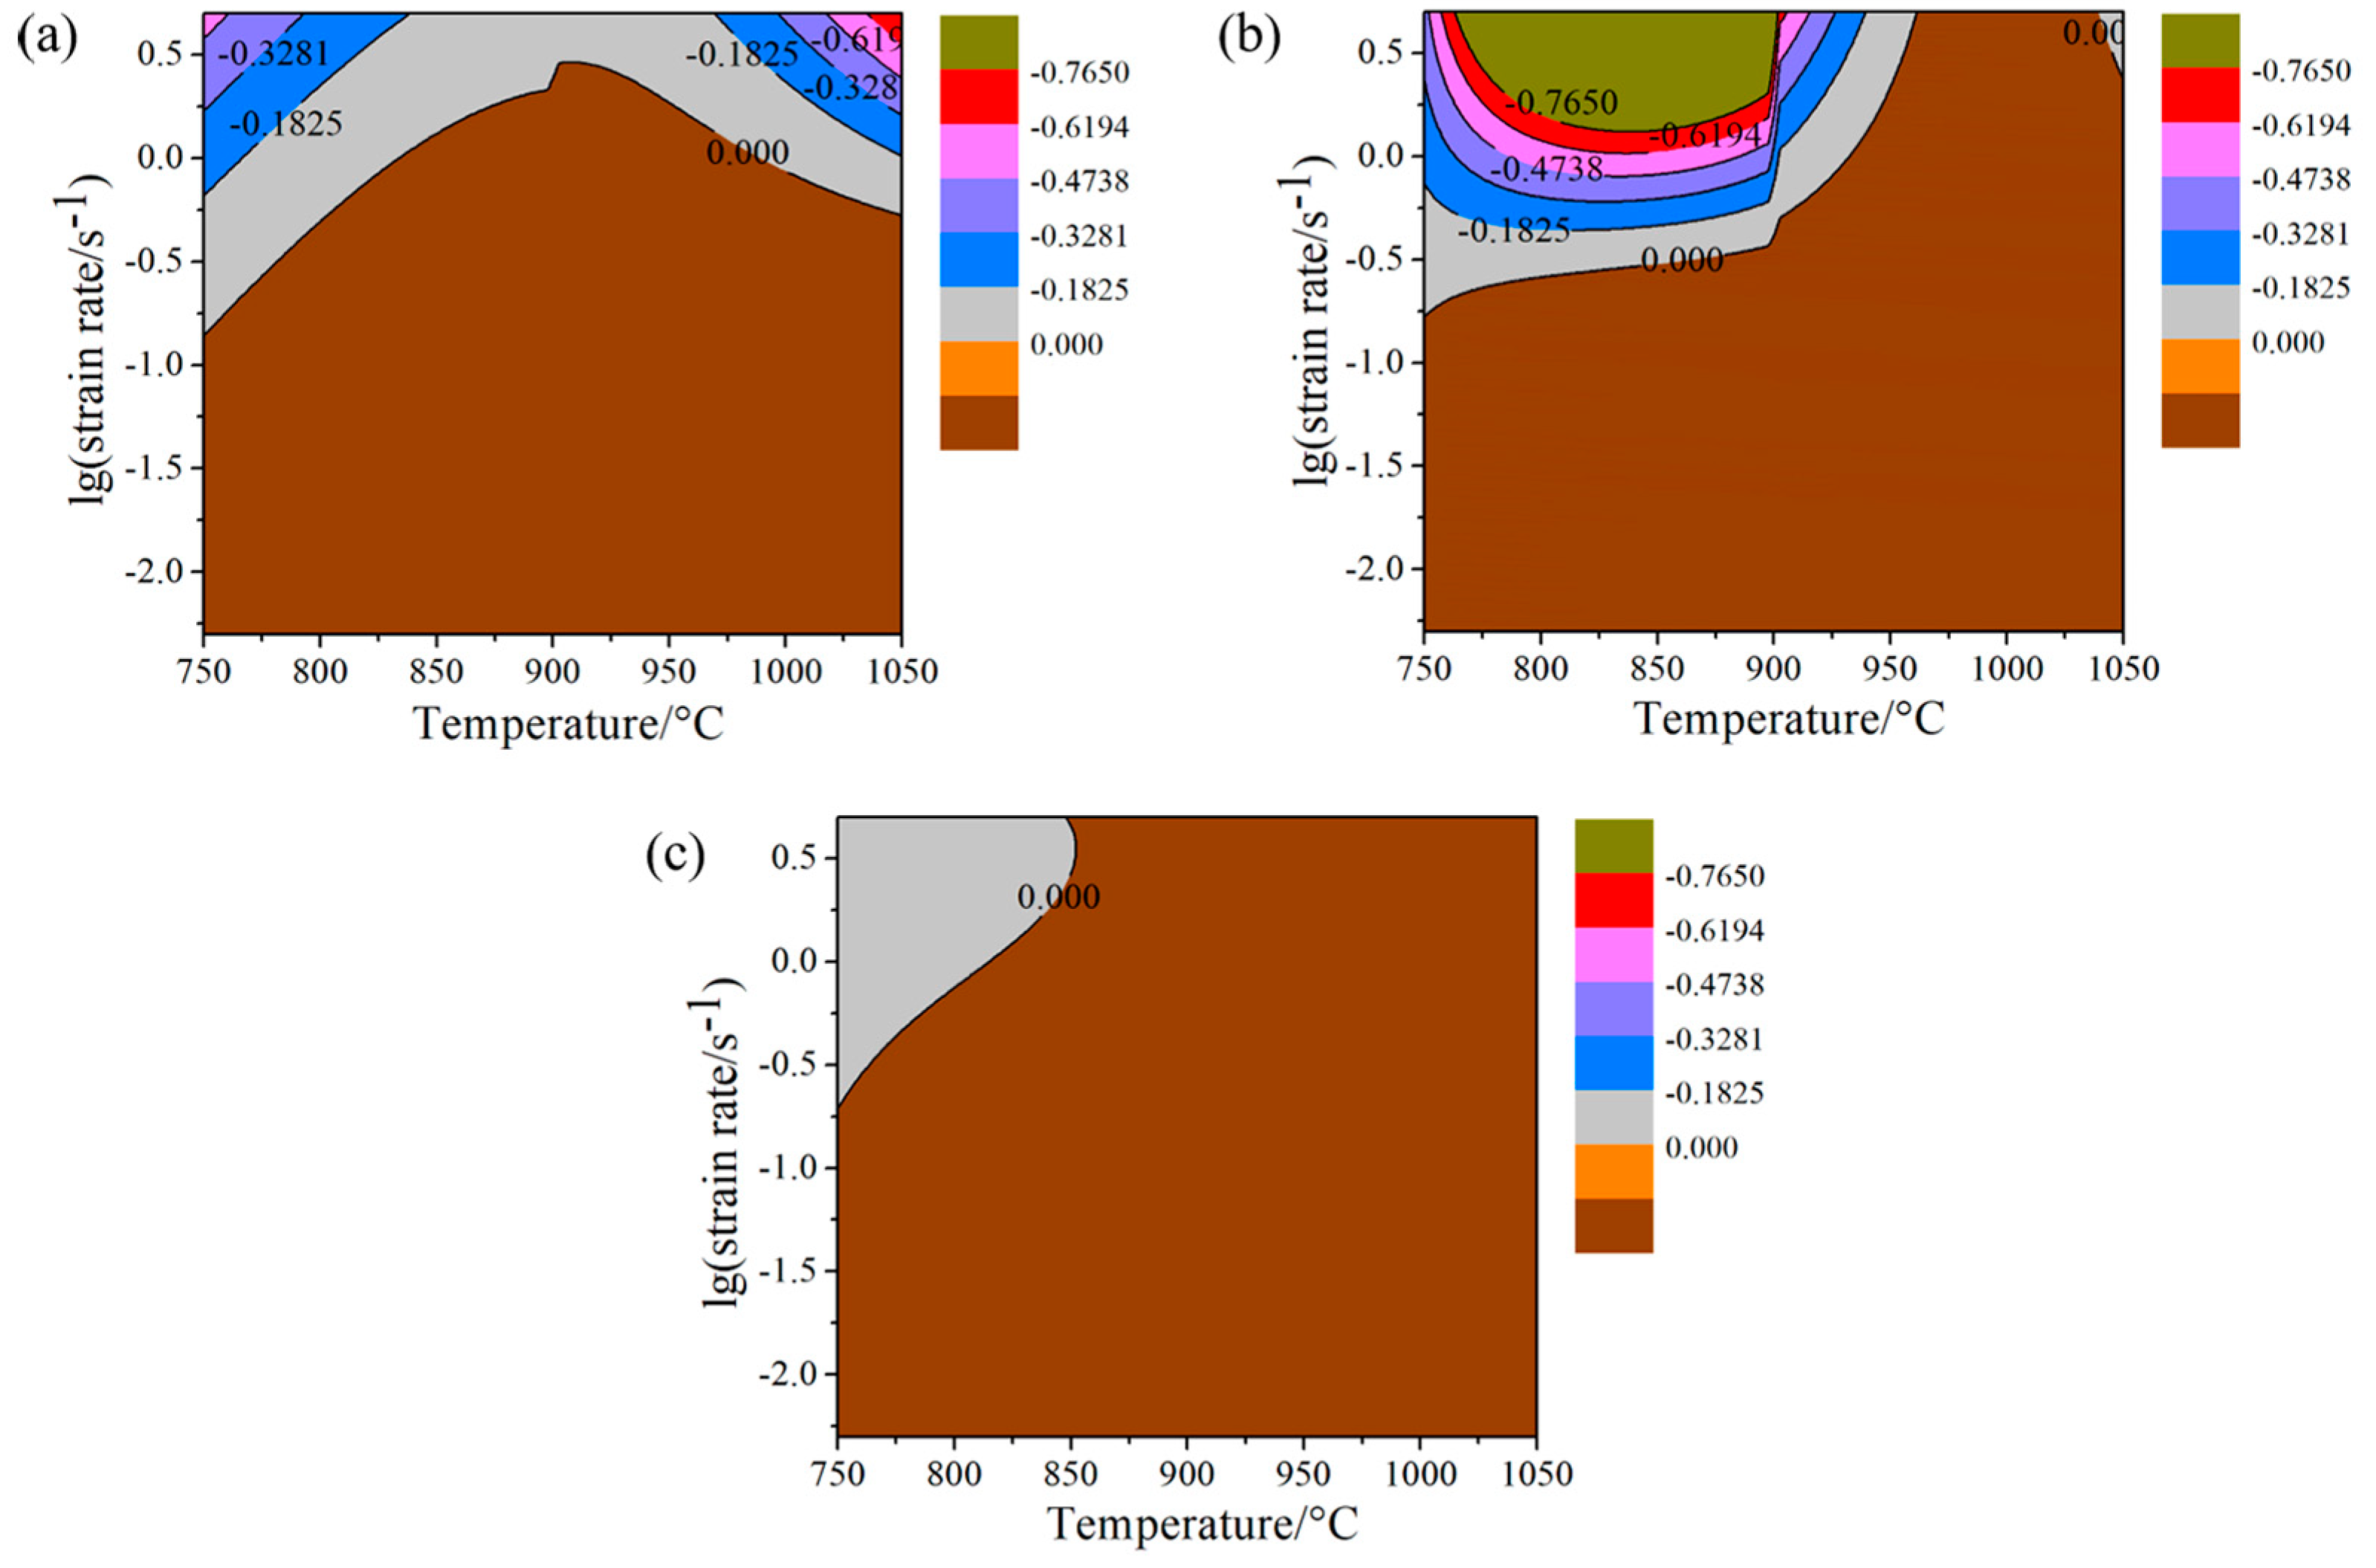
where m is the strain rate sensitivity exponent. The instability maps of Ti555211 alloy are illustrated in Figure 4, where the values on the lines represent the ones of the instability parameter ξ ε ˙ . The instability phenomenon takes place during hot processing of Ti555211 alloy when the value of the instability parameter ξ ε ˙ is less than zero. In addition, it can be noted from Figure 4 that the instability phenomenon mainly occurs at a high strain rate during hot processing of Ti555211 alloy, where the instability situation is gradually weakened with increasing temperatures. Furthermore, during hot processing of Ti555211 alloy, the area of instability zone declines with increasing strain, which indicates that hot workability of Ti555211 alloy is further improved with the increase of the strain.
According to power dissipation maps and instability maps, processing map is constructed to directly observe hot workability of Ti555211 sample, as shown in Figure 5. The processing maps cover a temperature range from 750 to 1050 °C, where the dual-phase region of α + β is on the left side of the red dotted line and the single-phase region of β is on the right side of the red dotted line because experimental measure shows that the phase transformation temperature of Ti555211 alloy is approximately 875 °C. The values on the lines in Figure 5 represent the power dissipation efficiency η during hot processing of Ti555211 alloy, where the purple shaded areas stand for the instability zones, whereas the other areas stand for the stability zones that are suitable for hot processing. It is generally accepted that the higher values of the power dissipation efficiency η correspond to deformation temperatures and strain rates, which contributes to hot processing of Ti555211 alloy [33]. It is noted in Figure 5 that peak values of power dissipation efficiency η in Ti555211 alloy are mainly located in the single phase β zone. In particular, in the processing map corresponding to strain of 0.9, the peak values of the power dissipation efficiency η occur simultaneously in α + β phase region and single β phase region of Ti555211 alloy, whereas the peak value zone is larger in single β phase region. In other words, Ti555211 alloy generally possesses the better hot workability in single β phase region.
In the present study, the processing map corresponding to the strain of 0.9 is selected as subsequent research object in order to further optimize hot workability of Ti555211 alloy in the case of the higher strain and validate the accuracy of the involved processing maps, as shown in Figure 5c. It can be found from Figure 5c that in α + β phase region, peak value of power dissipation efficiency covers a temperature range from 850 to 880 °C as well as a strain rate range from 0.08 to 0.15 s−1. However, in single β phase zone, peak value of power dissipation efficiency covers a temperature range from 925 to 1025 °C as well as a strain rate range from 0.005 to 0.03 s−1. In other words, in single β phase zone of Ti555211 alloy, the best hot process area is in temperature range from 925 to 1025 °C as well as a strain rate range from 0.005 to 0.03 s−1. However, in α + β phase zone, peak value of power dissipation efficiency covers a narrower temperature range, which is located near the phase transformation temperature. Therefore, the dual-phase region of α + β is not considered generally in the real hot processing. If Ti555211 alloy needs to be subjected to hot processing in α + β phase zone, the appropriate process parameters should be selected in the second peak value of power dissipation efficiency according to real situation.

3.2. Microstructural Evolution of Ti555211 Alloy

3.2.1. Microstructures of Ti555211 Alloy with Dual Phases

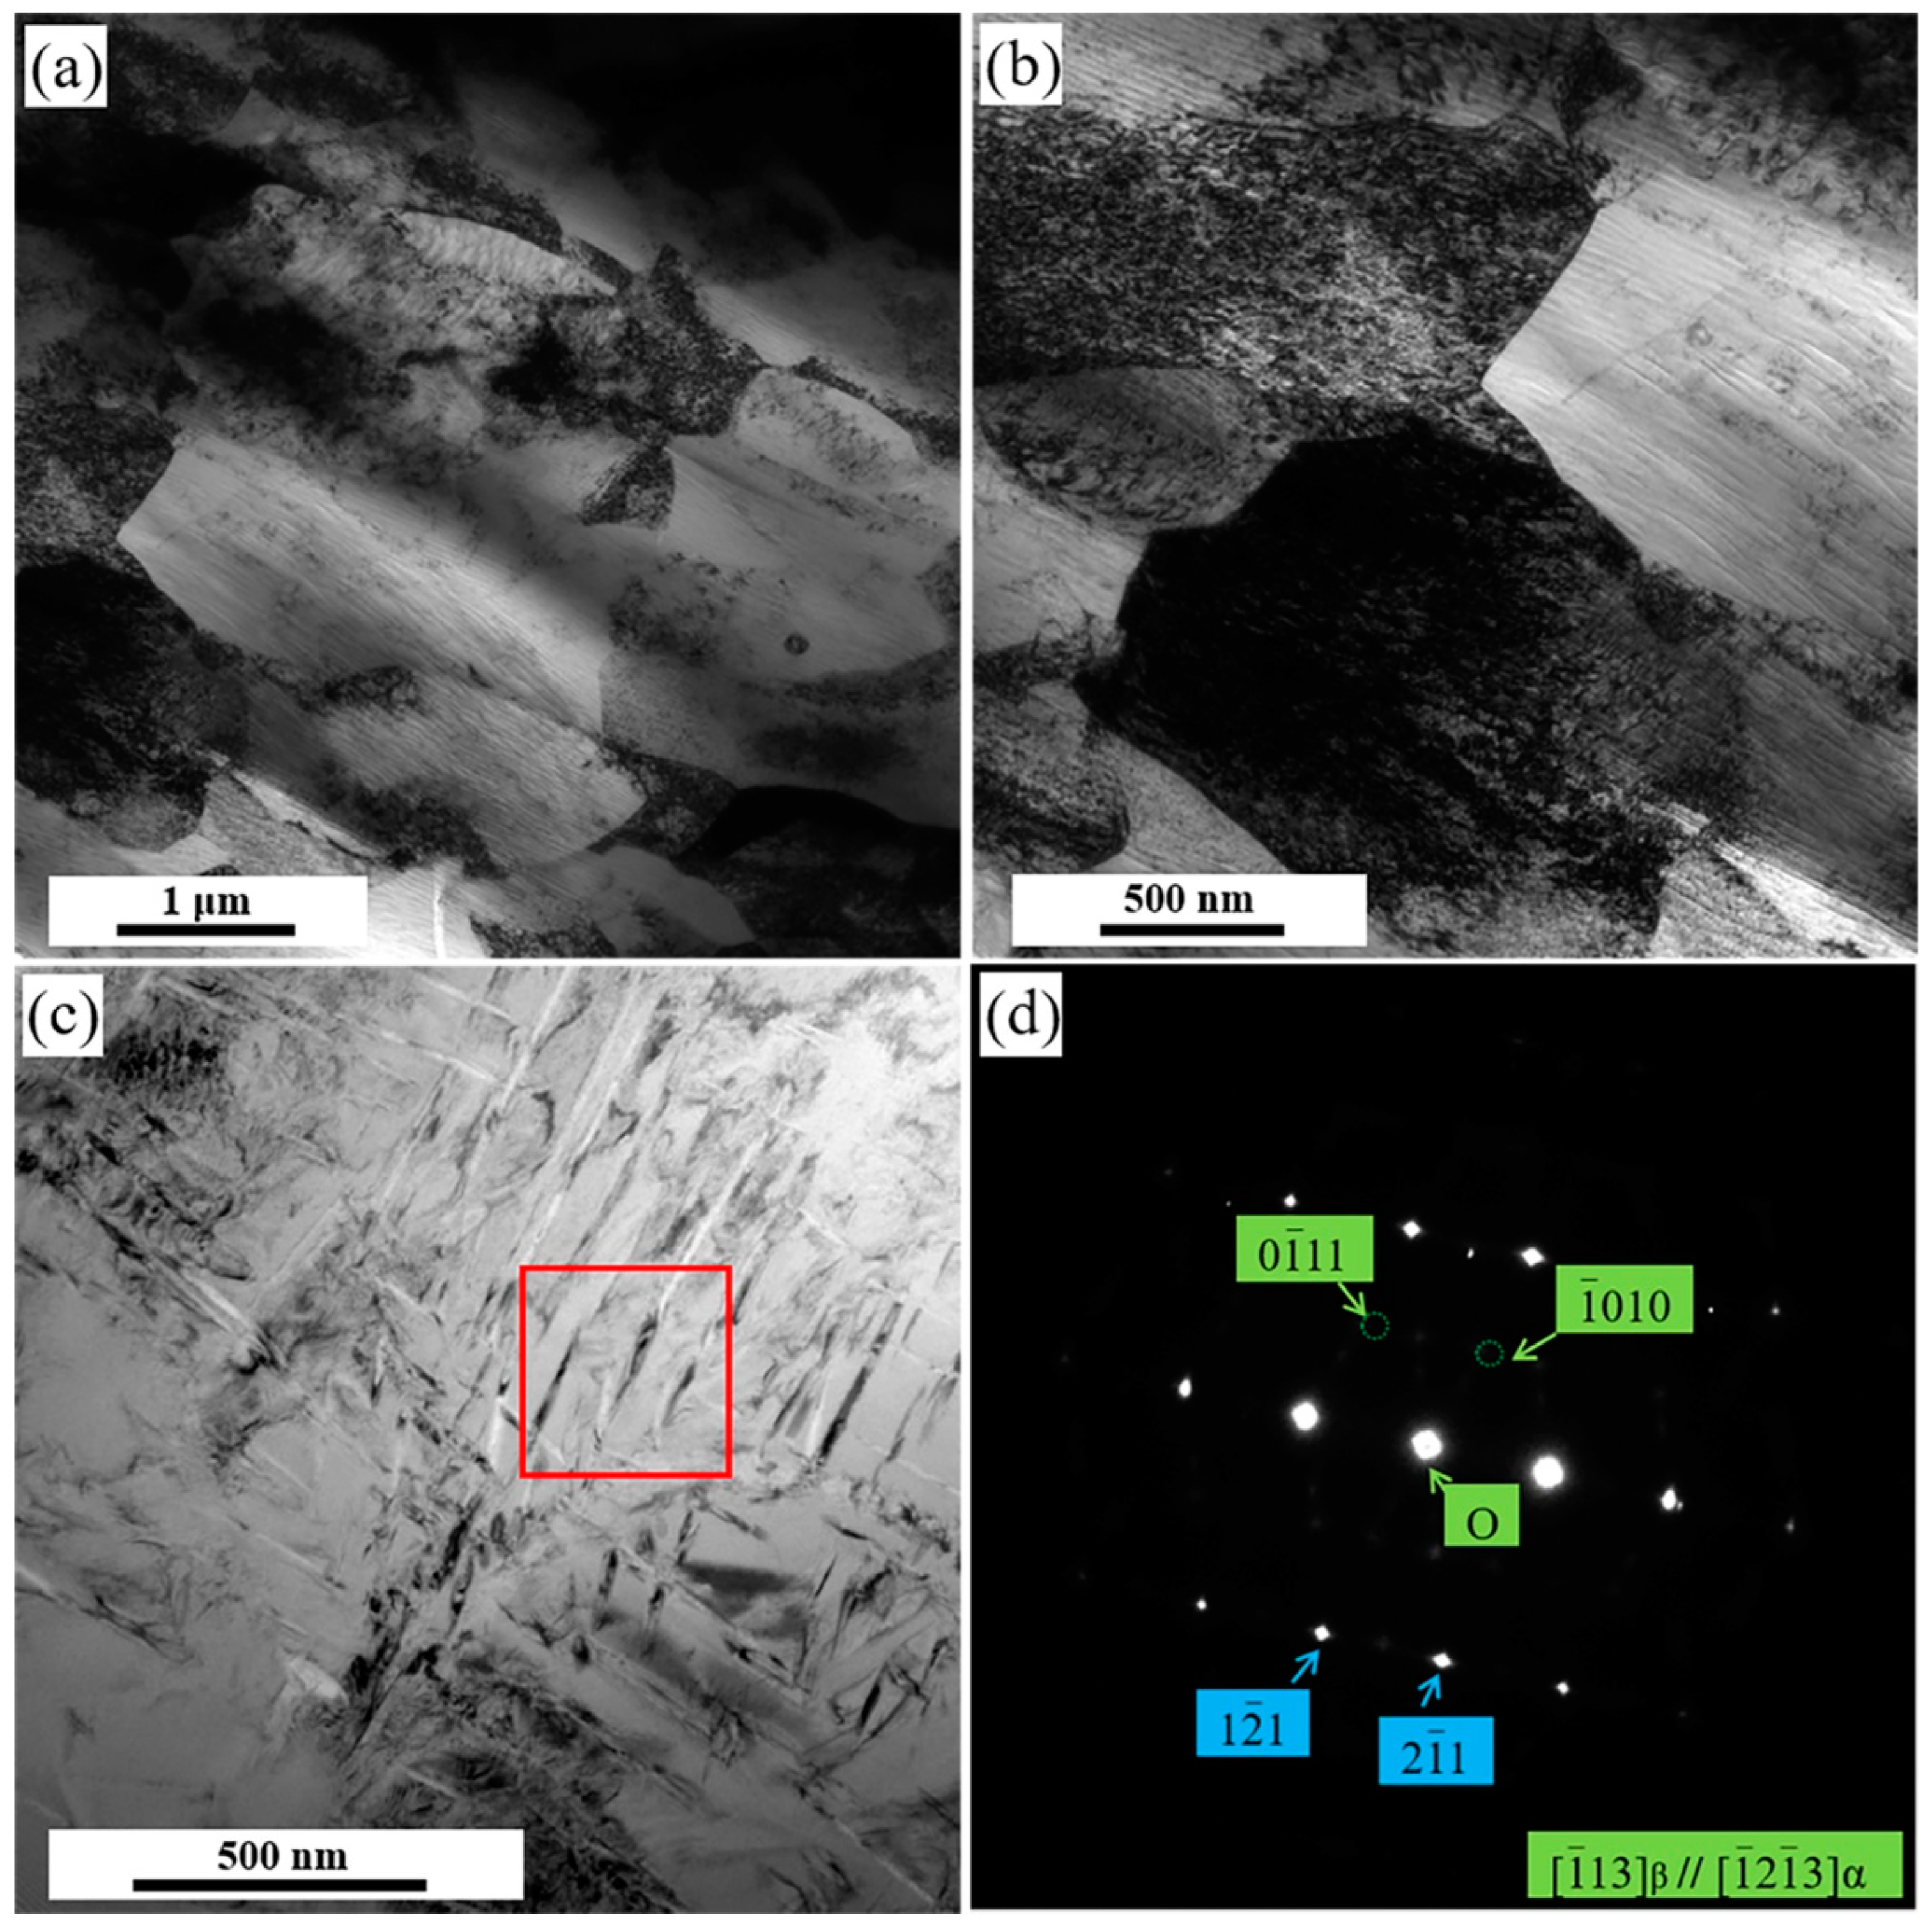
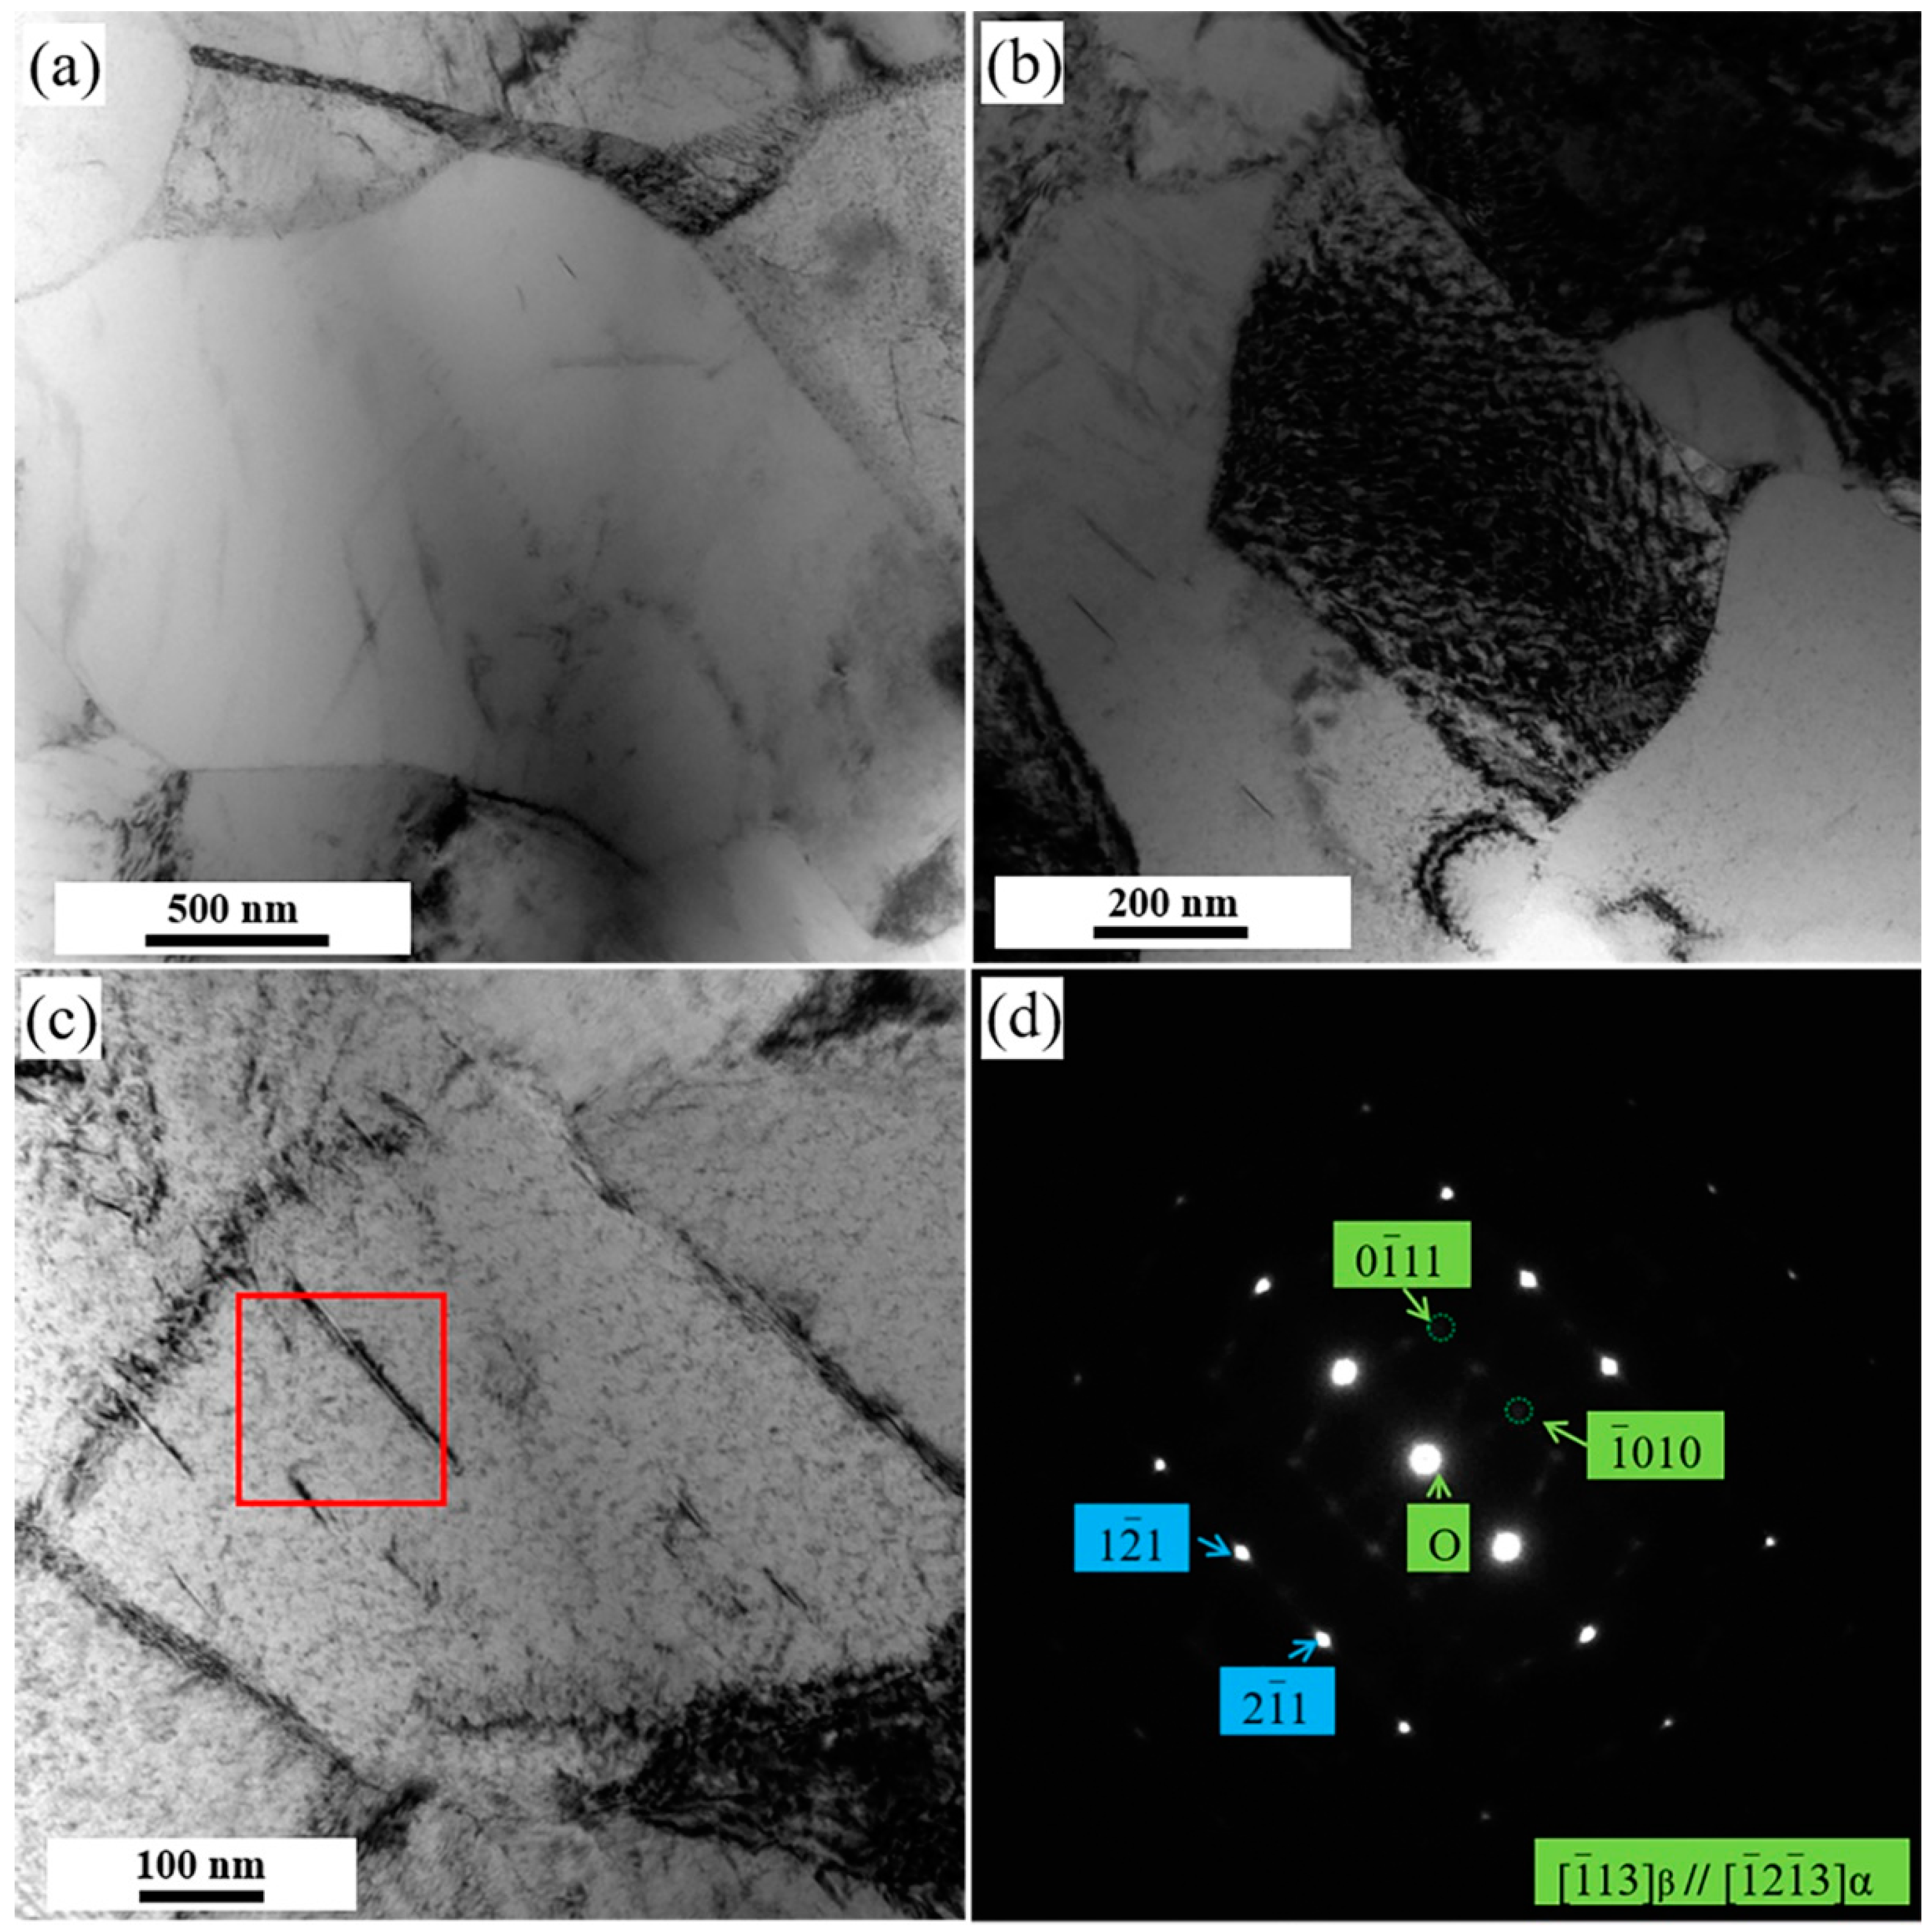
Figure 6 shows TEM micrographs of Ti555211 sample deformed at 750 °C and a strain rate of 5 s−1. It can be found from Figure 6 that the deformed Ti555211 alloy sample consists of α and β phases. In particular, it can be observed that a high density of dislocations appear in a few grains, which means that the grains are subjected to plastic deformation at 750 °C, whereas dynamic recovery or dynamic recrystallization does not eliminate the dislocations in the grains.
Figure 7 indicates TEM micrographs of Ti555211 alloy deformed at 850 °C and a strain rate of 5 s−1. Similar to Ti555211 sample deformed at 750 °C, α and β phases are observed in Ti555211 alloy deformed at 850 °C. In the same manner, it can be observed that plenty of dislocations are observed in a few grains. This indicates that the grains are subjected to plastic deformation at 850 °C, whereas dynamic recovery or dynamic recrystallization does not eliminate the dislocations in the grains as well.
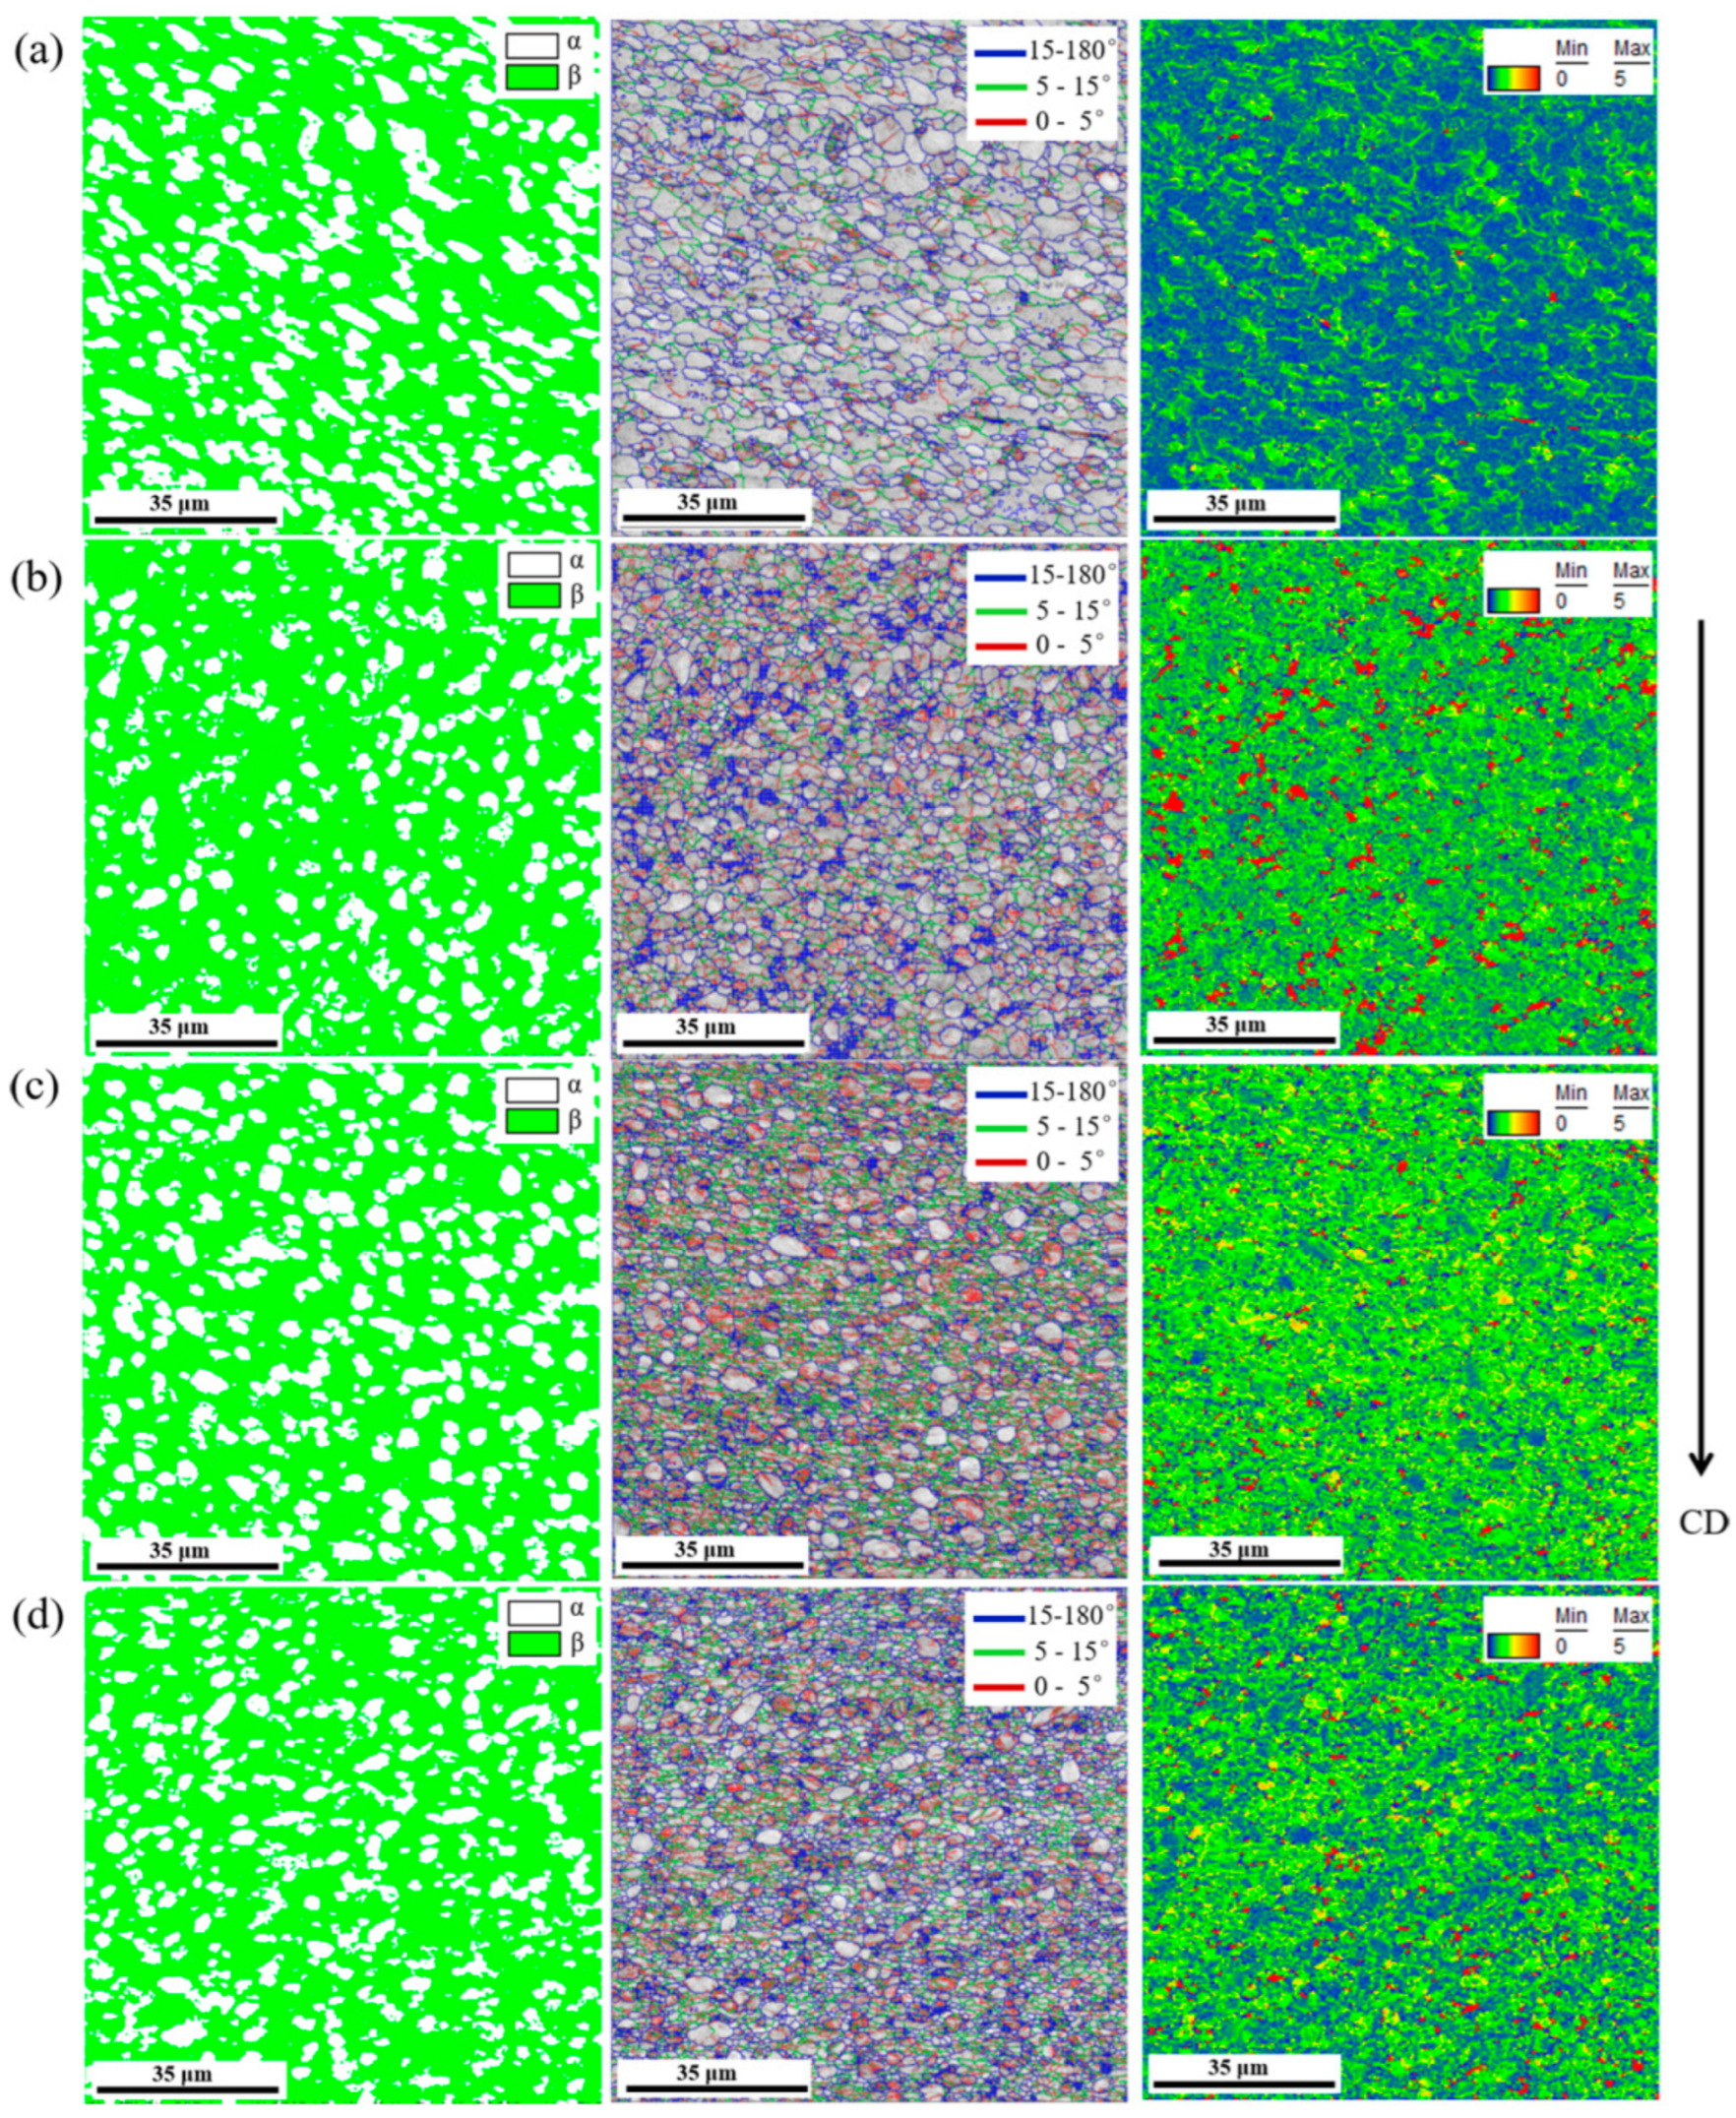
Figure 8 indicates microstructures of Ti555211 alloy undergoing compressive deformation at 750 °C and various strain rates based on EBSD, including phase distribution, grain boundary distribution and kernel average misorientation (KAM), where CD represents compressive direction. In phase distribution of Ti555211 alloy, white represents α phase and green stands for β phase. It can be found from Figure 8 that for compressive deformation at 750 °C, the strain rate has a slight influence on phase distributions of Ti555211 alloy. In grain orientation distributions of Ti555211 alloy, blue lines represent grain boundaries whose misorientation angles range from 15 to 180° and green lines represent grain boundaries whose misorientation angles range from 5 to 15°, whereas red lines represent grain boundaries whose misorientation angles range from 0 to 5°. According to phase distribution and grain boundary orientation distribution, it can be found that when Ti555211 alloy undergoes compressive deformation at 750 °C, few low-angle grain boundaries whose misorientation angles range from 0 to 15° appear in the grains of α phase, whereas plenty of low-angle grain boundaries are distributed in the β phase zone, where the microstructures are inhomogeneous. In particular, the inhomogeneous microstructures are gradually improved with a decreasing strain rate, where number of low-angle grain boundaries in β phase region is substantially reduced at the strain rate of 0.005 s−1. In addition, it is noted that when Ti555211sample undergoes compressive deformation at the higher strain rates at 750 °C, high-angle grain boundaries are aggregated at the boundary between α phase and β phase, where there exist some extremely fine grains. In the KAM maps, different colors represent the magnitude of misorientations in the local zone of grains in microstructures of Ti555211 alloy. It can be found that when Ti555211 alloy is subjected to plastic deformation at a strain rate of 0.005 s−1 and at 750 °C, the value of KAM is pretty small, and value of KAM approximates to zero in most of the microstructures, which means that strain presents a homogeneous distribution. Based on the previous results, it is concluded that when Ti555211 alloy is subjected to plastic deformation at a strain rate of 0.005 s−1 and at 750 °C, microstructures are more homogeneous and thus Ti555211 alloy is appropriate for processing in the deformation condition, which is consistent with prediction results from previous processing map.
Figure 9 shows microstructures of Ti555211 samples undergoing compressive deformation at 850 °C and various strain rates based on EBSD, including phase distribution, grain boundary distribution and KAM, where CD represents compressive direction. It can be found from the phase distribution that when Ti555211 alloy is subjected to compressive deformation at 850 °C and the higher strain rates, the content of α phase is relatively higher. The phenomenon is mainly due to the fact that phase transformation point of Ti555211 alloy is approximately 875 °C, which is near 850 °C, where at the slower strain rate, hot deformation of Ti555211 alloy for a long time leads to the smaller amount of α phase. Simultaneously, according to phase distribution and grain boundary orientation distribution, it is found that after Ti555211 alloy undergoes plastic deformation at 850 °C, there remain few low-angle grain boundaries in grains of α phase, whereas the number of low-angle grain boundaries is reduced with the decrease of strain rate. In addition, compared with Ti555211 alloy sample deformed at 750 °C, the size of grains in β phase region increases substantially in Ti555211 alloy sample deformed at 850 °C, where the size of grains increases with the decrease of strain rates. In particular, the size of grains in β phase region is much greater than that in α phase region when the strain rate is reduced to 0.005 s−1. It can be found from the KAM map that the value of KAM decreases with the decrease of strain rates when Ti555211 sample undergoes compressive deformation at the higher strain rates at 850 °C. The KAM value is relatively higher in the grain boundaries and the phase interfaces in microstructures of Ti555211 sample when the strain rate goes down to 0.005 s−1. This means that there exists the higher strain gradient in the grain boundaries and the phase interfaces in microstructures of Ti555211 sample, which corresponds to the higher geometrically necessary dislocation density [34]. According to the previous analysis, it can be concluded that Ti555211 alloy deformed at a strain rate of 0.05 s−1 possesses the more homogeneous microstructures when Ti555211 samples are deformed at the various strain rates at 850 °C. According to processing map of Ti555211 alloy in Figure 5, it can be found that the strain rate of 0.05 s−1 is located in the stable flow zone in which the power dissipation efficiency η possesses the higher value and Ti555211 alloy is processed more appropriately. In addition, according to the microstructures of Ti555211 specimens deformed at 750 and 850 °C, it can be noted that the microstructures in the α phase present a slighter variation than those in the β phase when Ti555211 samples undergo compressive deformation in α + β phase region at high temperatures. It can be concluded that plastic deformation is mainly undertaken by β phase when Ti555211 alloy undergoes hot working in α + β phase region at high temperatures [35].

3.2.2. Microstructures of Ti555211 Alloy with Single Phase

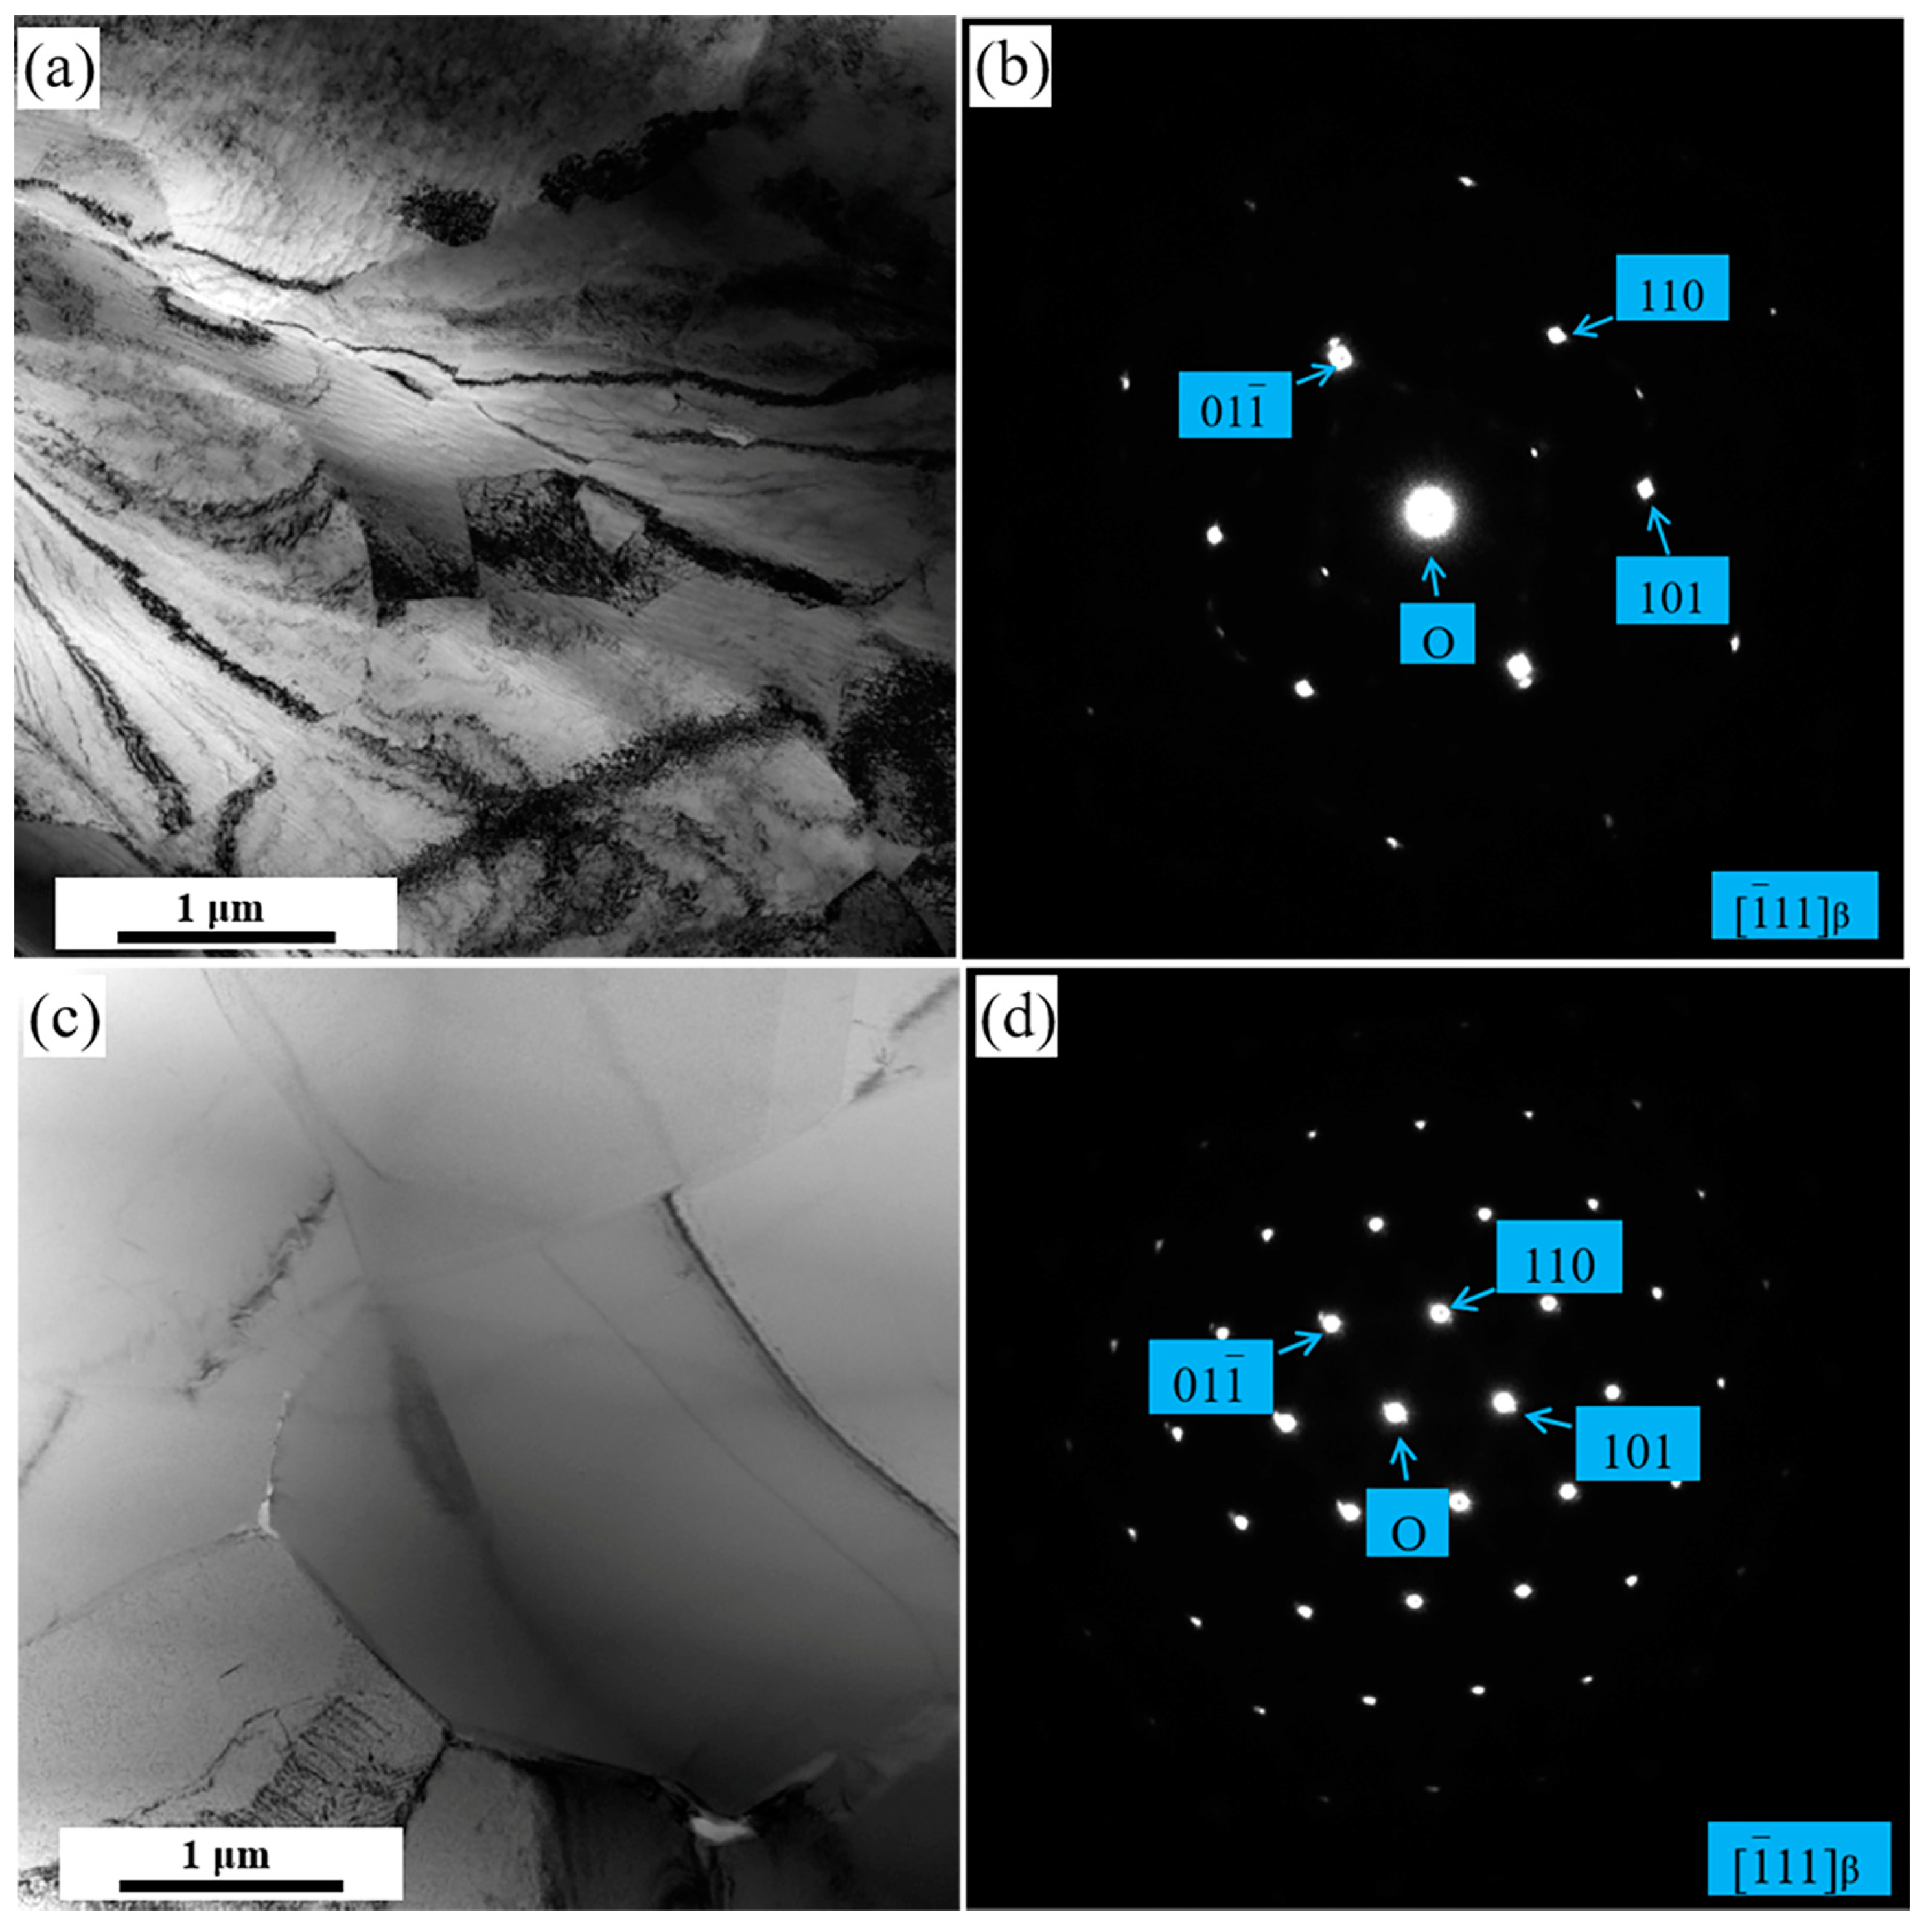
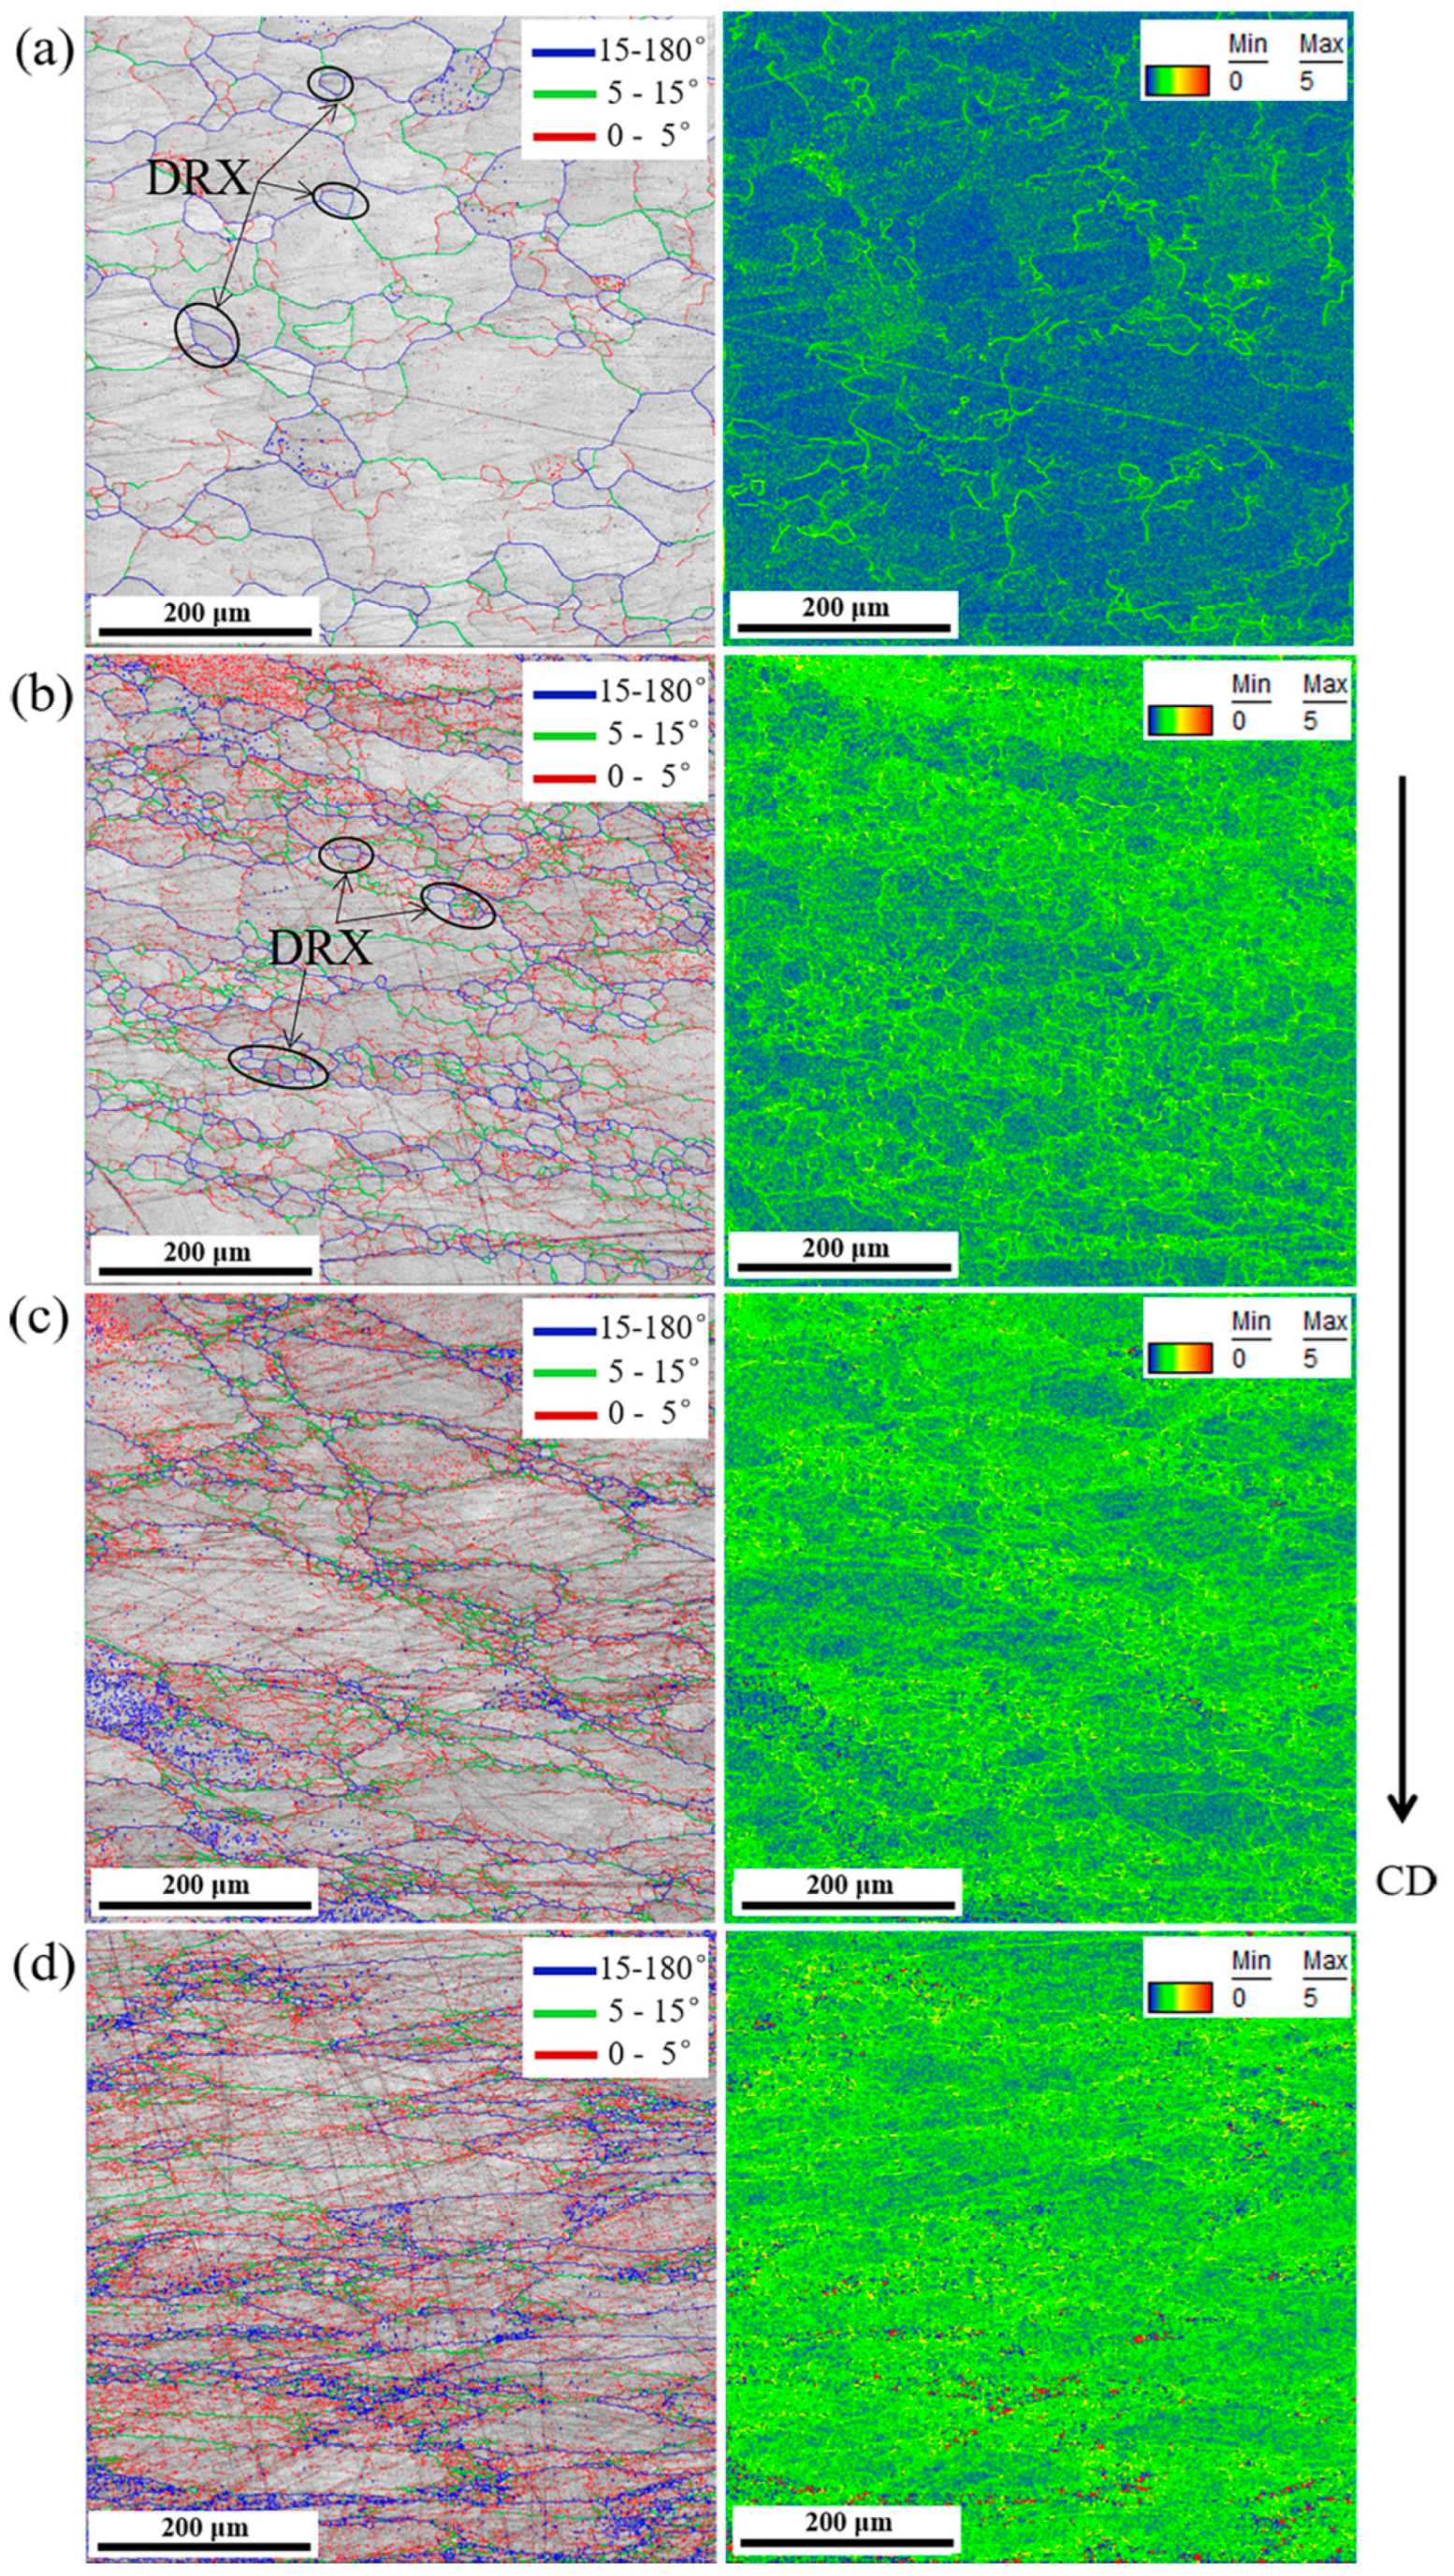
Figure 10 demonstrates TEM micrographs of Ti555211 alloy compressed at 950 and 1050 °C and at a strain rate of 5 s−1, respectively. It can be found from Figure 10 that the Ti555211 alloy samples deformed at 950 and 1050 °C consists of single β phase. The phenomenon indicates that Ti555211 alloy samples belong to a single β phase zone at 950 and 1050 °C. In addition, the elongated grains can be observed in the Ti555211 alloy sample at 950 °C, whereas the equiaxed grains are dominant in the Ti555211 alloy sample at 1050 °C.
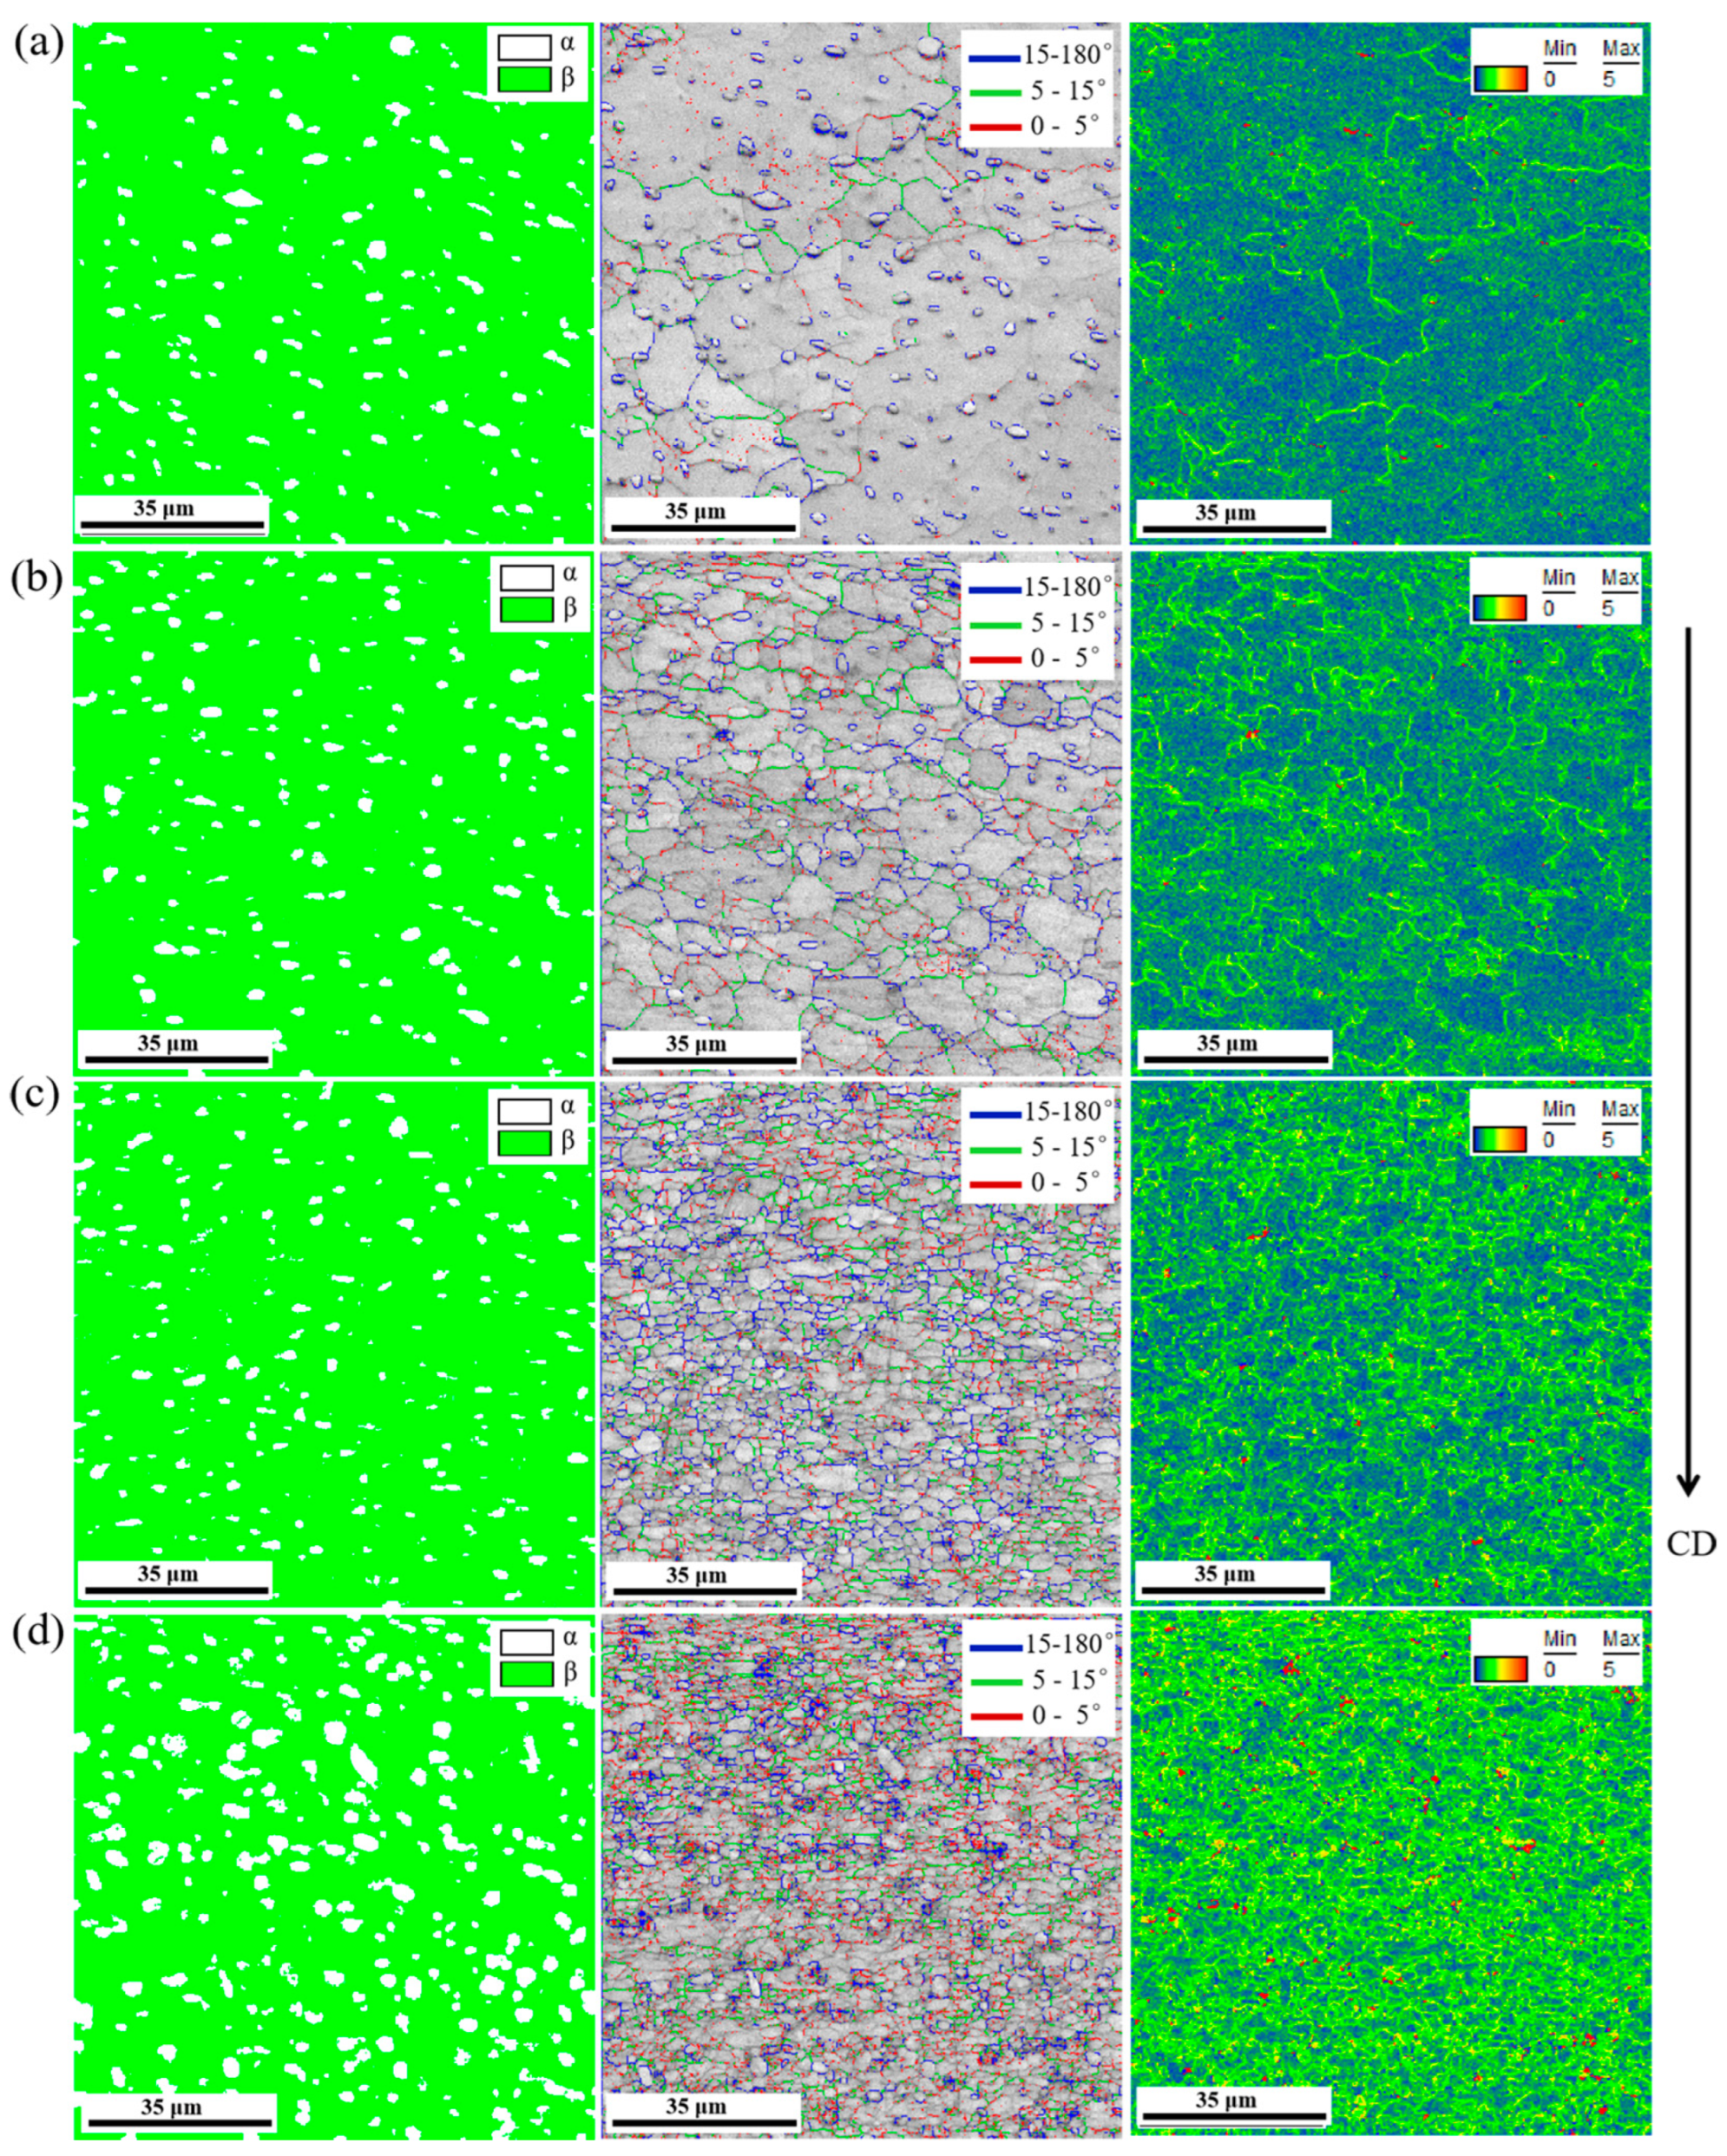
Figure 11 illustrates microstructures of Ti555211 sample undergoing compressive deformation at 950 °C and various strain rates based on EBSD, including grain boundary distribution and KAM, where CD represents compressive direction. Microstructures of Ti555211 sample undergoing compressive deformation at 950 °C are composed of single β phase. It is found from grain boundary orientation distribution that there exist elongated grains resulting from compressive deformation in the microstructures of Ti555211 sample compressed at a strain rate of 5 s−1. Furthermore, the number of elongated grains is gradually reduced with decreasing strain rates and the equiaxed grains resulting from dynamic recrystallization can be observed at the grain boundaries. Simultaneously, the fraction of low-angle grain boundaries in Ti555211 alloy is reduced with the decrease of the strain rate. When strain rate falls to 0.005 s−1, the microstructures of Ti555211 alloy are dominated by equiaxed grains, where the size of dynamic recrystallized grains is raised considerably and the more homogeneous microstructures are observed. This is attributed to the fact that the slower strain rate leads to enhancing deformation duration of Ti555211 alloy, which contributes to complete dynamic recrystallization of Ti555211 alloy and further improving the involved deformation microstructures. It can be observed from the KAM map that the KAM value decreases with decreasing strain rates in Ti555211 sample deformed at 950 °C. It is obvious that as for Ti555211 sample compressed at a strain rate of 5 s−1, most of microstructures possesses the higher KAM value, which indicates that there exist plenty of geometrically necessary dislocations in the involved microstructures. It is obvious that geometrically necessary dislocations play an important role in keeping continuity of polycrystals by means of establishing the strain gradient. The KAM value is relatively lower in the grain interior of the Ti555211 alloy sample deformed at a strain rate of 0.005 s−1, where KAM value is relatively higher. According to the previous processing maps, 950 °C and 0.005 s−1 are the best process parameters in which Ti555211 alloy is suitable for hot processing.
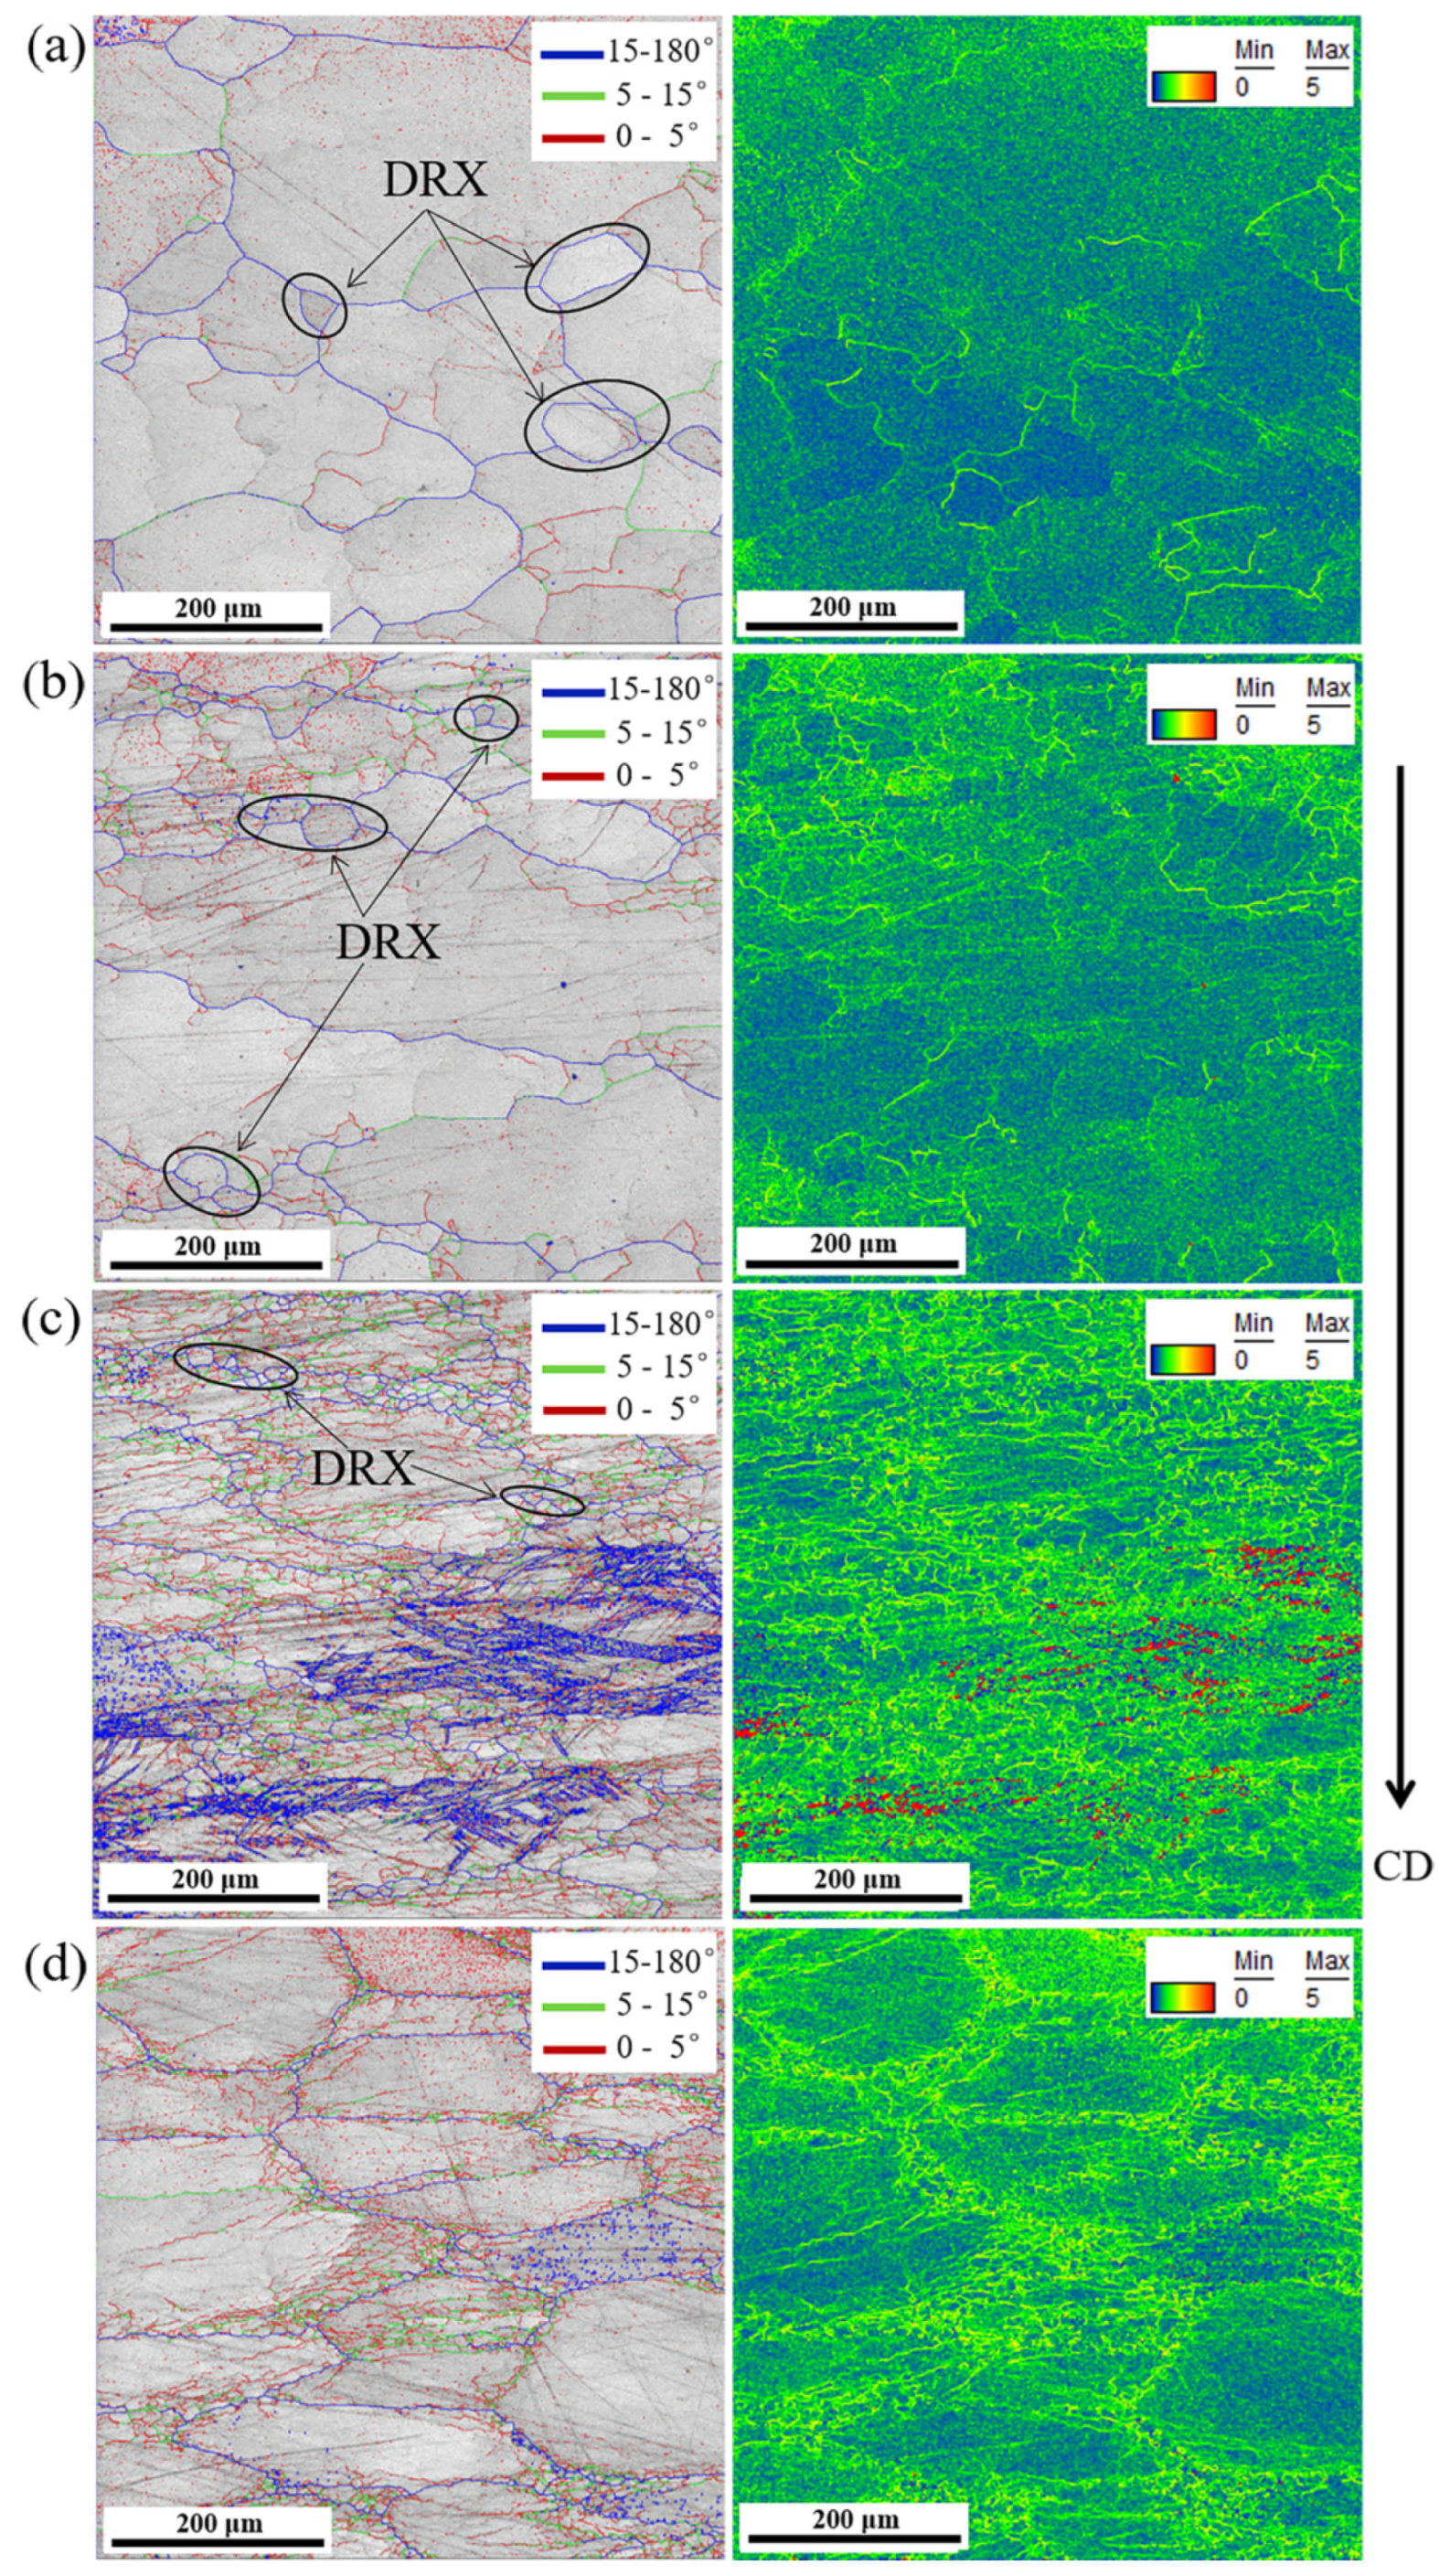
Figure 12 demonstrates microstructures of Ti555211 sample undergoing compressive deformation at 1050 °C and various strain rates based on EBSD, including grain boundary distribution and KAM, where CD represents compressive direction. It is noted from grain boundary distribution that with decreasing strain rates, microstructure of Ti555211 sample compressed at 1050 °C exhibits a similar variation to that of Ti555211 sample compressed at 950 °C. In other words, the elongated grains are gradually transformed into the equiaxed grains, where the size of dynamic recrystallized grains gradually rises and the fraction of low-angle grain boundary gradually decreases gradually. However, the size of grains in Ti555211 alloy deformed at 1050 °C is obviously greater than that in Ti555211 alloy deformed at 950 °C. Simultaneously, it can be found from the KAM map that the KAM value in the Ti555211 sample deformed at 1050 °C is much less than that in Ti555211 sample deformed at 950 °C. The phenomenon is mainly due to the fact that the higher temperature leads to increasing vibration and hot diffusion of the atoms, which provides a sufficient driving force for growth and dynamic recrystallization of grains in β phase. It is evident that Ti555211 sample deformed at 1050 °C shall consume the more energy and possess the coarser microstructures than the one deformed at 950 °C. Therefore, it can be further deduced that 950 °C is not the best processing temperature for Ti555211 sample.

4. Conclusions

Hot workability and microstructural evolution of Ti555211 alloy are investigated during compressive deformation at various temperatures and strain rates. The following conclusions are drawn:
  • True stress–strain curves of Ti555211 alloy are obtained based on compressive test at high temperatures. It is found that flow stress increases with reducing temperatures and it decreases with the reducing strain rate during compressive deformation of Ti555211 sample. This indicates that Ti555211 alloy is sensitive to the strain rate during compression at high temperatures;
  • It can be found that Ti555211 samples deformed at 750 and 850 °C are composed of α and β phases, whereas Ti555211 samples deformed at 950 and 1050 °C consist of single β phase. When Ti555211 sample undergoes compressive deformation in α + β phase region, the microstructures of α phase vary more substantially than those of β phase, which means that plastic deformation of Ti555211 sample is governed by β phase;
  • The processing maps of Ti555211 alloy are constructed according to dynamic material model, where the process parameters for hot working are optimized. It can be found that Ti555211 alloy generally possesses the better hot workability in single β phase region. In single β phase region of Ti555211 alloy, the best hot processing parameters involve temperature range from 925 to 1025 °C and the strain rate range from 0.005 to 0.03 s−1.

Author Contributions

Methodology, Y.G.; formal analysis, Y.G. and X.L.; writing—original draft preparation, Y.G.; writing—review and editing, X.L., Y.D. and H.C.; supervision, X.L.; validation, X.X.; investigation, H.G. and X.X.; visualization, H.G. and S.L.; resources, W.L.; data curation, K.W.; project administration, Y.D. All authors have read and agreed to the published version of the manuscript.

Funding

This work received no external funding.

Data Availability Statement

The data will be made available upon request.

Acknowledgments

The authors would like to acknowledge Western Superconducting Technologies Co., Ltd. for their support in the project.

Conflicts of Interest

The authors declare no conflict of interest.

References

  1. Yu, G.X.; Zhao, D.X.; Li, K.; Chen, W.; Zhang, J.Y.; Liu, J.X.; Li, R.; Wang, X.X.; Sun, J. Homogeneous α-precipitation and enhanced plasticity in Ti-6Cr-5Mo-5V-4Al high-strength metastable titanium alloy with heterogenous β-structure. Mater. Sci. Eng. A 2022, 858, 144180. [Google Scholar] [CrossRef]
  2. Xu, T.W.; Li, J.S.; Zhang, S.S.; Zhang, F.S.; Liu, X.H. Cold deformation behavior of the Ti-15Mo-3Al-2.7Nb-0.2Si alloy and its effect on a precipitation and tensile properties in aging treatment. J. Alloys Compd. 2016, 682, 404–411. [Google Scholar] [CrossRef]
  3. Zhang, W.D.; Liu, Y.; Wu, H.; Liu, B.; Chen, Z.J.; Tang, H.P. Microstructural evolution during hot and cold deformation of Ti-36Nb-2Ta-3Zr-0.35O alloy. Trans. Nonferr. Met. Soc. China 2016, 26, 1310–1316. [Google Scholar] [CrossRef]
  4. Wu, Y.; Wang, T.; Ren, Z.K.; Liu, Y.M.; Huang, Q.X. Evolution mechanism of microstructure and bond strength based on interface diffusion and IMCs of Ti/steel clad plates fabricated by double-layered hot rolling. J. Mater. Process. Technol. 2022, 310, 117780. [Google Scholar] [CrossRef]
  5. Gupta, A.; Khatirkar, R.; Singh, J. A review of microstructure and texture evolution during plastic deformation and heat treatment of β-Ti alloys. J. Alloys Compd. 2022, 899, 163242. [Google Scholar] [CrossRef]
  6. Ducreux, C.I.P.; Saleh, A.A.; Gazder, A.A.; Pereloma, E.V. An in-situ neutron diffraction investigation of martensitic transformation in a metastable β Ti-10V-2Fe-3Al alloy during uniaxial tension. J. Alloys Compd. 2021, 869, 159301. [Google Scholar] [CrossRef]
  7. Jiang, Y.Q.; Lin, Y.C.; Wang, G.Q.; Pang, G.D.; Chen, M.S.; Huang, Z.C. Microstructure evolution and a unified constitutive model for a Ti-55511alloy deformed in β region. J. Alloys Compd. 2021, 870, 159534. [Google Scholar] [CrossRef]
  8. Li, L.; Li, M.Q. Further mechanism of α/β interphase boundary evolution and dynamic globularization of Ti-5Al-2Sn-2Zr-4Mo-4Cr at elevated temperature deformation. Prog. Nat. Sci.-Mater. 2022, 32, 490–497. [Google Scholar] [CrossRef]
  9. Hariharan, A.; Goldberg, P.; Gustmann, T.; Maawad, E.; Pilz, S.; Schell, F.; Kunze, T.; Zwahr, C.; Gebert, A. Designing the microstructural constituents of an additively manufactured near β Ti alloy for an enhanced mechanical and corrosion response. Mater. Des. 2022, 217, 110618. [Google Scholar] [CrossRef]
  10. Li, L.; Li, M.Q.; Luo, J. Mechanism in the β phase evolution during hot deformation of Ti-5Al-2Sn-2Zr-4Mo-4Cr with a transformed microstructure. Acta Mater. 2015, 94, 36–45. [Google Scholar] [CrossRef]
  11. Lu, T.; Dan, Z.H.; Li, T.J.; Dai, G.Q.; Sun, Y.Y.; Guo, Y.H.; Li, K.; Yi, D.Q.; Chang, H.; Zhou, L. Flow softening and microstructural evolution of near β titanium alloy Ti-35421 during hot compression deformation in the α+β region. J. Mater. Res. Technol. 2022, 19, 2257–2274. [Google Scholar] [CrossRef]
  12. Ratochka, I.V.; Naydenkin, E.V.; Mishin, I.P.; Lykova, O.N.; Zabudchenko, O.V. Low-temperature superplasticity of ultrafine-grained near β titanium alloy. J. Alloys Compd. 2021, 891, 161981. [Google Scholar] [CrossRef]
  13. Guo, H.J.; Liu, P.; Qin, X.P.; Song, Y.L.; Qian, D.S.; Xie, L.C.; Wang, L.Q.; Zhang, L.C.; Hua, L. Electroshock treatment dependent microstructural evolution and mechanical properties of near-β titanium alloy manufactured by directed energy deposition. Mater. Des. 2021, 212, 110286. [Google Scholar] [CrossRef]
  14. Ebrahimi, M.; Wang, Q.D.; Attarilar, S. A comprehensive review of magnesium-based alloys and composites processed by cyclic extrusion compression and the related techniques. Prog. Mater. Sci. 2023, 131, 101016. [Google Scholar] [CrossRef]
  15. Ghosh, S.; Hamad, A.; Patnamsetty, M.; Borek, W.; Gouda, M.; Chiba, A.; Ebied, S. Constitutive modeling and hot deformation processing map of a new biomaterial Ti-14Cr alloy. J. Mater. Res. Technol. 2022, 20, 4097–4113. [Google Scholar] [CrossRef]
  16. Jin, H.J.; Shi, S.B.; Li, J.J.; Wang, X.X.; Yang, C.X. A new β-Ti alloy with good tensile properties by the mixed microstructure characteristics of α phase. J. Alloys Compd. 2022, 925, 166755. [Google Scholar] [CrossRef]
  17. Prasad, Y.V.R.K.; Gegel, H.L.; Doraivelu, S.M.; Malas, J.C.; Morgan, J.T.; Lark, K.A.; Barker, D.R. Modeling of dynamic material behavior in hot deformation: Forging of Ti6242. Metall. Mater. Trans. A 1984, 15, 1883–1892. [Google Scholar] [CrossRef]
  18. Sun, D.; Zhang, Y.Q.; Jiang, S.Y.; Yu, J.B.; Yan, B.Y. Investigation on hot workability of Ti-37 at% Nb alloy based on processing map and microstructural evolution. Metall. Mater. Trans. A 2021, 52, 2830–2844. [Google Scholar] [CrossRef]
  19. Zhang, Y.Q.; Jiang, S.Y.; Chen, C.; Hu, L.; Zhu, X.M. Hot workability of a NiTiCu shape memory alloy with acicular martensite phase based on processing maps. Intermetallics 2017, 86, 94–103. [Google Scholar] [CrossRef]
  20. Wang, Y.; Jiang, S.Y.; Zhang, Y.Q. Processing Map of NiTiNb Shape Memory Alloy Subjected to Plastic Deformation at High Temperatures. Metals 2017, 7, 328. [Google Scholar] [CrossRef] [Green Version]
  21. Zhang, Y.Q.; Jiang, S.Y.; Zhao, Y.N.; Shan, D.B. Isothermal precision forging of complex-shape rotating disk of aluminum alloy based on processing map and digitized technology. Mater. Sci. Eng. A 2013, 580, 294–304. [Google Scholar] [CrossRef]
  22. Seyed-Salehi, M.; Kim, B.H.; Yang, S.Y.; Kim, S.K.; Eisaabadi Bozchalei, G. Effect of Cr elimination on flow behavior and processing map of newly developed ECO-7175 aluminum alloy during hot compression. Trans. Nonferr. Met. Soc. China 2022, 32, 1442–1459. [Google Scholar] [CrossRef]
  23. Chi, Z.L.; Ren, S.; Qiao, J.B.; Qu, J.L.; Yang, C.B.; Xie, Z.Y.; Chen, W.; Zhang, H.; Jiang, L.; Chen, S.Y.; et al. Failure behaviors and processing maps with failure domains for hot compression of a powder metallurgy Ni-based superalloy. J. Mater. Res. Technol. 2022, 20, 3860–3874. [Google Scholar] [CrossRef]
  24. Lei, C.; Wang, Q.D.; Tang, H.P.; Liu, T.W.; Li, Z.Y.; Jiang, H.Y.; Wang, K.; Ebrahimi, M.; Ding, W.J. Hot deformation constitutive model and processing maps of homogenized Al-5Mg-3Zn-1Cu alloy. J. Mater. Res. Technol. 2021, 14, 324–339. [Google Scholar] [CrossRef]
  25. An, Z.; Li, J.S.; Feng, Y. Optimization of thermal processing parameters of Ti555211 alloy using processing maps based on Murty criterion. Rare Met. 2016, 35, 154–161. [Google Scholar] [CrossRef]
  26. An, Z.; Wang, Z.L.; Xue, F.; Mao, X.N.; Li, L.; Ding, X. Investigation on Thermal Processing Map of Ti555211 Alloy Based on Dynamic Material Model. Chin. J. Rare Met. 2019, 43, 706–712. [Google Scholar]
  27. Evans, R.W.; Scharning, P.J. Axisymmetric compression test and hot working properties of alloys. Mater. Sci. Technol. 2001, 17, 995–1004. [Google Scholar] [CrossRef]
  28. Wan, Z.P.; Hu, L.X.; Sun, Y.; Wang, T.; Li, Z. Hot deformation behavior and processing workability of a Ni-based alloy. J. Alloys Compd. 2018, 769, 367–375. [Google Scholar] [CrossRef]
  29. Gao, Y.; Xue, X.; Gao, H.; Luo, W.; Wang, K.; Li, S.; Liu, X.; Du, Y. Investigation of High-Temperature Constitutive Behavior of Ti555211 Titanium Alloy Subjected to Plastic Deformation in the Different Phase Regions. Metals 2022, 12, 1562. [Google Scholar] [CrossRef]
  30. Kwak, T.K.; Kim, W.J. Effect of refinement of grains and icosahedral phase on hot compressive deformation and processing maps of Mg-Zn-Y magnesium alloys with different volume fractions of icosahedral phase. J. Sci. Technol. 2019, 35, 181–191. [Google Scholar] [CrossRef]
  31. Sun, Y.; Feng, X.Y.; Hu, L.X.; Zhang, H.; Zhang, H.Z. Characterization on hot deformation behavior of Ti-22Al-25Nb alloy using a combination of 3D processing maps and finite element simulation method. J. Alloys Compd. 2018, 753, 256–271. [Google Scholar] [CrossRef]
  32. Prasad, Y.V.R.K.; Seshacharyulu, T. Modelling of hot deformation for microstructural control. Int. Mater. Rev. 1998, 43, 243–258. [Google Scholar] [CrossRef]
  33. Jiang, S.Y.; Wang, Y.; Yan, B.Y.; Zhang, Y.Q. Hot workability of FeMnSiCrNi shape memory alloy based on processing map and martensitic transformation. J. Alloys Compd. 2019, 806, 1153–1165. [Google Scholar] [CrossRef]
  34. Zang, M.C.; Niu, H.Z.; Yu, J.S.; Zhang, H.R.; Zhang, T.B.; Zhang, D.L. Cryogenic tensile properties and deformation behavior of a fine-grained near alpha titanium alloy with an equiaxed microstructure. Mater. Sci. Eng. A 2022, 840, 142952. [Google Scholar] [CrossRef]
  35. Chen, W.; Li, Q.F.; Zhou, L.B.; Li, C.; Qiu, W.; Chen, J.; Lin, Y.C.; Zhou, K.C. Limit of cold deformation in a near β-Ti alloy: Role of a′ phases on the failure of β phase during cold rolling. J. Mater. Res. Technol. 2022, 20, 2385–2393. [Google Scholar] [CrossRef]
Figure 1. True stress–strain curves of Ti555211 sample on various deformation conditions: (a) ε ˙ = 0.005   s 1 ; (b) ε ˙ = 0.05   s 1 ; (c) ε ˙ = 0.5   s 1 ; (d) ε ˙ = 5   s 1 .
Metals 13 00092 g001
Figure 2. The relationship between lg σ and lg ε ˙ in the case of the various strains for Ti555211 alloy: (a) 0.3; (b) 0.6; (c) 0.9.
Metals 13 00092 g002
Figure 3. Two-dimensional power dissipation maps of Ti555211 sample at various strains: (a) 0.3; (b) 0.6; (c) 0.9.
Metals 13 00092 g003
Figure 4. Instability maps of Ti555211 sample at the various strains: (a) 0.3; (b) 0.6; (c) 0.9.
Metals 13 00092 g004
Figure 5. Processing maps of Ti555211 sample at the various strains: (a) 0.3; (b) 0.6; (c) 0.9.
Metals 13 00092 g005
Figure 6. TEM micrographs of Ti555211 alloy deformed at 750 °C and a strain rate of 5 s−1: (a) Bright field image with high magnification; (b) Bright field image with low magnification; (c) Bright field image including α and β phases; (d) Selected area diffraction pattern in (c).
Metals 13 00092 g006
Figure 7. TEM micrographs of Ti555211 alloy deformed at 850 °C and astrain rate of 5 s−1: (a) Bright field image with high magnification; (b) Bright field image with low magnification; (c) Bright field image including α and β phases; (d) Selected area diffraction pattern in (c).
Metals 13 00092 g007
Figure 8. Phase distribution, grain boundary distribution and kernel average misorientation of Ti555211 alloy samples at 750 °C in the case of the various strain rates: (a) 0.005 s−1; (b) 0.05 s−1; (c) 0.5 s−1; (d) 5 s−1.
Metals 13 00092 g008
Figure 9. Phase distribution, grain boundary distribution and kernel average misorientation of Ti555211 alloy samples at 850 °C in the case of the various strain rates: (a) 0.005 s−1; (b) 0.05 s−1; (c) 0.5 s−1; (d) 5 s−1.
Metals 13 00092 g009
Figure 10. TEM micrographs of Ti555211 alloy compressed at 950 °C and 1050 °C and at a strain rate of 5 s−1: (a) Bright field image at 950 °C; (b) Selected area diffraction pattern in (a) at 950 °C; (c) Bright field image at 1050 °C; (d) Selected area diffraction pattern in (c) at 1050 °C.
Metals 13 00092 g010
Figure 11. Grain boundary distribution and kernel average misorientation of Ti555211 samples at 950 °C in the case of the various strain rates: (a) 0.005 s−1; (b) 0.05 s−1; (c) 0.5 s−1; (d) 5 s−1.
Metals 13 00092 g011
Figure 12. Grain boundary distribution and kernel average misorientation of Ti555211 samples at 1050 °C in the case of the various strain rates: (a) 0.005 s−1; (b) 0.05 s−1; (c) 0.5 s−1; (d) 5 s−1.
Metals 13 00092 g012
Table 1. Flow stresses of Ti555211 sample on various deformation conditions (MPa).
ε ε ˙ / s 1 T/°C
7508509501050
0.30.005115522417
0.05198905134
0.52881539569
5349226150104
0.60.00588492416
0.05160835034
0.52621499365
5286201146104
0.90.00575462417
0.05137745032
0.52271449062
5252189143108
Disclaimer/Publisher’s Note: The statements, opinions and data contained in all publications are solely those of the individual author(s) and contributor(s) and not of MDPI and/or the editor(s). MDPI and/or the editor(s) disclaim responsibility for any injury to people or property resulting from any ideas, methods, instructions or products referred to in the content.