Article

Effect of Isochronous Annealings on the Microstructure and Mechanical Properties of the Ti49.8Ni50.2 (at.%) Alloy after abc Pressing at 573 K

1
Institute of Strength Physics and Materials Science, the Siberian Branch of the Russian Academy of Science, 634055 Tomsk, Russia
2
Division for Experimental Physics, National Research Tomsk Polytechnic University, 634050 Tomsk, Russia
*
Author to whom correspondence should be addressed.
Metals 2023, 13(10), 1632; https://doi.org/10.3390/met13101632
Submission received: 29 August 2023 / Revised: 14 September 2023 / Accepted: 20 September 2023 / Published: 22 September 2023
(This article belongs to the Special Issue Progress in and Prospects of Shape Memory Alloys)

Abstract

:
The regularities and features of the evolution of the grain–subgrain structure, phase composition and mechanical properties in Ti49.8Ni50.2 (at.%), depending on the temperature of isochronous annealings at 573–973 K are herein studied. The state of the Ti49.8Ni50.2 (at.%) alloy samples after abc pressing at T = 573 K with the given true strain e = 9.55 was taken as the initial state. It is shown that the grain–subgrain structure of the samples after annealing for 1 h in the temperature range of 573–673 K changes slightly. In samples annealed at 673 K, regions with the microband structure similar to the microstructure of a fast-frozen turbulent liquid flow were found. It has been established that during annealing at 773 K the beginning of an active recrystallization process is realized; the size of grains does not exceed the submicrocrystalline scale (~200 nm). At 873 K, the recrystallization process occurs in the entire volume of the samples; the grains with an average size of 2 ± 0.5 µm are almost equiaxed. The microstructure of the samples after annealing at 973 K (with average grain sizes of 5 ± 0.5 µm) is qualitatively similar to the microstructure of the samples after annealing at 873 K. It was found that the phase composition of the samples as a result of isochronous annealing at 573–973 K changes from R and B19’ immediately after abc pressing to a three-phase state: B2, R and B19’ phases. It is shown that the highest values of yield stress σy, ultimate tensile strength σUTS (1043 MPa and 1232 MPa, correspondingly) and low ductility (the deformation to fracture εf = 48%) are observed in the initial samples. Increasing the temperature of post-deformation annealing and, correspondingly, the development of recrystallization, led to a decrease in σy, σUTS and an increase in εf to the values of these characteristics in the coarse-grained samples (σy = 400 MPa, σUTS = 920 MPa and εf = 90%).

1. Introduction

It is known that the refinement of the grain–subgrain structure of metals and alloys significantly affects their functional and mechanical properties [1,2]. One of the ways to significantly reduce the size of grains–subgrains is to apply a large plastic deformation to the samples by the methods of severe plastic deformation (SPD) [3,4]. The refinement of grains–subgrains under SPD leads to the hardening of metals and alloys [1,2,5]. A number of works present reviews of models [6,7] and mechanisms [6,8,9] of grain refinement in metals and alloys with different crystal structures obtained by various SPD methods.
The influence of SPD on the grain–subgrain and the mechanical properties of TiNi-based alloys have been studied in a number of works. The papers [10,11,12,13,14] presented the results of the influence of large plastic deformations on samples of TiNi-based alloys exposed to the equal channel angular pressing (ECAP) at 673–823 K. The angle between the channels in the papers [10,11,12,13] was 110°–120°. The authors of [14], unfortunately, did not give the magnitude of the angle between the channels. It was found in [10,12] that the samples at T ≥ 773 K experience an active dynamic recrystallization that did not allow for the grain structure of the samples to be refined. It was shown in the references [12,13,14] that the deformation of TiNi-based alloys samples by the ECAP method (the angle between the channels was 120° [12] and 110° [13]) after 7–8 passes (N) at 723 K leads to the formation of a structure with an average grain–subgrain size ≤0.25 µm. Kreitcberg et al. [12] noted that, in this case, the formation of a significant volume of a fraction with a nanocrystalline structure fails. According to [13], ECAP (N = 7; true strain e = 5.67) of Ti49.8Ni50.1 (at.%) alloy samples at 723 K leads to an increase in the yield stress σy from 430 MPa (in the coarse-grained state) to 1090 MPa and the ultimate tensile strength σUTS from 700 MPa to 1150 MPa. Plasticity (relative elongation δ) increases from 28% to 50%. Kuranova et al. [14] also observed an improvement in strength properties after ECAP (N = 8) at 723 K of the Ti49.8Ni50.2 (at.%) alloy samples: σy increased from 560 MPa (in the coarse-grained state) to 1120 MPa; σUTS increased from 950 MPa to 1250 MPa. In this case, a decrease in plasticity from 60% to 43 % was observed. Also in [14], on samples of the Ti49.4Ni50.6 (at.%) alloy after ECAP (N = 8) at 723 K, an almost twofold increase in the yield stress was observed: from 630 MPa (in the coarse-grained state) to 1180 MPa.
In [11], an ultrafine grained (UFG) structure with an average grain-subgrain size of ~0.1 μm was formed in the Ti49.8Ni50.2 (at.%) alloy after ECAP (the angle between the channels is 120°, N = 7) at 673 K. It was found in [11] that after ECAP, the yield stress of samples σy increased from 430 MPa (in the initial state) to 941 MPa; the ultimate tensile strength σUTS increased from 700 to 1154 MPa, and the ductility decreased by ~10%.
In [15], the Ti49.8Ni50.2 (at.%) alloy samples were exposed to abc pressing with a successive decrease in temperature from 873 K to 573 K (the total value of the true strain specified to the samples was e = 7.7). The data of transmission electron microscopy (TEM) showed that a submicrocrystalline structure with a grain-–subgrain size of 100–500 nm was formed in the samples, and at the intersection of the deformation bands, the grain–subgrain size was in the range from 20 to 100 nm (their relative fraction does not exceed 30%). The submicrocrystalline structure (the average grain–subgrain size was 500 nm) was also obtained in [16] after deformation of samples of the Ti50Ni50 (at.%) alloy by severe torsion deformation (the value of the true strain specified to the samples was 9.1) at 773 K. In a recent work [17], the regularities of structure refinement in Ti49.8Ni50.2 (at.%) alloy depending on the value of the specified true strain (e = 1.84; 3.60; 5.40; 7.43; 9.55) were studied using abc pressing at T = 573 K. It was found that SPD at a low temperature (573 K) leads to the formation of a structure with an average grain–subgrain size of 130 nm.
Study of the effect of post-deformation annealing (PDA) on the average grain size and mechanical properties of TiNi-based alloys was carried out in the references [11,13,14]. Post-deformation annealing at 673 K (1 h) of TiNi-based alloy samples exposed to ECAP, both in [11] and in [13] did not lead to significant changes in the average grain–subgrain size, yield stress, ultimate tensile strength, and plasticity.
According to [14], PDA at 723–773 K for 1 h of the Ti49.8Ni50.2 (at.%) alloy samples deformed by ECAP leads to an increase in plasticity (up to 65%); in this case, σy and σUTS change little. The average grain size of the samples after PDA at 773 K increases from 0.24 µm to 0.28 µm. An increase in the PDA temperature to 873 K leads to degradation of the strength properties: σy decreases to 820 MPa; σUTS decreases to 1150 MPa. At the same time, a significant increase in plasticity (up to 78%) and an active increase in the average grain size (up to 3.4 μm) are observed. The authors of [14] believe that this may be due to a more intense recrystallization process.
Analysis of the effect of PDA at 573–973 K (1 h) on the mechanical and plastic properties of Ti49.8Ni50.2 (at.%), Ti49.5Ni50.5 (at.%) and Ti49Ni51 (at.%) alloy samples subjected to multi-pass rolling (30%) at room temperature are presented in [14]. Attention is drawn to the fact that grain refinement during multi-pass rolling (MPR), regardless of the composition of the samples, leads to an increase in strength properties and a decrease in plasticity. The change in the mechanical properties and average grain size during PDA of Ti49.8Ni50.2 alloy samples after MPR [14] is qualitatively similar to the changes in the samples during PDA after ECAP [11,14]. After PDA at 673 K (1 h), in the Ti49.5Ni50.5 and Ti49Ni51 alloys samples subjected to MPR, σy and σUTS reach their maximum values (1070 MPa and 1390 MPa; 1180 MPa and 1550 MPa, respectively). The ductility of the samples remains at the level of 25–30%. Post-deformation annealings at temperatures above 673 K lead to a significant decrease in σy and σUTS. After PDA at 973 K, the mechanical properties reach values close to ones in the coarse-grained state. Note that the tests of mechanical properties were carried out at room temperature (RT) in all the mentioned works.
From the above results of studies of the relationship between the average value of the grain–subgrain structure and mechanical properties in TiNi-based alloys it can be seen that there is clearly a lack of systematic studies of the thermal stability of the grain–subgrain structure, phase state, and mechanical properties obtained by methods of severe plastic deformation. Therefore, the aim of this work is to reveal the regularities and features of the evolution of the grain–subgrain structure, phase composition, and mechanical properties of the Ti49.8Ni50.2 (at.%) alloy samples deformed by abc pressing at T = 573 K with a true strain of e = 9.55, depending on the temperature of isochronous annealings.

2. Materials and Methods

The studies were carried out on the Ti49.8Ni50.2 (at.%) alloy produced by MATEK-SMA Ltd. (Moscow, Russia). The microstructure and phase composition of the alloy was analyzed on the equipment of the NANOTECH Share Use Center of ISPMS SB RAS (Tomsk, Russia) by transmission electron microscopy (TEM) JEM-2100 (JEOL Ltd., Tokyo, Japan). The study of the microstructure and phase composition by TEM was carried out using thin foils. Thin plates 0.5 mm thick were cut from cubic specimens after abc pressing, with a value of specified true strain e = 9.55, using an electro-erosive machine. The final foils were fabricated either by electrolytic polishing in an electrolyte containing sulfuric, nitric and hydrofluoric acids in a ratio of 6:1:3, or by ion etching on an Ion-slicer EM-09 100 15 device (JEOL Ltd., Tokyo, Japan). The average value of grains–subgrains was determined by the secant method, and at least 100 grains–subgrains were used in each sample.
Abc pressing of samples at 573 K was carried out as described in detail in [17]. Isochronous annealings were carried out in a helium atmosphere for 1 h at the following temperatures: 573 K, 673 K, 773 K, 873 K and 973 K.
Tensile testing was carried out at room temperature (298 K) on a Walter + Bai AG LFM 125 testing machine with Dionpro software (Walter-Bai AG, Löhningen, Switzerland). The tensile test samples were cut on an electric discharge machine in the form of a double blade with a working base of 7 mm. The surface of the samples was polished manually using abrasive paper based on silicon carbide with a gradual decrease in grain size to 1200 and then electropolished in an electrolyte containing acetic and perchloric acid in a ratio of 70:30. The initial strain rate was 10−3 s−1. For each value of true strain specified during abc pressing, 4–6 specimens were tested.

3. Results

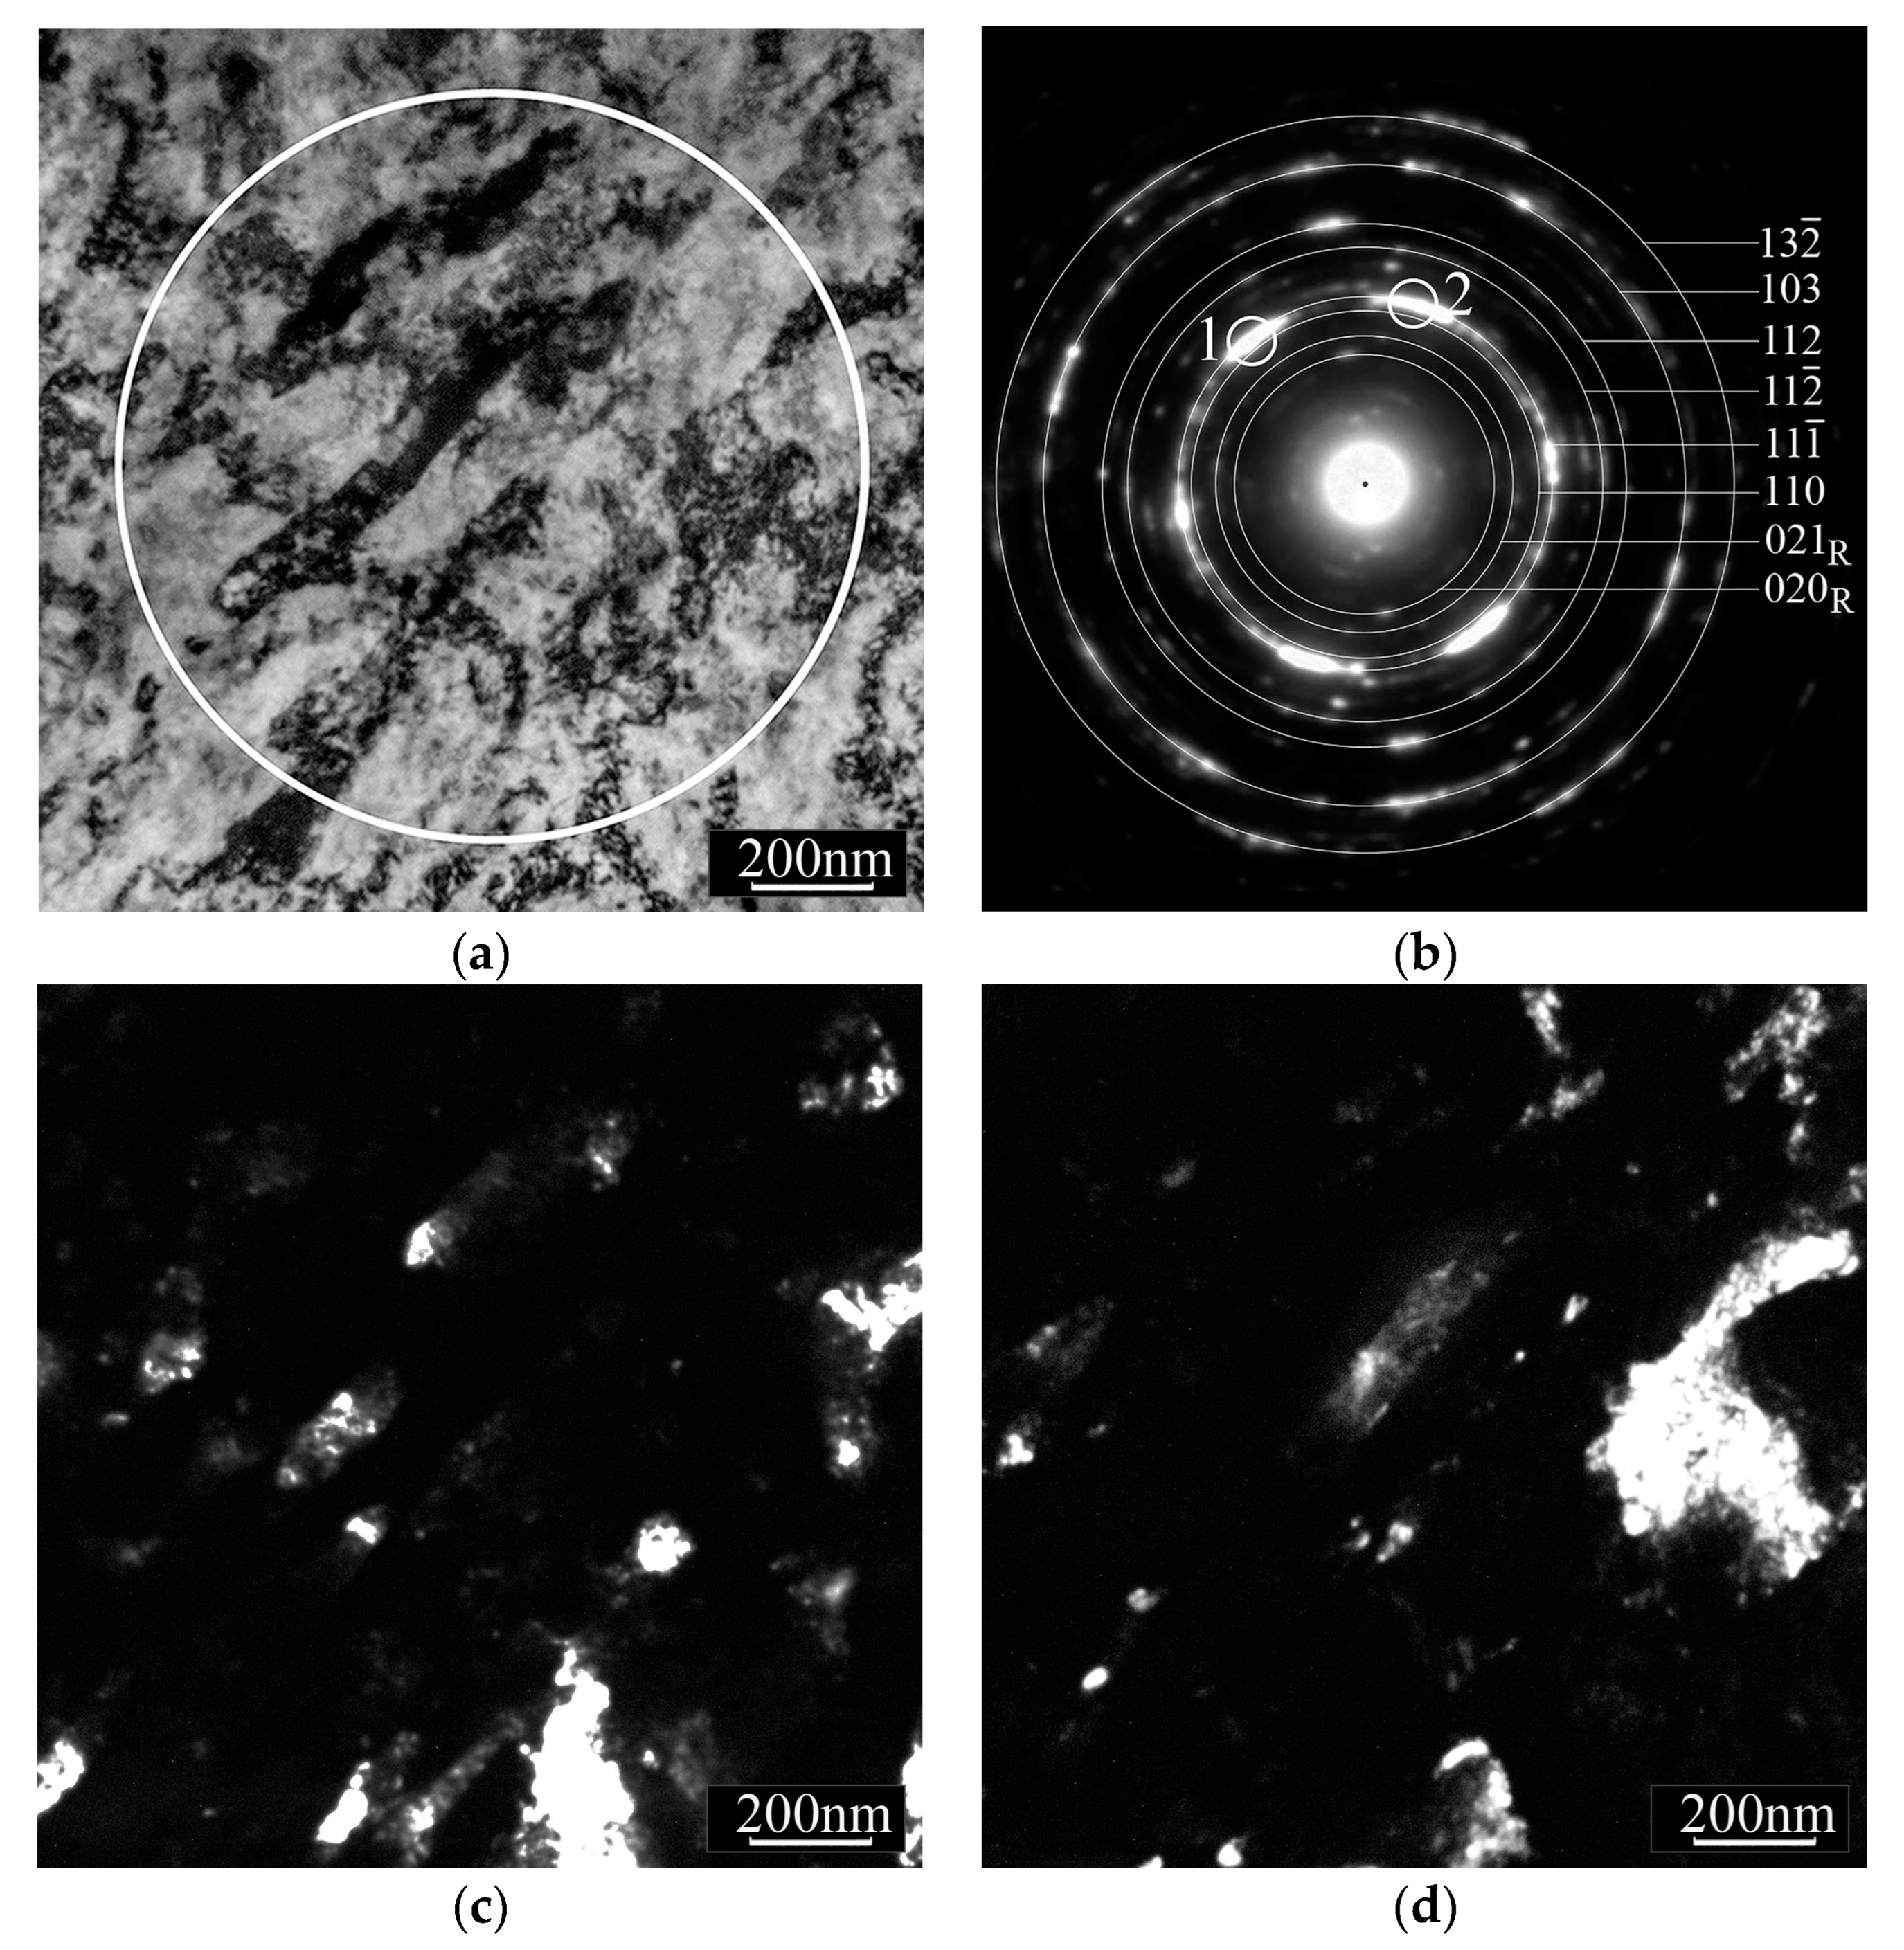
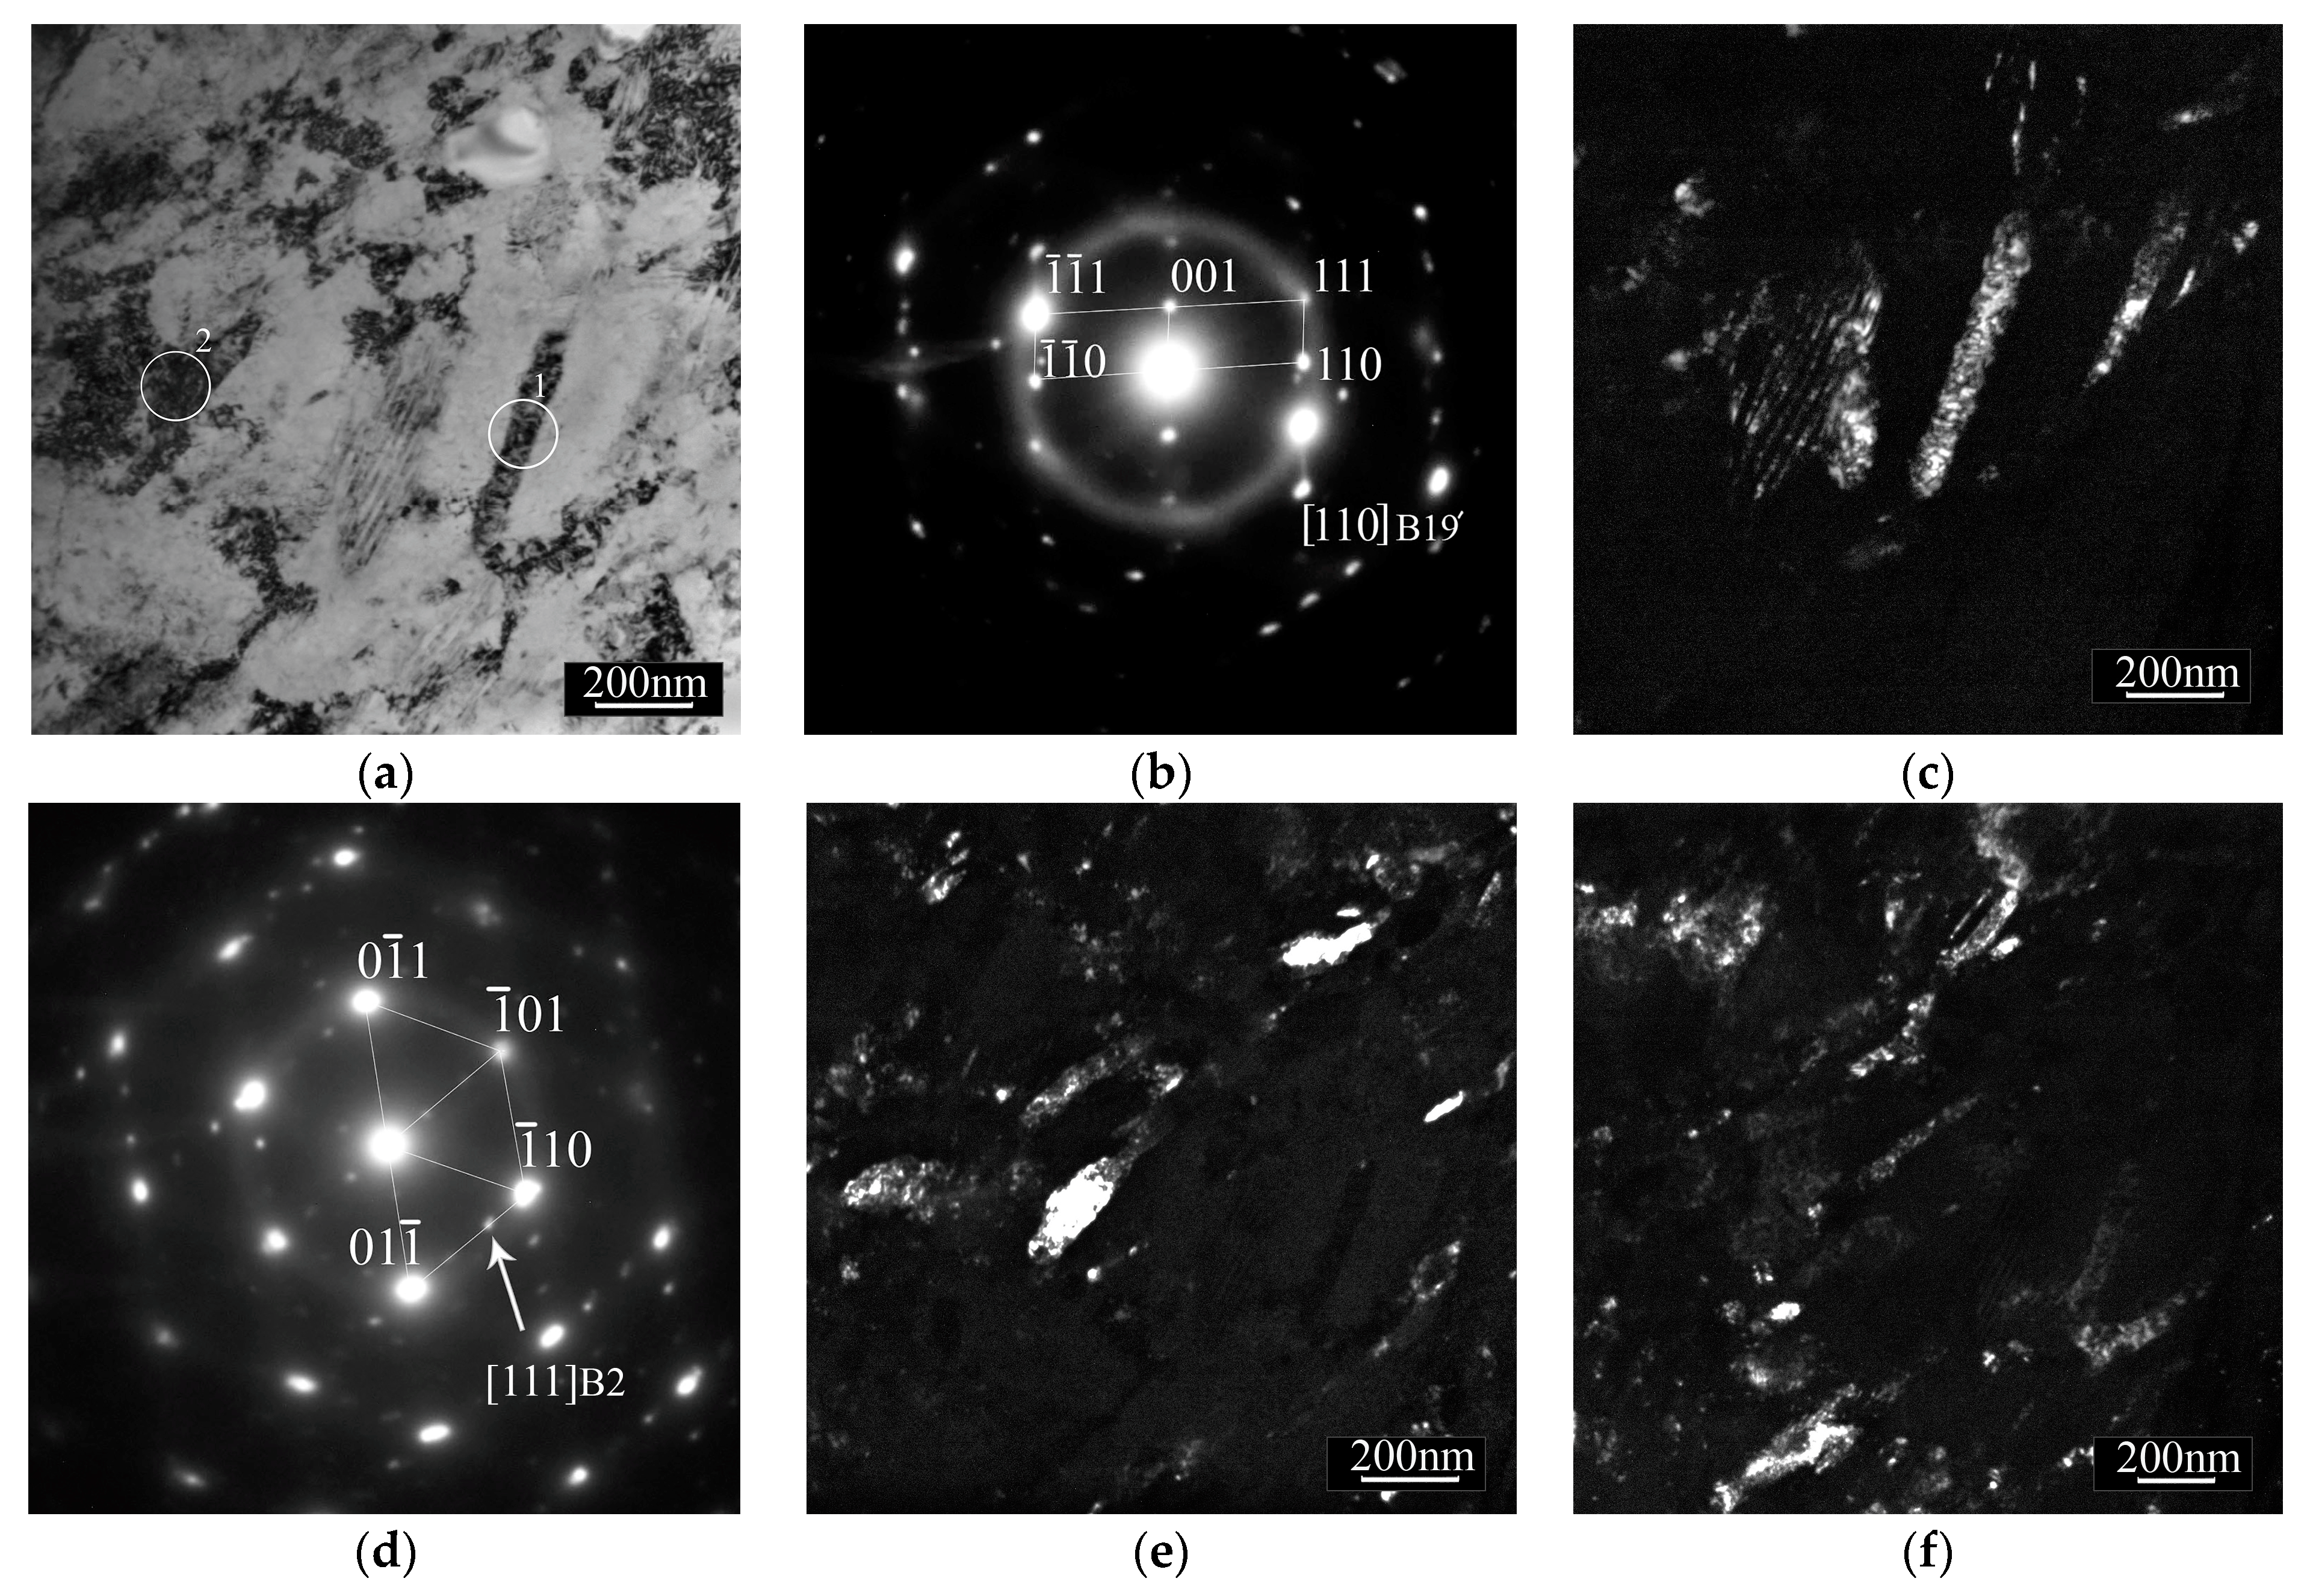
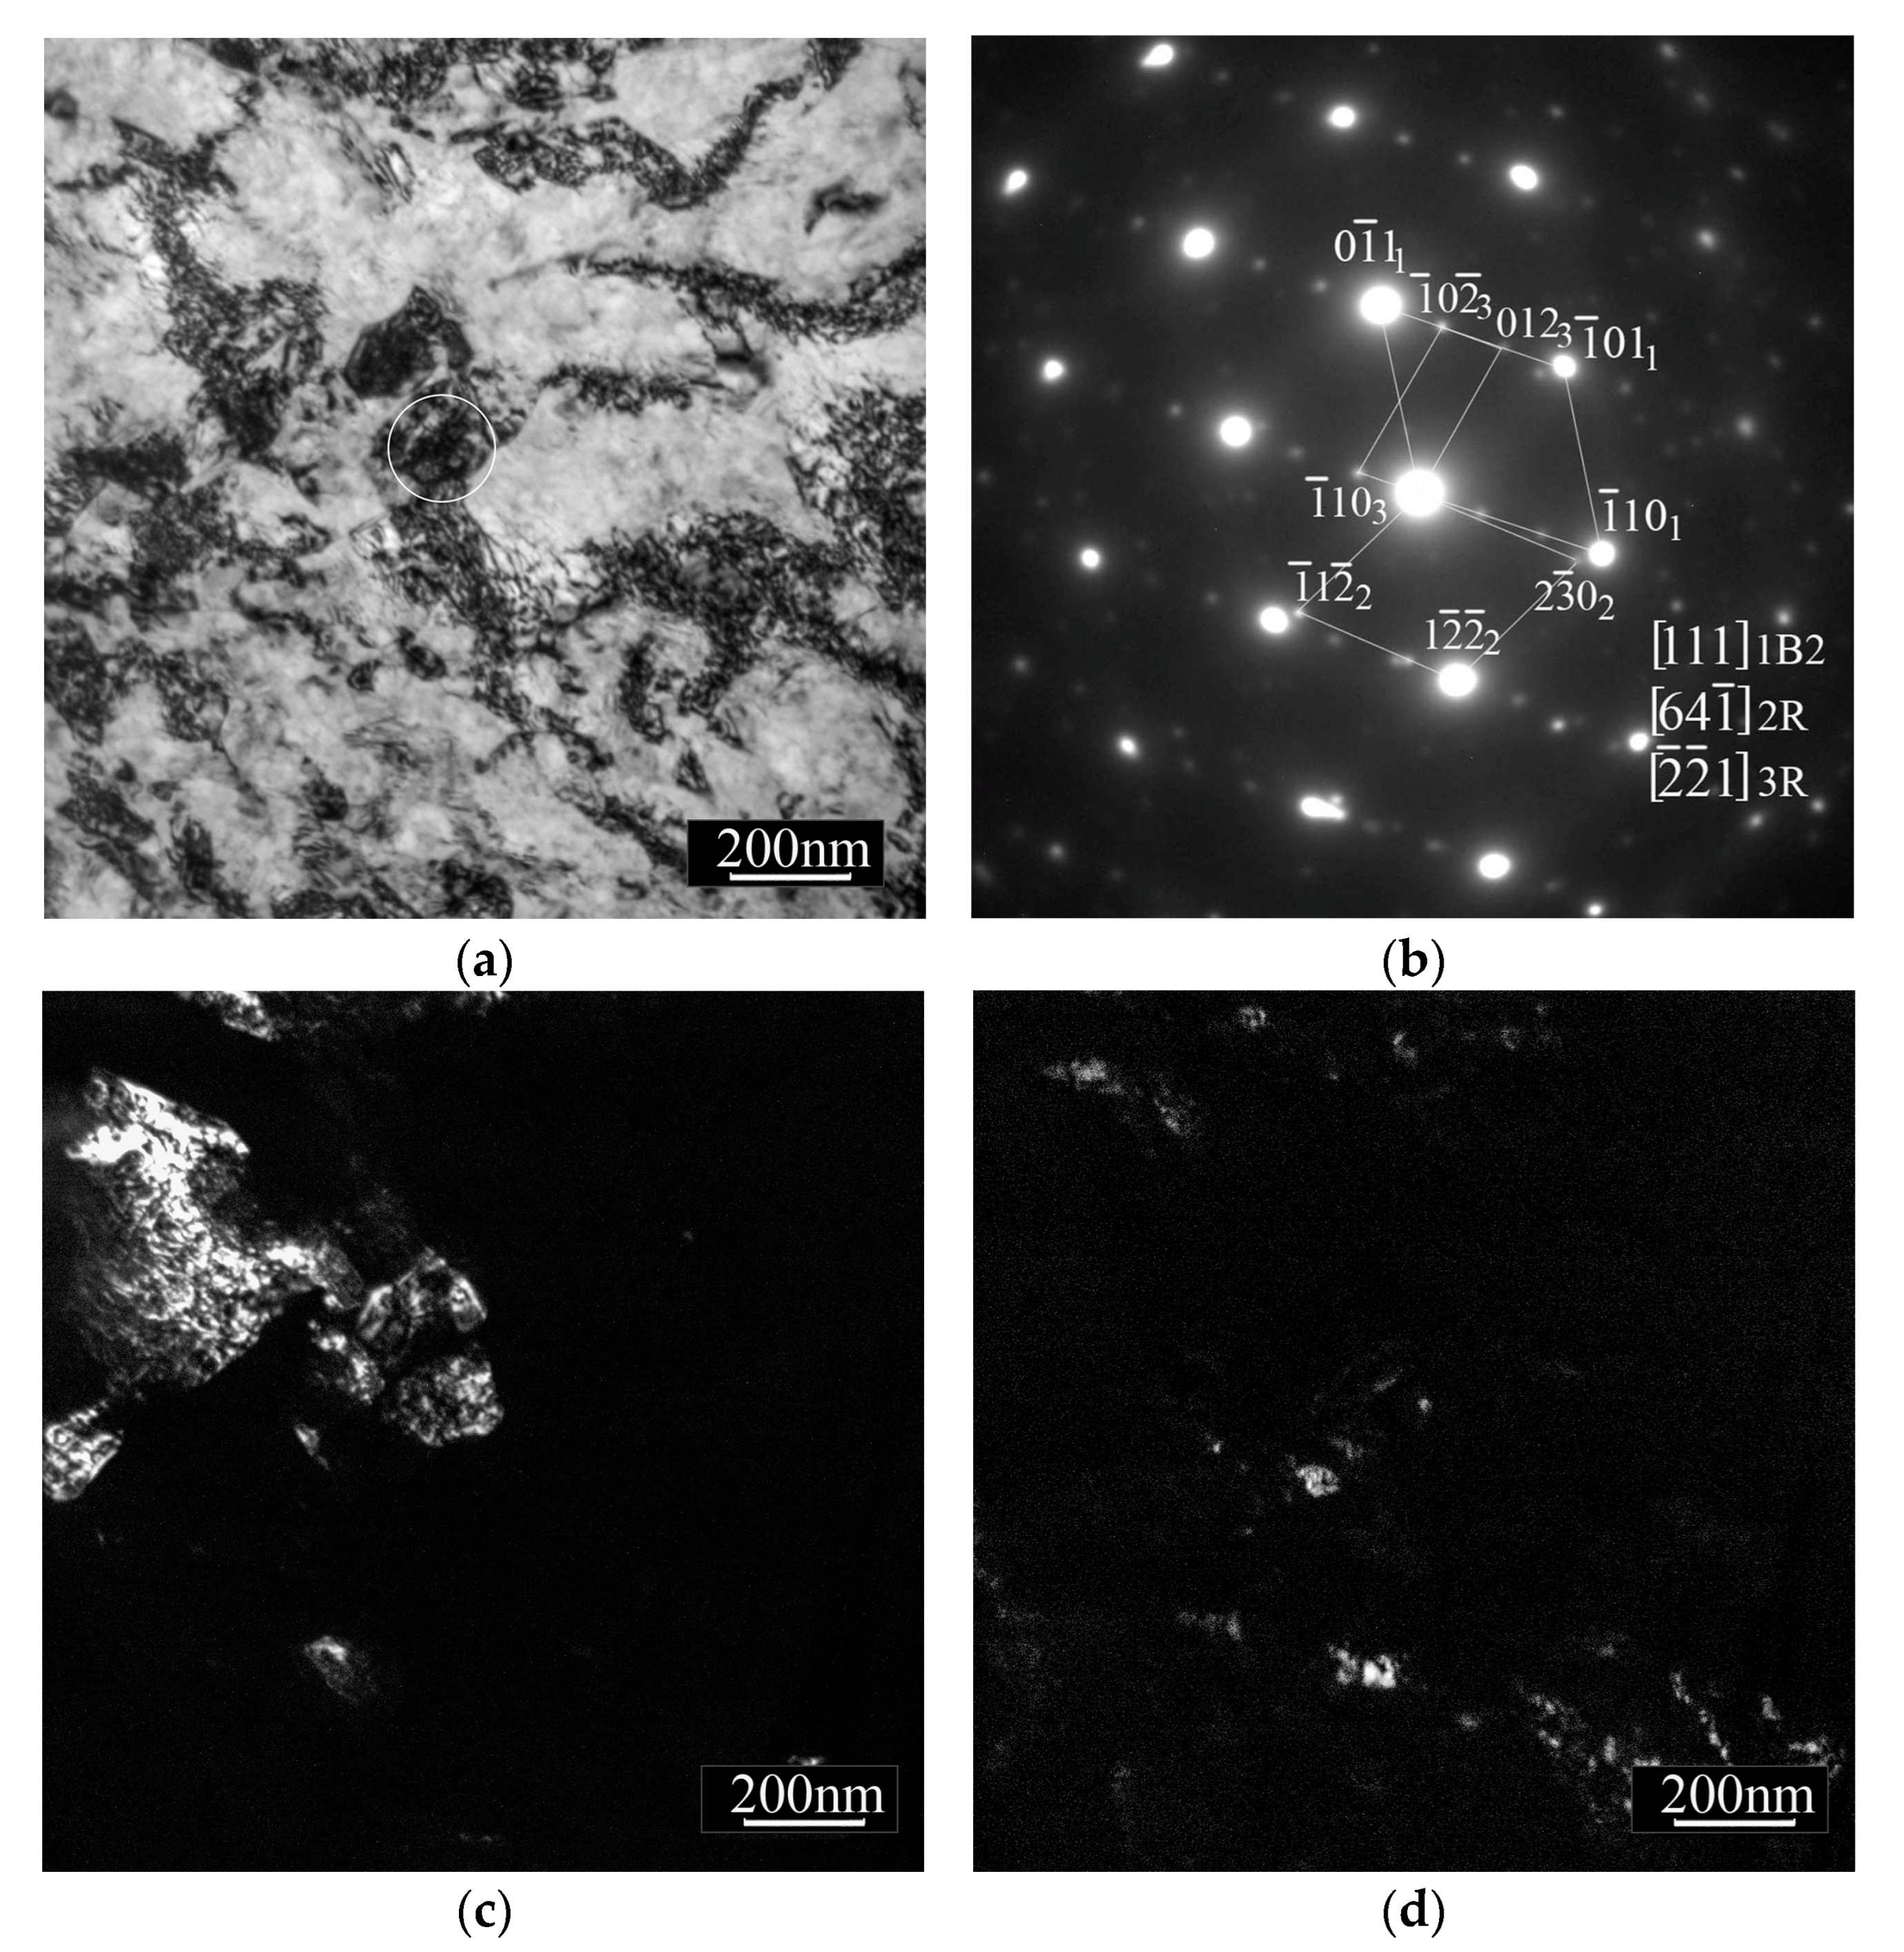
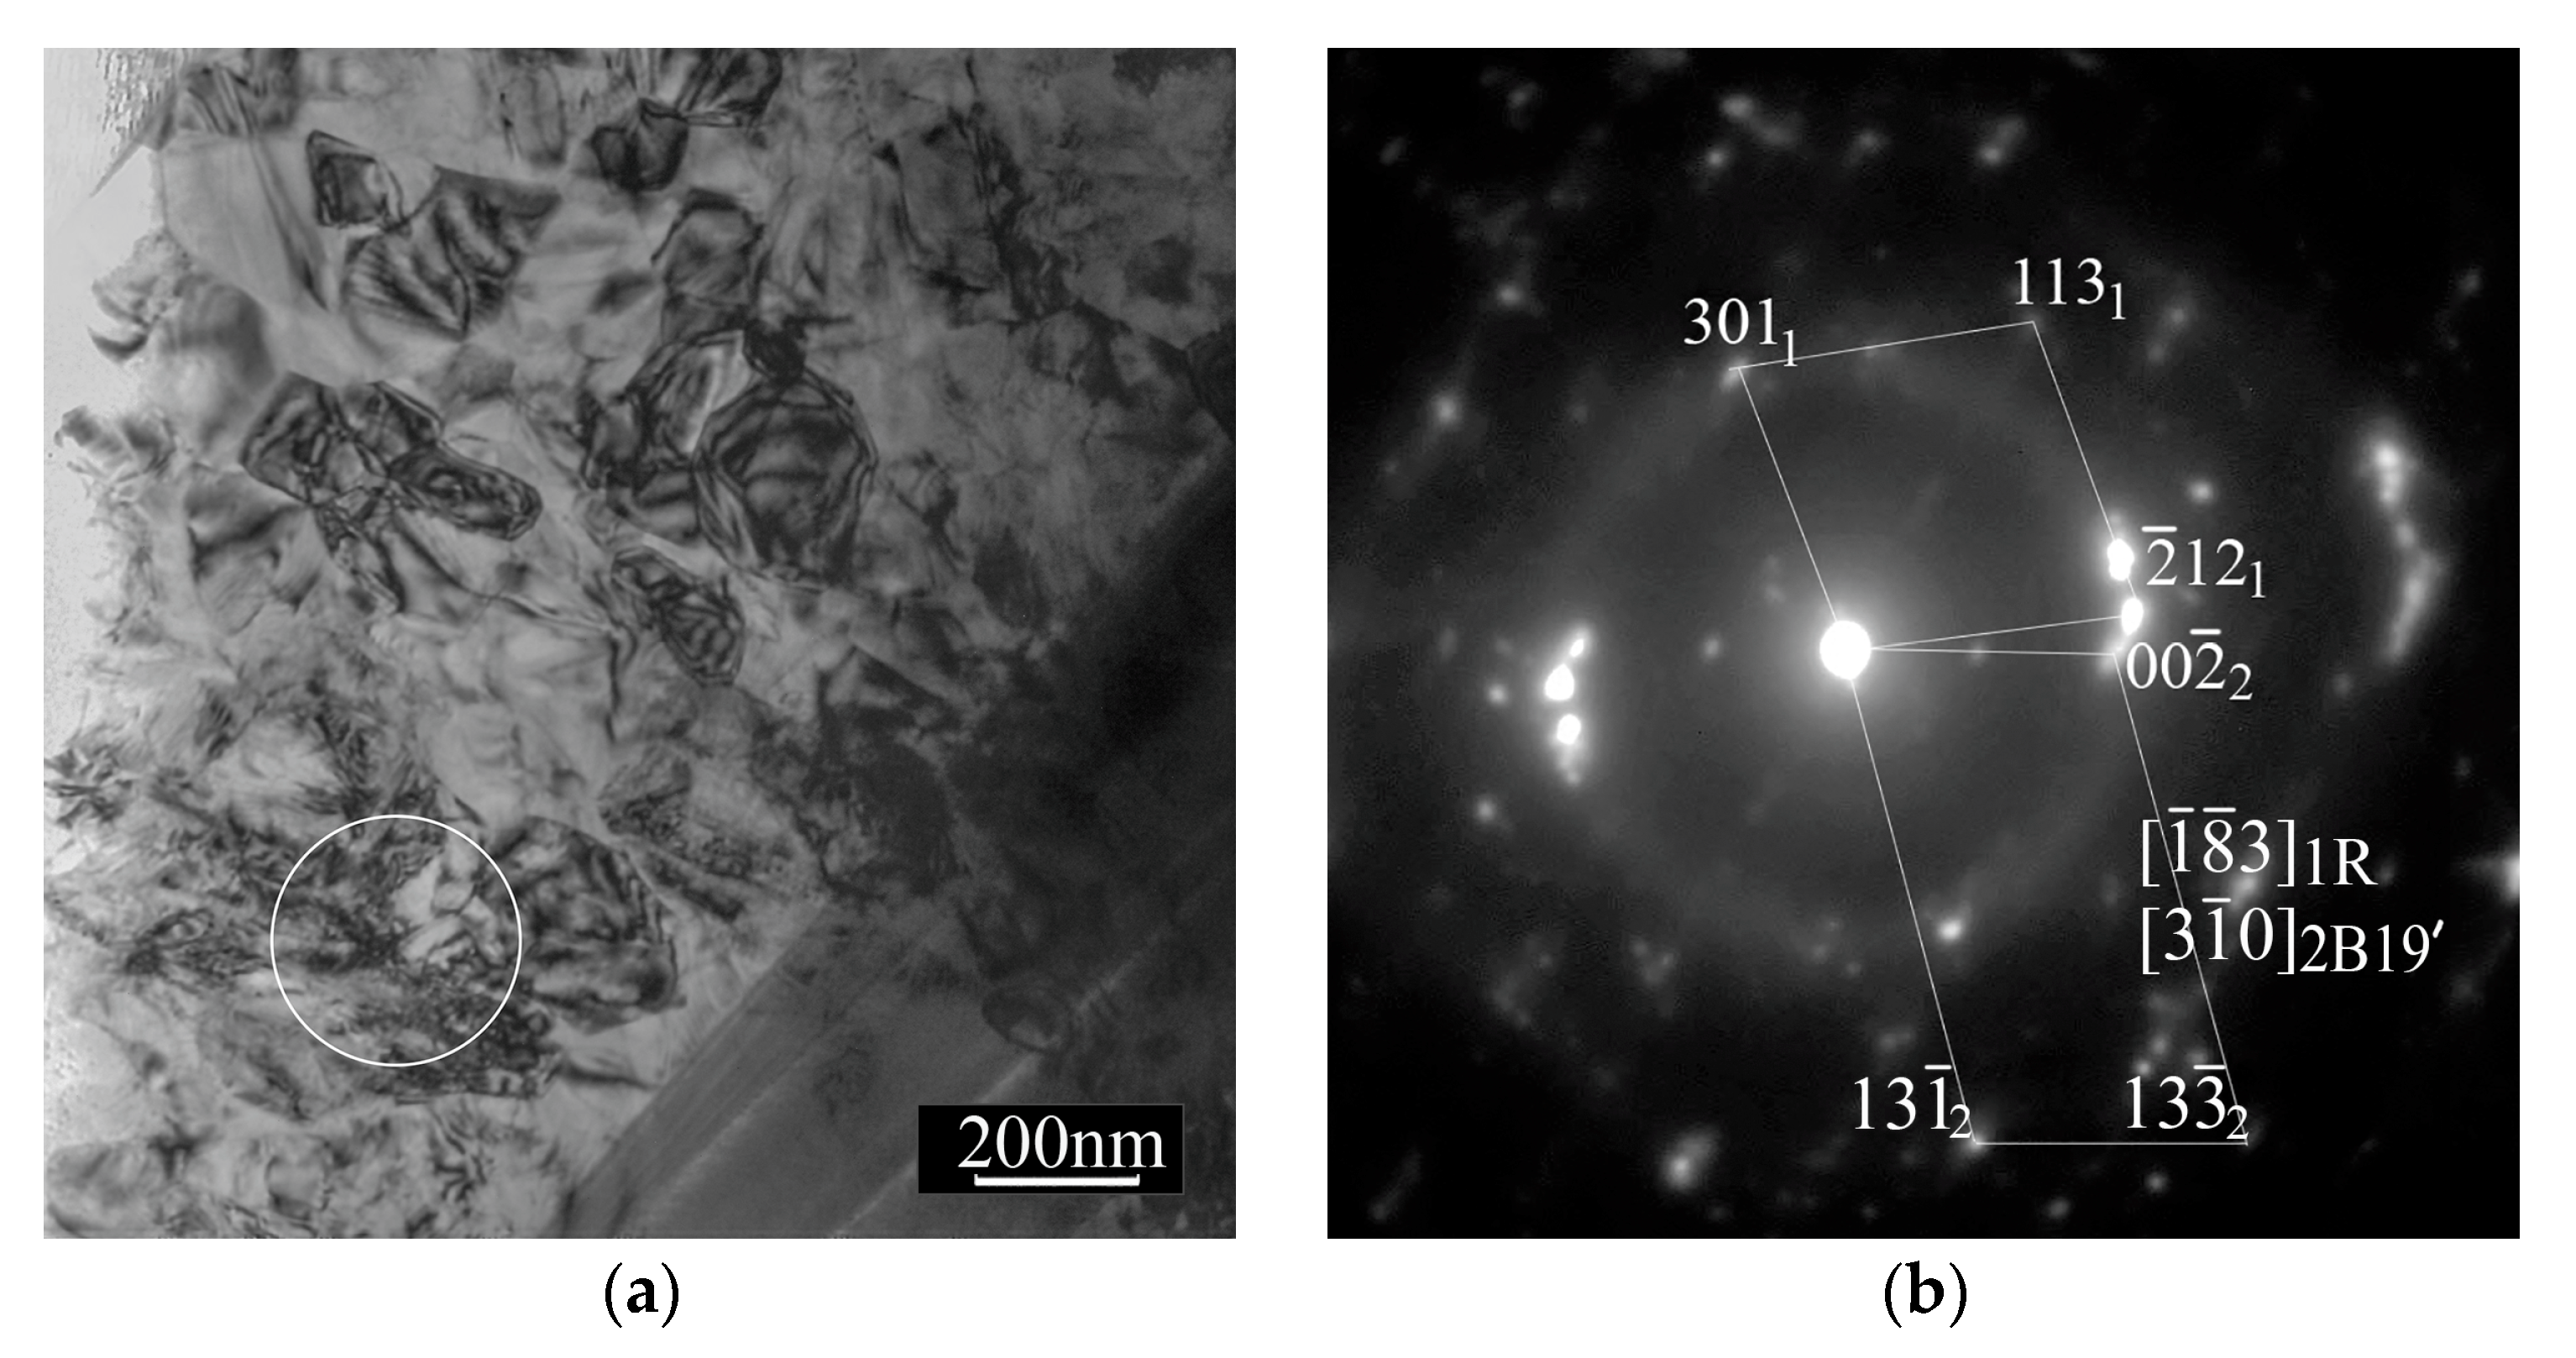
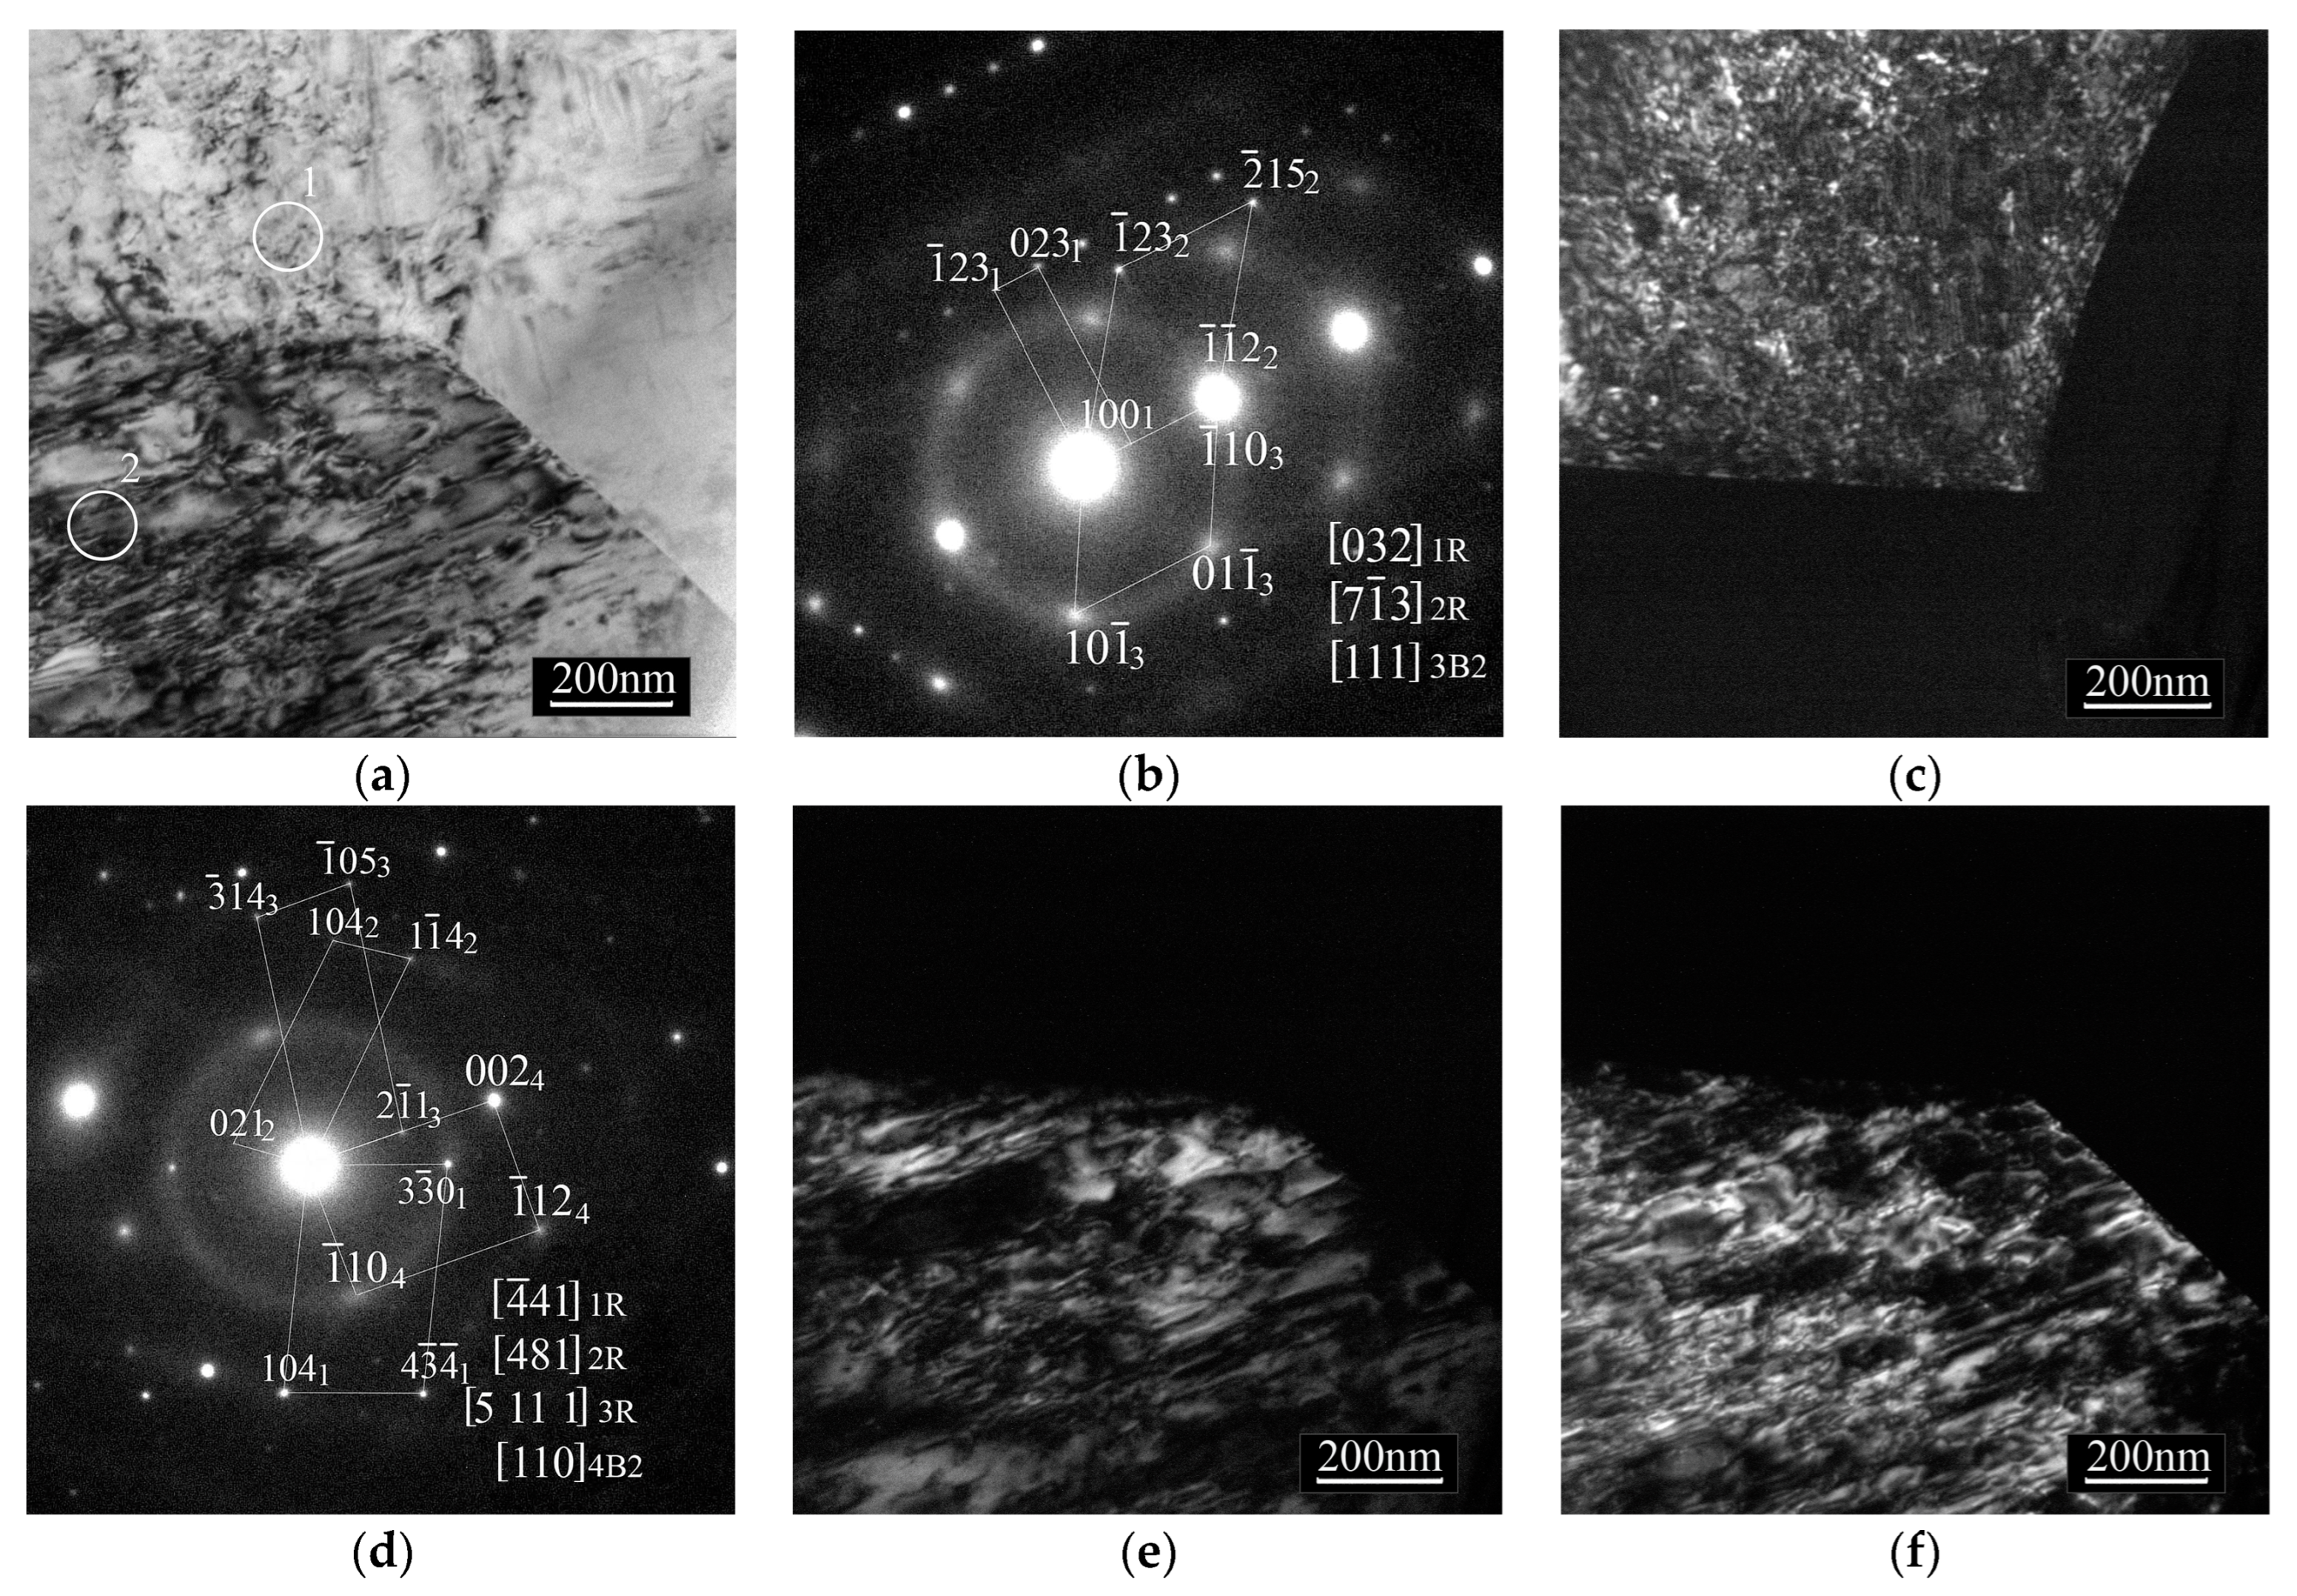
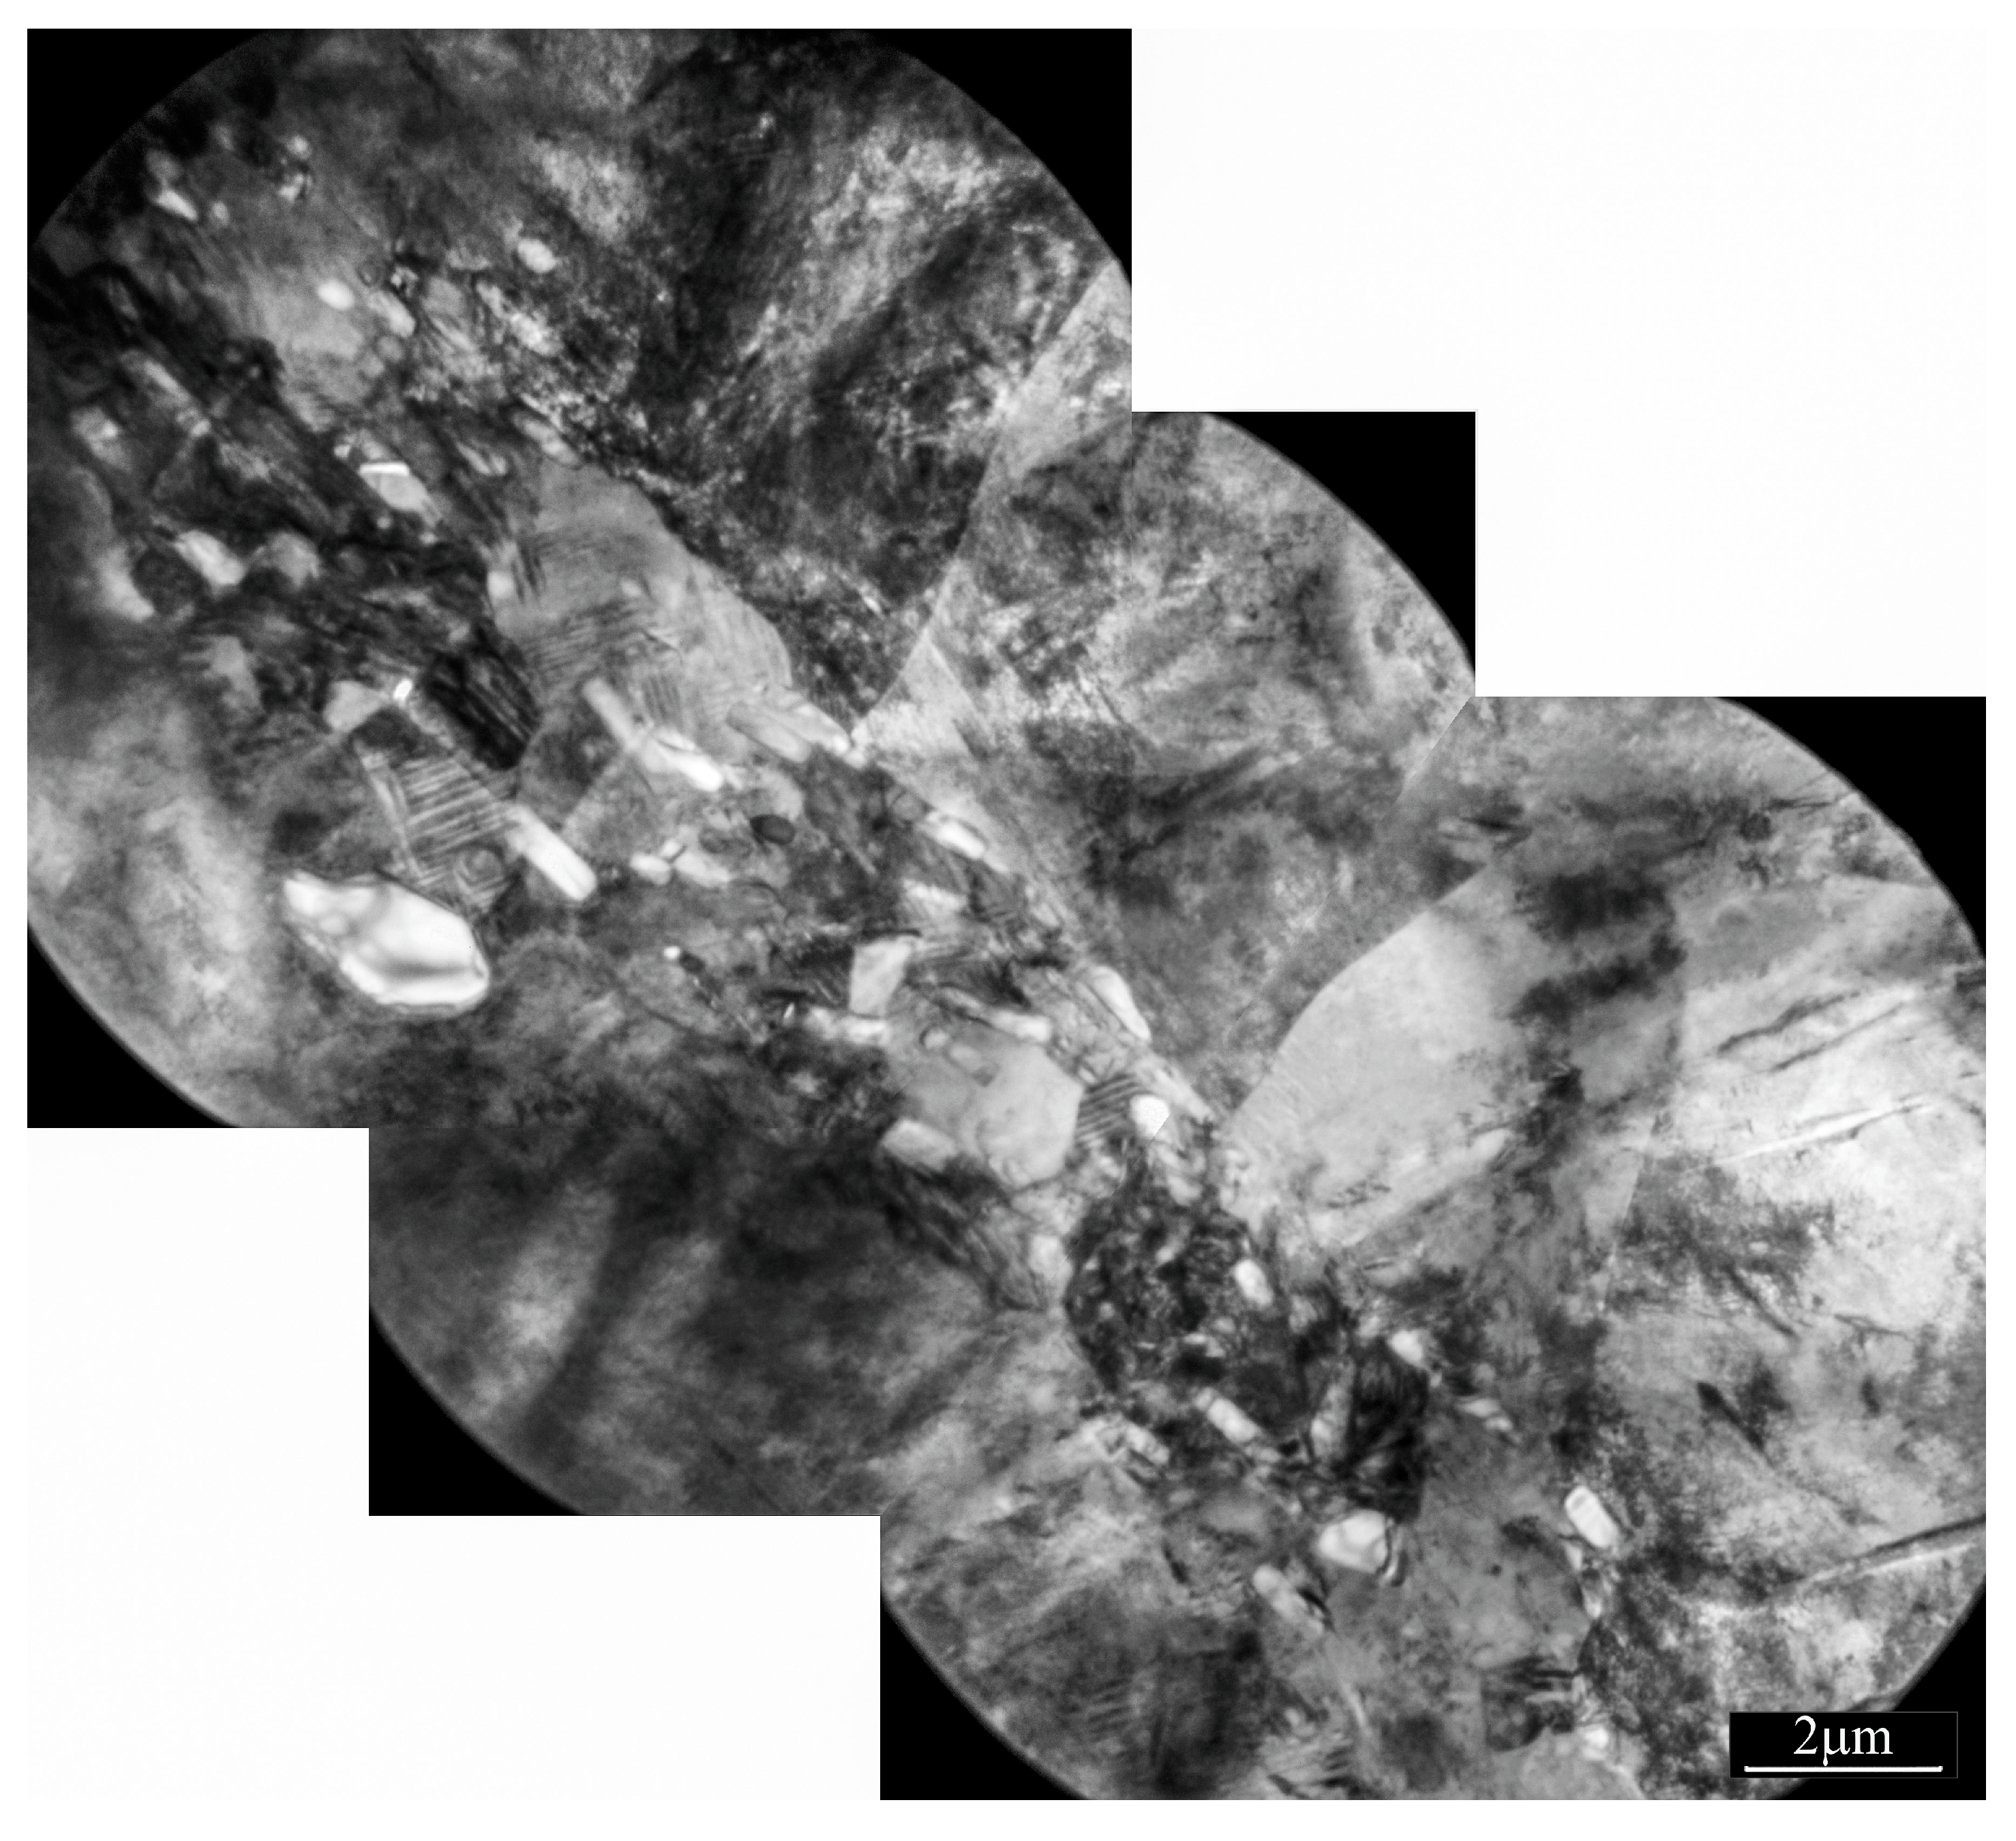
3.1. The Effect of Post-Deformation Annealing on Microstructure of Ti49.8Ni50.2 after abc Pressing with e = 9.55 at 573 K

The initial samples of Ti49.8Ni50.2 alloy after abc pressing at 573 K with e = 9.55 have a microband structure (Figure 1a) in which grain–subgrain conglomerates are surrounded by regions with a high density of dislocations. There is no characteristic contrast inside the grains–subgrains, which is observed in the presence of dislocations inside them. The maximum size of grain–subgrain conglomerates reaches ~250 nm. Inside the microbands, grains–subgrains with a size of 10–30 nm are observed. In the microdiffraction pattern (Figure 1b) obtained from the area circled in Figure 1a, there are reflections of the B19’ martensitic phase with a monoclinic lattice and the rhombohedral martensitic R phase. The microband character of the microstructure of the initial samples is clearly seen in the dark-field images obtained in the B19’ phase reflections of ( 11 1 ¯ ) type, highlighted in Figure 1b. The average grain–subgrain size estimated earlier in [17] is 130 ± 10 nm.
Figure 2a shows that after annealing for 1 h at a temperature of 573 K (equal to the temperature of abc pressing of the initial samples), the microstructure does not change significantly. The microband structure, in which grain–subgrain conglomerates are surrounded by regions with a high dislocation density, is preserved. The average grain–subgrain size is 124 ± 10 nm. In the microdiffraction pattern (Figure 2b) obtained from area 1 (Figure 2a), there is B19’ martensitic phase. The dark-field image (Figure 2c) shows a microband structure, including grains–subgrains with a regular structure of crystallites of the B19’ martensitic phase with sizes of 10–15 nm.
The microdiffraction pattern (Figure 2d) obtained from area 2 in Figure 2a, corresponds to the [111] zone of the B2 phase in pre-martensitic state. This pre-martensitic state of the B2 phase precedes the martensitic transformation B2→R and is characterized by the appearance of extra reflections of type 1 3 <110>, 1 3 <112> and a number of others [18]. In particular, there are extra reflections of type 1 3 < 1 ¯ 01 >, 1 3 < 1 1 ¯ 0 >, 1 3 < 2 ¯ 3 1 ¯ > in Figure 2d. The dark-field images of microstructure (Figure 2e,f) are obtained in the ( 01 1 ¯ ) B2 phase reflection and the extra reflection 1 3 < 2 ¯ 3 1 ¯ > (marked with an arrow in Figure 2d). The details of the microstructure presented in Figure 2e,f are qualitatively similar and include a grain–subgrain size from 10 nm to 200 nm. Large subgrains have a tweed contrast, which is typical of the microstructures of TiNi-based alloys, in which there are the B2 phases in the pre-martensitic state [18].
Figure 3a and Figure 4a show that in the microstructure of the samples annealed at 673 K, there are grain–subgrain conglomerates with a maximum size of 300 nm, similar to those observed earlier in the samples after annealing at 573 K (Figure 2a). The diffraction patterns from these grains show two (Figure 3b) or three (Figure 4b) zones corresponding to the rhombohedral martensitic R phase. The dark-field images obtained in the R phase reflections show both large conglomerates of grains–subgrains and nanosized grains (Figure 3c,d and Figure 4c). The average grain–subgrain size is 115 ± 10 nm. However, the microband structure of the samples after annealing at 673 K differs significantly from the microband structures of the initial samples (Figure 1a) and the samples after annealing at 573 K (Figure 2a). The microband structure of samples annealed at 673 K, is similar to the microstructure of a fast-frozen turbulent flow of liquid or gas. Inside the microbands, there is a significant amount of nanosized grains–subgrains (from 10 to 30 nm), which were formed locally as a result of the onset of the recrystallization process. Figure 3a and Figure 4a show the microstructures that are most frequently found in samples annealed at 673 K. The second type of microstructure of these samples is shown in Figure 5a, and is much less common. The microbands within this microstructure are predominantly oriented in one direction. In the microdiffraction pattern (Figure 5b) obtained from the central region of Figure 5a, there is the rhombohedral R phase. The dark-field images obtained in the ( 1 ¯ 1 ¯ 4) and (102) R phase reflections (Figure 5c,d, respectively) show grain–subgrain conglomerates (up to 200 nm in size) and a number of grains with sizes from 10 to 30 nm. Grains–subgrains after annealing at 673 K are characterized by the absence of faceting, which is typical of recrystallized grains. In general, the grain-subgrain boundaries after annealing at 673 K remain nonequilibrium.
Increasing the annealing temperature to 773 K (Figure 6 and Figure 7) leads to significant changes in the microstructure of the samples. Figure 6 and Figure 7 show that, as a result of annealing, a microstructure was formed, including a significant number of grains with a pronounced faceting. The boundaries of these grains are thin and clear-cut, which is a sign of high-angle boundaries. The average grain–subgrain size is 180 ± 10 nm. The phase composition of the grains is different. In the microdiffraction pattern (Figure 6b) obtained from the area marked with a circle in Figure 6a, there are both the B19’ martensitic phases with a monoclinic lattice and the rhombohedral martensitic R phase. Since the ( 00 2 ¯ ) B19’ phase and ( 2 ¯ 12 ) R phase reflections are close in position, the dark-field images (Figure 6c,d) obtained in these reflections include grains–subgrains with both R and B19’ phases. The microdiffraction pattern (Figure 7b) obtained from the central region of Figure 7a, marked with a circle, includes two zones of the rhombohedral R phase and a zone of the [111] B2 phase. The dark-field image (Figure 7c) shows a grain with a two-phase (B2 + R) structure, since the reflections ( 1 1 ¯ 0 ) of the B2 phase and ( 3 3 ¯ 0 ) of the R phase are close in position. The dark-field image (Figure 7d) obtained in the ( 3 1 ¯ 1 ) R phase reflection, shows a grain–subgrain conglomerate with a rhombohedral structure.
Thus, during annealing at 773 K, the beginning of recrystallization is realized. At the same time, the sizes of the formed grains do not exceed the submicrocrystalline scale (~200 nm). Recrystallization runs inhomogeneously over the volume of annealed samples. This is evidenced by the presence of dark zones with smaller grains-subgrains (10–30 nm) inside them, the microstructure of which is similar to the microstructure inside microbands after annealing at 673 K.
The grain growth rate sharply increases with an increase in the annealing temperature to 873 K (Figure 8a). Recrystallization is realized in the entire volume of the samples. The grains have an almost equiaxed shape (the angle between the boundaries in the triple junction is 120°). The average grain size is 2 ± 0.5 µm. The phase composition of the grains is the same. In the microdiffraction patterns (Figure 8b,d) obtained from regions 1 and 2 in Figure 8a, there are: one, a zone of the B2 phase (Figure 8b,d), two (in Figure 8b) and three (in Figure 8d) zones of the R phase. The orientations of these zones are significantly different, which causes a different morphology of the intragranular microstructure in the grains of regions 1 and 2. However, in the volumes of each of these grains, dark-field images show a uniform morphology of the intragranular microstructure.
The microstructure of the samples after annealing at 973 K is qualitatively similar to the microstructure of the samples after annealing at 873 K. The bright-field image of the large area (size 24 × 12 µm2) of the microstructure of recrystallized samples after annealing at 973 K is shown in Figure 9. Annealed samples have a microcrystalline structure with an average grain size of 5 ± 0.5 µm. At the same time, the grain boundaries have a noticeable curvature. The B2 phase and the martensitic phases R and B19’ are observed in the samples. It should be noted that the evolution of the phase composition of samples during post-deformation isochronous annealing at 573–973 K is confirmed by X-ray diffraction studies, the results of which will be published in [19].
The dependence of the average grain–subgrain size, <d>, obtained from the analysis of dark-field images of the microstructure, on the temperature of isochronous annealings is shown in Figure 10. It can be seen from Figure 10 that annealing at temperatures up to 673 K has a very weak effect on <d>. A significant increase in <d> is observed as a result of the development of the recrystallization of samples at temperatures from 773 K to 973 K. In this case, the microstructure of samples is transformed from submicrocrystalline to microcrystalline with grain sizes reaching several micrometers.

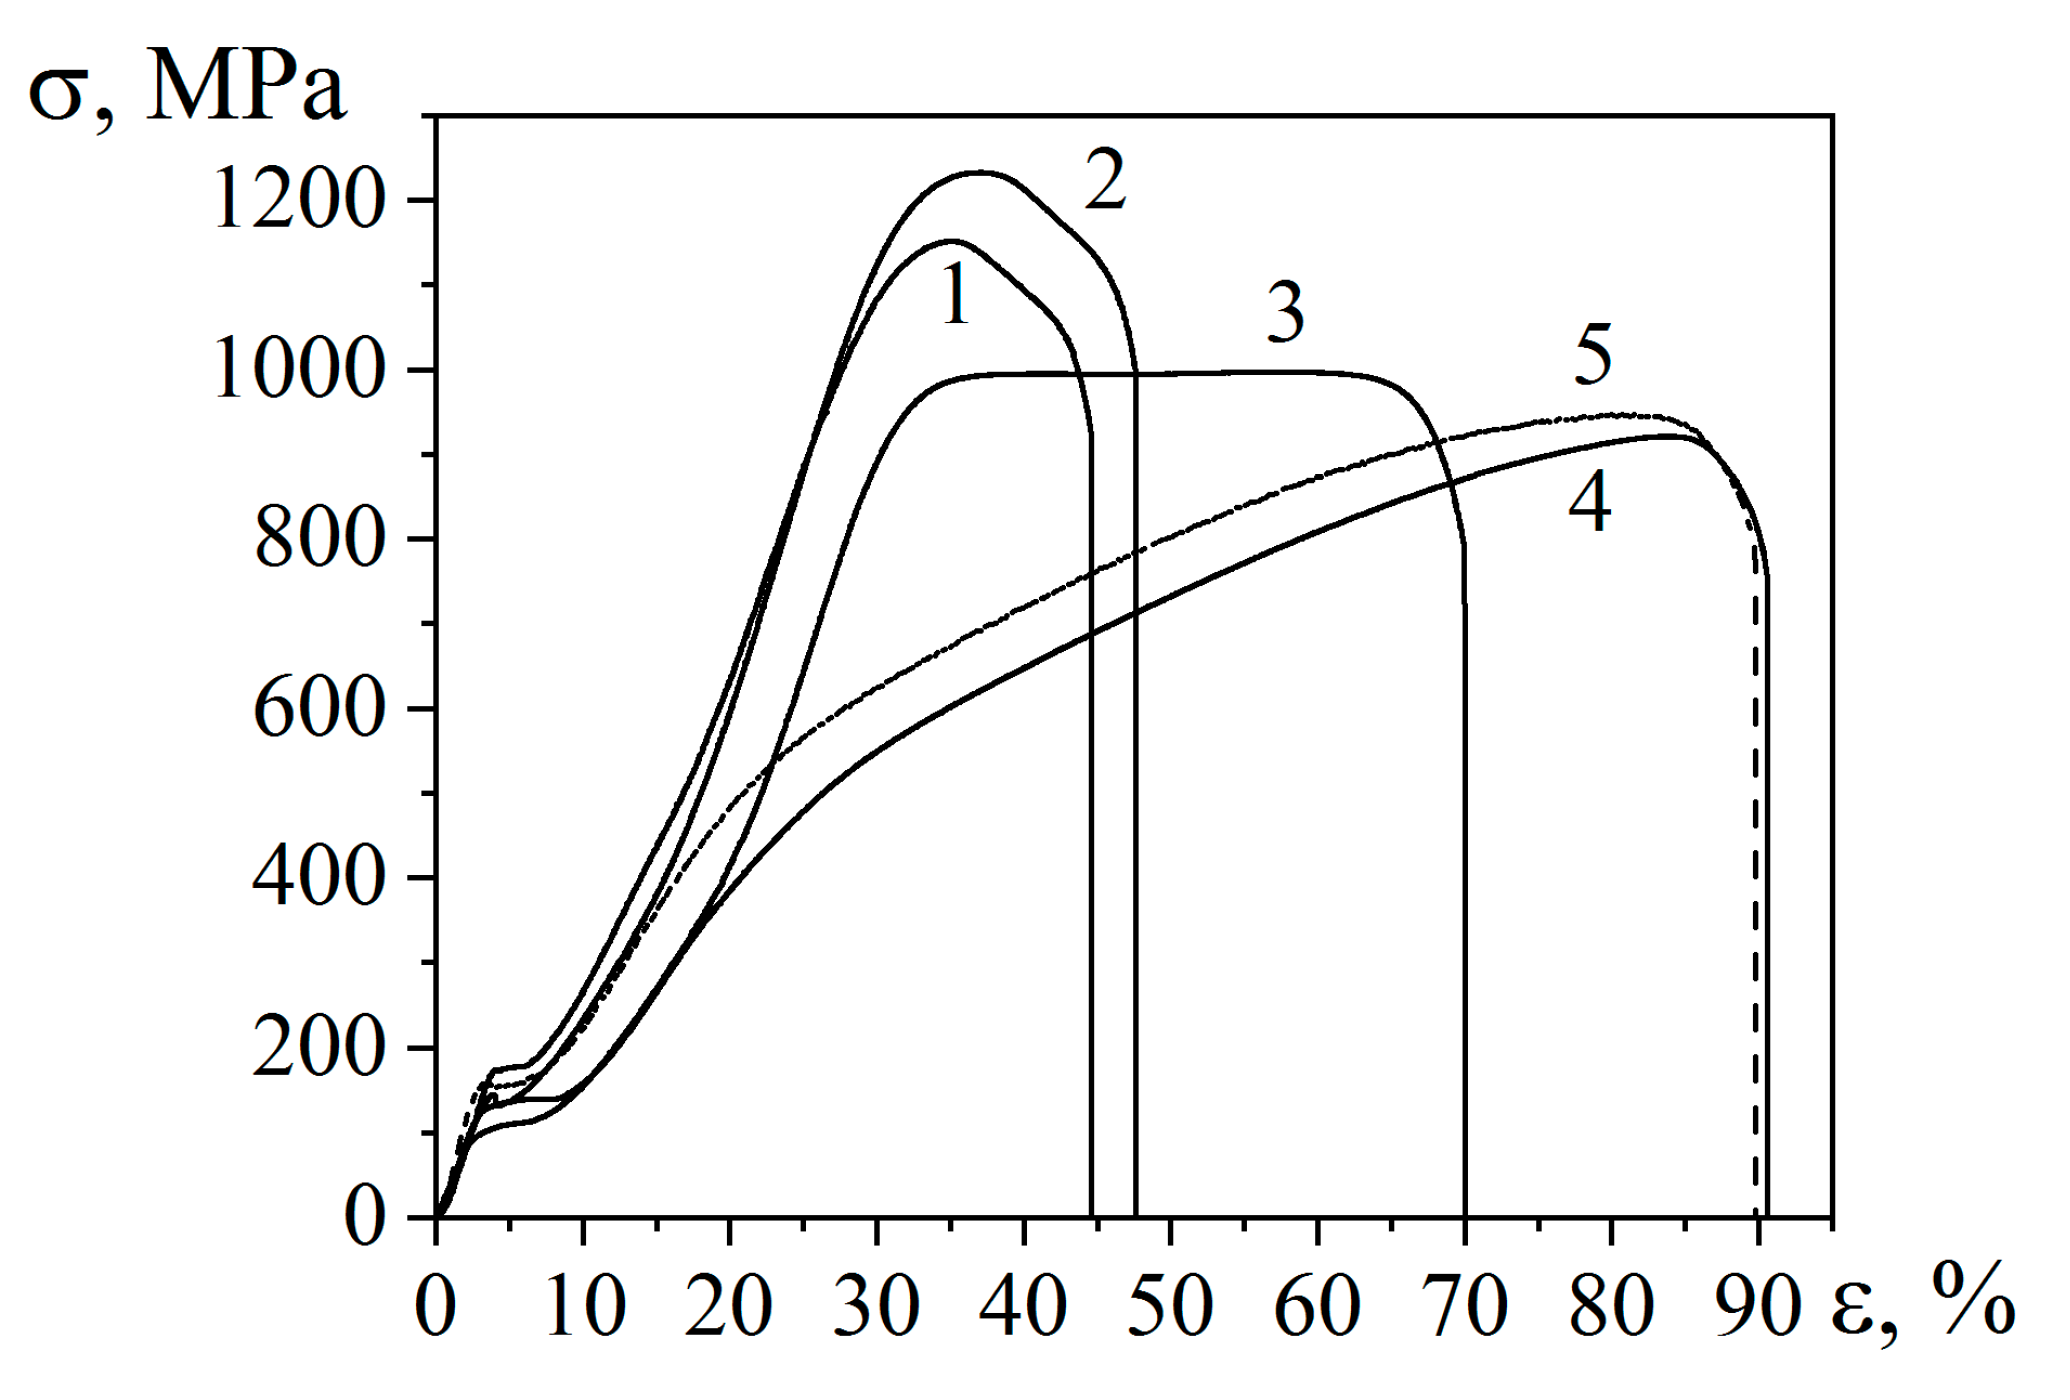
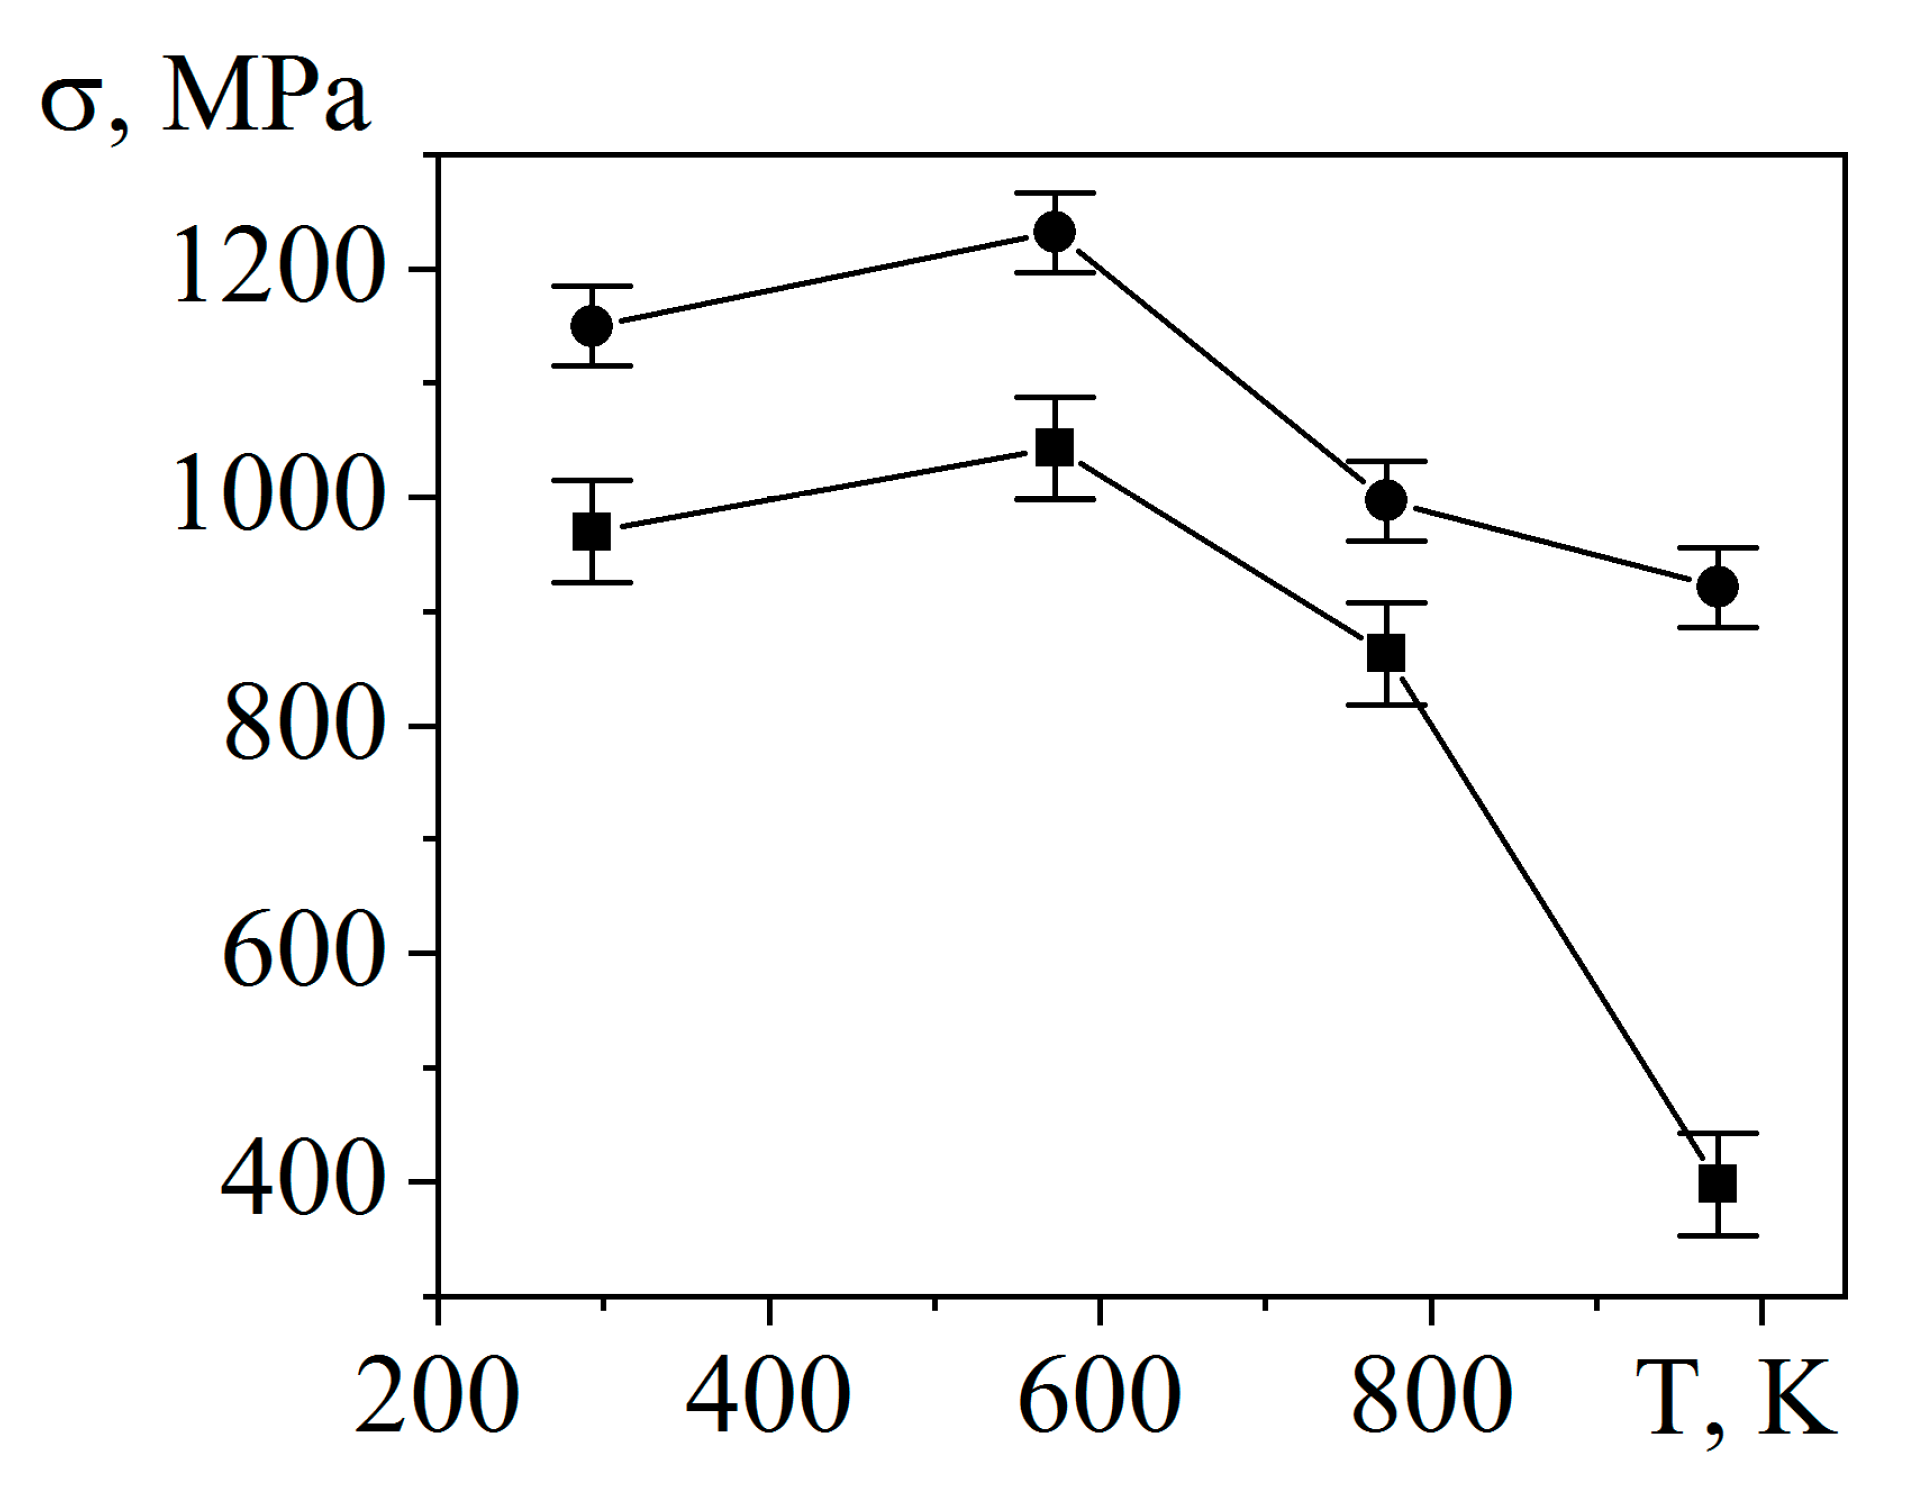
3.2. The Effect of Post-Deformation Isochronous Annealing on the Mechanical Properties of Ti49.8Ni50.2 after abc Pressing with e = 9.55 at 573 K

The evolution of the structural-phase state of the samples with a change in the isochronous annealing temperatures, presented in the first part of the work, causes a change in their mechanical properties. The mechanical properties of the samples were studied under isothermal (298 K) tensile deformation. The “stress–strain” (σ–ε) dependences of the initial and annealed samples are shown in Figure 11. Figure 11 shows that the form of the “σ–ε” curves changes significantly with increasing annealing temperature. An increase in stress up to σ = σm leads to a linear development of deformation at the initial stage of samples tensile, regardless of the isochronous annealings temperatures. At stresses σ > σm, a pseudoyield plateau is observed due to both the reorientation of the martensitic domains of B19’ martensite and the formation of stress induced martensite during martensitic transformations B2→B19’, R→B19’, or B2→R→B19’. The presence of the B2, R, and B19’ phases in the composition of the samples was observed during studies of the microstructure of the samples, the results of which are given above. However, the specific physical processes responsible for the development of the pseudoyield plateau are currently under study and will be discussed in subsequent work.
With a further increase in the applied stress, a transition to the stage of almost linear development of deformation is observed up to σ = σy, where σy is the yield stress, determined by a deviation of 0.2% from the previous linear dependence σ-ε. The effect of annealing temperature on σy is shown in Figure 12. Figure 12 shows that σy equal to 970 ± 45 MPa in the samples immediately after pressing abc with e = 9.55 at 573 K, after additional annealing at the same temperature (573 K) increases to 1043 ± 45 MPa. An increase in the temperature of isochronous annealings to 773 K and 973 K leads to a significant decrease in σy (to 863 ± 45 MPa and 400 ± 45 MPa, respectively). The ultimate tensile strength of the material, σUTS, is quickly reached with increasing stresses σ > σy, both in the initial samples after pressing abc with e = 9.55 at 573 K, and in the samples after additional annealing for 1 h at 573 K, Figure 11. After annealing at 773 K, the “σ–ε” dependence shows a long stage (∆ε~30%), in which the development of deformation occurs at almost constant stress, Figure 11. This stage is known as the stage of steady plastic flow, in which the processes of hardening and softening are compensated [20]. After annealing at 973 K, the development of plastic deformation at σ > σy is realized according to the parabolic σ–ε dependence.
The influence of annealings on the ultimate tensile strength, σUTS, of the samples is shown in Figure 12. It can be seen from Figure 12 that after annealing at 573 K, σUTS (equal to 1232 ± 35 MPa) exceeds σUTS in the initial samples (1150 ± 35 MPa). Annealing at 773 K leads to softening of the samples (σUTS decreases from 1232 ± 35 MPa to 1000 ± 35 MPa). After annealing at 973 K, the decrease in σUTS is less significant (up to 920 ± 35 MPa). Figure 11 shows that at stresses exceeding the ultimate tensile strength, a rapid localization of deformation, the formation of a neck and the destruction of samples are observed. The width of the strain interval from the onset of neck formation to fracture of the specimens is almost independent of the annealing temperature and amounts to ~10%. The decrease in σy and σUTS with an increase in the annealing temperature is accompanied by an increase in the plasticity of the samples.
Figure 13 shows the dependence of the samples’ fracture strain, εf, on annealing temperature. Annealing at 573 K has almost no effect on εf. After annealing at temperatures from 573 K to 973 K, εf increased almost linearly from 48% to 90%. For comparison, Figure 11 shows the σ–ε curves of a coarse-grained (an average grain size is 26 μm) sample obtained after one cycle of abc pressing at 1073 K before abc pressing at 573 K. It can be seen that εf of samples annealed for 1 h at 973 K and having a microcrystalline structure, almost does not differ from εf of a coarse-grained sample. In this case, σy and σUTS of a coarse-grained sample and a sample with a microcrystalline structure after abc pressing with e = 9.55 at 573 K and subsequent annealing at 973 K also differ insignificantly: σUTS is 945 ± 35 MPa and 921 ± 35 MPa, respectively, and σy is 435 ± 45 MPa and 398 ± 45 MPa, respectively. Thus, the dependences σ–ε for the coarse-grained sample and the sample after abc pressing with e = 9.55 at 573 K followed by annealing at 973 K are qualitatively similar and their quantitative parameters are close.

4. Discussion

The presence of conglomerates of grains–subgrains, which are surrounded by regions with a high density of dislocations, in the microband structure of the initial alloy samples (after abc pressing at 573 K with e = 9.55) indicates that these grains–subgrains were formed according to the dislocation–disclination mechanism of dynamic recrystallization during abc pressing. This idea is supported by the absence of a characteristic contrast inside the grains–subgrains, which is observed in the presence of dislocations inside them.
After annealing for 1 h at 573 K, the structural-phase state of the samples does not change significantly: the microband structure with grain–subgrain conglomerates surrounded by regions with a high dislocation density is preserved, as well as the B19’ phase. This result is not surprising since the annealing temperature is equal to the temperature of abc pressing. At the same time, it can be noted that instead of reflections of the R phase, the microdiffraction patterns show reflections of the B2 phase with extra reflections of type 1 3 <110>, 1 3 <112>. The presence of these extra reflections indicates that the B2 phase is in the pre-martensitic state, which precedes the formation of the martensitic R phase [18]. In addition, large subgrains have a tweed contrast, which is also characteristic of the microstructures of TiNi-based alloys, in which the B2 phase is in the pre-martensitic state [18]. This is to say that after annealing for 1 h at 573 K some redistribution of dislocations and, consequently, elastic stresses in the samples did occur.
No dramatic changes are observed in the microstructure of the samples after annealing at 673 K: there are also grain–subgrain conglomerates similar to those observed in the samples after annealing at 573 K. However, the maximum size of these conglomerates increased to 300 nm. The phase composition of grains–subgrains also changed: instead of the pre-martensitic state of the B2 phase, a formed rhombohedral R phase is observed. At the same time, it is interesting to note that the microband structure of the samples after annealing at 673 K differs significantly from the microband structures of the initial samples (Figure 1a) and the samples after annealing at 573 K (Figure 2a). The microband structure of the samples annealed at 673 K (Figure 3a and Figure 4a) is similar to the microstructure of a fast-frozen turbulent flow of liquid or gas. We have never observed such a microstructure before either in our studies or in previously published works of other authors. In samples annealed at 673 K, the microstructures presented in Figure 3a and Figure 4a are found most frequently. In the microbands of these microstructures, there is a significant amount of nanosized grains–subgrains (from 10 to 30 nm), which were formed locally due to the onset of the recrystallization process. The second type of microstructure of these samples, which is shown in Figure 5a, is much less common. The microbands of this microstructure are predominantly oriented in one direction. In the dark-field images (Figure 5c,d), conglomerates of grains–subgrains (up to 200 nm in size) and a number of grains with sizes from 10 to 30 nm are observed. The absence of faceting in the grains–subgrains after annealing at 673 K is indicative of the initial stage of the recrystallization process. It means that the grain–subgrain boundaries remain nonequilibrium after annealing at 673 K.
An increase in the annealing temperature to 773 K led to a notable change in the microstructure of the samples. Figure 6 and Figure 7 show that a significant number of grains with pronounced faceting formed in the microstructure during annealing. The boundaries of these grains are thin and clear, which is a sign of high-angle boundaries. The phase composition of the grains is different, and the reason for this may be the inhomogeneous distribution of Ti and Ni atoms and elastic stresses in the bulk of the samples. Obviously, at 773 K, an active recrystallization process starts, which proceeds inhomogeneously in different sample volumes, and the size of the formed grains does not exceed the submicrocrystalline scale (~200 nm).
The recrystallization process is realized in the entire volume of the samples annealed at 873 K. The grain growth rate sharply increases (Figure 8a). The grains have an almost equiaxed shape (the angle between the boundaries in the triple junction is 120°). A fine-grained structure with an average grain size of about 2 µm is formed in the alloy samples. The grains have the same phase composition and contain B2 and R phases.
The microstructure of the samples after annealing at 973 K is qualitatively similar to the microstructure of the samples during annealing at 873 K, Figure 9. The samples have a microcrystalline structure with grain sizes from 0.3 µm to 6 µm. The presence of curvature at the grain boundaries is due to their higher mobility than during annealing at 873 K. This is apparently due to the active growth of grains as a result of the development of secondary recrystallization. In the samples, the B2 phase and the martensitic phases R and B19’ are observed. The tendency for a decrease in the average grain–subgrain size during annealing of samples in the temperature range of 573–773 K can be due to the formation of a certain fraction of grains–subgrains with sizes which are smaller than after abc pressing.
The results of studies of the effect of isochronous (1 h) annealings on the mechanical properties of the Ti49.8Ni50.2 (at.%) alloy exposed to abc pressing at 573 K show that σy and σUTS of the samples decrease with increasing grain–subgrain sizes. In this case, σy and σUTS reach their minimum values after complete recrystallization. The structure of the samples becomes microcrystalline with grain sizes up to several micrometers (after annealing at 873 K and 973 K—2 μm and 6 μm, respectively). In samples recrystallized at 973 K, the σ-ε dependences, the values of the σy and σUTS become close to σ–ε, σy and σUTS of coarse-grained alloy samples before abc pressing at 573 K. Similar changes in the σ-ε dependences, also in the values of the σy and σUTS were observed in [14] as a result of post-deformation annealing of TiNi-based alloys after SPD by equal channel angular pressing and high-pressure torsion.
The most probable reason for the softening of TiNi-based alloys obtained by SPD during subsequent isochronous annealings is a decrease in the dislocation density in them. This is confirmed by the results of [21], in which the dislocation density in the Ti49.5Ni50.5 (at.%) alloy samples obtained by cold drawing with a reduction of 39% as a result of isochronous annealings for 10 min at temperatures of 573–773 K was determined by X-ray diffraction analysis. Shi et al. [21] shown that the dislocation density decreases from 6.7 × 10¹⁵ m−2 (after annealing at 573 K) to 1.1 × 10¹⁵ m−2 with an increase in the annealing temperature to 723 K. In this case, the average grain–subgrain size changes from 10 nm to 47 nm, respectively. Qualitatively similar results were also obtained in the X-ray diffraction study of the dislocation density after isochronous annealing for 1 h of Ti49.8Ni50.2 (at.%) alloy samples subjected to abc pressing with e = 9.55 at 573 K [19]. With an increase in the annealing temperature to 973 K, the dislocation density decreased from 2.4 × 10¹⁵ m−2 to 0.7 × 10¹⁴ m−2.

5. Conclusions

It was shown that the grain–subgrain structure of Ti49.8Ni50.2 (at.%) alloy samples after isochronous annealings for 1 h in the temperature range of 573–673 K changed slightly. The microband structure of the samples, formed during abc pressing at 573 K, is preserved; conglomerates of grains–subgrains up to 200 nm were observed. Regions with a microband structure which is similar to the microstructure of fast-frozen turbulent liquid flow were found in samples annealed at 673 K. The temperature of the onset of the recrystallization process is 673 K. However, the grain–subgrain faceting is absent in this case and the grain–subgrain boundaries remain nonequilibrium.
It has been established that at 773 K, an active recrystallization process starts. The recrystallization proceeds inhomogeneously in different sample volumes, and the size of the grains does not exceed the submicrocrystalline scale (~200 nm). A significant number of grains with high-angle boundaries are formed in the microstructure. At 873 K, the recrystallization process occurs in the entire volume of the samples. The grains are almost equiaxed with an average size of 2 ± 0.5 µm. The microstructure of the samples after annealing at 973 K is qualitatively similar to the microstructure of the samples after annealing at 873 K; the samples have a microcrystalline structure with an average grain size of 5 ± 0.5 µm.
It has been established that the phase composition of the samples as a result of isochronous annealing at 573–973 K changes from R and B19’ immediately after abc pressing to a three-phase state: B2, R and B19’ phases.
It was shown that post-deformation isochronous (1 h) annealings of samples manufactured by abc pressing with e = 9.55 at 573 K leads to the decreasing of yield stress (from 1043 MPa to 400 MPa) and ultimate tensile strength (from 1232 MPa to 920 MPa) with increases of the annealing temperature from 573 K to 973 K, and the deformation to the sample fracture increases linearly from 48% to 90%. At the same time, the σ-ε dependence of recrystallized samples with microcrystalline structure (grain size ≤ 6 μm) after annealing at 973 K is qualitatively similar to the σ-ε dependence of coarse-grained (average grain sizes 27 μm) samples (the initial state before the abc pressing at 573 K).

Author Contributions

Conceptualization, A.L. and V.G.; formal analysis, A.L., V.G., R.L. and A.G.; investigation, V.G., D.Z., N.G. and A.G.; writing—original draft preparation, V.G.; writing—review and editing, A.L. and V.G.; project administration, A.L.; funding acquisition, A.L. All authors have read and agreed to the published version of the manuscript.

Funding

This research was funded by Government research assignment for ISPMS SB RAS (project FWRW-2021-0004).

Data Availability Statement

Not applicable.

Conflicts of Interest

The authors declare no conflict of interest. The funders had no role in the design of the study; in the collection, analyses, or interpretation of data; in the writing of the manuscript; or in the decision to publish the results.

References

  1. Estrin, Y.; Vinogradov, A. Extreme grain refinement by severe plastic deformation: A wealth of challenging science. Acta Mater. 2013, 61, 782–817. [Google Scholar] [CrossRef]
  2. Meyers, M.A.; Mishra, A.; Benson, D.J. Mechanical properties of nanocrystalline materials. Prog. Mater. Sci. 2006, 51, 427–556. [Google Scholar] [CrossRef]
  3. Utyashev, F.Z.; Beygelzimer, Y.E.; Valiev, R.Z. Large and Severe Plastic Deformation of Metals: Similarities and Differences in Flow Mechanics and Structure Formation. Adv. Eng. Mater. 2021, 23, 2100110. [Google Scholar] [CrossRef]
  4. Valiyev, R.Z.; Aleksandrov, I.A. Bulk Nanostructure Metal Materials: Obtaining, Structure and Properties; Akademkniga: Moscow, Russia, 2007; p. 398. [Google Scholar]
  5. Semenova, I.P.; Polyakov, A.V.; Pesin, M.V.; Stotskiy, A.G.; Modina, Y.M.; Valiev, R.Z.; Langdon, T.G. Strength and FaligueLife at 625 K of the Ultrafine-Grained Ti-6Al-4V Alloy Produced by Equal-Channel Angular Pressing. Metals 2022, 12, 1345. [Google Scholar] [CrossRef]
  6. Cao, Y.; Ni, S.; Liao, X.; Song, M.; Zhu, Y. Structural evolutions of metallic materials processed by severe plastic deformation. Mater. Sci. Eng. R Reports 2018, 133, 1–59. [Google Scholar] [CrossRef]
  7. Edalati, K.; Bachmaier, A.; Beloshenko, V.A.; Beygelzimer, Y.; Blank, V.D. Nanomaterials by severe plastic deformation: Review of historical developments and recent advances. Mater. Res. Lett. 2022, 10, 163–256. [Google Scholar] [CrossRef]
  8. Bagherpour, E.; Pardis, N.; Reihanian, M.; Ebrahimi, R. An overview on severe plastic deformation: Research status, techniques classification, microstructure evolution, and applications. Int. J. Adv. Manuf. Technol. 2019, 100, 1647–1694. [Google Scholar] [CrossRef]
  9. Valiev, R.Z.; Straumal, B.; Langdon, T.G. Using Severe Plastic Deformation to Produce Nanostructured Materials with Superior Properties. Annu. Rev. Mater. Res. 2022, 52, 357–382. [Google Scholar] [CrossRef]
  10. Yurchenko, L.I.; Dyupin, A.P.; Gunderov, D.V.; Valiev, R.Z.; Kuranova, N.N.; Pushin, V.G.; Uksusnikov, A.N. Mechanical Properties and Structure of High-Strength Nanostructured Nickel-Titanium Alloys Subjected to ECAP and Rolling. Faz. Perekh. Uporyad. Sost. Novye Mater. 2006, 10, 45–51. Available online: http://www.ptosnm.ru (accessed on 4 October 2006).
  11. Khmelevskaya, I.Y.; Karelin, R.D.; Prokoshkin, S.D.; Andreev, V.A.; Yusupov, V.S.; Perkas, M.M.; Prosvirnin, V.V.; Shelest, A.E.; Komarov, V.S. Effect of the quasi-continuous equal-channel angular pressing on the structure and functional properties of Ti–Ni-based shape-memory alloys. Phys. Met. Metallogr. 2017, 118, 279–287. [Google Scholar] [CrossRef]
  12. Kreitcberg, A.; Brailovski, V.; Prokoshkin, S.; Gunderov, D.; Khomutov, M.; Inaekyan, K. Effect of the grain/subgrain size on the strain-rate sensitivity and deformability of Ti–50 at%Ni alloy. Mater. Sci. Eng. A 2015, 622, 21–29. [Google Scholar] [CrossRef]
  13. Karelin, R.D.; Khmelevskaya, I.Y.; Komarov, V.S.; Andreev, V.A.; Perkas, M.M.; Yusupov, V.S.; Prokoshkin, S.D. Effect of Quasi-Continuous Equal-Channel Angular Pressing on Structure and Properties of Ti-Ni Shape Memory Alloys. J. Mater. Eng. Perform. 2021, 30, 3096–3106. [Google Scholar] [CrossRef]
  14. Kuranova, N.N.; Makarov, V.V.; Pushin, V.G.; Ustyugov, Y.M. Influence of Heat Treatment and Deformation on the Structure, Phase Transformation, and Mechanical Behavior of Bulk TiNi-Based Alloys. Metals 2022, 12, 2188. [Google Scholar] [CrossRef]
  15. Lotkov, A.I.; Grishkov, V.N.; Kashin, O.A.; Baturin, A.A.; Zhapova, D.Y.; Timkin, V.N. Mechanisms of microstructure evolution in TiNi-based alloys under warm deformation and its effect on martensite transformations. Mater. Sci. Found. 2015, 81, 245–259. [Google Scholar] [CrossRef]
  16. Komarov, V.; Karelin, R.; Cherkasov, V.; Yusupov, V.; Korpala, G.; Kawalla, R.; Prahl, U.; Prokoshkin, S. Effect of Severe Torsion Deformation on Structure and Properties of Titanium–Nickel Shape Memory Alloy. Metals 2023, 13, 1099. [Google Scholar] [CrossRef]
  17. Kashin, O.; Lotkov, A.I.; Grishkov, V.; Krukovskii, K.; Zhapova, D.; Mironov, Y.; Girsova, N.; Kashina, O.; Barmina, E. Effect of abc Pressing at 573 K on the Microstructure and Martensite Transformation Temperatures in Ti49.8Ni50.2 (at%). Metals 2021, 11, 1145. [Google Scholar] [CrossRef]
  18. Pushin, V.G. Nickel-Titanium Shape Memory Alloys. Part 1. Structure, Phase Transformations and Properties; UrB RAS: Yekaterinburg, Russia, 2006; p. 438. (In Russian) [Google Scholar]
  19. Mironov, Y.P.; Lotkov, A.I.; Grishkov, V.N.; Laptev, R.S.; Gusarenko, A.A.; Barmina, E.G. Changes in the structural-phase state and dislocation density in the Ti49.8Ni50.2 alloy depending on the temperature of isochronous annealing after severe plastic deformation by the abc pressing method at 573 K. Phys. Mesomech. 2023, unpublished. [Google Scholar]
  20. Polukhin, P.I.; Gorelik, S.S.; Vorontsov, V.K. Physical Bases of Plastic Deformation; Metallurgiya: Moscow, Russia, 1982; 584p. (In Russian) [Google Scholar]
  21. Shi, X.B.; Guo, F.M.; Zhang, J.S.; Ding, H.L.; Cui, L.S. Grain size effect on stress hysteresis of nanocrystalline NiTi alloys. J. Alloys Compd. 2016, 688, 62–68. [Google Scholar] [CrossRef]
Figure 1. Microstructure of Ti49.8Ni50.2 after abc pressing at 573 K with e = 9.55: (a) the bright-field image (the area from which the microdiffraction pattern was obtained is highlighted); (b) the microdiffraction pattern, in which the reflections of the B19’ and R phases are indicated; (c,d) the dark-field images, B19’ phase reflection of ( 11 1 ¯ ) type (in (b), 1 and 2 reflections, respectively).
Metals 13 01632 g001
Figure 2. Microstructure of the samples after annealing at 573 K, 1 h: (a) the bright-field image (areas (1 and 2) from which the microdiffraction patterns were obtained are highlighted); (b) the microdiffraction pattern from area 1 in (a); (c) the dark-field image, ( 1 ¯ 1 ¯ 0 ) B19’ phase reflection; (d) the microdiffraction pattern from area 2 in (a); (e) the dark-field image, ( 01 1 ¯ ) B2 phase reflection; (f) the dark-field image, 1 3 ( 2 ¯ 3 1 ¯ ) B2 phase reflection (indicated by an arrow in (d)).
Metals 13 01632 g002
Figure 3. Microstructure of the samples after annealing at 673 K, 1 h: (a) the bright-field image (the area from which the microdiffraction pattern was obtained is highlighted); (b) the microdiffraction pattern; (c) the dark-field image, (20 2 ¯ ) R phase reflection, (d) the dark-field image in the coinciding reflections ( 0 1 ¯ 2 ¯ )1 and ( 0 1 ¯ 2 ¯ )2 of the R phase.
Metals 13 01632 g003
Figure 4. Microstructure of the samples after annealing at 673 K, 1 h: (a) the bright-field image (the area from which the microdiffraction pattern was obtained is highlighted); (b) the microdiffraction pattern; (c) the dark-field image in coinciding reflections ( 1 ¯ 10 )1 of B2 phase and ( 3 3 ¯ 0 )3 of R phase, (d) the dark-field image, ( 1 ¯ 10 )3 R phase reflection.
Metals 13 01632 g004
Figure 5. Microstructure of the samples after annealing at 673 K, 1 h: (a) the bright-field image (the area from which the microdiffraction pattern was obtained is highlighted); (b) the microdiffraction pattern; (c) the dark-field image, ( 1 ¯ 1 ¯ 4 ) R phase reflection; (d) the dark-field image, (102) R phase reflection.
Metals 13 01632 g005aMetals 13 01632 g005b
Figure 6. Microstructure of the sample after annealing at 773 K, 1 h: (a) the bright-field image (the area from which the microdiffraction pattern was obtained is highlighted); (b) the microdiffraction pattern; (c) the dark-field image, (00 2 ¯ )2 B19’ phase reflection, (d) the dark-field image, ( 2 ¯ 12 )1 R phase reflection.
Metals 13 01632 g006aMetals 13 01632 g006b
Figure 7. Microstructure of the sample after annealing at 773 K, 1 h: (a) the bright-field image (the area from which the microdiffraction pattern was obtained is highlighted); (b) the microdiffraction pattern; (c) the dark-field image in coinciding reflections ( 1 1 ¯ 0 )2 of B2 phase and ( 3 3 ¯ 0 )1 of R phase; (d) dark-field image, ( 3 1 ¯ 1 )3 R phase reflection.
Metals 13 01632 g007
Figure 8. Microstructure of the samples after annealing at 873 K, 1 h: (a) the bright-field image (the areas (1 and 2) from which microdiffraction patterns were obtained are highlighted); (b) the microdiffraction pattern from area 1; (c) the dark-field image in coinciding reflections ( 1 ¯ 1 ¯ 2 ) of the B2 phase and reflections (300)1 and ( 1 1 ¯ 2 ¯ )2 of the R phase and ( 1 ¯ 10 )3 of the B2 phase; (d) the microdiffraction pattern from area 2; (e) the dark-field image in coinciding reflections (002)4 of the B2 phase and ( 4 2 ¯ 2 )3 of the R phase; (f) the dark-field image in coinciding reflections ( 2 1 ¯ 1 )3 of the R phase and (001)4 of B2 phase.
Metals 13 01632 g008
Figure 9. The bright-field image of the sample microstructure after annealing at 973 K.
Metals 13 01632 g009
Figure 10. Dependence of the average grain–subgrain size, <d>, on temperature, T, of isochronous (1 h) annealing of Ti49.8Ni50.2 (at.%) alloy samples after abc pressing at 573 K with e = 9.55.
Metals 13 01632 g010
Figure 11. “Stress-strain” dependences of initial samples after abc pressing at 573 K with e = 9.55 (1), samples after abc pressing and isochronous (1 h) annealings at temperatures of 573 K (2), 773 K (3), 973 K (4) and samples in a coarse-grained state after shaping into a cube in one cycle of hot abc pressing at 1073 K before warm pressing abc at 573 K (5).
Metals 13 01632 g011
Figure 12. Yield stress, σy (■) and ultimate tensile strength, σUTS (●), of samples after abc pressing with e = 9.55 at 573 K, depending on the temperature of isochronous (1 h) annealings.
Metals 13 01632 g012
Figure 13. Strain at fracture, εf, of samples after abc pressing with e = 9.55 at 573 K, depending on the temperature of isochronous (1 h) annealings.
Metals 13 01632 g013
Disclaimer/Publisher’s Note: The statements, opinions and data contained in all publications are solely those of the individual author(s) and contributor(s) and not of MDPI and/or the editor(s). MDPI and/or the editor(s) disclaim responsibility for any injury to people or property resulting from any ideas, methods, instructions or products referred to in the content.

