1. Introduction
Generally, the occurrence of Lüders bands in various metallic materials is a problem in the metal forming, e.g., in the bending of steel tubes [
1] or during the forming of drawing quality low carbon steel [
2]. Therefore, knowledge of the appearance and formation of Lüders bands in different metallic materials is a key point in the research of Lüders bands. The knowledge of the mechanism of Lüders band formation is important, because if the mechanism of the Lüders band is known, it is possible to reduce or even eliminate the occurrence of Lüders bands in the future by determining the cause of their formation. In this way, the formation of a Lüders band, i.e., the appearance of roughness on the steel surface, during the forming of metallic materials could be avoided or at least reduced. Lüders bands are formed in various types of metallic materials, such as low carbon steels [
3], aluminum [
4], aluminum alloys [
5], TRIP steels [
6], austenitic steels [
7], copper [
8], titanium [
9], shape-memory alloys [
10] and bimetals (e.g., low carbon steel-stainless steel) [
11]. In addition to these metallic materials, the appearance and formation of Lüders bands during deformation were observed in niobium microalloyed steels [
12].
The stress–strain relationship in different metallic materials is investigated in various ways through stress and strain monitoring by developing different mathematical models [
13,
14], numerical analysis [
15,
16] and using different methods, such as thermography and digital image correlation (DIC) [
17]. In this way it is possible to monitor and identify different phenomena such as inhomogeneous deformations [
18] especially Lüders bands and the Portevin–Le Chatelier effect (PLC) [
19]. The residual stress can have positive as well as negative effects on the properties of metallic materials; therefore, the reduction of residual stress and deformations is possible using different techniques [
20].
The presence of Lüders bands has been clearly established in previous research using thermography and digital image correlation, since they are formed at one end of the sample and propagated towards the other end. Thermography and digital image correlation are well-known methods for determining the temperature, i.e., stress, and strain distribution during the process of cold deformation [
21]. Using these methods it is possible to qualitatively and quantitatively accurately determine the temperature or stress changes and strain values of random points in the deformation zone. This is very important since these methods are suitable for determining the localization of stress and strain at the start and during Lüders band formation. In the study [
22], the authors determined, with thermography and digital image correlation, the occurrence of microstrains in the area before determining yield strength. Microstrains are associated with the formation of Lüders bands, since there is a sudden temperature and strain increase at the start of Lüders band formation.
Cottrel and Bilby [
23] gave the well-known and general explanation of Lüders band appearance, stating that the Lüders bands are formed due to the presence of obstacles in the form of atmospheres with carbon and nitrogen atoms and their compounds. Recently, the influence of the microstructure has been shown to be one of the key factors which are considered to affect the formation of a Lüders band. In [
24], it is stated that the Lüders band is formed in an area with previously introduced notches as a stress concentrators. Research [
25,
26] shows that the formation of the Lüders band occurs in the area of highest stress concentration, i.e., in the area with a significant accumulation of dislocations. Other research on low carbon steel [
27,
28] has established higher values of local strains in the area behind the Lüders band front during propagation. The authors in [
29] found that Lüders bands are formed in steels with precipitates which represent obstacles to the movement of dislocations. The formation of Lüders bands in niobium microalloyed steels, with precipitates, is shown in the study [
12]. The clarification of the mechanism of Lüders band formation has been suggested from various viewpoints in several ways [
17,
25,
30,
31].
However, a detailed mechanism of the Lüders band formation in niobium microalloyed steel has not been established because the conducted research has been more focused on determining the influence of different parameters on Lüders band propagation [
27]. Therefore, the aim of this study is to determine the mechanism of Lüders band formation and the influence of fine niobium-containing precipitates, as well as the role of niobium, carbon and nitrogen atoms on the formation of Lüders bands.
3. Results and Discussion
In this paper a detailed qualitative and quantitative analysis, via thermography and digital image correlation, was carried out to determine temperature changes and strains at different stages during Lüders band formation.
In order to determine why the Lüders band formation starts at a certain part of the deformation zone, research was conducted on the difference between internal stresses in the area of the Lüders band appearance. The existence of a temperature change, i.e., stress change, was established before the formation of the Lüders band in the area of the later Lüders band formation.
According to the stress–strain diagram in
Figure 1, the area before the start of the Lüders band formation (A), the middle of the Lüders band formation (B) and the end of the Lüders band formation (C) refers to the research area of the Lüders band formation process in
Figure 2.
The results of thermography qualitative line analysis are presented at the moment before the start of the Lüders band formation (A), the middle of the Lüders band formation (B) and at the end of the Lüders band formation (C) (
Figure 2). An examination of the line analysis was carried out at position 1, which corresponds to the area of the Lüders band formation, and at position 2, which corresponds to the area in front of the Lüders band front without Lüders band formation. Qualitative line analysis results, obtained via thermography, at the different moments of the Lüders band formation (A–C) are shown in
Figure 2. Quantitative line analysis was performed in the same positions of line analysis as the previously mentioned qualitative line analysis. Mean values of maximum temperature changes were obtained via quantitative line analysis (a–c) according to
Figure 2. Line analysis was carried out in the area with Lüders band formation (position 1) and in the area without Lüders band formation (position 2).
The obtained results indicate higher values of temperature, i.e., stress, changes in the area of Lüders band formation (position 1 of the line analysis) with regard to the area without Lüders band formation (position 2 of the line analysis,
Figure 2). Therefore, Lüders band formation was found to appear in the region of higher stress in the niobium microalloyed steel.
The difference in the values of temperature, i.e., stress, changes between the area with Lüders band formation (position 1 of the line analysis) and without Lüders band formation (position 2 of the line analysis) increase as the Lüders band formation progresses from points a to c on
Figure 2.
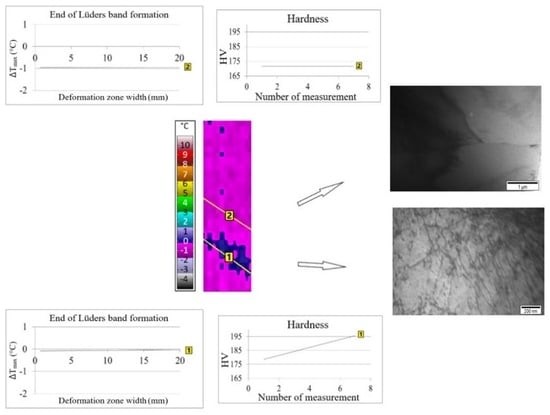
The area of Lüders band formation will be at the point on the sample surface where higher temperature, i.e., stress, changes were found before the Lüders band formation (
Figure 3 in position 1A of the line analysis). The formation of the Lüders band in the same line area showed an increase in temperature changes (
Figure 3, in position 1B of the line analysis).
The value of the temperature changes in position 1A is greater than the values in position 2A at the moment before the formation of the Lüders band (
Figure 3). The temperature change values in position 2B remain the same compared to position 2A and the difference in the values of the temperature changes increase in position 1B compared to position 1A after the forming of the Lüders band (
Figure 3).
The area of the partially (1A) and fully (1B) formed Lüders band, the position of the partially (2A) and fully (2B) formed Lüders band front and the size of the partial (3A) and full (3B) area in front of the Lüders band front were researched in detail (
Figure 4).
In all of the positions, a detailed qualitative and quantitative line analysis was performed to determine the differences in the values of temperature changes and strains in these areas during Lüders band formation.
Hardness measurements (C) were performed in all positions of line analysis (1–3B) with thermography and digital image correlation at the end of the Lüders band formation (
Figure 4).
The comparison of the obtained qualitative and quantitative results of thermography, digital image correlation and hardness measurements in different positions (1–3B) is shown in
Figure 4.
It was found that the values of temperature changes, strains and hardness did not change on the Lüders band front (position 2) and in front of the Lüders band front (position 3) from the start of Lüders band formation (A) to the end of Lüders band formation (B) (
Figure 4). Higher values of temperature, i.e., stress, changes and strain were found in the area of the formed Lüders band (position 1) because in the area in front of the Lüders band front (position 3) only elastic deformation takes place (
Figure 4). The highest hardness values were measured in the area of the formed Lüders band in position 1c on
Figure 4.
Previous research [
32] carried out on the same niobium microalloyed steel, with 0.048 wt% of Nb, established that there are certain types of precipitates such as carbides, nitrides and carbonitrides and the presence of these types of precipitates was determined via electrochemical isolation, atomic absorption spectrophotometry and transmission electron microscopy. The presence of fine niobium precipitates in the form of niobium carbides, nitrides and carbonitrides and their interaction with dislocations is presented in this paper and shown via detailed transmission electron microanalysis in
Figure 5. There are different sizes of niobium precipitates but the presence of a large number of fine niobium precipitates up to 10 nm in size was determined (
Figure 5b,c).
The same method revealed a significant difference in the dislocation density in the area of the Lüders band formation (position 1) in relation to the area where the elastic deformation takes place (position 2,
Figure 6).
X-ray diffraction was used to determine non-linear deformation in areas with and without a Lüders band using the Halder-Wagner method. The results of the analysis of diffraction line broadening and the determination of the non-linear deformation on the Gaussian profile of the diffraction line using the Halder-Wagner method are given in
Table 2.
The obtained values of non-linear deformations in the areas with and without a Lüders band indicate that there is a difference in the deformation values (
Table 2). Therefore, X-ray diffraction showed that there is a greater non-linear distortion of the crystal lattice in the area with the presence of a Lüders band.
Since the area without a Lüders band is still an area of elastic deformation, there are no greater number of dislocations in this area, see
Figure 6d. From the initial point of the Lüders band formation, it continues to form further across the width of the tested sample. There is a gradual increase in the temperature, i.e., stress, changes and strain values as the Lüders band is formed in position 1 from point A to B on
Figure 4. At the different stages of the Lüders band formation, the highest values of temperature changes (N) and strains (M) behind the Lüders band front occur in the area of the initial appearance of the Lüders band (
Figure 4). This is associated with the increased dislocation density, number of precipitates and free niobium atoms in this area.
In the area of the initial Lüders band formation (position 1B points M and N on
Figure 4), there is the highest accumulation of dislocations and their interaction with fine niobium precipitates during Lüders band formation. The interaction between dislocations and fine precipitates leads to higher values of temperature, i.e., stress, changes while their release of dislocations leads to higher local strain values. The evidence of this behavior in niobium microalloyed steel during the formation of the Lüders band are the hardness values on
Figure 4a–c. A continuous increase in the measured hardness values is clearly shown from the newly formed (position 1C on the left side) to the initially formed Lüders band (position 1C on the right side) area of the formed Lüders band (
Figure 4).
In the region of elastic deformation, there is an increase in the distance between the niobium, nitrogen and carbon atoms. Previous research has established [
32,
33] that all the niobium atoms are not bound in carbides, nitrides and carbonitrides. Therefore, the distance between atoms of niobium, nitrogen and carbon that are not bound in the precipitates increases with the deformation degree. Then, lattice distortion begins because niobium atoms [
34] are larger in diameter than carbon and nitrogen atoms. The movement of niobium atoms will trigger dislocations, i.e., slip lines will form, and thus the Lüders band formation begins.
Fine niobium precipitates and niobium, carbon and nitrogen atoms, located around niobium-containing precipitates, contribute to increased lattice distortion in this deformation area. There is a higher concentration of fine niobium precipitates and atoms. The presence of higher concentrations of niobium, carbon and nitrogen atoms near the precipitates can be assumed according to previous research [
35] because they bind into larger precipitates via the subsequent heating of the test steel at higher temperatures. As niobium, carbon and nitrogen atoms are located near the precipitates, it is concluded that in the area, with the increased concentration of precipitates and their interaction with dislocations, Lüders band formation will start (
Figure 6e).
The accumulation of dislocations and their interaction with fine deformation-induced niobium-containing precipitates at the grain boundary, proven via transmission electron microanalysis, cause a stress concentration at the grain boundary (
Figure 5d and
Figure 6e). In this way, a source of new dislocations in the adjacent grain will be created. The source of the new dislocations in the adjacent grain will interact with the fine deformation-induced niobium precipitates and niobium, carbon, and nitrogen atoms and will propagate throughout the entire grain. The widening of the gliding stress to adjacent grains begins an increase in the local stress concentration during inhomogeneous deformation (
Figure 2,
Figure 3 and
Figure 4). The increased local stress concentration is caused by a great number of dislocations and their interaction with fine deformation-induced niobium precipitates at the grain boundary (
Figure 5d and
Figure 6e). At that point, the stress concentration is large enough to transfer sliding through the entire adjacent grain. Therefore, the deformation will propagate at a higher rate through grains with a favorable orientation (
Figure 6e). In these grains, inhomogeneous deformation will be created with regard to other grains that have a less favorable orientation and where inhomogeneous deformation has not yet begun [
25]. This is confirmed with the results obtained via scanning electron microscopy (
Figure 6b,c in positions 1 and 2).
Certain areas with a favorable grain orientation for the beginning of the inhomogeneous deformation deform at a higher rate and form the Lüders band front in relation to the rest of the examined areas (
Figure 6b,c). In the area with more favorable grain orientation, the formation of the Lüders bands is shown by the higher grain orientation with the results of scanning electron microscopy and the results of X-ray diffraction of the greater crystal lattice distortion in the area with the Lüders band (
Figure 6 and
Table 2).
The grains are oriented in a favorable direction to continue the propagation of inhomogeneous deformation, i.e., the Lüders band, during the interaction of dislocations with fine deformation-induced niobium precipitates. In the area behind the Lüders band front by several grains, the same direction of dislocations was determined (
Figure 6e). The mechanism of inhomogeneous deformation propagation is confirmed through the results of the X-ray diffraction, since distortion of the crystal lattice is determined in the area with the Lüders band (
Table 2).
The higher values of temperature changes, strains, hardness and distortion of the crystal lattice in the area behind and on the Lüders band front confirm this mechanism of the Lüders band formation compared to the area without inhomogeneous deformation (
Figure 4 and
Figure 6,
Table 2).
The results of the increased temperature, i.e., stress, changes in the area on (position 2) and behind the Lüders band front (position 1) correspond to the area of interaction between dislocations and fine deformation-induced niobium precipitates in the form of niobium carbides, nitrides and carbonitrides (
Figure 4B and
Figure 5b). This is confirmed by higher hardness values (
Figure 4C(b,c)), and distortion of the crystal lattice (
Table 2), in the area on and behind the Lüders band front compared to the area without the Lüders band (position 3 on
Figure 4). The increased concentration of niobium, carbon and nitrogen atoms on the grain boundary will cause increased strain values. The increased strain values were determined using digital image correlation in the area on (position 2) and behind the Lüders band front (position 1) in relation to the area without the Lüders band (position 3,
Figure 4). The interaction of atoms and precipitates with dislocations leads to the release of dislocations by reaching sufficient energy during deformation. Therefore, the interaction between dislocations, fine deformation-induced precipitates, atoms of niobium, carbon and nitrogen and release of dislocations by reaching sufficient energy was established as the cause of Lüders band formation. There is an alternating increase and decrease in the stress values due to the pinning and release of dislocations from the fine niobium precipitates and niobium, carbon and nitrogen atoms during Lüders band formation in niobium microalloyed steel.


 ,
, 


