
On the Effect of Volumetric Energy Density on the Characteristics of 3D-Printed Metals and Alloys

 , , ,
, , ,  ,
,
Abstract
:1. Introduction
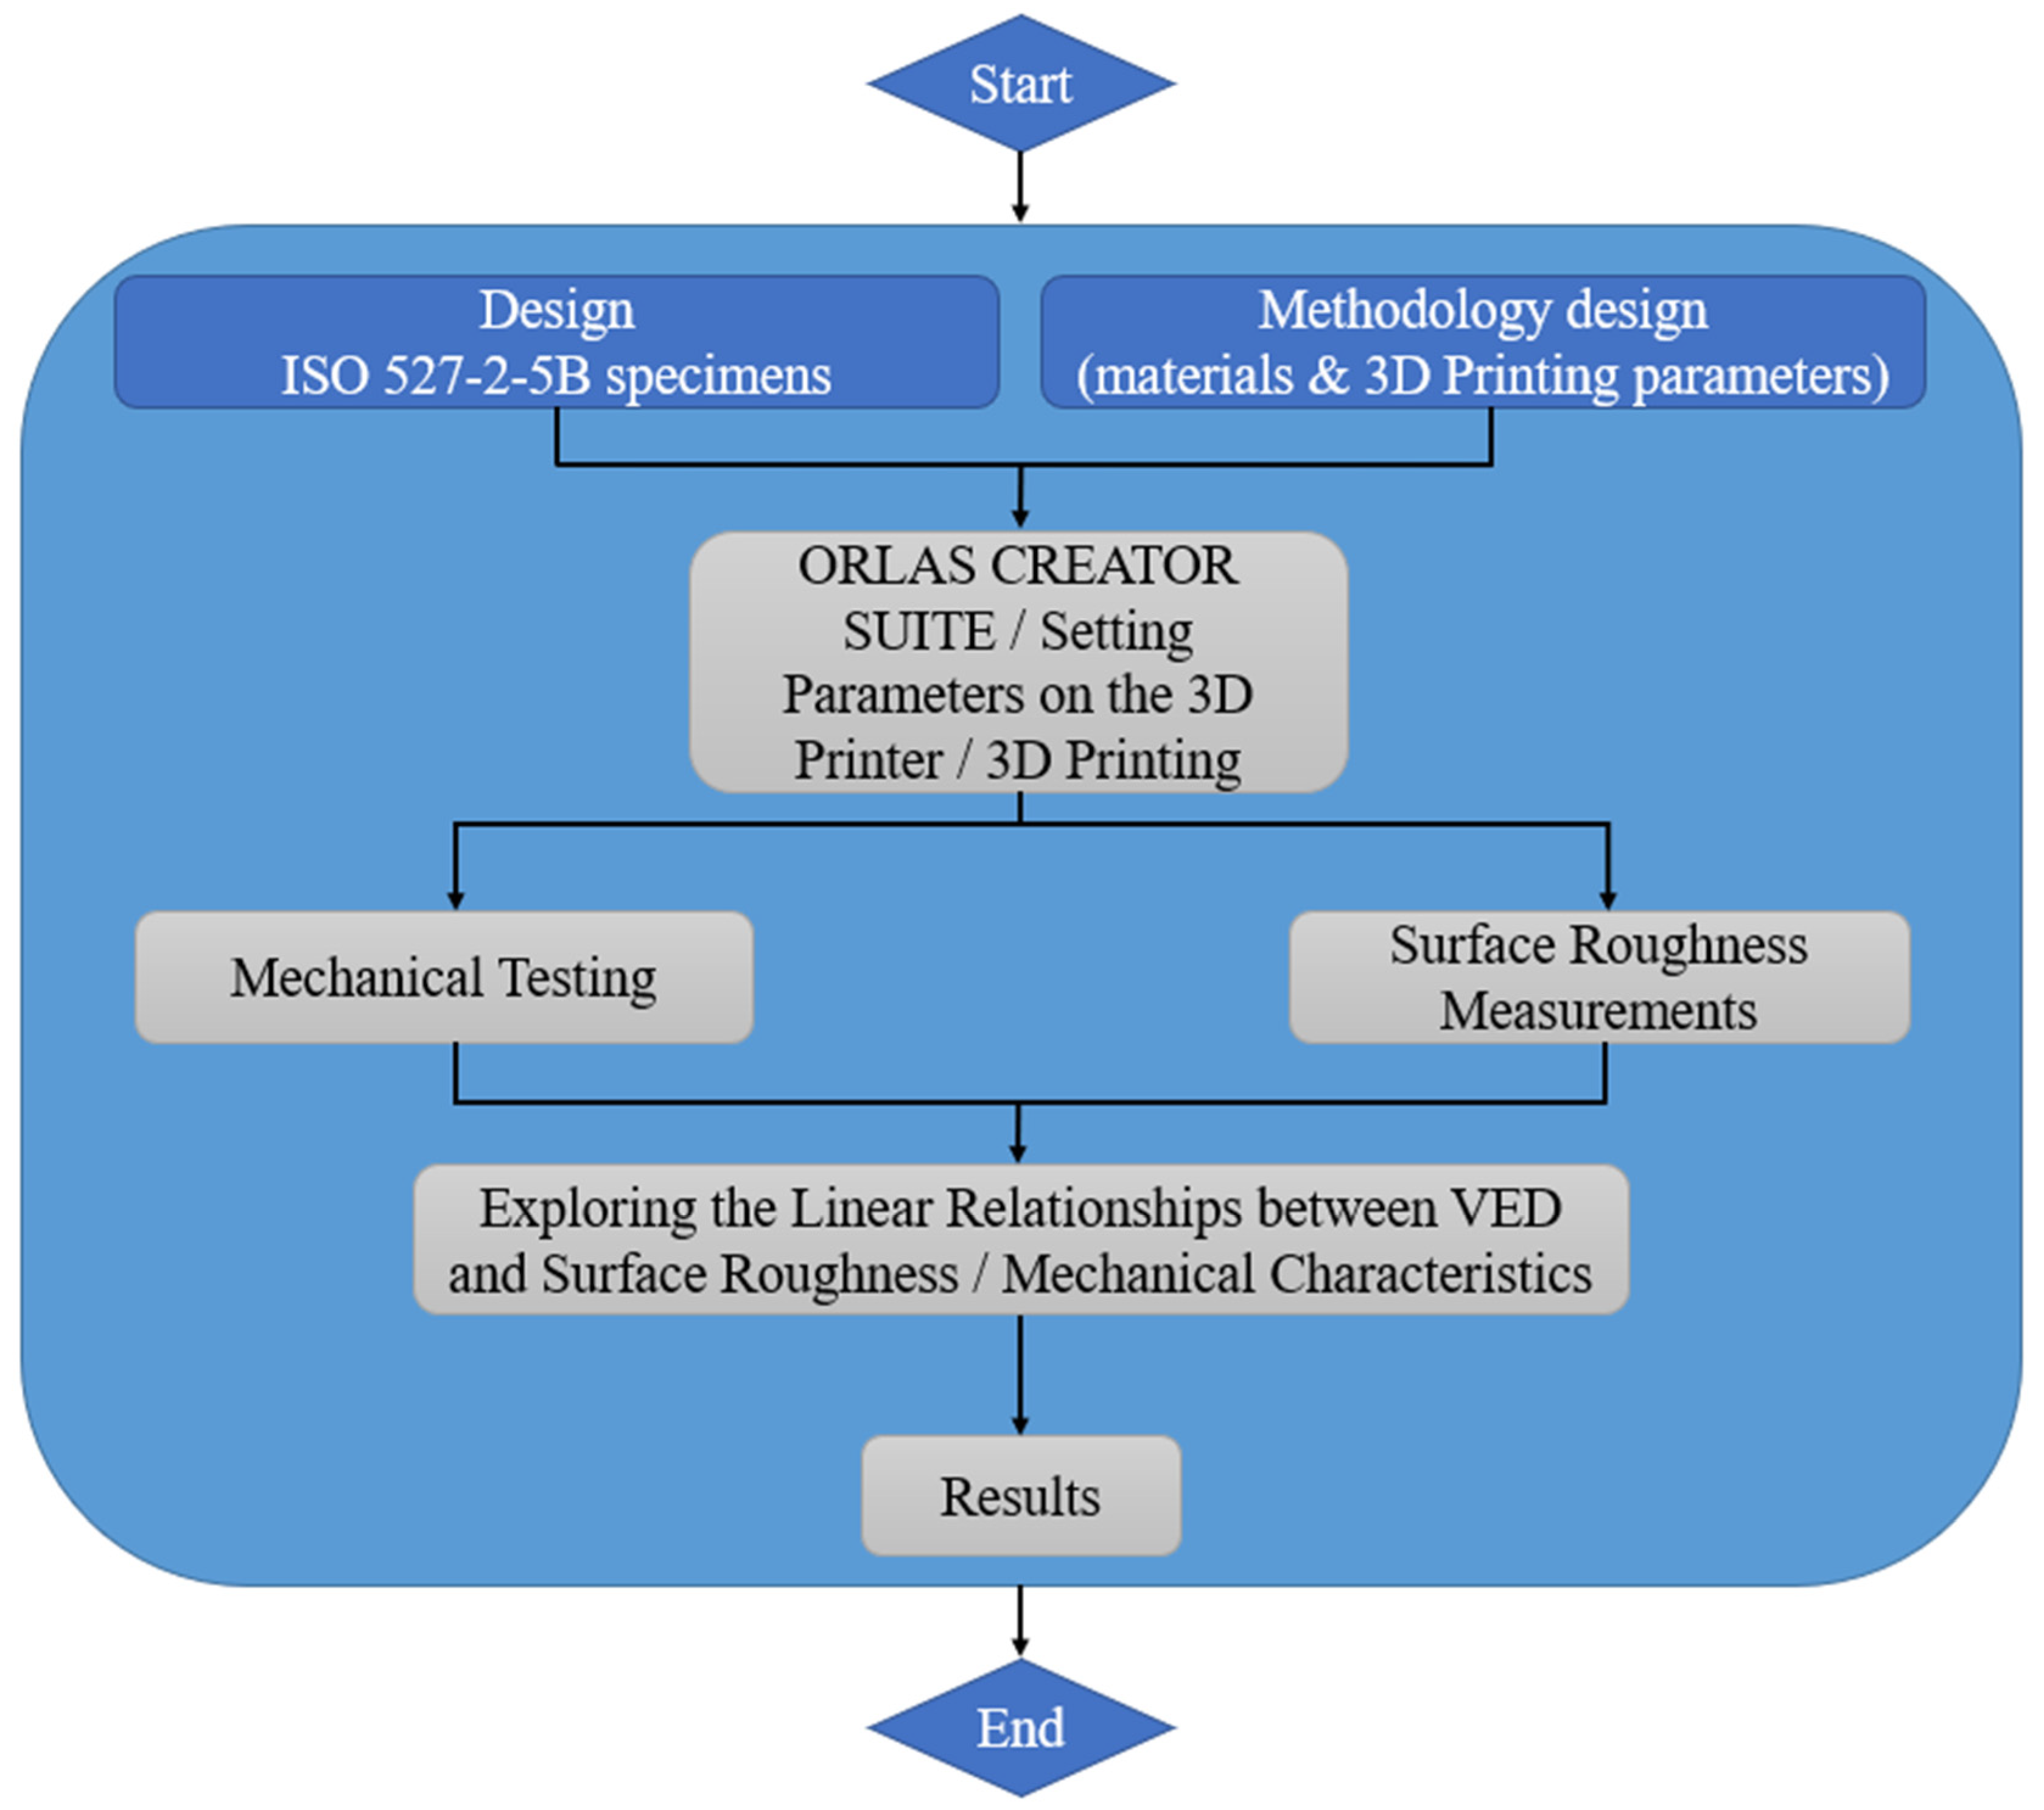
2. Methodology
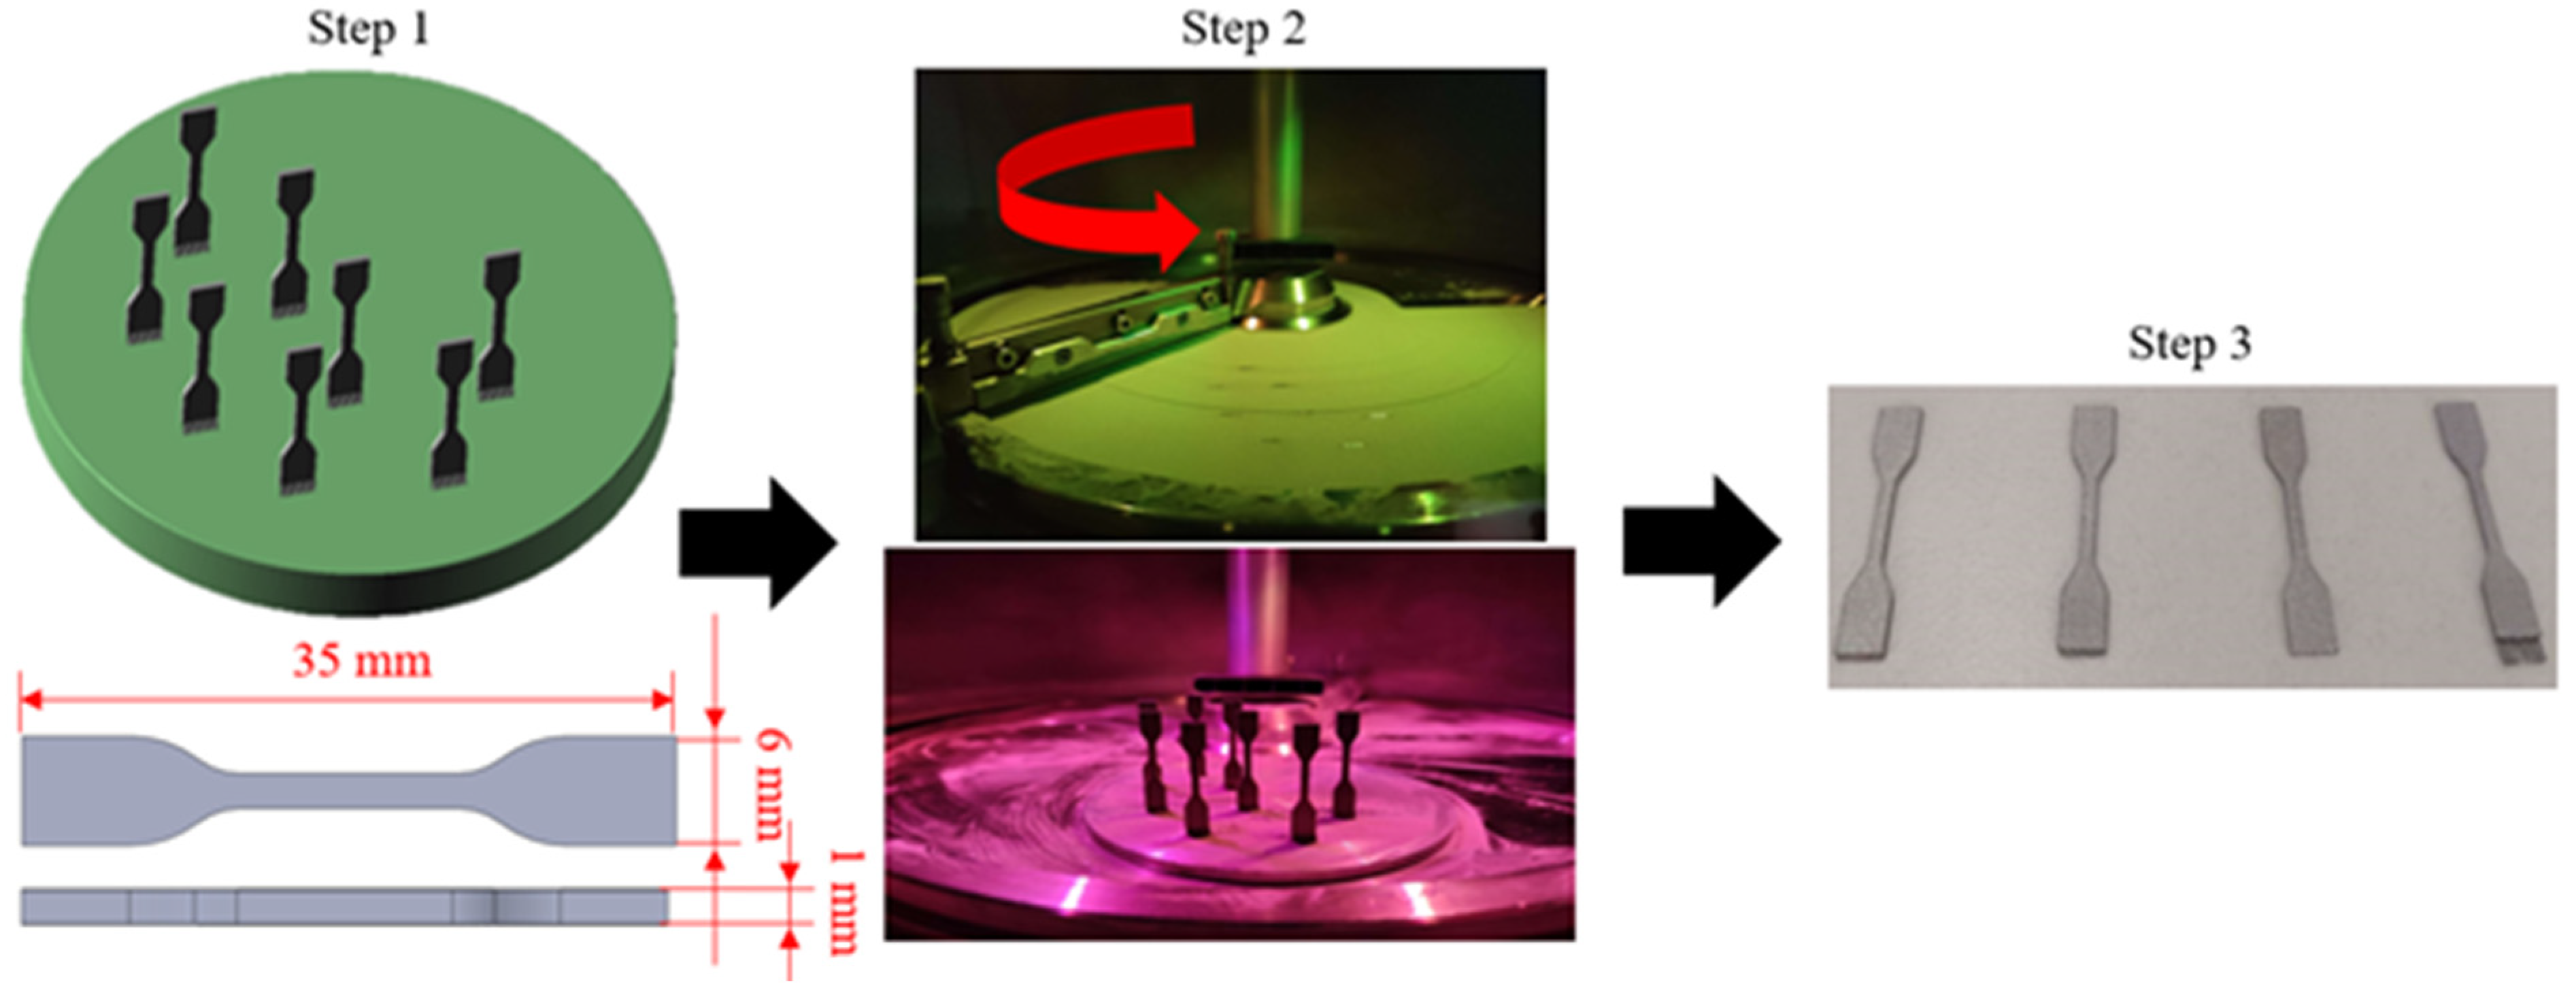
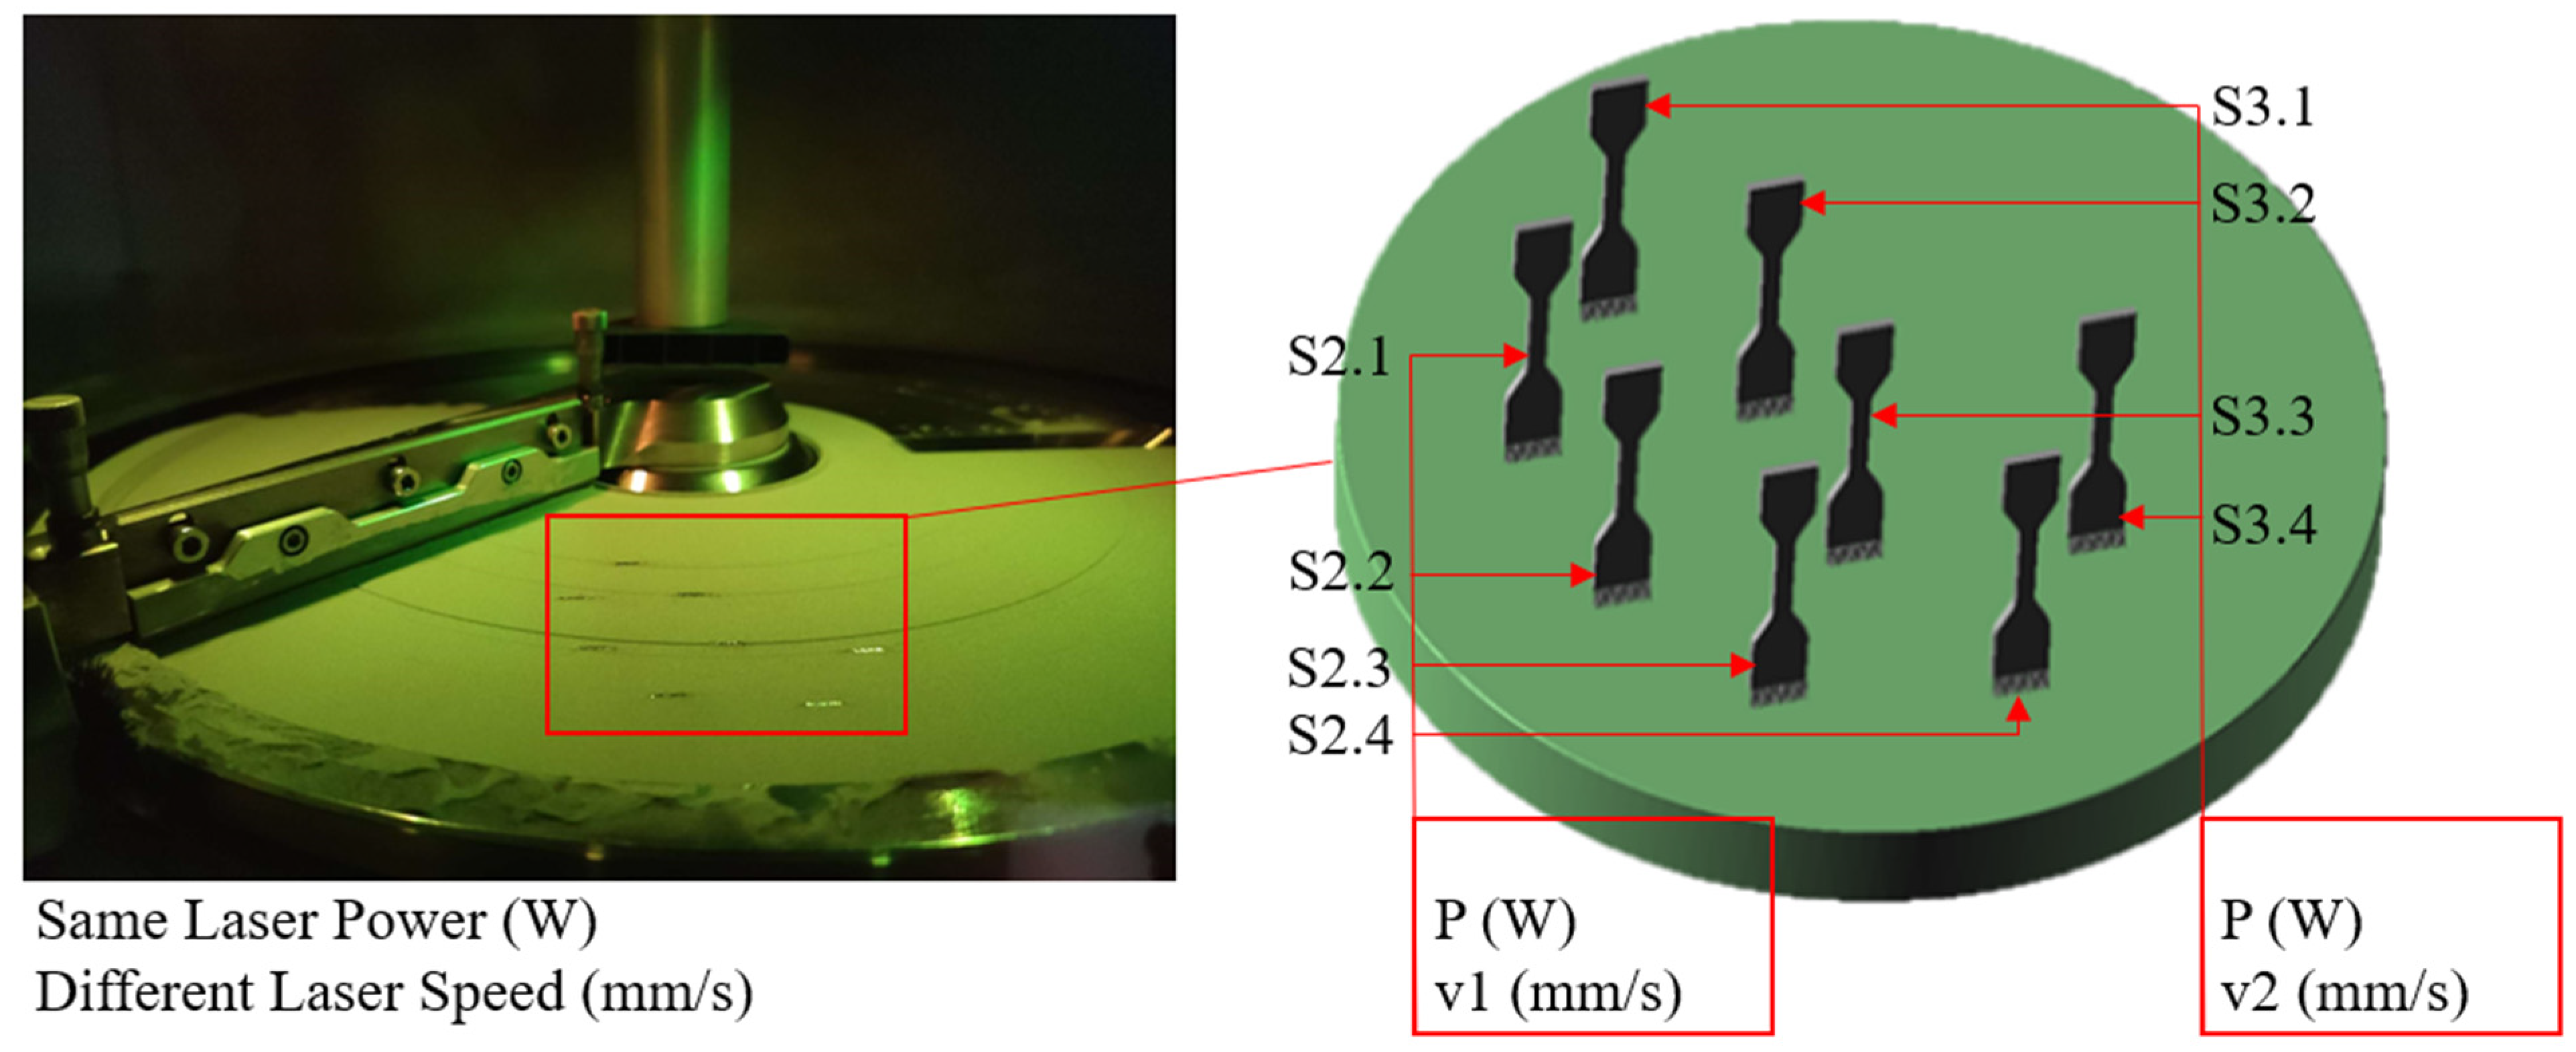
2.1. Additive Manufacturing
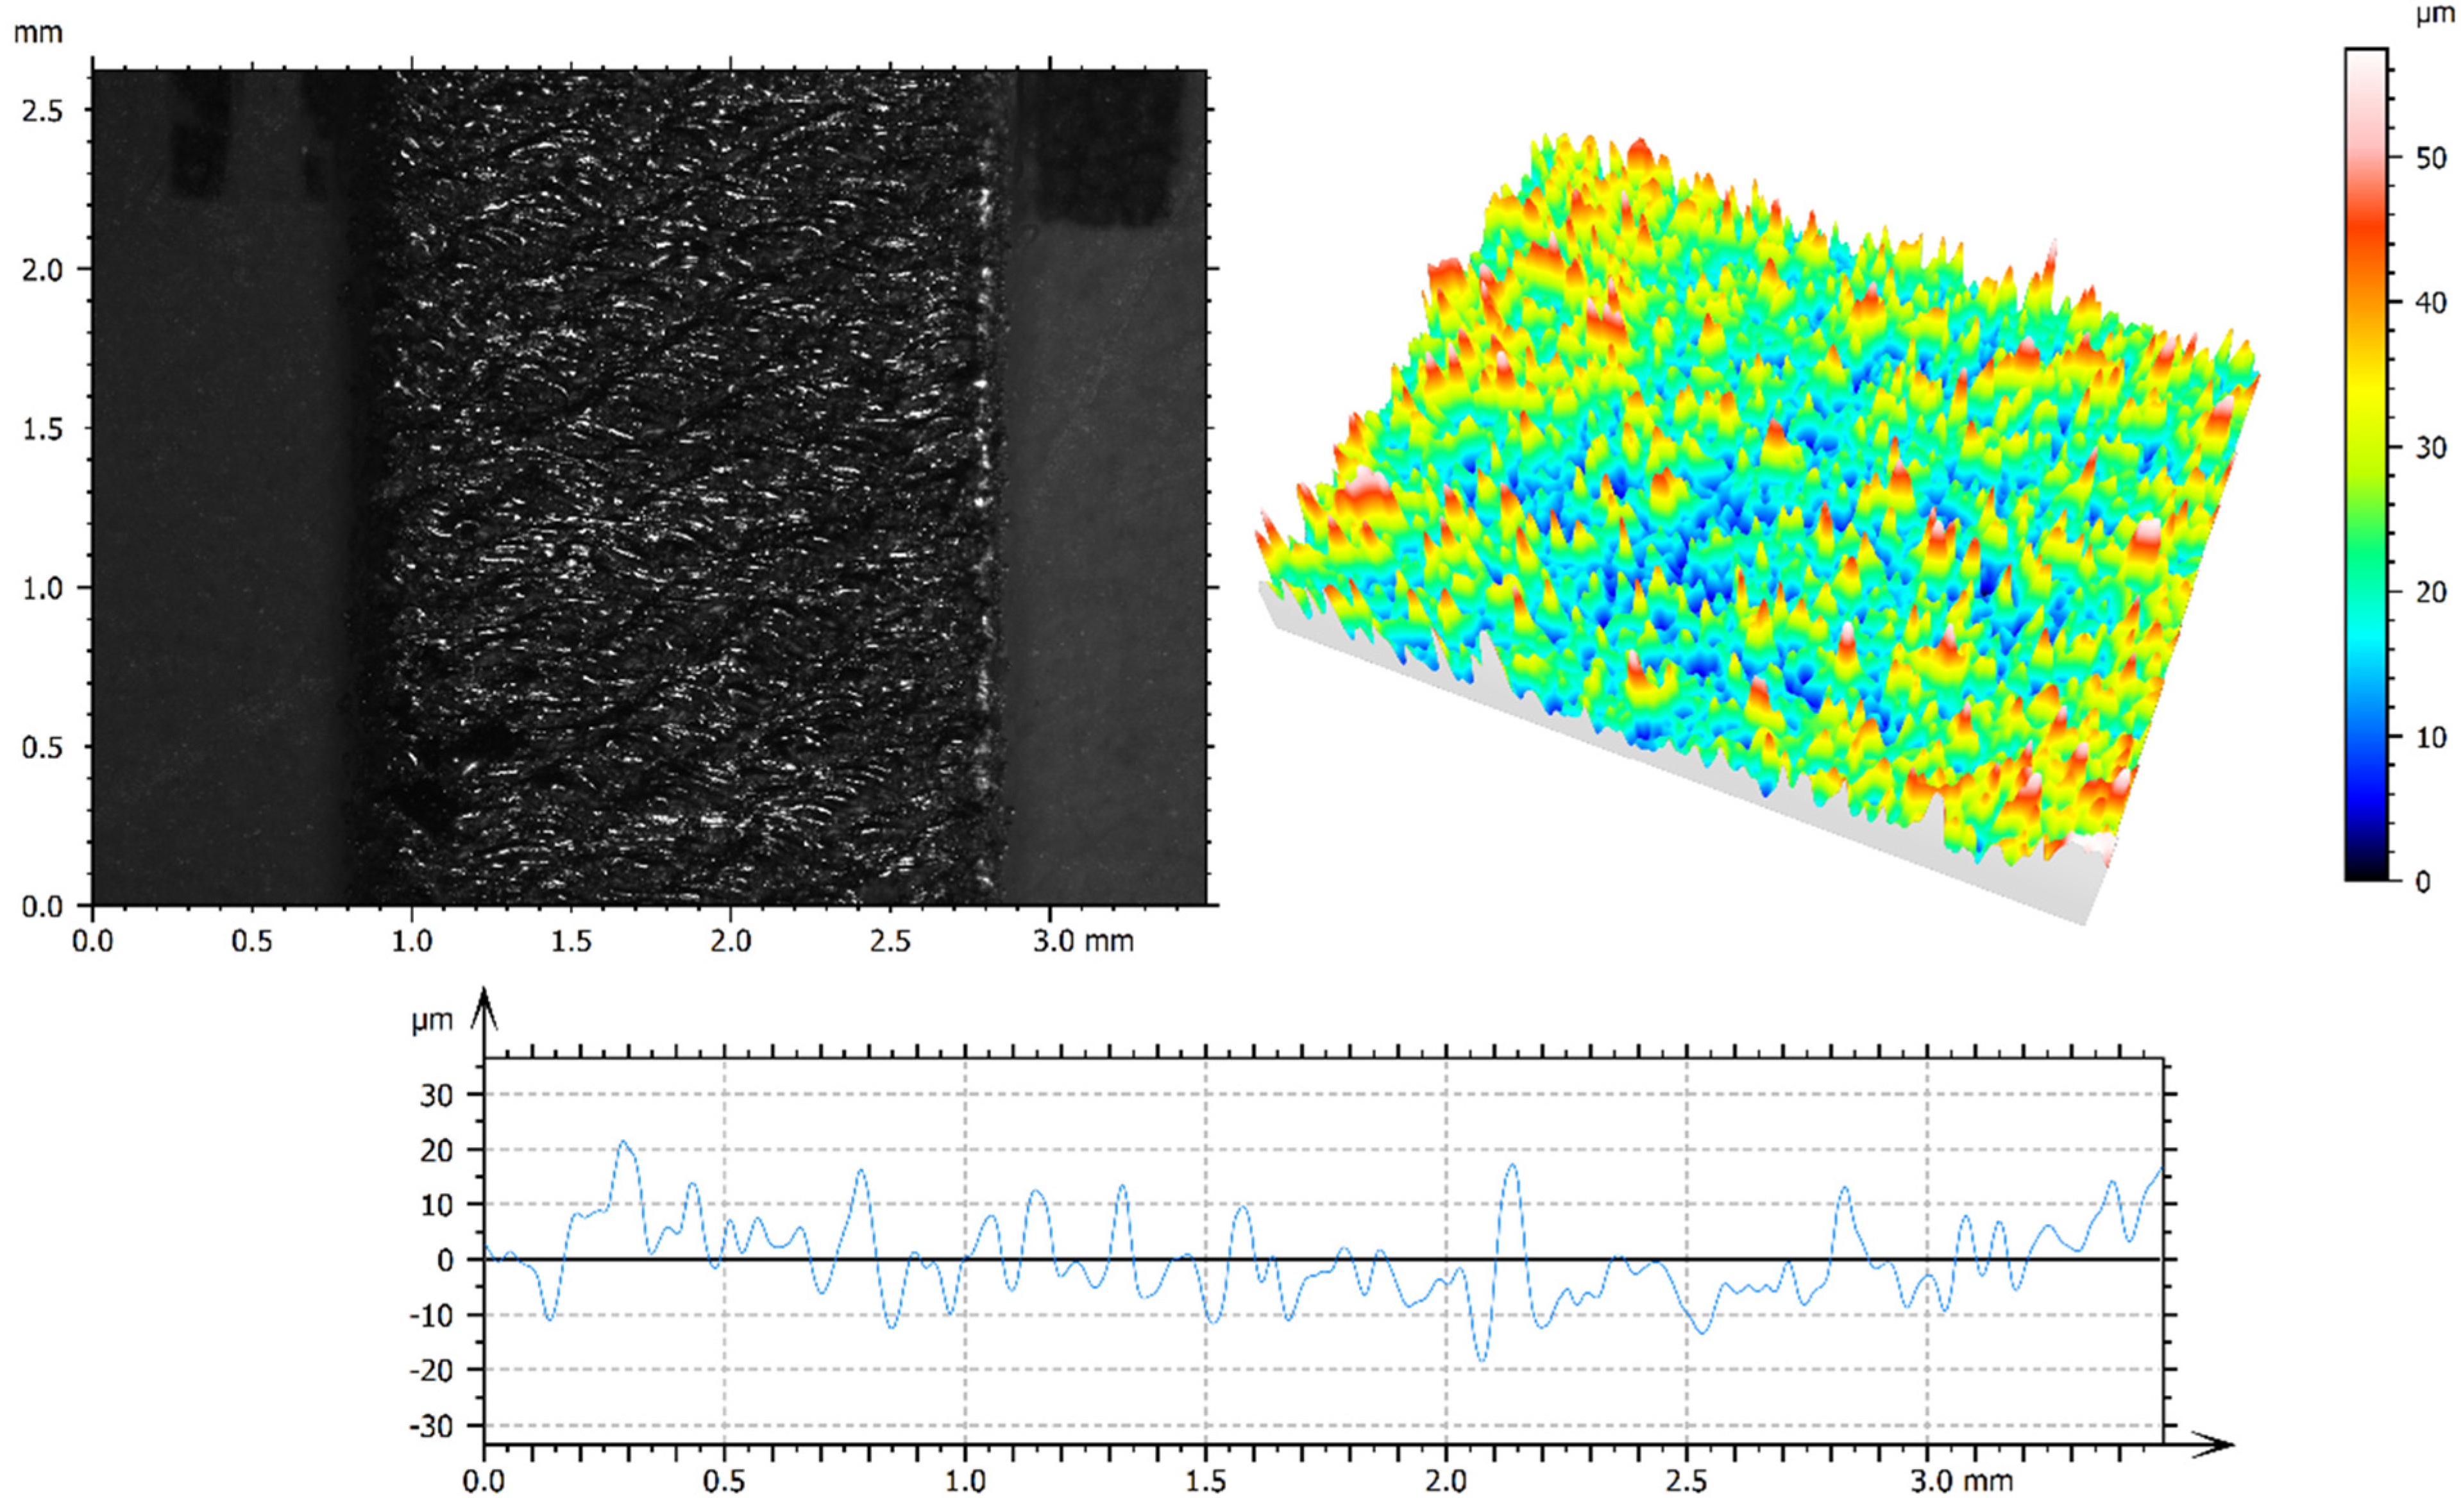
2.2. Surface Characterization
2.3. Mechanical Characterization
3. Results and Discussion
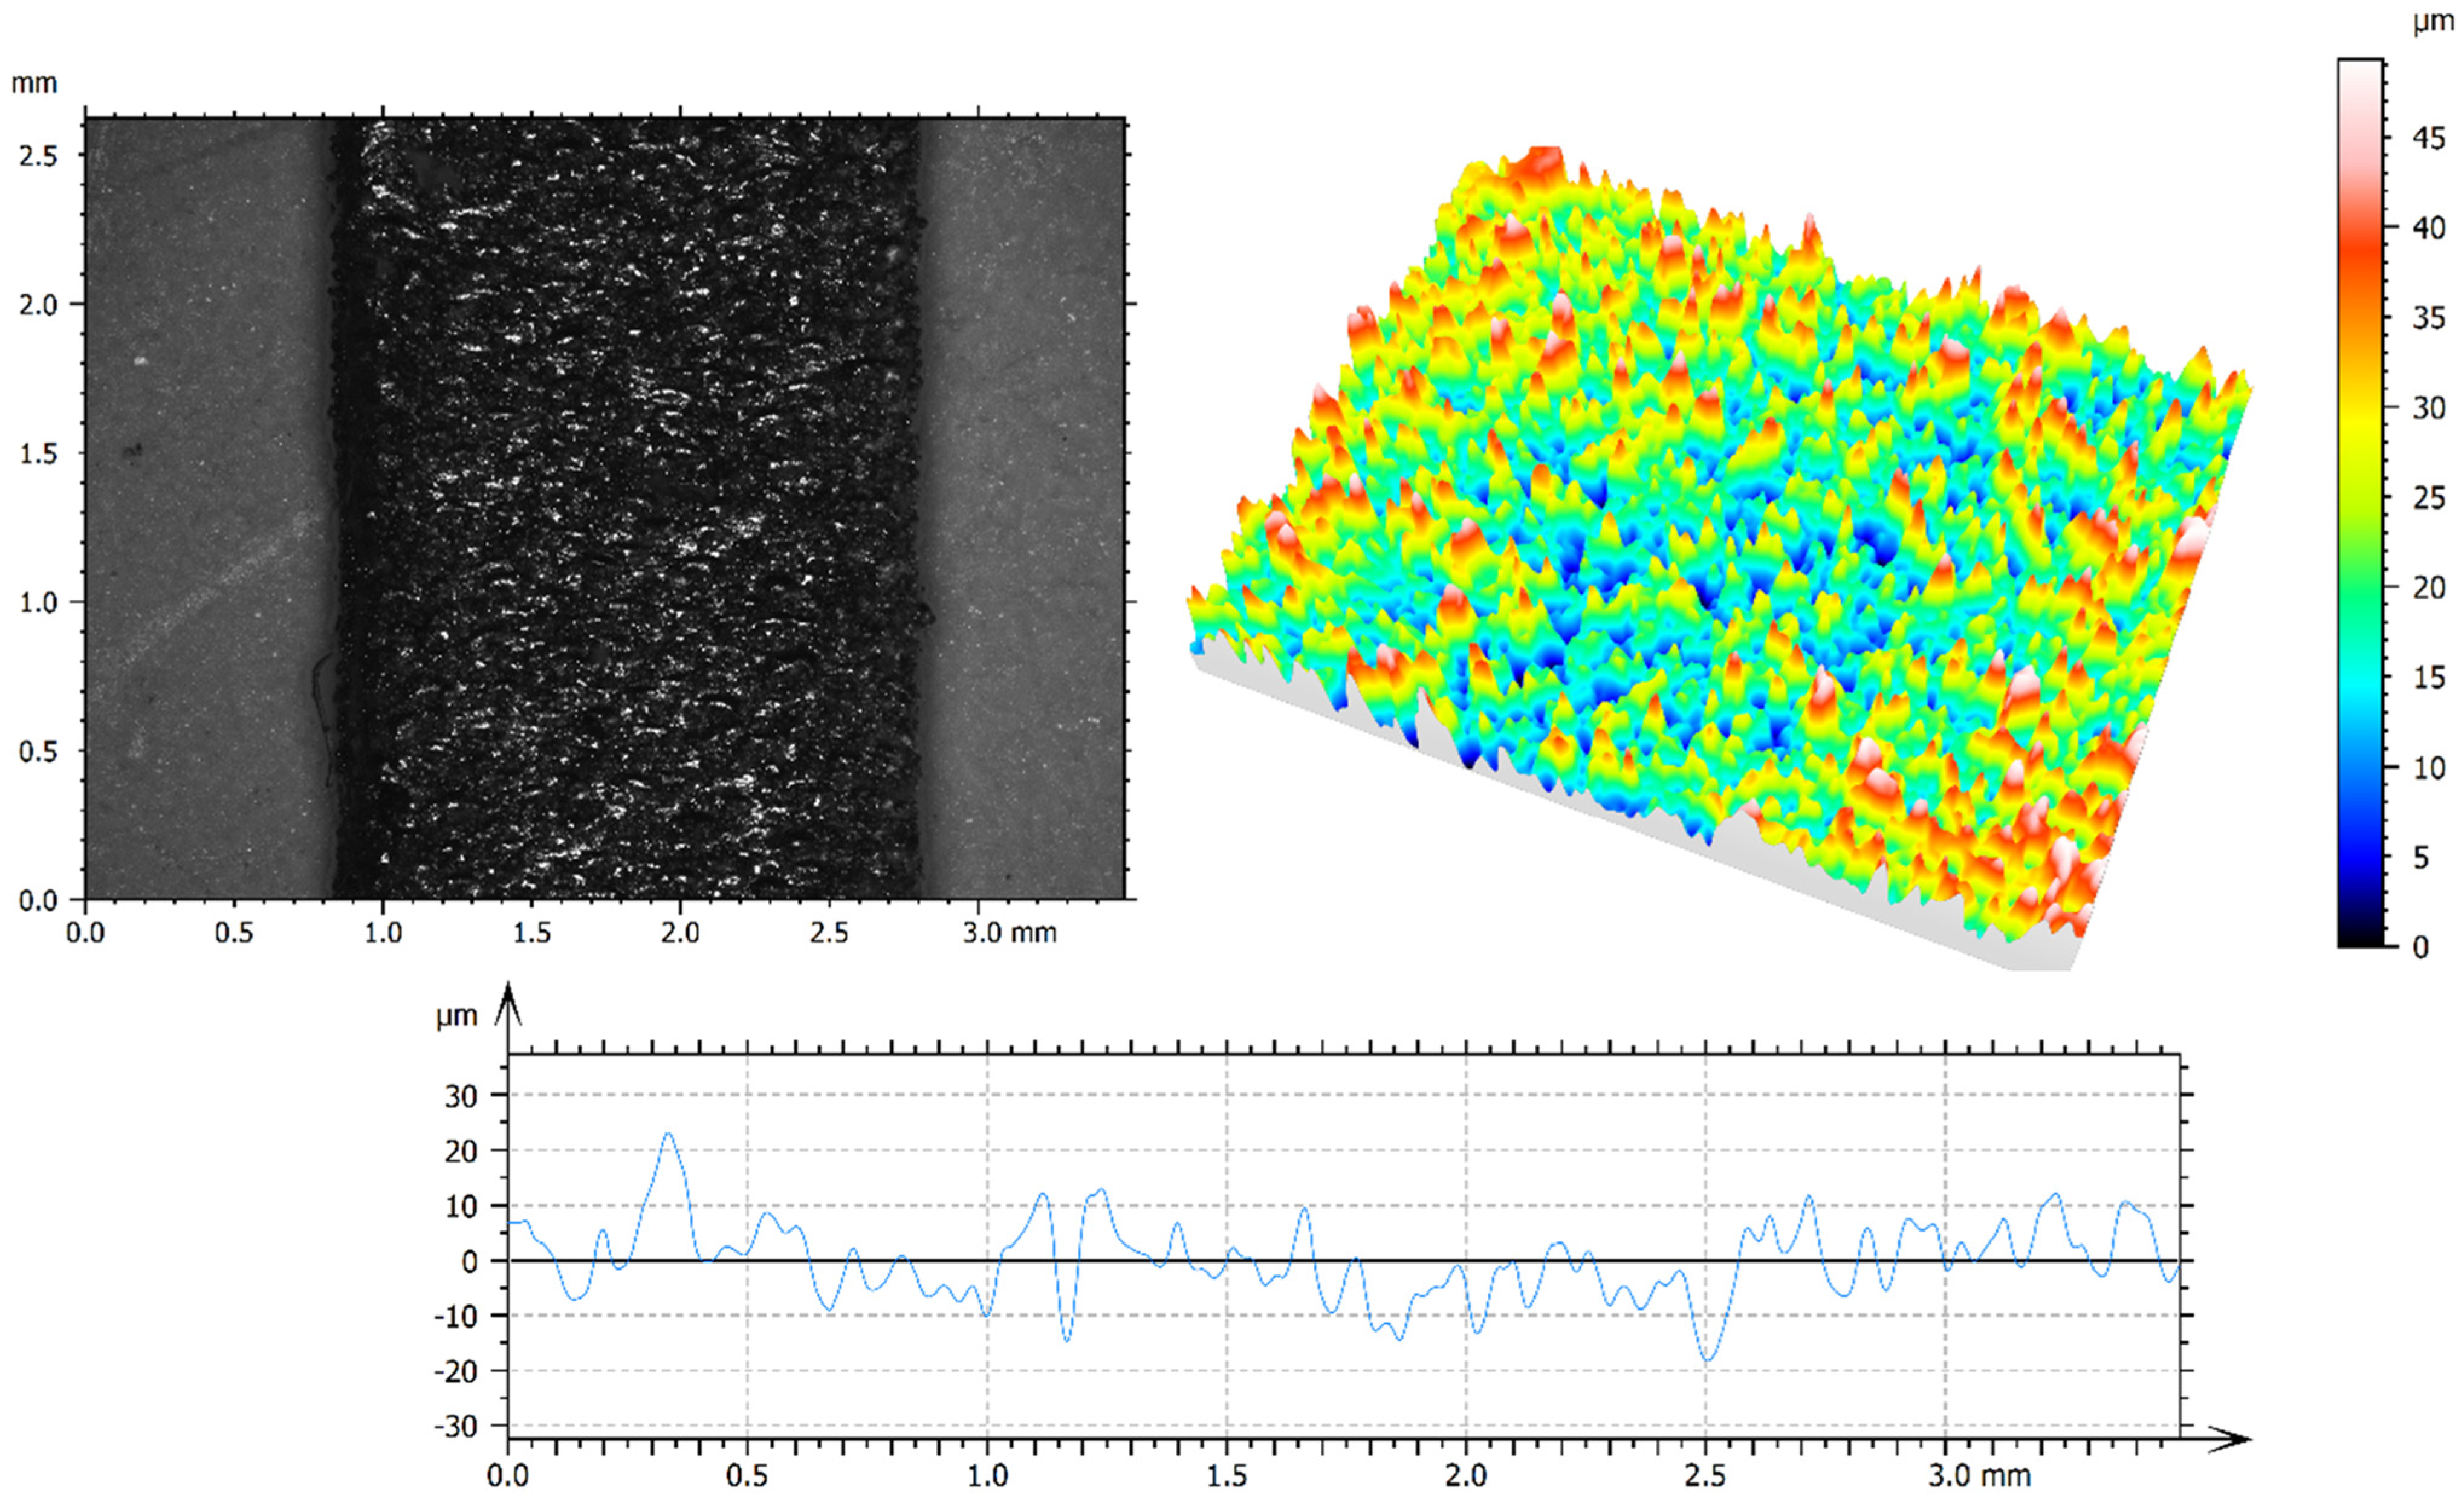
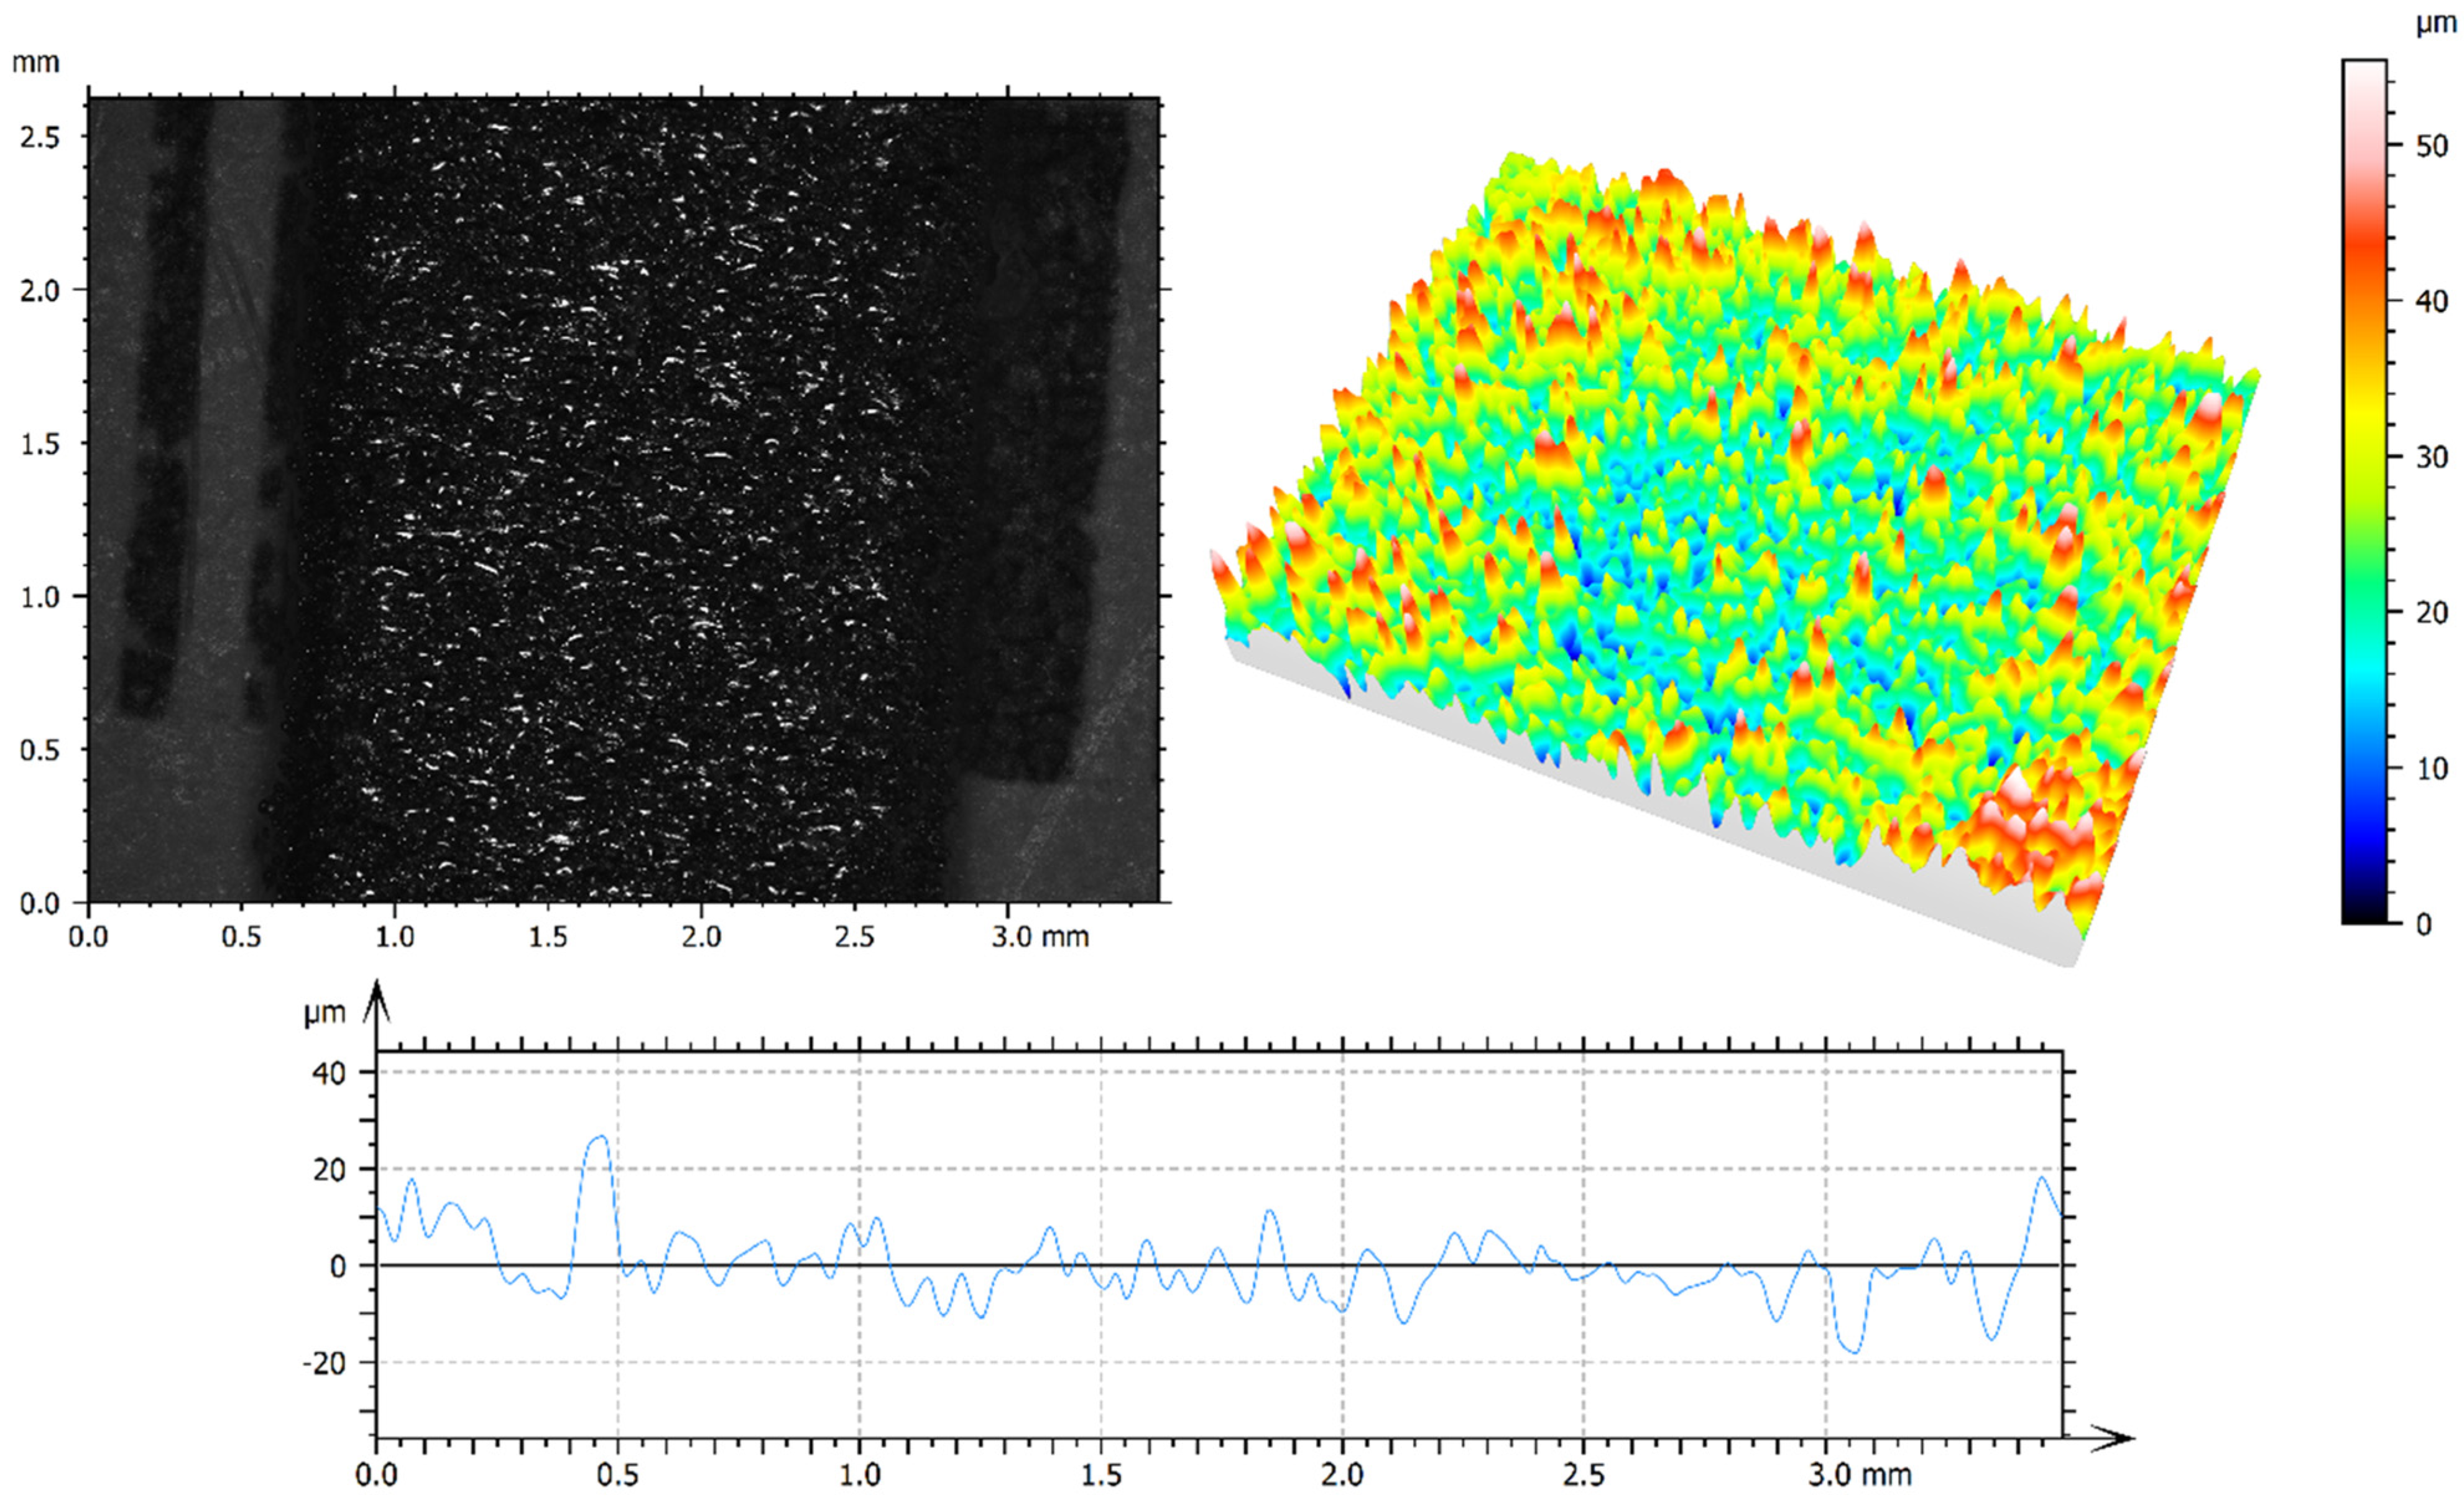
3.1. Confocal Microscopy Measurements
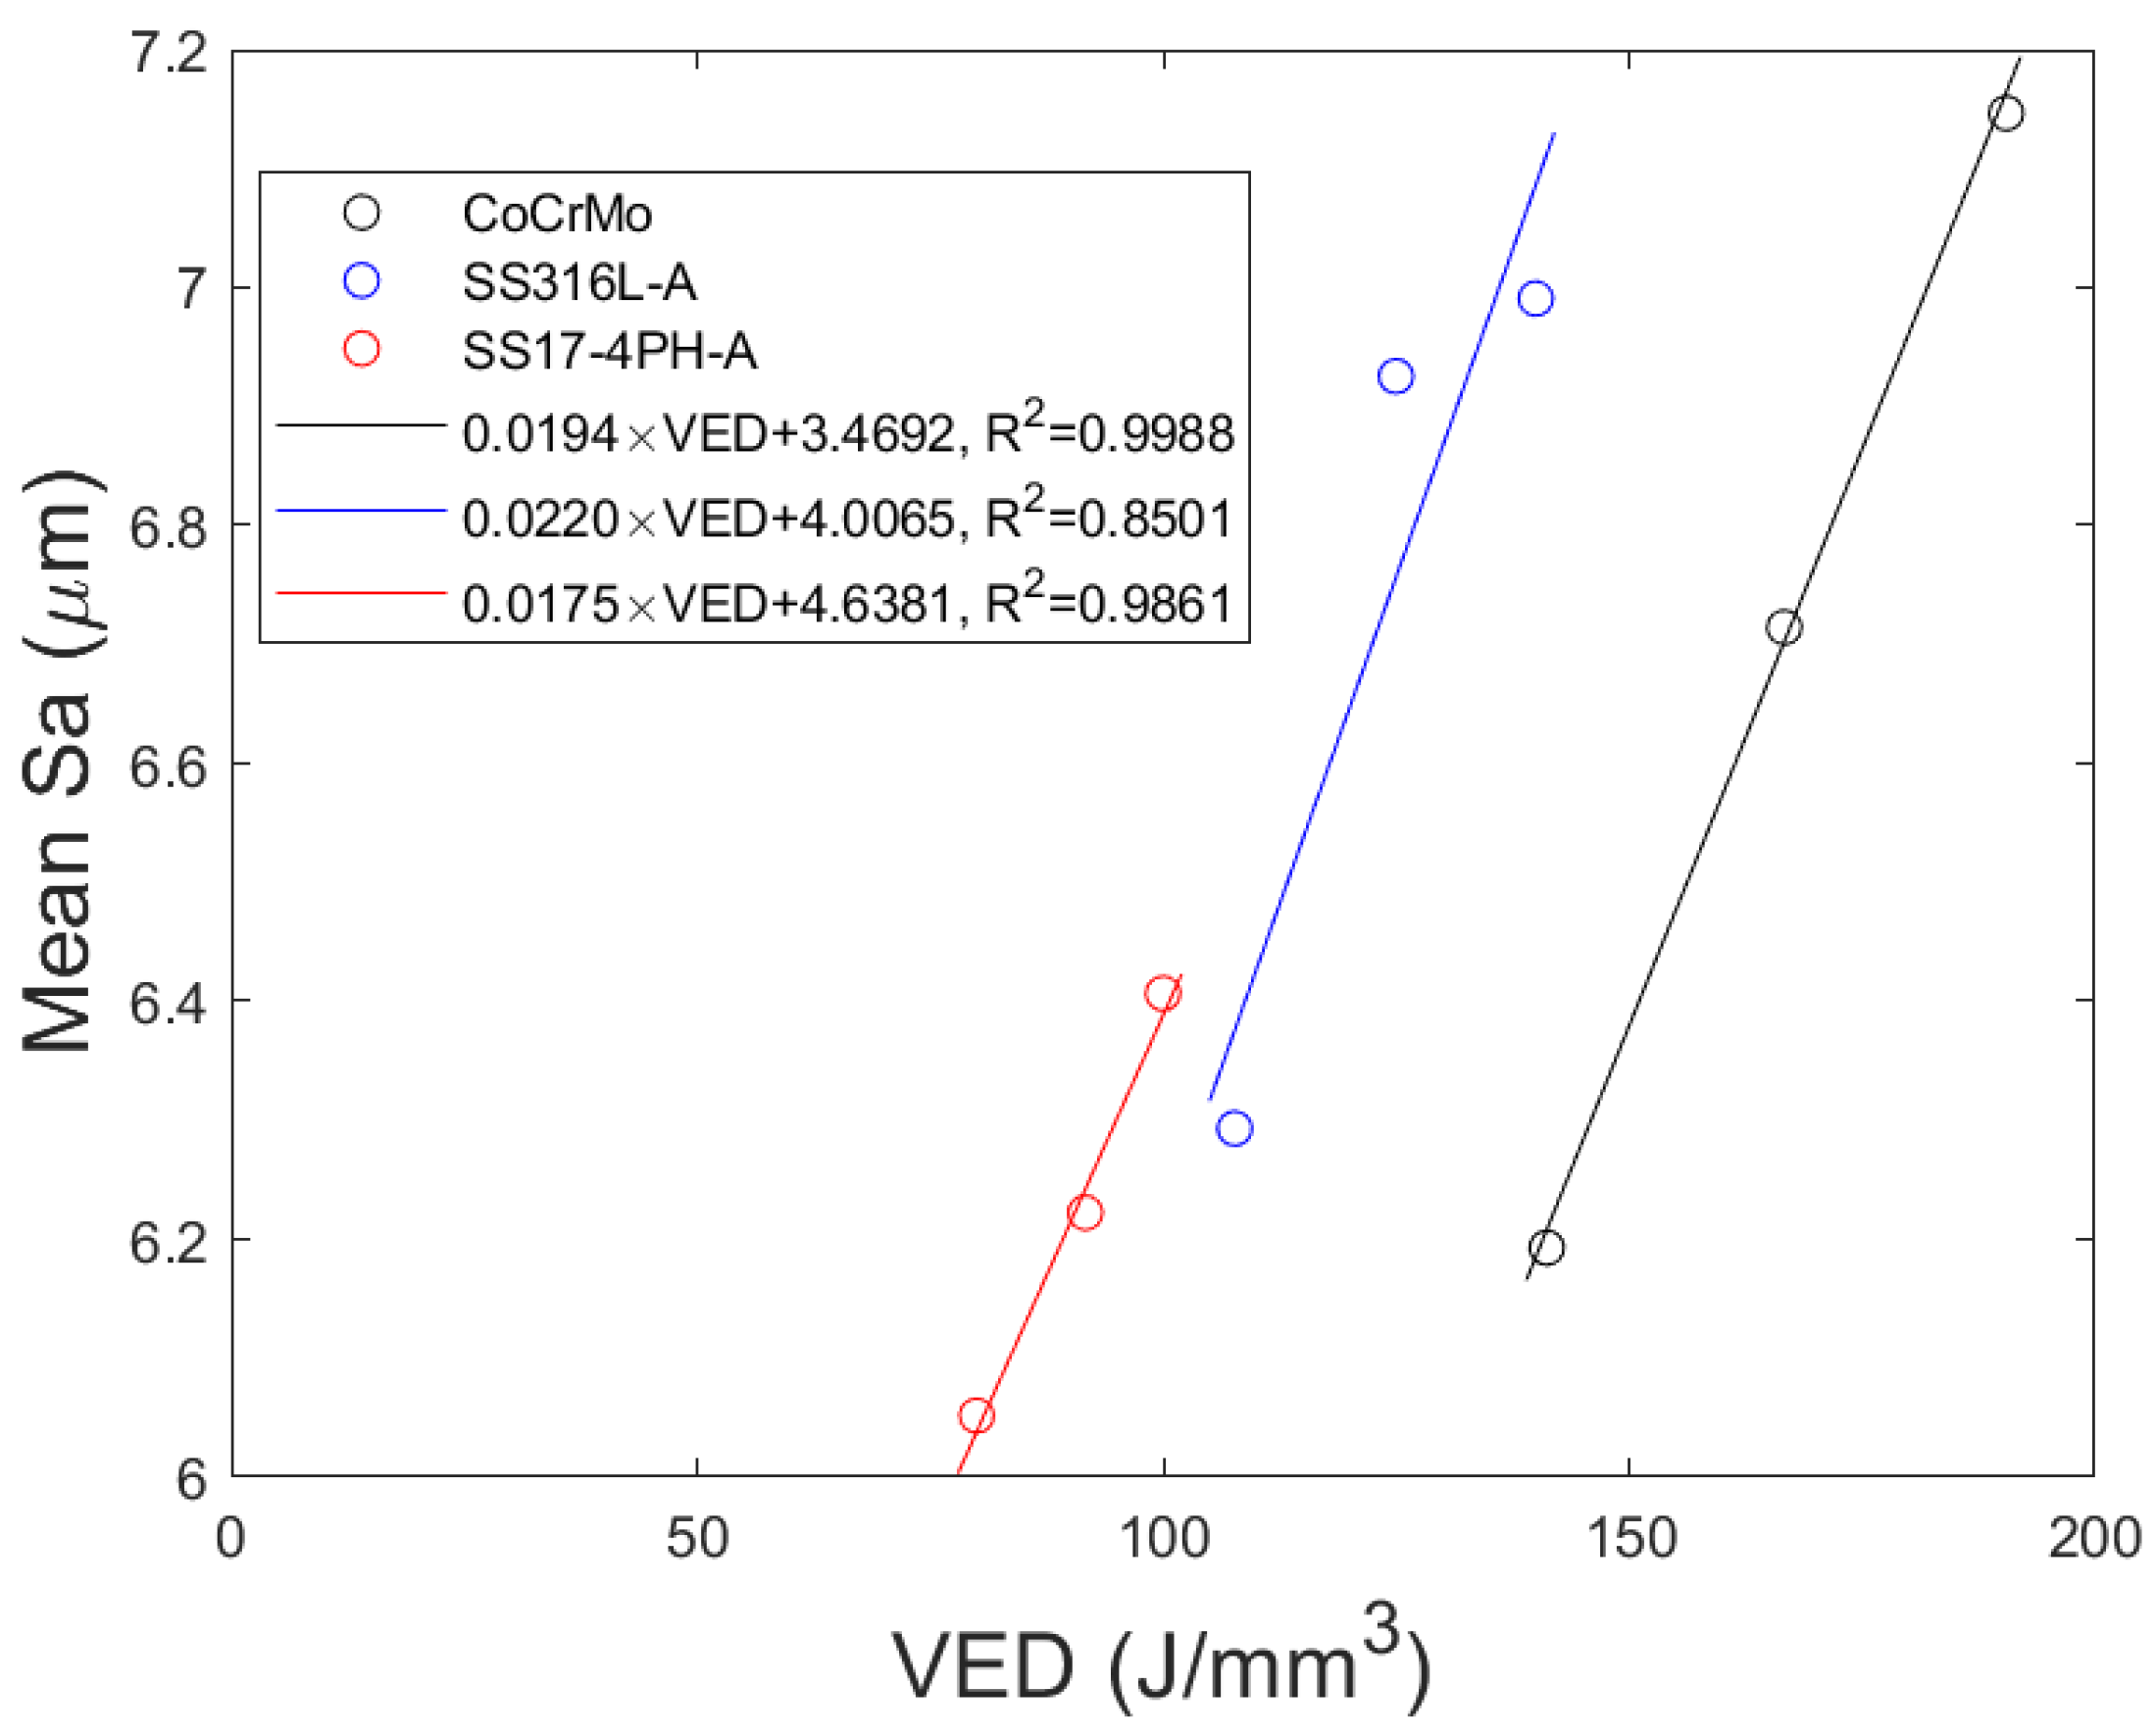
3.2. Quantification of the VED Effect on Surface Characteristics
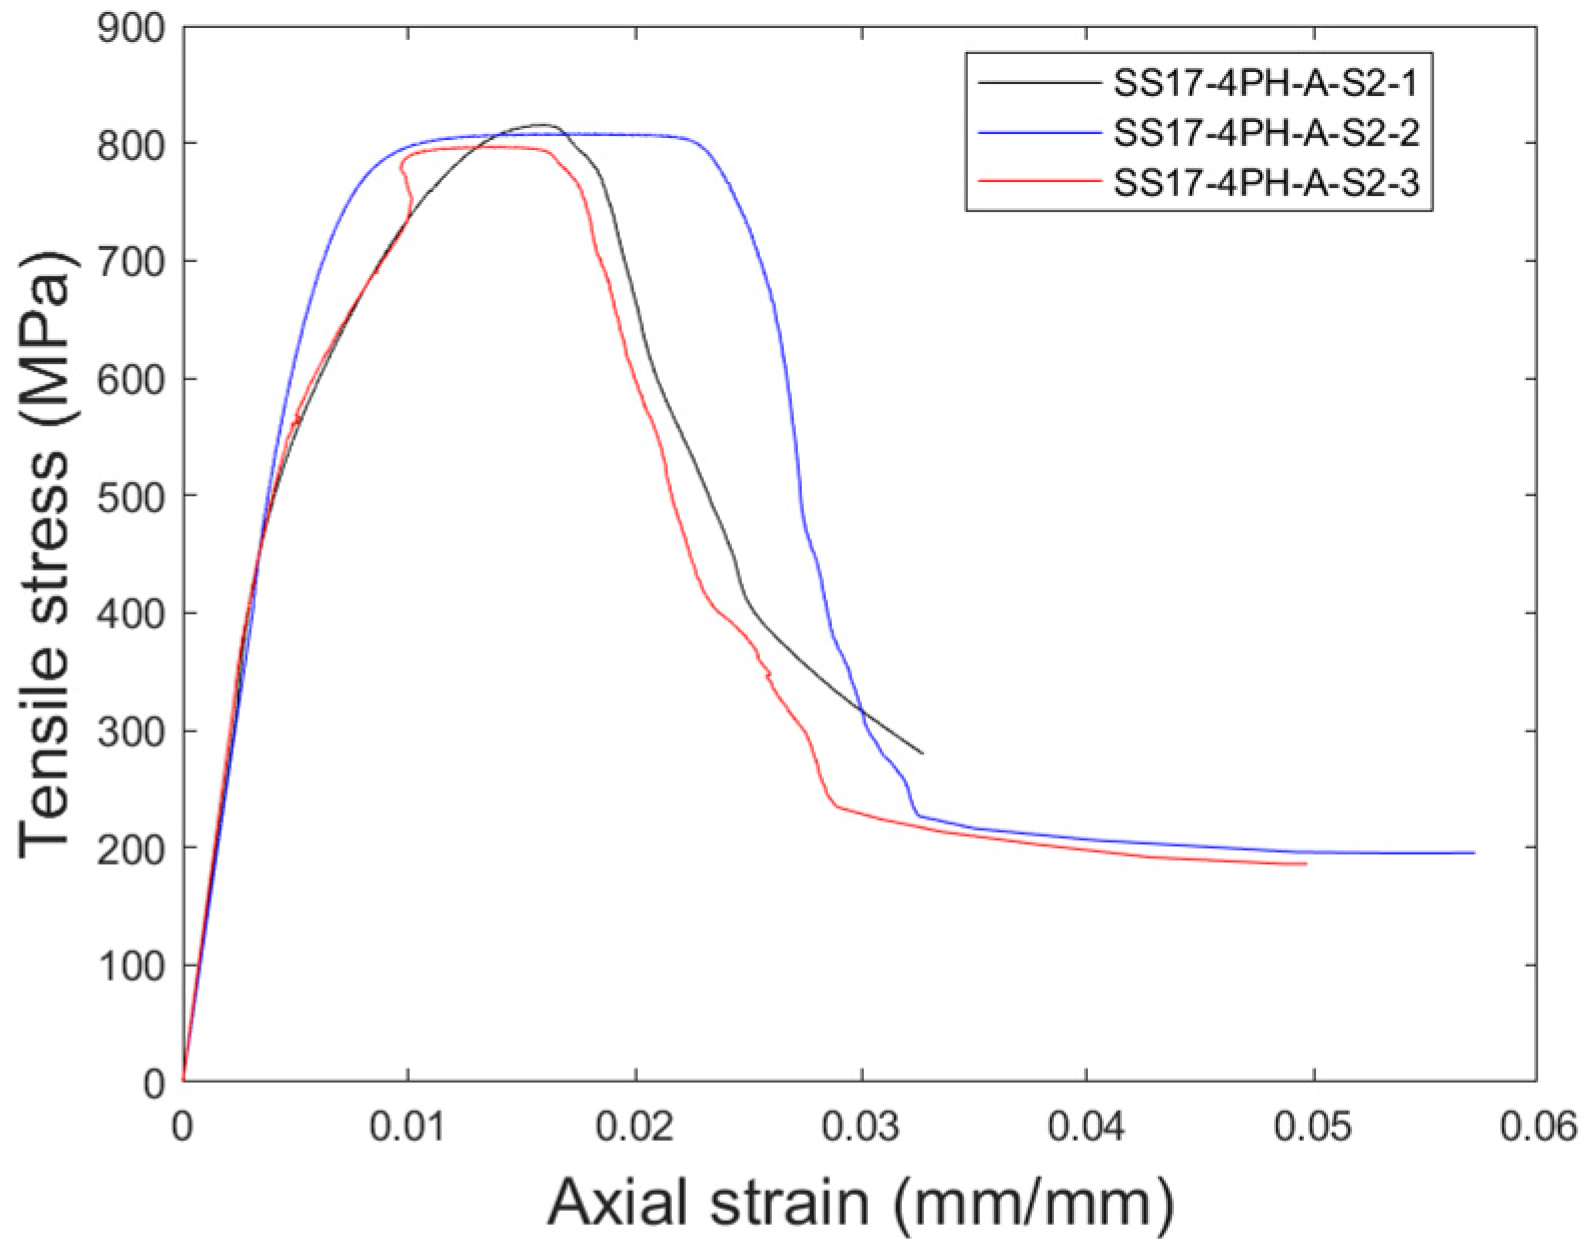
3.3. Tensile Deformation Measurements
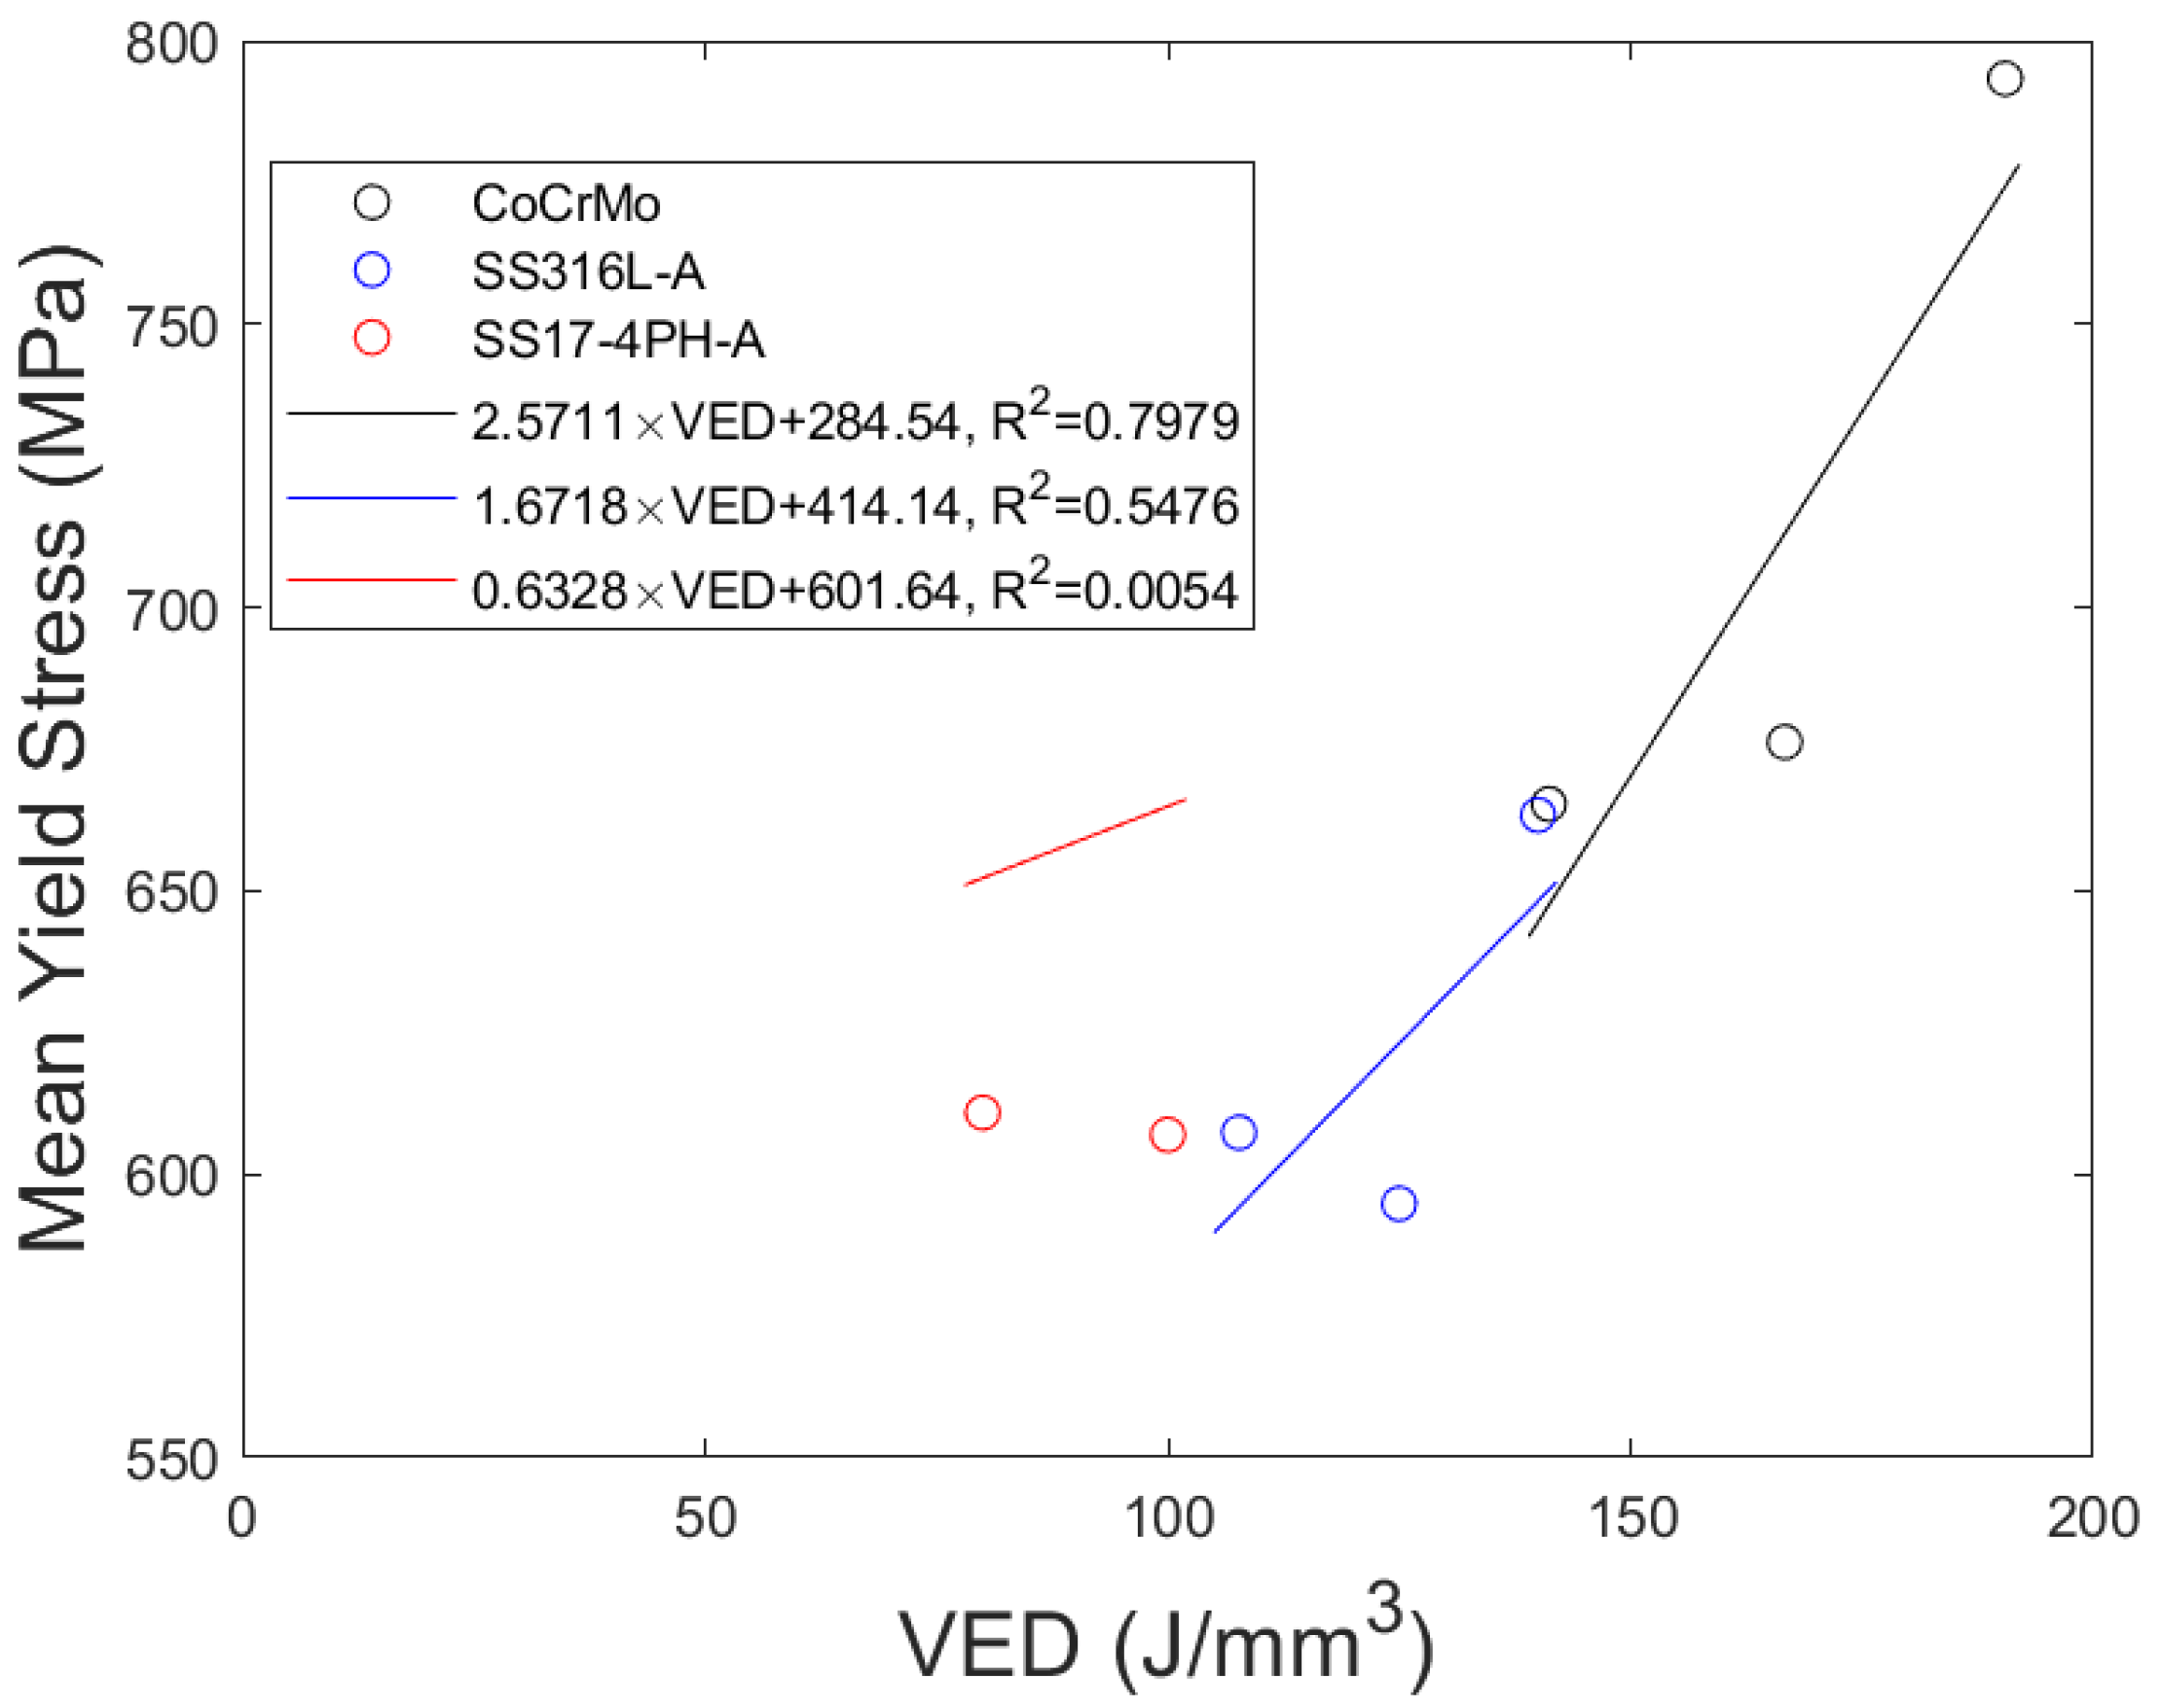
3.4. Quantification of the VED Effect on Mechanical Characteristics
4. Conclusions
Author Contributions
Funding
Data Availability Statement
Conflicts of Interest
References
- ISO/ASTM52900-15; Standard Terminology for Additive Manufacturing—General Princi-ples—Terminology. ASTM International: West Conshohocken, PA, USA, 2015.
- Huber, M.; Ess, J.; Hartmann, M.; Würms, A.; Rettberg, R.; Kränzler, T.; Löffel, K. Process setup for manufacturing of a pump impeller by selective laser melting. In Industrializing Additive Manufacturing—Proceedings of Additive Manufacturing in Products and Applications—AMPA2017; Springer: Cham, Switzerland, 2018; pp. 252–263. [Google Scholar] [CrossRef]
- Khanoki, S.A.; Pasini, D. Fatigue design of a mechanically biocompatible lattice for a proof-of-concept femoral stem. J. Mech. Behav. Biomed. Mater. 2013, 22, 65–83. [Google Scholar] [CrossRef]
- Fotovvati, B.; Balasubramanian, M.; Asadi, E. Modeling and Optimization Approaches of Laser-Based Powder-Bed Fusion Process for Ti-6Al-4V Alloy. Coatings 2020, 10, 1104. [Google Scholar] [CrossRef]
- Yao, D.; Liu, X.; Wang, J.; Fan, W.; Li, M.; Fu, H.; Zhang, H.; Yang, X.; Zou, Q.; An, X. Numerical insights on the spreading of practical 316 L stainless steel powder in SLM additive manufacturing. Powder Technol. 2021, 390, 197–208. [Google Scholar] [CrossRef]
- Ahmadi, M.; Tabary, S.A.A.B.; Rahmatabadi, D.; Ebrahimi, M.S.; Abrinia, K.; Hashemi, R. Review of selective laser melting of magnesium alloys: Advantages, microstructure and mechanical characterizations, defects, challenges, and applications. J. Mater. Res. Technol. 2022, 19, 1537–1562. [Google Scholar] [CrossRef]
- Gokuldoss, P.K.; Kolla, S.; Eckert, J. Additive Manufacturing Processes: Selective Laser Melting, Electron Beam Melting and Binder Jetting—Selection Guidelines. Materials 2017, 10, 672. [Google Scholar] [CrossRef]
- Leo, P.; Cabibbo, M.; Del Prete, A.; Giganto, S.; Martínez-Pellitero, S.; Barreiro, J. Laser Defocusing Effect on the Microstructure and Defects of 17-4PH Parts Additively Manufactured by SLM at a Low Energy Input. Metals 2021, 11, 588. [Google Scholar] [CrossRef]
- Kladovasilakis, N.; Charalampous, P.; Kostavelis, I.; Tzetzis, D.; Tzovaras, D. Impact of metal additive manufacturing parameters on the powder bed fusion and direct energy deposition processes: A comprehensive review. Prog. Addit. Manuf. 2021, 6, 349–365. [Google Scholar] [CrossRef]
- Ninpetch, P.; Kowitwarangkul, P.; Mahathanabodee, S.; Chalermkarnnon, P.; Ratanadecho, P. A review of computer simulations of metal 3D printing. In Proceedings of the Second Materials Research Society of Thailand International Conference, Pattaya, Thailand, 10–12 July 2019; p. 050002. [Google Scholar] [CrossRef]
- Singh, R.; Gupta, A.; Tripathi, O.; Srivastava, S.; Singh, B.; Awasthi, A.; Rajput, S.K.; Sonia, P.; Singhal, P.; Saxena, K.K. Powder bed fusion process in additive manufacturing: An overview. Mater. Today Proc. 2020, 26, 3058–3070. [Google Scholar] [CrossRef]
- Yerubayeva, A.; Shehab, E.; Ali, H. Recent advances and application of Selective Laser Melting (SLM) technology in the aerospace industry. In Proceedings of the International Conference on Informatics, Technology, and Engineering 2021 (InCITE 2021), Surabaya, Indonesia, 25–26 August 2021; p. 030002. [Google Scholar] [CrossRef]
- Tian, Q. The Development Status of Selective Laser Melting Technology (SLM). J. Phys. Conf. Ser. 2021, 1798, 012045. [Google Scholar] [CrossRef]
- Ma, Z.; Gao, M.; Guo, K.; Wang, Q.; Li, L.; Liu, C.; Zhu, G.; Liu, Z. Analysis and Optimization of Energy Consumption for Multi-part Printing Using Selective Laser Melting and Considering the Support Structure. Int. J. Precis. Eng. Manuf. Green Technol. 2023, 10, 693–707. [Google Scholar] [CrossRef]
- Mamo, H.B.; Adamiak, M.; Kunwar, A. 3D printed biomedical devices and their applications: A review on state-of-the-art technologies, existing challenges, and future perspectives. J. Mech. Behav. Biomed. Mater. 2023, 143, 105930. [Google Scholar] [CrossRef]
- Rajendran, S.; Palani, G.; Kanakaraj, A.; Shanmugam, V.; Veerasimman, A.; Gądek, S.; Korniejenko, K.; Marimuthu, U. Metal and Polymer Based Composites Manufactured Using Additive Manufacturing—A Brief Review. Polymers 2023, 15, 2564. [Google Scholar] [CrossRef]
- La Fé-Perdomo, I.; Ramos-Grez, J.A.; Beruvides, G.; Mujica, R.A. Selective laser melting: Lessons from medical devices industry and other applications. Rapid Prototyp. J. 2021, 27, 1801–1830. [Google Scholar] [CrossRef]
- Gao, B.; Zhao, H.; Peng, L.; Sun, Z. A Review of Research Progress in Selective Laser Melting (SLM). Micromachines 2022, 14, 57. [Google Scholar] [CrossRef] [PubMed]
- Pechlivani, E.M.; Kampouris, A.K.; Melidis, L.; Katakalos, K.; Kontodina, T.; Tzovaras, D.; Konstantinidis, A.A. 3D printed Inconel mechanical response related to volumetric energy density. Mater. Today Proc. 2023. [Google Scholar] [CrossRef]
- Nasiri, S.; Khosravani, M.R. Machine learning in predicting mechanical behavior of additively manufactured parts. J. Mater. Res. Technol. 2021, 14, 1137–1153. [Google Scholar] [CrossRef]
- Fielden-Stewart, Z.; Coope, T.; Bacheva, D.; Kim, B.C. Effect of the surface morphology of SLM printed aluminium on the interfacial fracture toughness of metal-composite hybrid joints. Int. J. Adhes. Adhes. 2021, 105, 102779. [Google Scholar] [CrossRef]
- Zhang, S.; Zhang, S.; Li, F.; Li, Z.; Wang, Y.; Liu, B. Selective Laser Melting of Al-Cu-Mn-Mg Alloys: Processing and Mechanical Properties. Metals 2023, 13, 1520. [Google Scholar] [CrossRef]
- Ozsoy, A.; Yasa, E.; Keles, M.; Tureyen, E.B. Pulsed-mode Selective Laser Melting of 17-4 PH stainless steel: Effect of laser parameters on density and mechanical properties. J. Manuf. Process. 2021, 68, 910–922. [Google Scholar] [CrossRef]
- Ghayoor, M.; Lee, K.; He, Y.; Chang, C.; Paul, B.K.; Pasebani, S. Selective laser melting of 304L stainless steel: Role of volumetric energy density on the microstructure, texture and mechanical properties. Addit. Manuf. 2020, 32, 101011. [Google Scholar] [CrossRef]
- Didier, P.; Le Coz, G.; Robin, G.; Lohmuller, P.; Piotrowski, B.; Moufki, A.; Laheurte, P. Consideration of SLM additive manufacturing supports on the stability of flexible structures in finish milling. J. Manuf. Process. 2021, 62, 213–220. [Google Scholar] [CrossRef]
- Gong, H.; Rafi, K.; Gu, H.; Starr, T.; Stucker, B. Analysis of defect generation in Ti–6Al–4V parts made using powder bed fusion additive manufacturing processes. Addit. Manuf. 2014, 1–4, 87–98. [Google Scholar] [CrossRef]
- Order MetcoAdd 75A Additive Manufacturing Powder Online at myMetco. (n.d.). Available online: https://mymetco-europe.oerlikon.com/en-us/product/metcoadd75a?isRegionSelection (accessed on 27 July 2023).
- Order MetcoAdd 316L-A Additive Manufacturing Powder Online at myMetco. (n.d.). Available online: https://mymetco-europe.oerlikon.com/en-us/product/metcoadd316la?isRegionSelection (accessed on 27 July 2023).
- Order METCOADD 17-4PH-A Additive Manufacturing Powder Online at myMetco. (n.d.). Available online: https://mymetco-europe.oerlikon.com/en-us/product/metcoadd174pha (accessed on 27 July 2023).
- Chen, F.; Wang, Q.; Zhang, C.; Huang, Z.; Jia, M.; Shen, Q. Microstructures and mechanical behaviors of additive manufactured Inconel 625 alloys via selective laser melting and laser engineered net shaping. J. Alloys Compd. 2022, 917, 165572. [Google Scholar] [CrossRef]
- Papadimitriou, C.; Melidis, L.; Kotoulas, L.; Makris, N.; Katakalos, K. Thermomechanical Characterization of CFRPs under Elevated Temperatures for Strengthening Existing Structures. Fibers 2021, 9, 80. [Google Scholar] [CrossRef]
- EN 10002-1:2001; Metallic Materials—Tensile Testing—Part 1: Method of Test (at Ambient Temperature). CEN—European Committee for Standardization: Brussels, Belgium, 2001.
- Sun, D.; Gu, D.; Lin, K.; Ma, J.; Chen, W.; Huang, J.; Sun, X.; Chu, M. Selective laser melting of titanium parts: Influence of laser process parameters on macro- and microstructures and tensile property. Powder Technol. 2019, 342, 371–379. [Google Scholar] [CrossRef]


| Material | Batch | Laser Power (W) | Scan Speed (mm/s) | VED (J/mm3) | Hatching Distance (μm) | Layer Thickness (μm) | Spot Size (μm) | Number of Specimens |
|---|---|---|---|---|---|---|---|---|
| CoCrMo | S1 | 105 | 630 | 166.666 | 40 | 25 | 40 | 4 |
| S2 | 120 | 850 | 141.176 | 40 | 25 | 40 | 4 | |
| S3 | 120 | 630 | 190.476 | 40 | 25 | 40 | 4 | |
| SS316L-A | S1 | 125 | 1000 | 125 | 40 | 25 | 40 | 4 |
| S2 | 140 | 1300 | 107.692 | 40 | 25 | 40 | 4 | |
| S3 | 140 | 1000 | 140 | 40 | 25 | 40 | 4 | |
| SS17-4PH-A | S1 | 110 | 1200 | 91.666 | 40 | 25 | 40 | 4 |
| S2 | 120 | 1500 | 80 | 40 | 25 | 40 | 4 | |
| S3 | 120 | 1200 | 100 | 40 | 25 | 40 | 4 |
| CoCrMo | Sa (µm) | ||
|---|---|---|---|
| Magnification ×5 | Location #1 | Location #2 | Location #3 |
| Specimen 1 | 8.395 | 6.698 | 5.597 |
| Specimen 2 | 7.208 | 7.170 | 5.765 |
| Specimen 3 | 6.410 | 6.855 | 5.313 |
| Specimen 4 | 7.838 | 7.468 | 6.133 |
| Mean | 7.463 | 7.048 | 5.702 |
| Magnification ×10 | Location #1 | Location #2 | Location #3 |
| Specimen 1 | 6.069 | 7.556 | 5.835 |
| Specimen 2 | 6.182 | 6.062 | 5.720 |
| Specimen 3 | 5.423 | 5.428 | 5.578 |
| Specimen 4 | 6.065 | 6.505 | 6.422 |
| Mean | 6.065 | 6.388 | 5.888 |
| Magnification ×20 | Location #1 | Location #2 | Location #3 |
| Specimen 1 | 6.211 | 7.538 | 5.584 |
| Specimen 2 | 5.738 | 5.682 | 4.881 |
| Specimen 3 | 5.342 | 6.181 | 5.202 |
| Specimen 4 | 7.013 | 5.913 | 6.695 |
| Mean | 6.076 | 6.328 | 5.591 |
| SS316L-A | Sa (µm) | ||
|---|---|---|---|
| Magnification ×5 | Location #1 | Location #2 | Location #3 |
| Specimen 1 | 7.281 | 7.385 | 6.063 |
| Specimen 2 | 7.207 | 7.489 | 6.080 |
| Specimen 3 | 6.545 | 6.788 | 5.546 |
| Specimen 4 | 7.342 | 7.846 | 5.754 |
| Mean | 7.094 | 7.385 | 5.861 |
| Magnification ×10 | Location #1 | Location #2 | Location #3 |
| Specimen 1 | 6.632 | 7.045 | 7.226 |
| Specimen 2 | 6.172 | 6.210 | 6.840 |
| Specimen 3 | 7.156 | 7.089 | 7.482 |
| Specimen 4 | 7.238 | 8.887 | 7.698 |
| Mean | 6.800 | 7.308 | 7.312 |
| Magnification ×20 | Location #1 | Location #2 | Location #3 |
| Specimen 1 | 6.414 | 7.058 | 7.270 |
| Specimen 2 | 7.795 | 7.100 | 7.484 |
| Specimen 3 | 7.000 | 6.982 | 6.628 |
| Specimen 4 | 7.015 | 9.973 | 6.819 |
| Mean | 7.056 | 7.778 | 7.050 |
| SS17-4PH-A | Sa (µm) | ||
|---|---|---|---|
| Magnification ×5 | Location #1 | Location #2 | Location #3 |
| Specimen 1 | 7.318 | 6.940 | 6.234 |
| Specimen 2 | 6.482 | 6.517 | 5.668 |
| Specimen 3 | 6.443 | 6.549 | 5.162 |
| Specimen 4 | 6.500 | 6.680 | 6.040 |
| Mean | 6.686 | 6.671 | 5.776 |
| Magnification ×10 | Location #1 | Location #2 | Location #3 |
| Specimen 1 | 6.788 | 7.144 | 6.830 |
| Specimen 2 | 6.154 | 6.551 | 6.772 |
| Specimen 3 | 9.197 | 6.610 | 6.331 |
| Specimen 4 | 6.657 | 7.224 | 7.337 |
| Mean | 7.199 | 6.882 | 6.818 |
| Magnification ×20 | Location #1 | Location #2 | Location #3 |
| Specimen 1 | 7.036 | 7.769 | 7.227 |
| Specimen 2 | 6.233 | 6.922 | 6.596 |
| Specimen 3 | 7.112 | 7.801 | 7.580 |
| Specimen 4 | 6.864 | 7.337 | 7.304 |
| Mean | 6.811 | 7.460 | 7.177 |
| CoCrMo | SS316L-A | SS17-4PH-A | |||
|---|---|---|---|---|---|
| Mean Sa (μm) | VED (J/mm3) | Mean Sa (μm) | VED (J/mm3) | Mean Sa (μm) | VED (J/mm3) |
| 6.714 | 166.667 | 6.925 | 125.000 | 6.222 | 91.667 |
| 6.193 | 141.176 | 6.293 | 107.692 | 6.052 | 80.000 |
| 7.146 | 190.476 | 6.990 | 140.000 | 6.407 | 100.000 |
| Material | a | b |
|---|---|---|
| CrCoMo | 0.0194 | 3.4692 |
| SS316L-A | 0.0220 | 4.0065 |
| SS17-4PH-A | 0.0175 | 4.6381 |
| Inconel [11] | 0.0430 | 9.0000 |
| Material | Batch | Specimen | Width b (mm) | Thickness t (mm) | Grips Distance (mm) |
|---|---|---|---|---|---|
| CoCrMo | S1 | 1 | 2.07 | 1.05 | 23 |
| 2 | 2.05 | 1.02 | 23 | ||
| 3 | 2.05 | 1.06 | 21 | ||
| S2 | 1 | 2.03 | 1.02 | 21 | |
| 2 | 2.00 | 1.00 | 19 | ||
| 3 | 2.04 | 1.03 | 28 | ||
| S3 | 1 | 2.07 | 1.07 | 19 | |
| 2 | 1.92 | 0.93 | 20 | ||
| 3 | 1.95 | 0.94 | 19 | ||
| SS316L-A | S1 | 1 | 1.92 | 0.90 | 20 |
| 2 | 2.05 | 1.02 | 23 | ||
| 3 | 1.93 | 0.93 | 19 | ||
| S2 | 1 | 1.94 | 0.93 | 20 | |
| 2 | 1.95 | 0.91 | 20 | ||
| 3 | 1.89 | 0.93 | 20 | ||
| S3 | 1 | 1.93 | 0.90 | 21 | |
| 2 | 1.92 | 0.93 | 20 | ||
| 3 | 1.95 | 0.94 | 19 | ||
| SS17-4PH-A | S1 | 1 | 2.20 | 1.17 | 23 |
| 2 | 2.13 | 1.15 | 20 | ||
| 3 | 2.20 | 1.19 | 20 | ||
| S2 | 1 | 2.17 | 1.15 | 22 | |
| 2 | 2.17 | 1.16 | 21 | ||
| 3 | 2.20 | 1.15 | 20 | ||
| S3 | 1 | 2.21 | 1.18 | 24 | |
| 2 | 2.16 | 1.17 | 20 | ||
| 3 | 2.17 | 1.16 | 19 |
| Material | Batch | Specimen | (MPa) | (MPa) | (mm/mm) | (MPa) | (mm/mm) |
|---|---|---|---|---|---|---|---|
| CoCrMo | S1 | 1 | 123,571 | 703.01 | 0.0057 | 899.48 | 0.0232 |
| 2 | 141,030 | 632.37 | 0.0045 | 893.46 | 0.0192 | ||
| 3 | 92,071 | 693.30 | 0.0075 | 906.44 | 0.0325 | ||
| average | 118,891 | 676.23 | 0.0059 | 899.79 | 0.025 | ||
| deviation | ±17% | ±5% | ±21% | ±1% | ±22% | ||
| S2 | 1 | 119,252 | 679.68 | 0.0057 | 845.31 | 0.0177 | |
| 2 | 230,902 | 666.35 | 0.0066 | 913.40 | 0.0374 | ||
| 3 | 207,308 | 649.90 | 0.0063 | 915.14 | 0.0335 | ||
| average | 185,820 | 665.31 | 0.0062 | 891.29 | 0.030 | ||
| deviation | ±26% | ±2% | ±6% | ±4% | ±29% | ||
| S3 | 1 | 133,283 | 653.44 | 0.0049 | 928.32 | 0.0369 | |
| 2 | 201,262 | 857.37 | 0.0043 | 1061.11 | 0.0386 | ||
| 3 | 116,622 | 869.14 | 0.0075 | 1124.65 | 0.0412 | ||
| average | 150,389 | 793.32 | 0.0055 | 1038.03 | 0.039 | ||
| deviation | ±24% | ±12% | ±25% | ±8% | ±5% | ||
| SS316L-A | S1 | 1 | 118,713 | 658.86 | 0.0056 | 778.63 | 0.1898 |
| 2 | 85,153 | 513.69 | 0.0060 | 605.17 | 0.1573 | ||
| 3 | 61,997 | 611.78 | 0.0099 | 728.80 | 0.1867 | ||
| average | 88,621 | 594.78 | 0.0072 | 704.20 | 0.178 | ||
| deviation | ±26% | ±10% | ±27% | ±10% | ±8% | ||
| S2 | 1 | 85,635 | 587.46 | 0.0069 | 689.30 | 0.1753 | |
| 2 | 70,456 | 622.83 | 0.0088 | 710.11 | 0.1824 | ||
| 3 | 66,349 | 611.74 | 0.0092 | 706.88 | 0.1783 | ||
| average | 74,147 | 607.34 | 0.0083 | 702.09 | 0.179 | ||
| deviation | ±11% | ±2% | ±12% | ±1% | ±2% | ||
| S3 | 1 | 110,083 | 661.91 | 0.0060 | 757.13 | 0.1196 | |
| 2 | 87,681 | 648.84 | 0.0074 | 741.08 | 0.2013 | ||
| 3 | 93,181 | 679.38 | 0.0073 | 781.58 | 0.2231 | ||
| average | 96,982 | 663.38 | 0.0069 | 759.93 | 0.181 | ||
| deviation | ±10% | ±2% | ±9% | ±2% | ±25% | ||
| SS17-4PH-A | S1 | 1 | 113,286 | 740.40 | 0.0065 | 859.06 | 0.0304 |
| 2 | 83,734 | 839.85 | 0.0100 | 912.45 | 0.0400 | ||
| 3 | 112,212 | 777.63 | 0.0069 | 843.53 | 0.0191 | ||
| average | 103,077 | 785.96 | 0.0078 | 871.68 | 0.030 | ||
| deviation | ±13% | ±5% | ±20% | ±3% | ±29% | ||
| S2 | 1 | 113,168 | 542.38 | 0.0048 | 815.84 | 0.0160 | |
| 2 | 107,638 | 727.12 | 0.0068 | 808.25 | 0.0178 | ||
| 3 | 110,626 | 563.08 | 0.0051 | 797.15 | 0.0132 | ||
| average | 110,477 | 610.86 | 0.0055 | 807.08 | 0.016 | ||
| deviation | ±2% | ±14% | ±16% | ±1% | ±12% | ||
| S3 | 1 | 80,180 | 519.57 | 0.0065 | 890.91 | 0.0434 | |
| 2 | 110,732 | 471.72 | 0.0043 | 890.03 | 0.0564 | ||
| 3 | 83,278 | 829.58 | 0.0100 | 910.37 | 0.0513 | ||
| average | 91,397 | 606.95 | 0.0069 | 897.10 | 0.050 | ||
| deviation | ±15% | ±26% | ±34% | ±1% | ±11% |
| Material | c | d | e | f |
|---|---|---|---|---|
| CoCrMo | 2.5711 | 284.54 | 0.257 | −17.402 |
| SS316L-A | 1.6718 | 414.14 | 0.3786 | 76.967 |
| SS17-4PH-A | 0.6328 | 601.64 | 1.5077 | −112.24 |
Disclaimer/Publisher’s Note: The statements, opinions and data contained in all publications are solely those of the individual author(s) and contributor(s) and not of MDPI and/or the editor(s). MDPI and/or the editor(s) disclaim responsibility for any injury to people or property resulting from any ideas, methods, instructions or products referred to in the content. |
© 2023 by the authors. Licensee MDPI, Basel, Switzerland. This article is an open access article distributed under the terms and conditions of the Creative Commons Attribution (CC BY) license (https://creativecommons.org/licenses/by/4.0/).
Share and Cite
Pechlivani, E.M.; Melidis, L.; Pemas, S.; Katakalos, K.; Tzovaras, D.; Konstantinidis, A.A. On the Effect of Volumetric Energy Density on the Characteristics of 3D-Printed Metals and Alloys. Metals 2023, 13, 1776. https://doi.org/10.3390/met13101776
Pechlivani EM, Melidis L, Pemas S, Katakalos K, Tzovaras D, Konstantinidis AA. On the Effect of Volumetric Energy Density on the Characteristics of 3D-Printed Metals and Alloys. Metals. 2023; 13(10):1776. https://doi.org/10.3390/met13101776
Chicago/Turabian StylePechlivani, Eleftheria Maria, Lazaros Melidis, Sotirios Pemas, Konstantinos Katakalos, Dimitrios Tzovaras, and Avraam A. Konstantinidis. 2023. "On the Effect of Volumetric Energy Density on the Characteristics of 3D-Printed Metals and Alloys" Metals 13, no. 10: 1776. https://doi.org/10.3390/met13101776
APA StylePechlivani, E. M., Melidis, L., Pemas, S., Katakalos, K., Tzovaras, D., & Konstantinidis, A. A. (2023). On the Effect of Volumetric Energy Density on the Characteristics of 3D-Printed Metals and Alloys. Metals, 13(10), 1776. https://doi.org/10.3390/met13101776