Article

Effects of Stress on Loss and Magnetic Properties of Fe80Co3Si3B10P1C3 Amorphous Iron Cores

1
Institute for Advanced Materials and Technology, University of Science and Technology Beijing, Beijing 100083, China
2
Central Iron and Steel Research Institute, Beijing 100081, China
3
Jiangsu JITRI Advanced Energy Materials Research Institute Co., Ltd., Changzhou 213001, China
4
School of Mechanical, Electrical & Information Engineering, Shandong University, Weihai 264209, China
*
Authors to whom correspondence should be addressed.
Metals 2023, 13(11), 1823; https://doi.org/10.3390/met13111823
Submission received: 26 September 2023 / Revised: 18 October 2023 / Accepted: 28 October 2023 / Published: 29 October 2023
(This article belongs to the Special Issue Soft Magnetic Composites: Manufacture, Properties and Applications)

Abstract

:
The research on how to reduce energy consumption and improve the efficiency of amorphous motors has extensive coverage. This study systematically investigates the influence of internal stress induced by impregnation curing and interference fit on the soft magnetic properties and loss characteristics of Fe80Co3Si3B10P1C3 (CAF4) amorphous alloy iron cores. The amorphous iron core samples undergo analysis through differential scanning calorimetry (DSC), transmission electron microscopy (TEM), X-ray diffraction (XRD), magnetic performance testing equipment, flexible pressure sensors, and magnetostriction testers. The CAF4 amorphous iron core after impregnation curing (AIC) exhibits the lowest loss of P1.2T,1.5 kHz = 22.8 W/kg when annealed at 260 °C, representing a 21% increase compared to the pre-impregnation curing (BIC) state. Within the commonly utilized interference fit range, the loss growth rate of CAF4 amorphous iron cores is lower than that of Fe80Si9B11 (1K101). Likewise, at a frequency of 50 Hz and an excitation of 1000 A/m, the magnetostriction coefficient of CAF4 is smaller than that of 1K101. Within the typical interference fit range, the magnetization performance of CAF4 amorphous iron cores surpasses that of 1K101, favoring lightweight and compact motor designs and reducing copper losses. Consequently, CAF4 amorphous iron cores exhibit significant advantages when employed in motors.

1. Introduction

Amorphous alloy soft magnetic materials possess high magnetic permeability, elevated electrical resistivity, low coercivity, and minimal core loss. They exhibit facile magnetization and demagnetization processes, surpassing traditional silicon steel sheet materials in soft magnetic performance [1,2,3,4,5]. Electric motors are pivotal power devices in industrial production and daily life, with their electricity consumption ranking at the forefront among various electrical appliances. Globally, electric motors consume over 50% of the world’s total electricity and around 70% of industrial electricity. At higher frequencies, amorphous alloy motor cores can substantially reduce motor losses, boosting efficiency by 3–20%. These amorphous alloy motors feature high power density, light weight, compact dimensions, and reduced heat generation, addressing the issue of oversized volumes necessitated by heat dissipation devices in traditional high-frequency devices. They hold promise in electric drives, high-speed spindles, aviation generators, and military applications [6,7,8,9,10,11,12].
Nonetheless, amorphous materials suffer from drawbacks such as lower saturation magnetic induction strength compared to silicon steel and a larger magnetostriction coefficient. These drawbacks impede their widespread adoption in motors. Notably, the stress sensitivity of amorphous materials directly affects their preparation and application in amorphous motors. Moreover, motor assembly often involves interference fits, resulting in deteriorated loss performance of amorphous alloy materials. Extensive research has been conducted on the effect of lamination processing on the loss performance of amorphous alloys both domestically and internationally [13,14,15,16]. However, with regard to the impact of interference fit processing, only a limited number of studies have explored its influence on the iron loss of cores, such as silicon steel sheets [17,18]. It is important to note that the pressurization method differs from the interference fit process, and the trends in loss variation under various interference amounts have not been thoroughly analyzed. Scarce literature addresses the impact of interference fit processing on the iron loss of amorphous alloy motors, particularly in the realm of quantitative testing for high-performance amorphous iron cores.
This paper focuses on the universal Fe80Si9B11 (1K101) and high-performance Fe80Co3Si3B10P1C3 (CAF4) amorphous iron cores, employing a quantitative testing approach to replicate compressive stress conditions similar to real-world installation. The study investigates the loss and magnetic property variations of amorphous iron cores subjected to interference fits while varying the compressive stress levels.

2. Materials and Methods

The impregnation-cured test samples for stress testing:
Amorphous alloy strips with compositions of 1K101 and CAF4 were fabricated through planar flow continuous casting. These strips possessed a width measuring 150 ± 0.5 mm and a thickness of 25 ± 1 µm. Following this, the wide strips were sectioned into 10 mm narrow strips, which were then coiled to form circular amorphous specimens. The resulting specimens had an outer diameter (φouter) of 35 mm, an inner diameter (φinner) of 25 mm, and a height (h) of 10 mm.
Samples for simulating interference fit-induced compressive stress:
The 150 mm wide strip material was cut horizontally into 100 × 150 mm slices.
Normal annealing (NA): The amorphous iron core is placed within the annealing area of the furnace. The furnace door is sealed, and the interior is subjected to evacuation prior to being charged with nitrogen gas. Subsequently, the furnace temperature is elevated from ambient conditions to the predetermined holding temperature (1K101 holding temperature: 370–410 °C and CAF4 holding temperature: 240–280 °C) at a heating rate of 6 °C/min. The holding temperature is upheld for a duration of 40 min, after which the furnace is gradually cooled until it attains room temperature, facilitating the extraction of the sample.
For the 100 × 150 mm slices, the holding temperature is upheld for a duration of 60 min, after which the furnace is gradually cooled until it attains room temperature, facilitating the extraction of the sample, and the other steps were the same as above.
Impregnation curing: The annealed sample is immersed in an epoxy resin solution. The 100 × 150 mm sliced samples that need to be soaked are clamped. After drying and solidification at 120–160 °C, amorphous blocks are formed. These blocks are then processed into circular amorphous iron cores with an outer diameter of φouter = 80 mm, an inner diameter of φinner = 70 mm, and a height of h = 20 mm through wire cutting (wire cutting is not required for the circular samples in the impregnation curing stress test).
The compressive stress test method:
Interference fit is a connection method that generates radial pressure through the interference between mating surfaces, which generates friction to transmit torque and axial force. This connection method will not damage the structure of the contact surface, has good mechanical neutrality, and can withstand large axial forces or torques. Therefore, it is widely used [19]. Initially, a separate aluminum alloy frame (non-magnetic material) is fabricated, leaving space for pressurization and bolt holes. The frame’s ends are flat for the calibration of a flexible sensor. To evenly distribute pressure to the amorphous iron core, a load-bearing film is added between the aluminum alloy frame, the flexible sensor, and the amorphous iron core. The flexible sensor is connected to a pressure measuring instrument for displaying pressure data, as shown in Figure 1. The new flexible pressure sensor was installed in an aluminum alloy frame before use, as shown in Figure 1. It pressurizes through the planes on both sides and calibrates according to standard values to ensure the correctness of the flexible pressure sensor test load.
Test method: The amorphous nature of the alloy strip is assessed using X-ray diffraction (XRD) with Cu Kα (λ = 0.15406 nm) radiation in the range of 30–90°, with each step taking 0.2 s and a step size of 0.02°. FEI Strata 400S focused ion beam scanning electron microscopy (FIB-SEM) is used to cut the ribbon, and FEI Talos F200s transmission electron microscopy (TEM) is employed to observe the cross-section of the ribbon (FEI, USA). Thermal parameters, including crystallization temperature (Tx) and crystallization peak (Tp), are analyzed by differential thermal analysis (DSC) at a heating rate of 10 °C/min under the protection of argon gas. This establishes an appropriate range of annealing temperatures. The loss and hysteresis loops of the amorphous iron core are measured using both direct current (model TD8150) and alternating current (model TK7500) magnetic performance testing instruments. A magnetostriction measuring instrument (NIM-500MS, National Institute of Metrology, Beijing, China) is used to measure the magnetostriction coefficient λ or λpp at a frequency of 50 Hz and an excitation of 0–1000 A/m. A flexible pressure sensor (model RFP-XW1801) is utilized to accurately measure pressure as the load on the amorphous iron core increases.

3. Results and Discussion

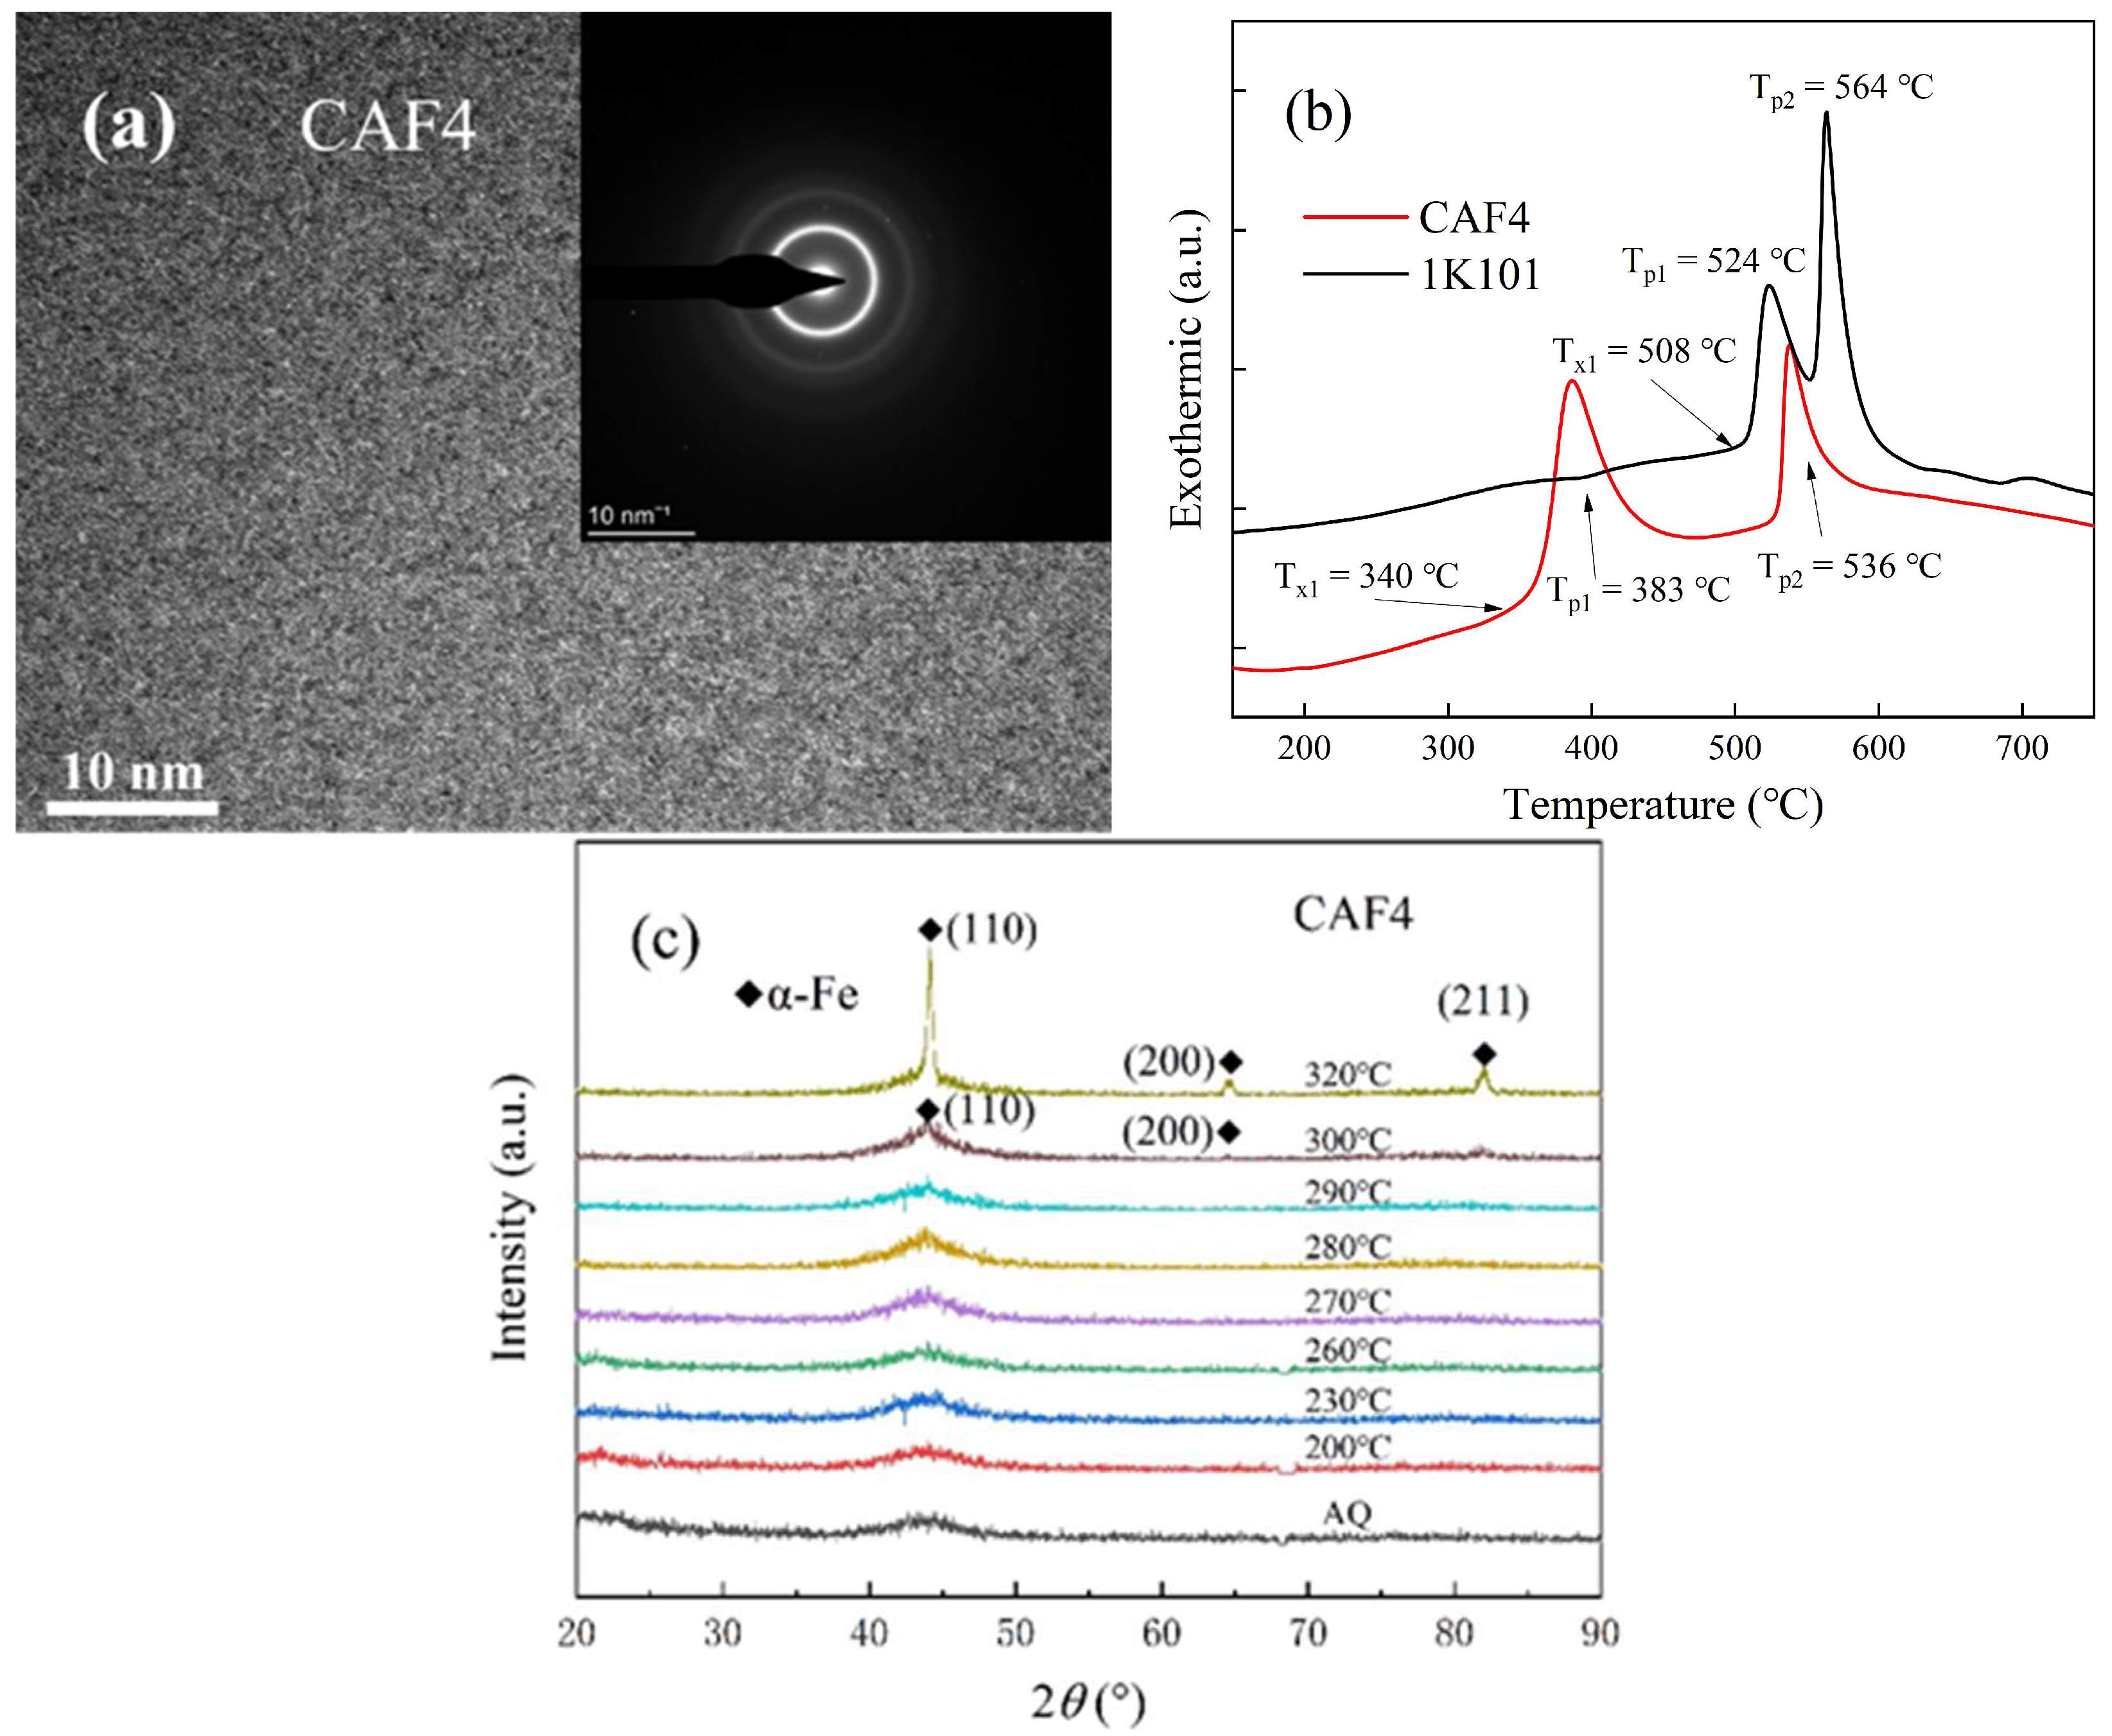
3.1. Structure and Performance Analysis of the CAF4 Strip

Figure 2a presents the high-resolution transmission electron microscopy (HRTEM) and selected area electron diffraction (SAED) images of the as-cast (AC) CAF4 strip, revealing an amorphous structure with disordered atomic arrangements, as indicated by the halo-like diffraction patterns, confirming the amorphous nature of the strip.
Figure 2b displays the results of DSC tests on the 1K101 and CAF4 strip samples, both exhibiting two distinct exothermic peaks. The crystallization onset temperature (Tx1) was determined by analyzing the tangent to the initial arc of the first exothermic peak. As indicated in Table 1, the Tx1 of the CAF4 strip was 340 °C, which is lower than that of 1K101. This observation suggests that the addition of Co, P, and C elements promotes the early precipitation of the α-Fe phase. The temperature range between the Curie temperature (Tc) and Tx1 is considered optimal for amorphous strips. Furthermore, the ideal annealing temperature is typically 80–120 °C lower than Tx1, serving as a guideline for annealing [20]. Figure 2c shows two crystallization peaks, with the first corresponding to the α-Fe phase precipitation and the second to the Fe-B phase formation [21,22,23,24]. The crystallization peak temperatures of CAF4 are lower than those of 1K101, with a difference (ΔTp) of 113 °C.
Based on DSC results and the XRD pattern of the amorphous iron core, shown in Figure 2c, it is evident that when CAF4 is annealed at ≤290 °C, it remains in an amorphous state, as indicated by a diffuse diffraction peak near 2θ = 45°. Annealing CAF4 at ≥300 °C results in sharper diffraction peaks, indicating a small amount of crystalline phase precipitation, identified as α-Fe(Si) with a bcc structure. Additionally, as the annealing temperature increases, the diffraction peaks of the α-Fe(Si) phase become more pronounced, indicating an increased crystallization fraction with higher annealing temperatures.

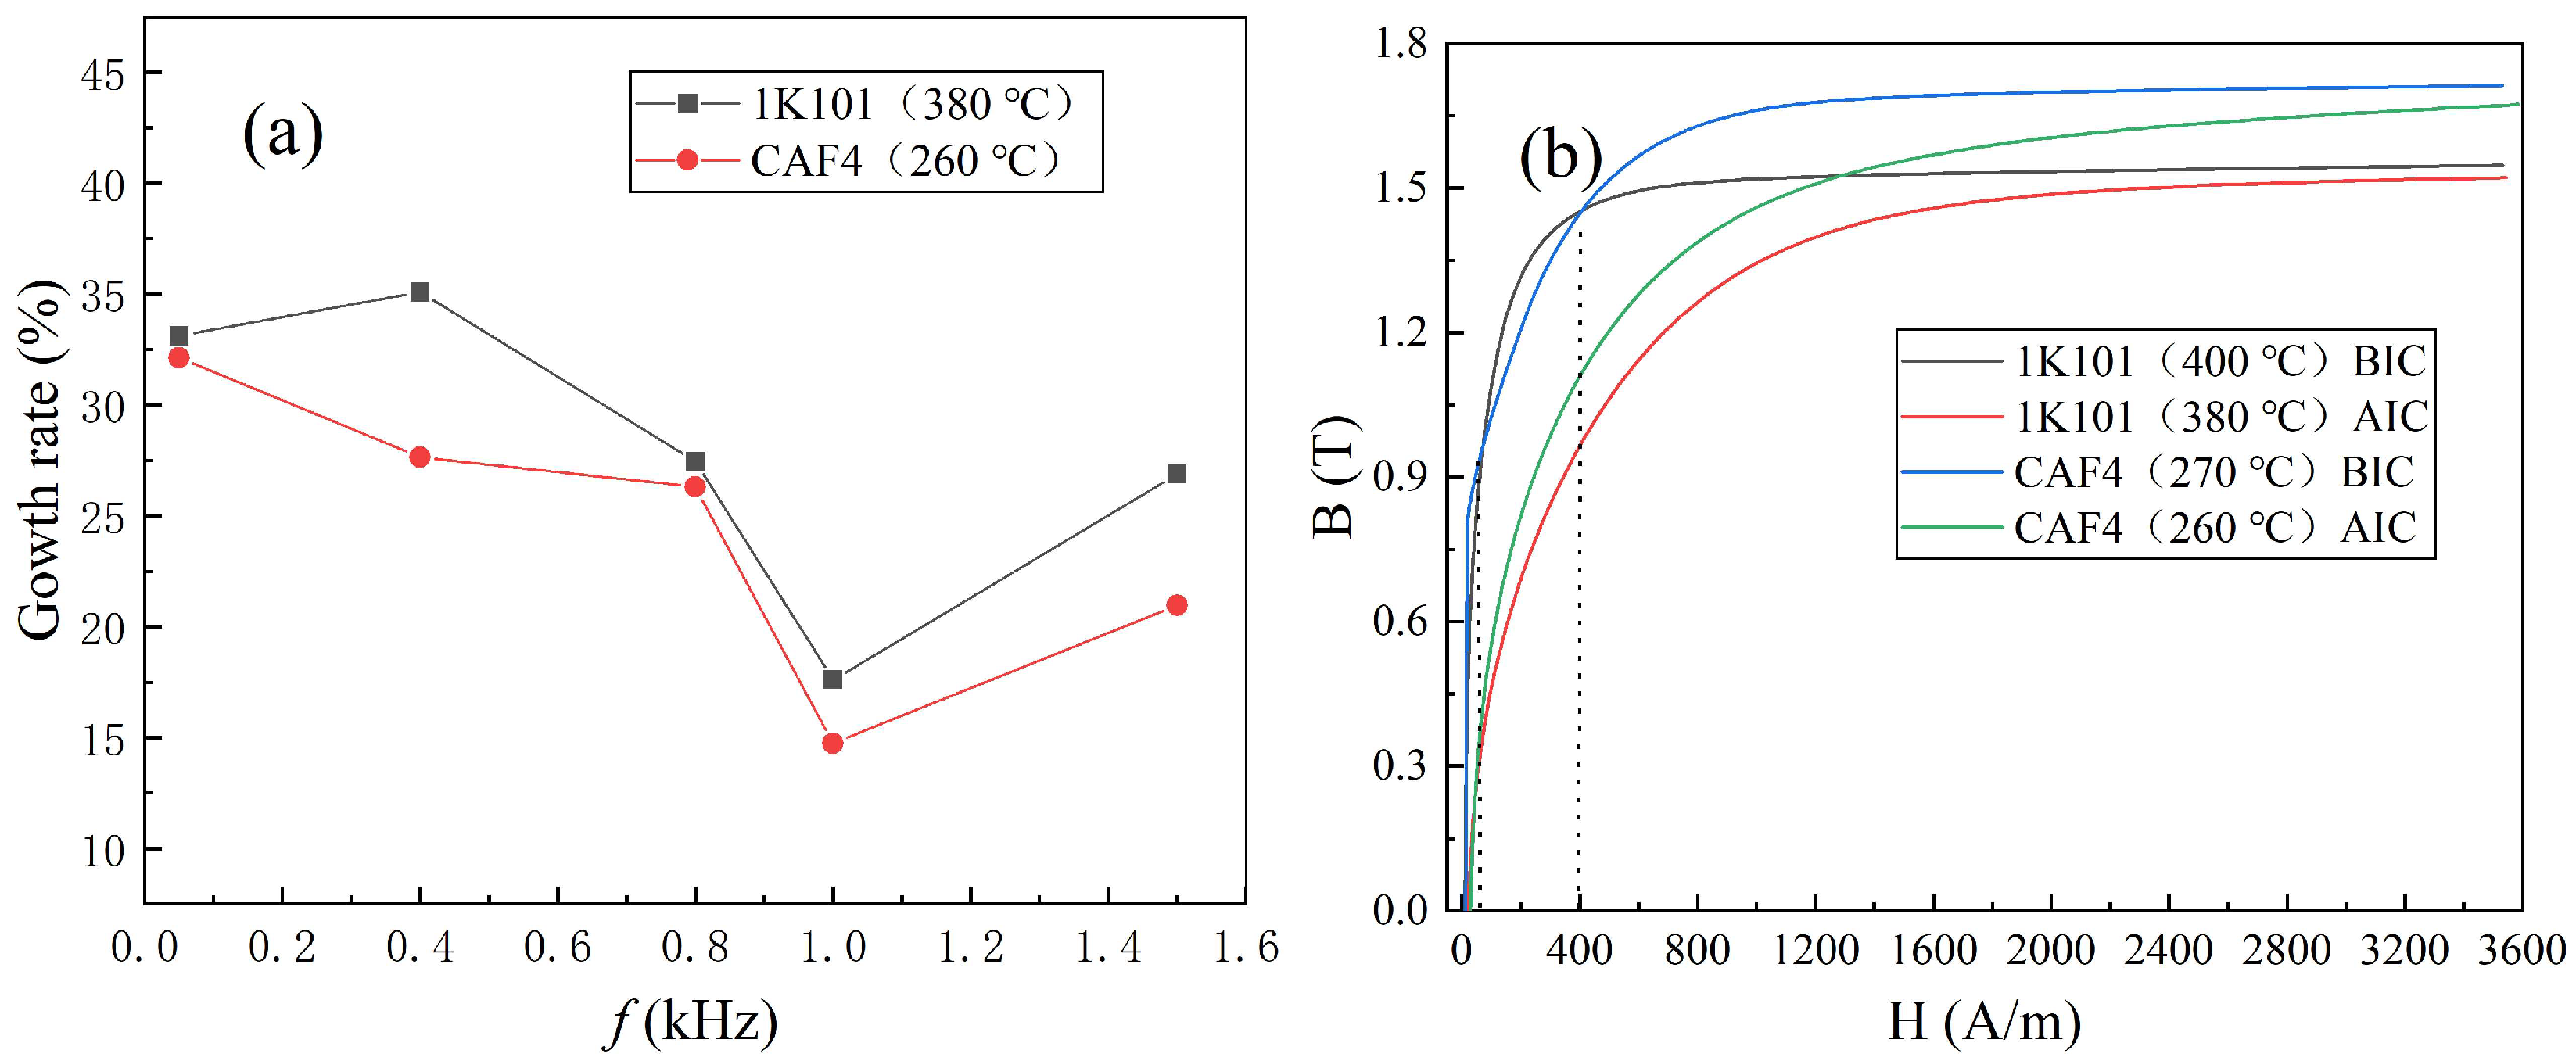
3.2. Effects of Stress Produced by Impregnation Curing on the Iron Core Properties

Amorphous alloy iron cores require impregnation and curing with materials such as epoxy resin to enhance their overall integrity when subjected to external forces. However, during the curing process, the volume of the binder typically decreases, and the various soft magnetic properties of the iron core may change due to the stress generated by the shrinkage of the binder volume [25,26,27]. The volume of the binder typically decreases during the curing process, so the shape of the wound iron core sample will have slight deformation, and the outer diameter size will decrease by 0.05–0.1%. The size of the cutting annular iron core remains basically unchanged.
Figure 3a,b show the loss curves of the amorphous iron core 1K101 annealed at 370–410 °C before and after impregnation curing at different frequencies. With increasing thermal treatment temperatures, the loss initially decreases and then increases. Before impregnation curing, the loss of 1K101 reached its lowest value of P1.2T,1.5 kHz = 6.6 W/kg after annealing at 400 °C, which then increased to P1.2T,1.5 kHz = 55 W/kg when annealed at 410 °C. After impregnation curing, the loss of 1K101 reached its lowest value of P1.2T,1.5 kHz = 20.2 W/kg after annealing at 380 °C and started to increase to P1.2T,1.5 kHz = 32.8 W/kg after annealing at 390 °C.
Figure 3c,d present the loss curves of the amorphous iron core CAF4 before and after undergoing impregnation curing at varying frequencies during annealing at temperatures ranging from 240–280 °C [28,29]. With increasing thermal treatment temperatures, the loss initially decreased, followed by an increment. Prior to impregnation curing, the loss of CAF4 reached its minimum value of P1.2T,1.5 kHz = 17.9 W/kg after annealing at 270 °C, subsequently rising to P1.2T,1.5 kHz = 23.7 W/kg when annealed at 280 °C. After impregnation curing, the loss of CAF4 reached a minimum of P1.2T,1.5 kHz = 22.8 W/kg after 260 °C annealing and began to increase to P1.2T,1.5 kHz = 23.9 W/kg after 270 °C annealing.
It is evident from Figure 3 that the thermal treatment temperature under which the lowest loss occurred after impregnation curing was lower than that before impregnation curing. For 1K101, it decreased from 400 °C to 380 °C, and for CAF4, it decreased from 270 °C to 260 °C. This indicates that the internal stress generated by impregnation curing had a certain impact on the performance of the iron cores after thermal treatment, specifically increasing the loss of the amorphous iron cores.
Figure 4a presents the loss growth rate curves of 1K101 (annealed at 380 °C) and CAF4 (annealed at 260 °C) before and after impregnation curing under 1.2 T excitation at different frequencies. It can be observed that the loss growth rate for 1K101 was 27% under excitation of 1.2 T and a frequency of 1.5 kHz after annealing at 380 °C and impregnation curing. For CAF4, the loss growth rate was 21% under the same conditions. Overall, the loss growth rate of CAF4 after impregnation curing was less than that of 1K101.
Figure 4b displays the annealing magnetization curves of 1K101 at 400 °C before impregnation curing and 380 °C after impregnation curing, as well as CAF4 at 270 °C before impregnation curing and 260 °C after impregnation curing. Both materials exhibited a decrease in magnetization performance after impregnation curing. Before impregnation curing, the excitation was applied to a position marked by the first dashed line (75 A/m), i.e., before the first intersection of the two curves. At this point, the working magnetic density Bm of CAF4 was higher than that of 1K101. When the excitation exceeded 400 A/m, i.e., after the second dashed line, the working magnetic density Bm of CAF4 again exceeded that of 1K101. After impregnation curing, the working magnetic density of CAF4 was higher than that of 1K101. When the applied excitation reached 3500 A/m, Bm = 1.67 T for CAF4, which was higher than the Bm value of 1.52 T for 1K101. The addition of a small amount of Co in CAF4 contributed to its higher Bm value beyond an excitation of 400 A/m.
From the above analysis, it can be seen that the internal stress generated by impregnation curing has an impact on the performance of amorphous iron cores. The stress sensitivity of CAF4 impregnation curing to loss growth rate and magnetization performance is better than that of 1K101.

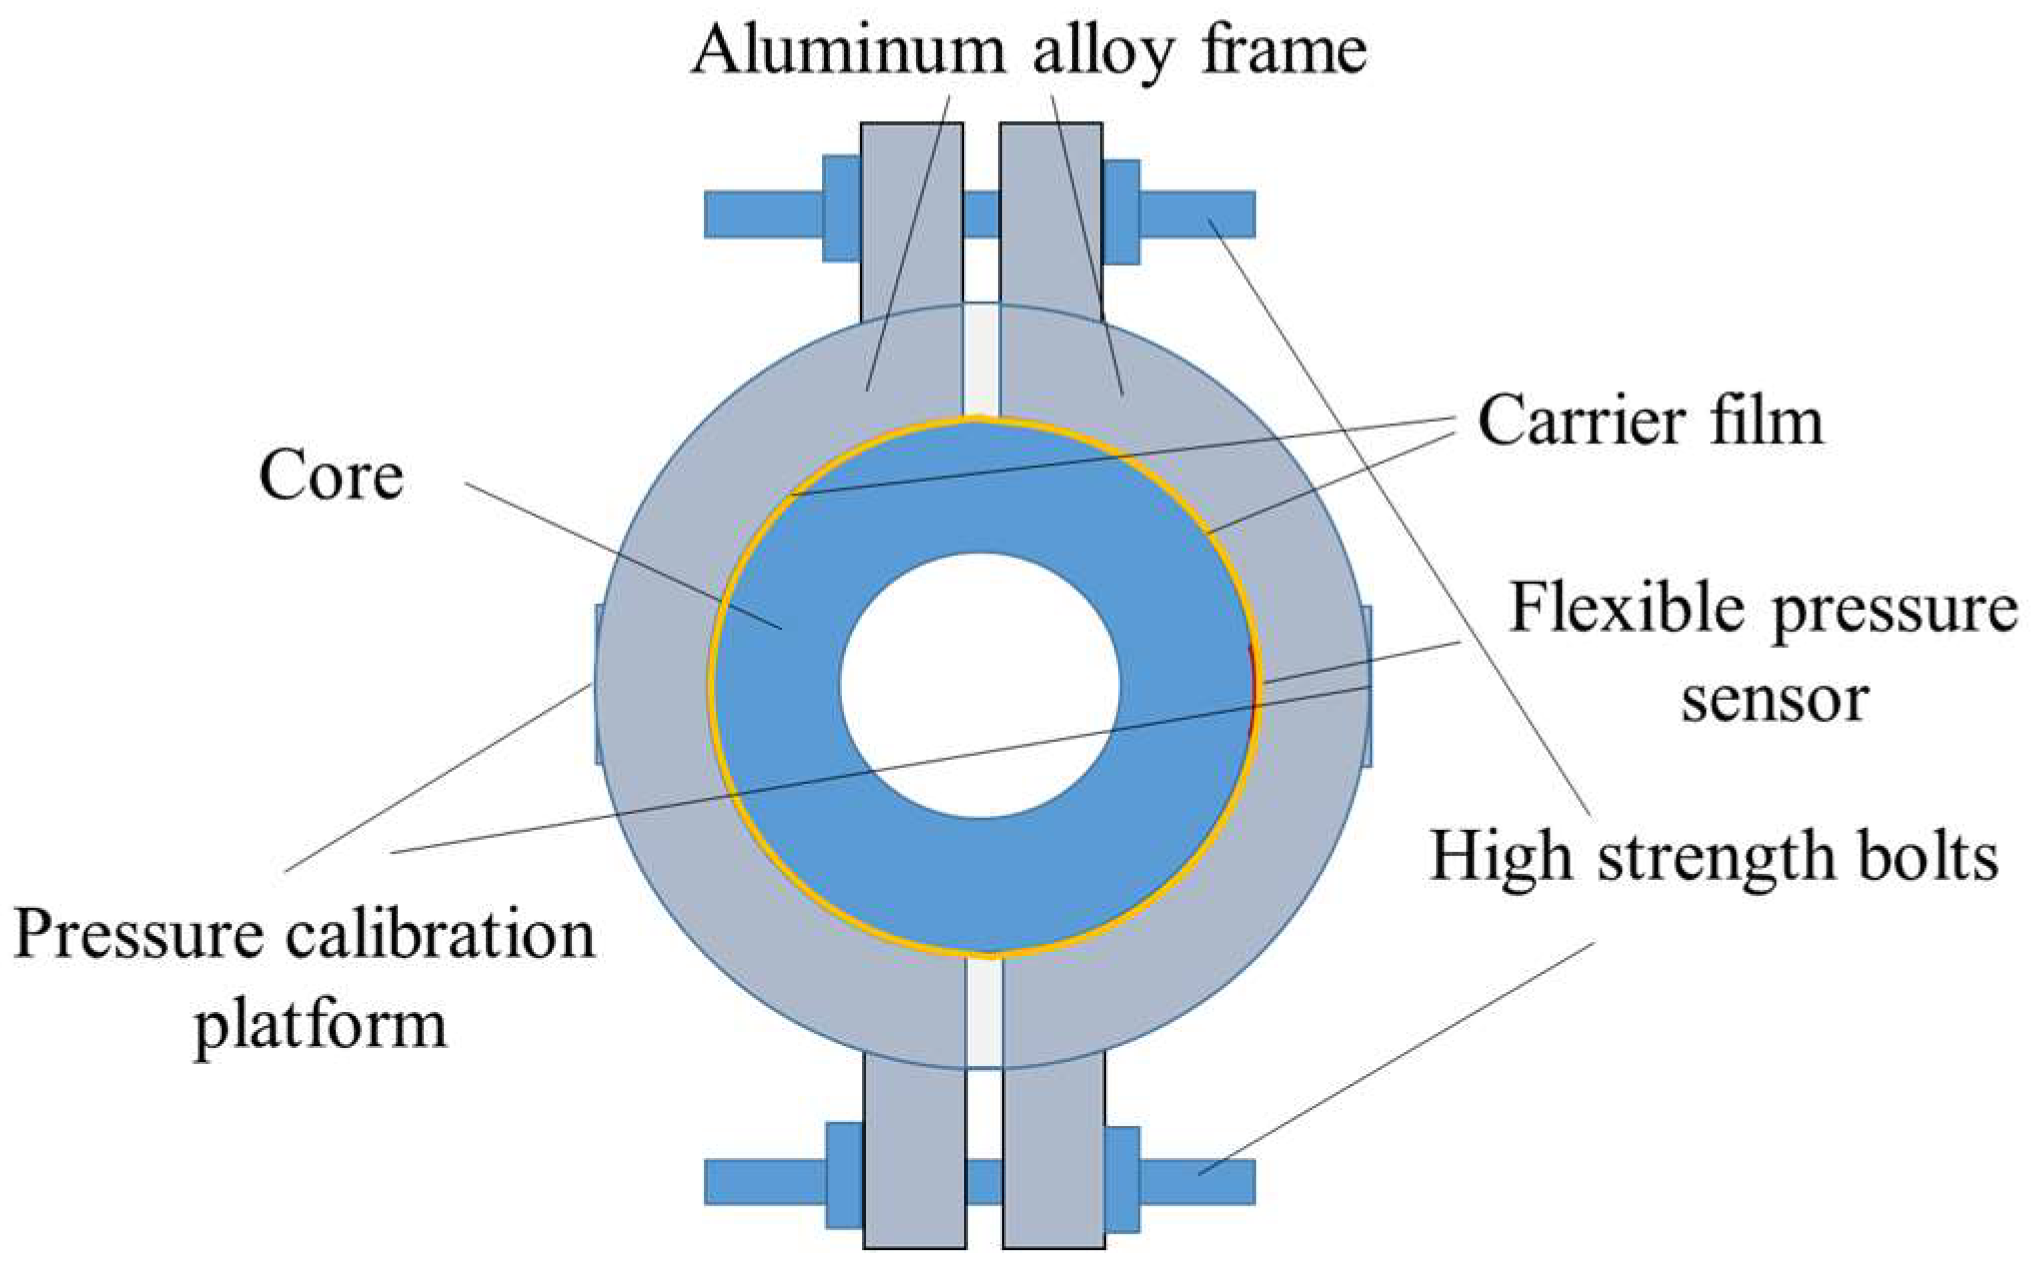
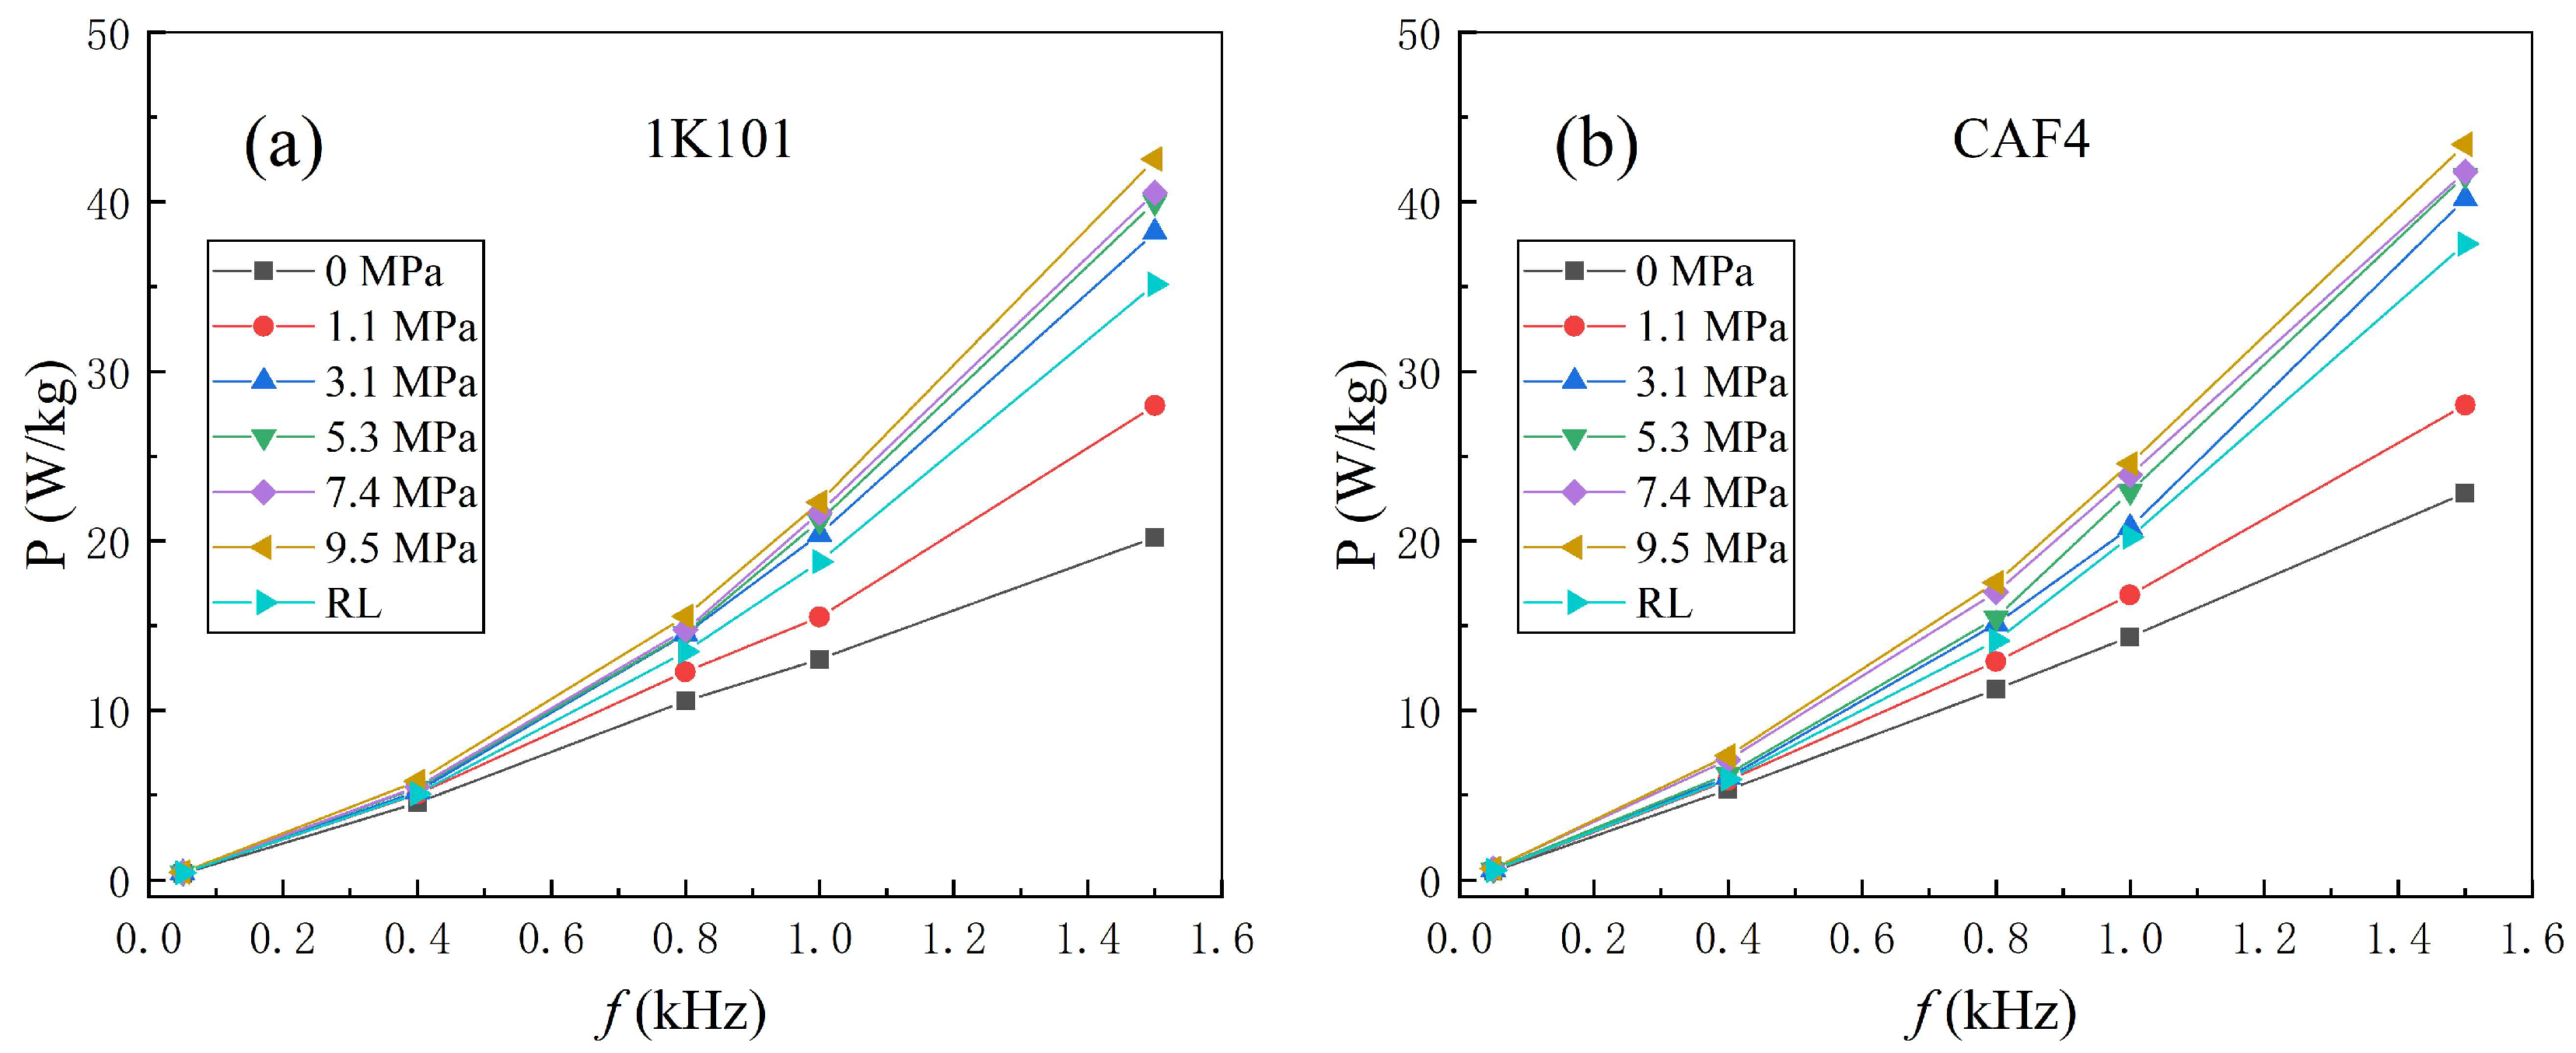
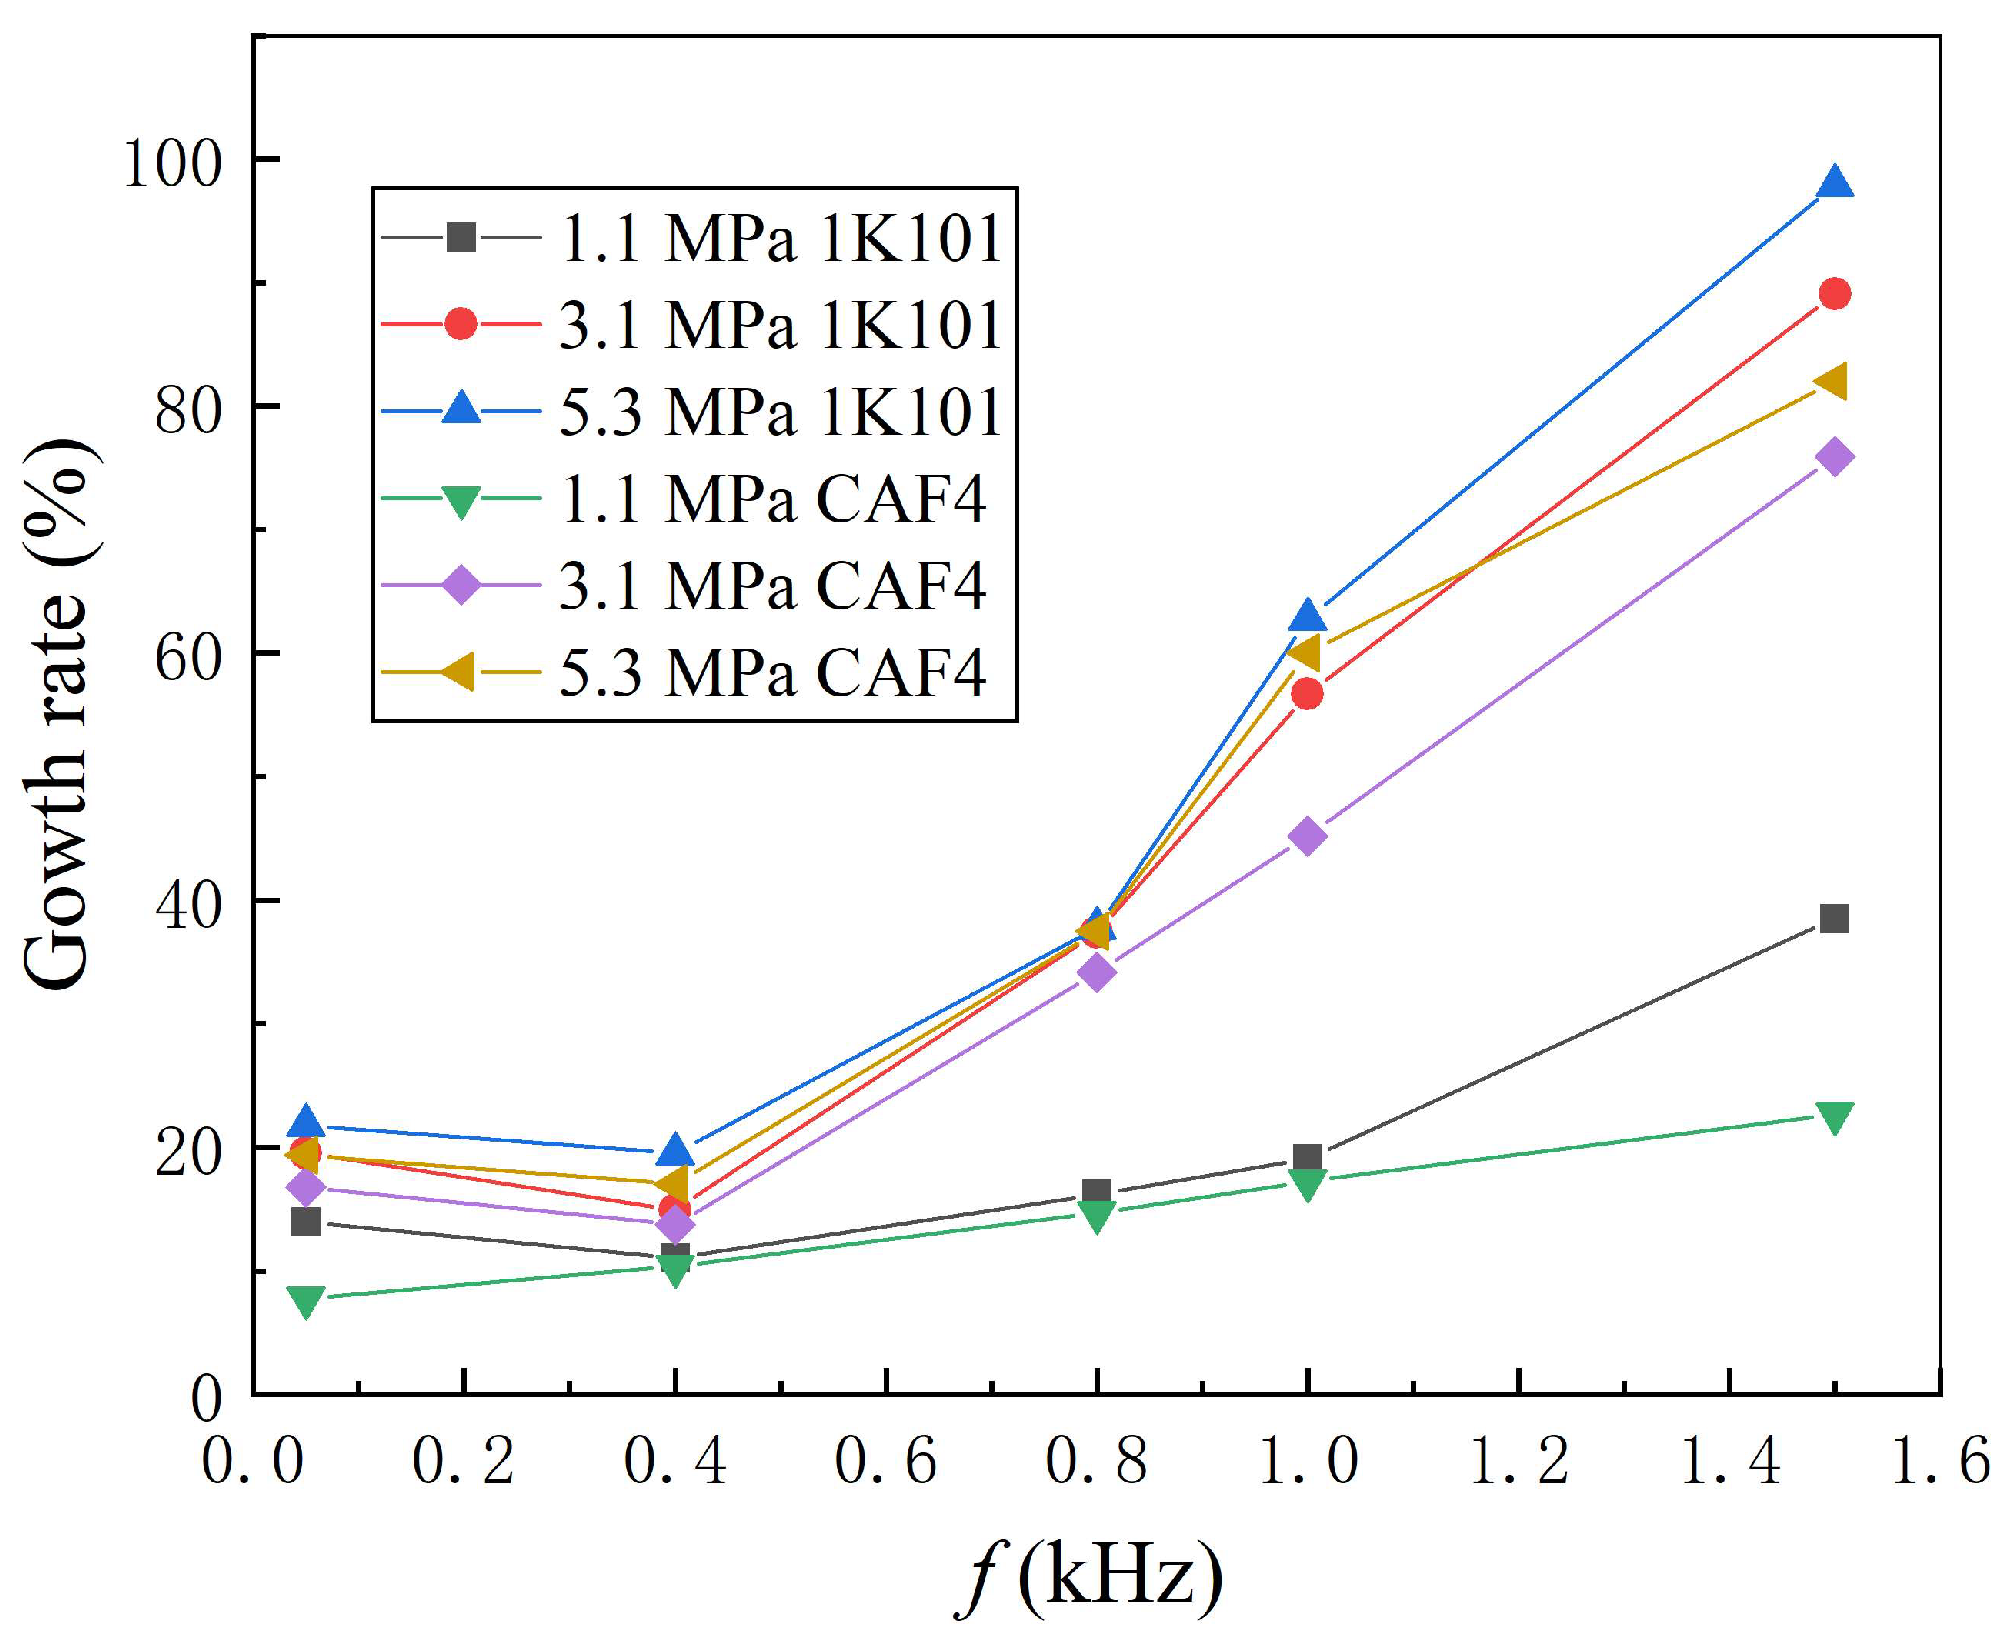
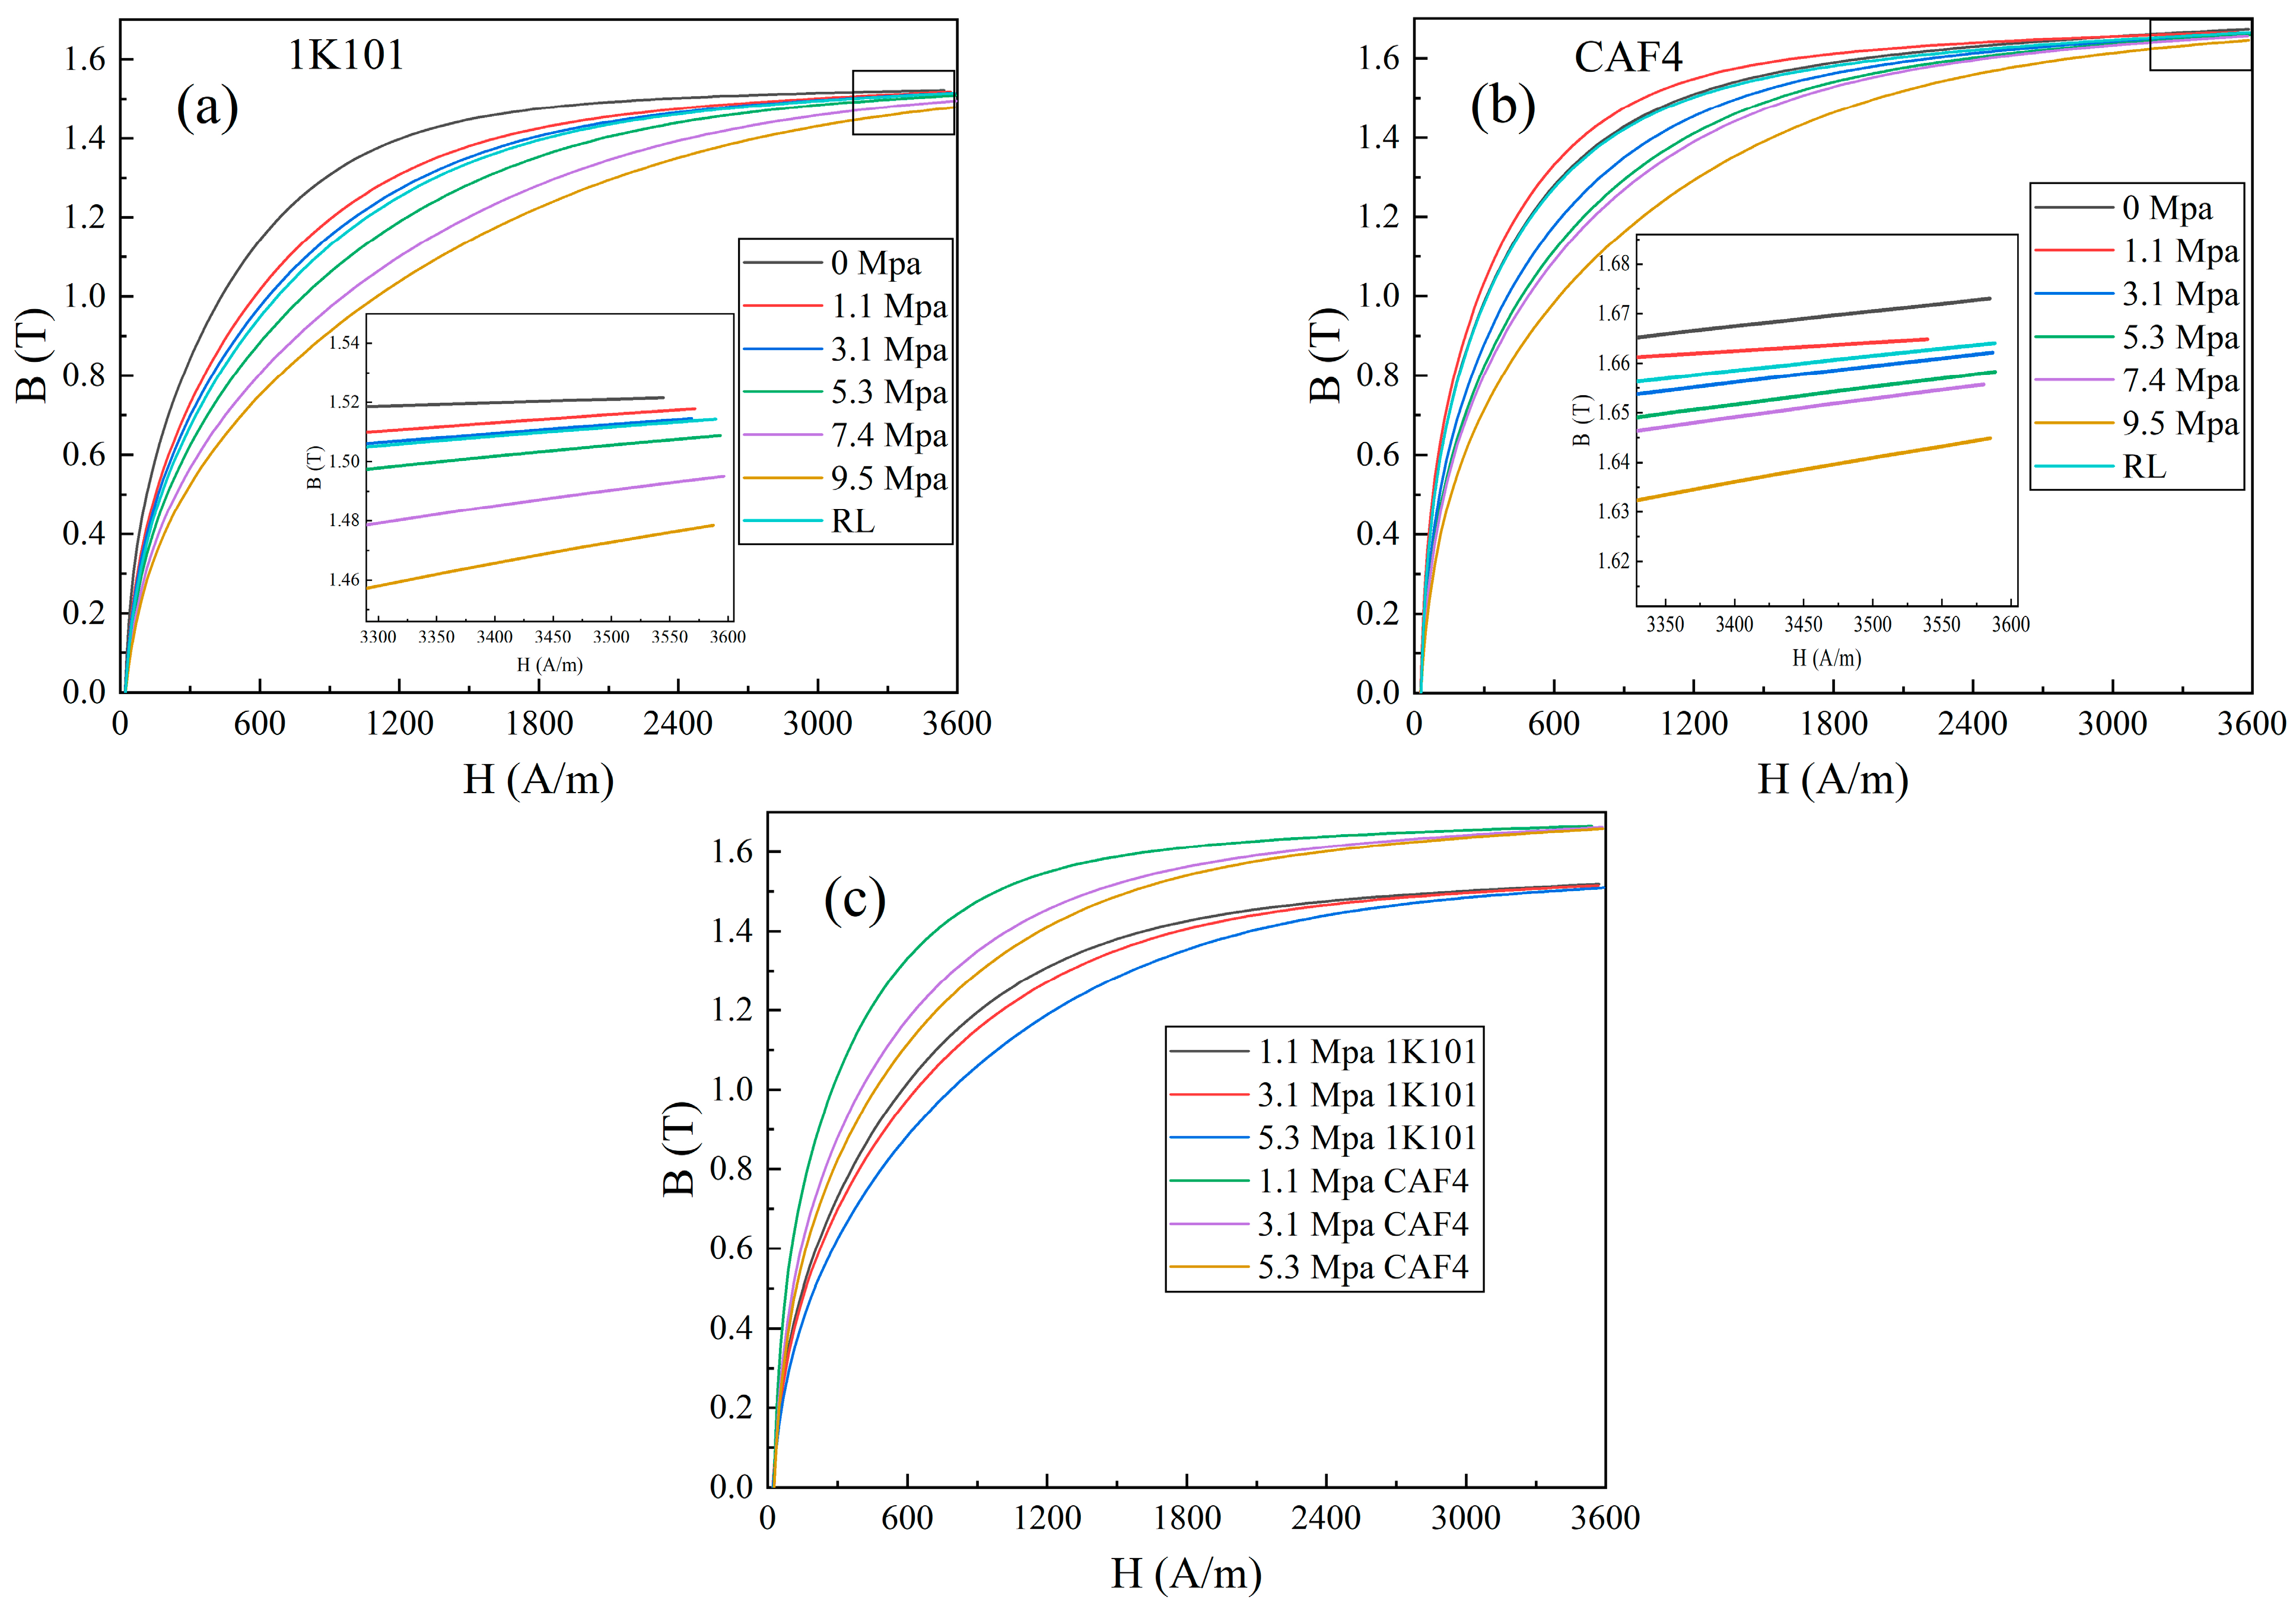
3.3. Loss and Magnetic Properties of Amorphous Iron Cores under the Interference Fit Pressure

Applying pressure (or tensile force) to a material can induce slight changes in its length, consequently affecting its internal magnetization state. Investigating the magnetostriction coefficient addresses the matter of material stress sensitivity.
The magnetostriction λ is
λ = L L
where ΔL is the difference between the length L1 of the sample under excitation and the original length L of the sample, i.e., the amount of magnetostrictive change.
Figure 5a illustrates the magnetostriction curves of annealed amorphous strip CAF4 under excitation levels of 200 A/m, 600 A/m, and 1000 A/m at a frequency of 50 Hz. As excitation increases, magnetostriction also increases, forming a butterfly-shaped curve. However, direct analysis of the butterfly-shaped curve is challenging, leading to the introduction of the peak-to-peak magnetostriction λpp [30,31].
λpp represents the peak-to-peak magnetostriction, signifying the amplitude of λ(t), the change in magnetostriction, within one magnetization time cycle. In other words, λpp equals the maximum magnetostriction value minus the minimum:
λ p p = λ m a x λ m i n
where λmax is the maximum of magnetostriction, and λmin is the minimum of magnetostriction.
Figure 5b displays the peak-to-peak magnetostriction curves of annealed (NA) amorphous strips of 1K101, CAF4, and their as-cast (AC) counterparts. After annealing, both 1K101 and CAF4 exhibited reduced λpp values, indicating that thermal treatment reduced internal stress in amorphous alloys and improved magnetic properties. Notably, annealed CAF4 consistently displayed lower λpp values than 1K101. For instance, at an excitation of 1000 A/m, annealed CAF4 demonstrated λpp = 11.19 ppm, lower than 1K101’s λpp = 11.42 ppm.
The experimental model of interference fit compressive stress, as depicted in Figure 1, was subjected to testing. The 1.2 T excitation loss curves of 1K101 under varying compression stresses and frequencies were acquired, as illustrated in Figure 6a. Notably, as the compression stress increased, the loss exhibited a gradual increase. Specifically, the loss exhibited significant growth at initial pressures of 1.1 MPa and 3.1 MPa, increasing from P1.2T,1.5 kHz = 20.2 W/kg before compression to P1.2T,1.5 kHz = 28 W/kg and P1.2T,1.5 kHz = 38.2 W/kg, respectively. The loss observed when the sample was pressurized to 9.5 MPa and subsequently relieved of the compressive stress is denoted by the RL curve in the figure. It is discernible that the RL loss did not fully revert to the original 0 MPa value upon the removal of compressive stress; instead, it persisted between the values corresponding to 1.1 MPa and 3.1 MPa. This phenomenon suggests that the internal stress within the amorphous iron core could not be completely restored to its initial state post-pressurization and necessitated further stress relief treatment for recovery.
Figure 6b illustrates the loss curves of CAF4 when excited at 1.2 T under various compression stresses and frequencies. Analogous to the observations in the 1K101 case, as the pressure increased, the loss exhibited a gradual increase. Under the initial pressures of 1.1 MPa and 3.1 MPa, the loss underwent a substantial increase, increasing from P1.2T,1.5 kHz = 22.3 W/kg before compression to P1.2T,1.5 kHz = 28 W/kg and P1.2T,1.5 kHz = 40 W/kg, respectively. Following compression to 9.5 MPa and subsequent stress removal, the loss was measured and labeled as the RL curve in the figure. It is evident that the loss did not fully revert to the original 0 MPa value; instead, it fell within the range of values corresponding to compressive stresses of 1.1 MPa and 3.1 MPa. This outcome once again underscores the notion that the internal stress within the amorphous iron core could not be fully restored to its initial state without additional stress relief treatments.
The aforementioned experimental design pertained to interference fit experiments in electric motors. Typically, the interference fit in motor assembly ranges between 0.05 mm and 0.2 mm, with the corresponding iron core pressures outlined in Table 2 [7].
In accordance with the compressive stress values corresponding to the commonly employed interference fits detailed in Table 2, the curves depicting the rate of loss growth for 1K101 and CAF4 subjected to a 1.2 T excitation at varying frequencies and under compressive stresses of 1.1, 3.1, and 5.3 MPa have been selected and are presented in Figure 7. Notably, a substantial increase in the loss growth rate was observed as the compressive stress escalated from 1.1 MPa to 3.1 MPa. For instance, in the case of 1K101 subjected to a 1.2 T excitation at 1.5 kHz, the growth rate surged to 38.5% when subjected to a compressive stress of 1.1 MPa and further escalated to 89.1% under a compressive stress of 3.1 MPa. Under analogous circumstances, the corresponding rates for CAF4 were recorded as 22.7% and 75.9%. It is noteworthy that the growth rate of CAF4 consistently remained inferior to that of 1K101 as the compressive stress traversed the range from 1.1 to 3.1, culminating at 5.3 MPa.
Figure 8 depicts the magnetization curves of 1K101 and CAF4 under varying compressive stresses. As illustrated in Figure 8a, the increase in compressive stress resulted in a deterioration of magnetization performance, displaying a flattening trend. Under an excitation of 3500 A/m, the operational magnetic density (Bm) gradually decreased from the initial Bm = 1.52 T to Bm = 1.47 T. Subsequent to the removal of compressive stress, the magnetization performance failed to return to its initial state, with the working magnetic density at Bm = 1.51 T under an excitation of 3500 A/m, a value situated between the cases of 3.1 MPa and 5.3 MPa. Figure 8b shows the magnetization curves of CAF4 under various compressive stresses, exhibiting a parallel trend to that of 1K101. Under an excitation of 3500 A/m, the working magnetic density decreased from the initial 1.67 T to 1.64 T. After the elimination of the compressive stress, the measured magnetization performance did not return to its initial state, with Bm = 1.66 T, a value found between the scenarios of 1.1 MPa and 3.1 MPa.
Figure 8c presents the magnetization curves of both 1K101 and CAF4 under compressive stresses of 1.1, 3.1, and 5.3 MPa. CAF4’s magnetization curves consistently outperformed those of 1K101 within the commonly employed interference fit range. The enhancement of the working magnetic density bears favorable implications for elevating motor torque density, enabling lightweight and compact motor designs. Notably, when an amorphous material is adopted as the motor spindle’s iron core, iron core losses are significantly reduced in comparison to silicon steel. Consequently, for motors requiring equivalent torque, 1K101’s excitation necessitates a greater current, leading to proportional copper losses. Hence, the utilization of CAF4 amorphous iron cores exhibits distinct advantages over 1K101 in motor applications.
In summary, compared to 1K101, the stress sensitivity of the amorphous iron core CAF4 interference fit is relatively small, and various magnetic properties have advantages in the application of motors compared to 1K101.

4. Conclusions

This paper systematically investigated the impact of internal stress induced by impregnation curing and interference fit on the soft magnetic properties and losses of the Fe80Co3Si3B10P1C3 (CAF4) amorphous alloy iron core, comparing it with the Fe80Si9B11 amorphous iron core. The key findings are as follows:
(1)
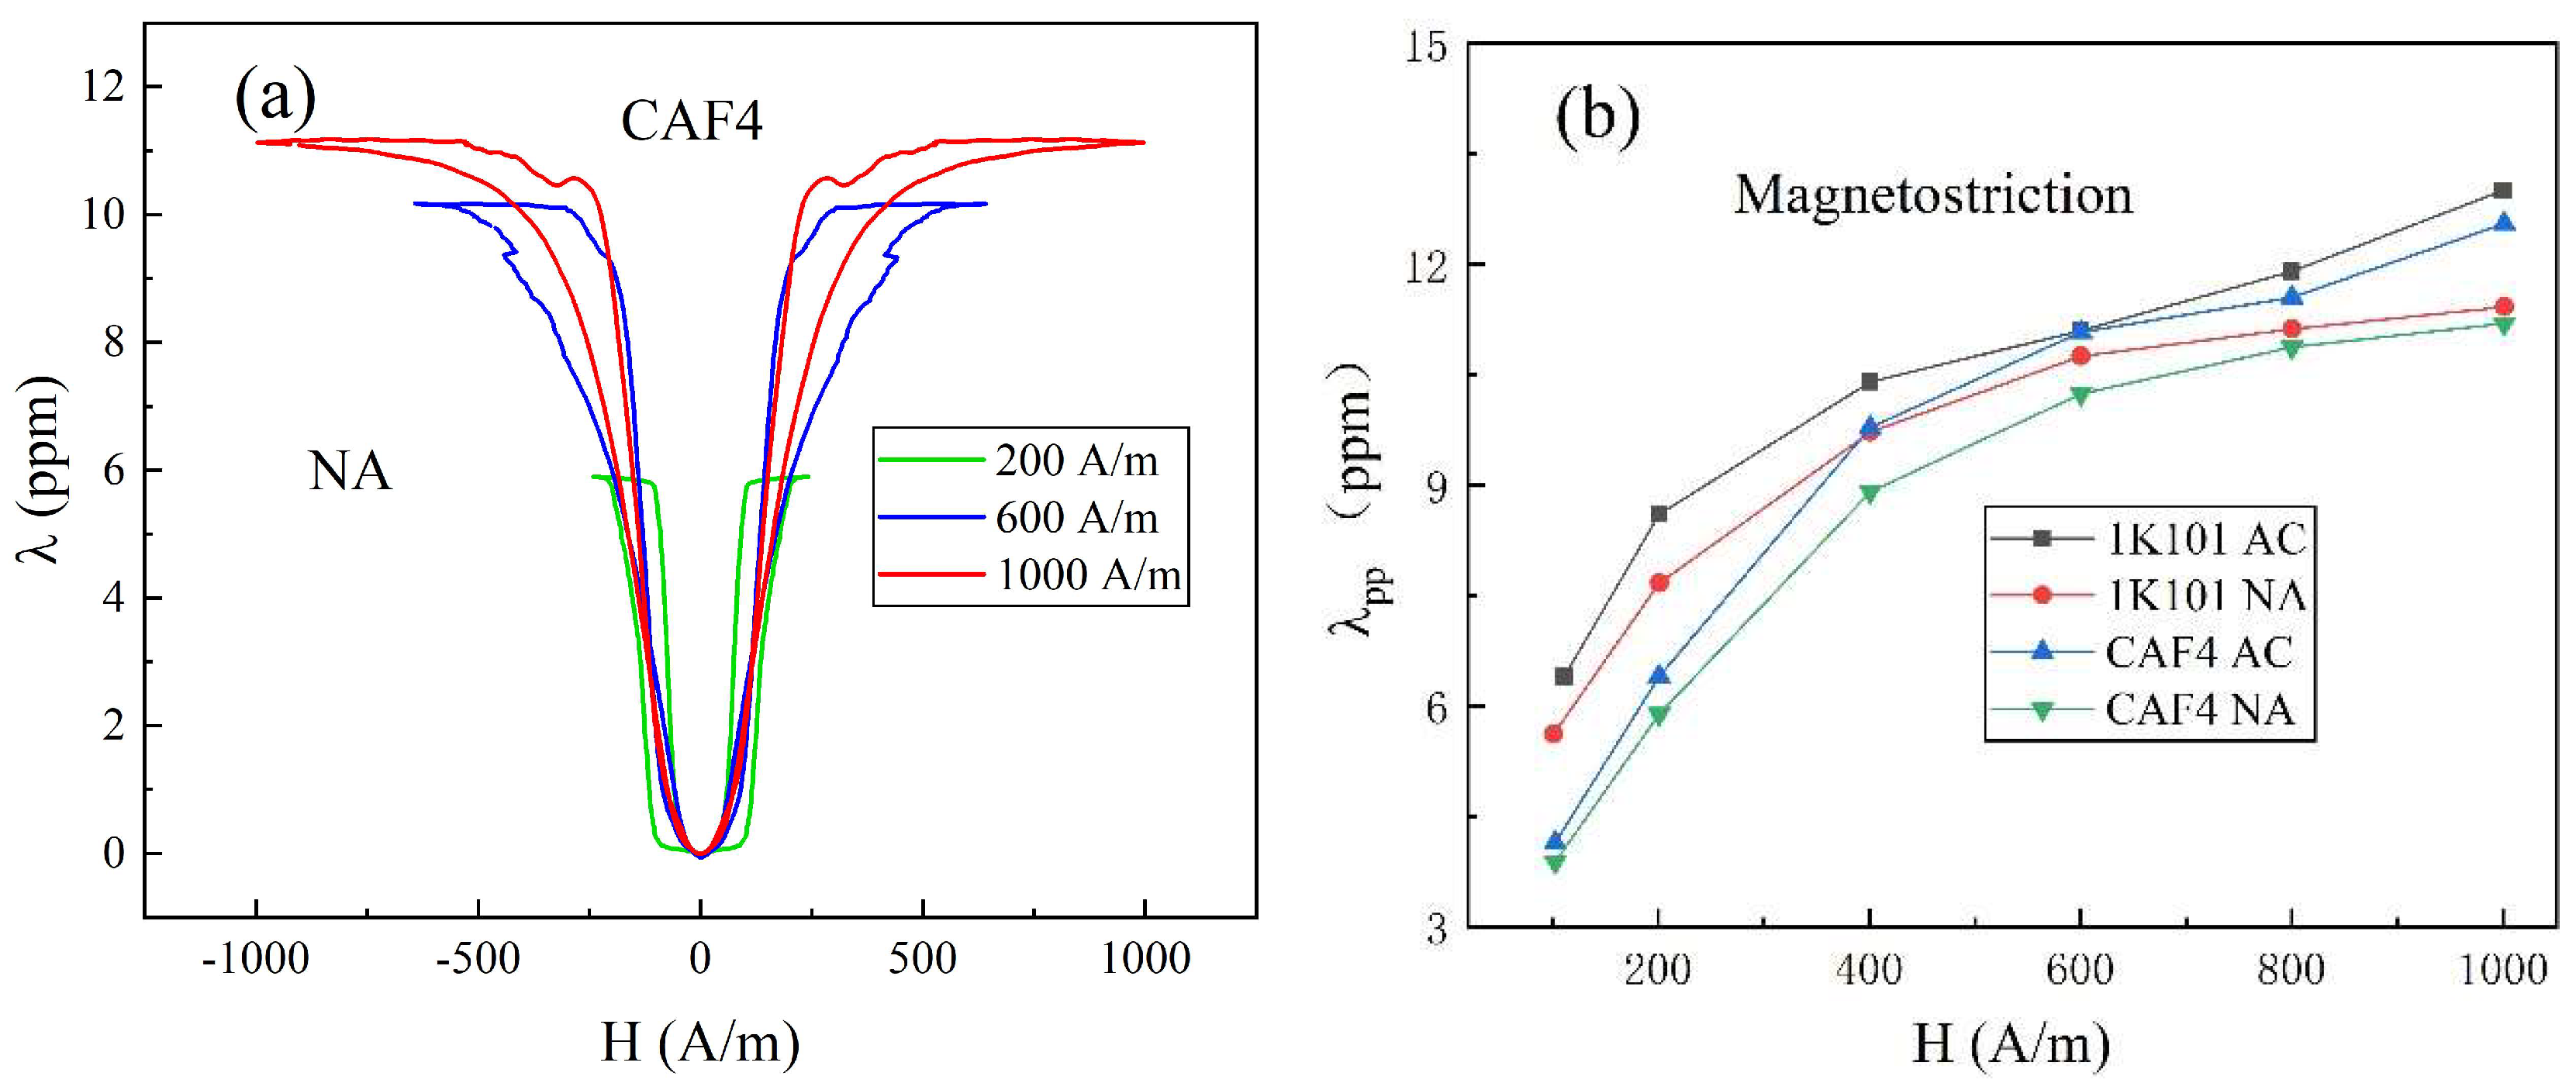
After impregnation curing (AIC), the lowest loss of CAF4 occurred at 260 °C annealing, with P1.2T,1.5 kHz = 22.8 W/kg, representing a 21% increase compared to before-impregnation curing (BIC). Additionally, under an excitation of 1000 A/m and a frequency of 50 Hz, CAF4 exhibited a lower magnetostriction coefficient than 1K101.
(2)
With increasing internal stress from interference fits, the losses also increased. Within the commonly used interference fit range, CAF4 exhibited a lower percentage increase in losses compared to 1K101. It is important to note that even after removing the compressive stress, the internal stress did not fully return to its initial state, necessitating further stress relief treatments.
(3)
Within the commonly used interference fit range, CAF4 demonstrated superior magnetization performance compared to 1K101, offering advantages for lightweight and compact motor designs as well as reduced copper losses. Consequently, CAF4 amorphous iron cores present a more advantageous choice for motor cores.

Author Contributions

Methodology, G.Z. and Z.L.; software, Q.Z. and H.Y.; validation, Z.L.; formal analysis, W.Z. and S.S.; data curation, W.Z., M.G. and H.Y.; writing—original draft preparation, W.Z.; writing—review and editing, S.Z. and X.Q.; visualization, M.G.; supervision, G.Z., S.Z. and X.Q. All authors have read and agreed to the published version of the manuscript.

Funding

This study was supported by the Major Program of the National Natural Science Foundation of China (No. 52192603) and the National Key Research and Development Program (No. 2021YFB3800502).

Data Availability Statement

The data presented in this study are available.

Conflicts of Interest

The authors declare no conflict of interest.

References

  1. Silveyra, J.M.; Ferrara, E.; Huber, D.L.; Monson, T.C. Soft magnetic materials for a sustainable and electrified world. Science 2018, 362, eaao0195. [Google Scholar] [CrossRef] [PubMed]
  2. Wang, W. Development and Implication of Amorphous Alloys. Bull. Chin. Acad. Sci. 2022, 37, 352–359. [Google Scholar] [CrossRef]
  3. Bazlov, A.; Strochko, I.; Ubyivovk, E.; Parkhomenko, M.; Magomedova, D.; Zanaeva, E. Structure and Properties of Amorphous Quasi High Entropy Fe-Co-Ni-Cr-(Mo,V)-B Alloys with Various Boron Content. Metals 2023, 13, 1464. [Google Scholar] [CrossRef]
  4. Huo, Z.; Zhang, G.; Han, J.; Wang, J.; Ma, S.; Wang, H. A Review of the Preparation, Machining Performance, and Application of Fe-Based Amorphous Alloys. Processes 2022, 10, 1203. [Google Scholar] [CrossRef]
  5. Shi, L.; Hu, X.; Li, Y.; Yuan, G.; Yao, K. The complementary effects of Fe and metalloids on the saturation magnetization of Fe-based amorphous alloys. Intermetallics 2021, 131, 107116. [Google Scholar] [CrossRef]
  6. Li, D.; Zhang, L.; Li, G.; Lu, Z.; Zhou, S. Reducing the core loss of amorphous cores for distribution transformers. Prog. Nat. Sci. Mater. Int. 2012, 3, 244–249. [Google Scholar] [CrossRef]
  7. Zhu, L.; Fan, B.; Han, X.; Tang, H. Effects of shrink fitting on iron losses of a permanent magnet synchronous motor with an amorphous core. IET Electr. Power Appl. 2022, 16, 996–1003. [Google Scholar] [CrossRef]
  8. Enomoto, Y.; Suzuki, K.; Okita, S.; Eto, K.; Katayama, E. Evaluation of a Motor with an Amorphous Iron Core Punched by a Die. IEEJ Trans. Ind. Appl. 2021, 141, 423–430. [Google Scholar] [CrossRef]
  9. Nie, W.; Yu, T.; Wang, Z.; Wei, X. High-performance core-shell-type FeSiCrMnZn soft magnetic composites for high-frequency applications. J. Alloys Compd. 2021, 864, 158215. [Google Scholar] [CrossRef]
  10. Zhu, F.; Zhang, J.; Wang, J.; Zhou, F.; Sun, H. Numerical simulation analysis of high-speed asynchronous motor based on Fe-based amorphous alloy and SMC stator. J. Phys. Conf. Ser. 2022, 23, 012104. [Google Scholar] [CrossRef]
  11. Kolano, R.; Krykowski, K.; Kolano-Burian, A.; Polak, M.; Szynowski, J.; Zackiewicz, P. Amorphous Soft Magnetic Materials for the Stator of a Novel High-Speed PMBLDC Motor. IEEE Trans. Magn. 2013, 49, 1367–1371. [Google Scholar] [CrossRef]
  12. Komeza, K.; Dems, M. Finite-element and analytical calculations of no-load core losses in energy-saving induction motors. IEEE Trans. Ind. Electron. 2011, 59, 2934–2946. [Google Scholar] [CrossRef]
  13. Cai, M.; Wang, J.; Wang, Q.; Guo, Z.; Luo, Q.; Zhou, J.; Liang, T.; Li, X.; Zeng, Q.; Shen, B. Improvement of soft-magnetic properties for Fe-based amorphous alloys with high saturation polarization by stress annealing. Mater. Res. Lett. 2023, 11, 595–603. [Google Scholar] [CrossRef]
  14. Han, L.; Maccari, F.; Souza Filho, I.R.; Peter, N.J.; Wei, Y.; Gault, B.; Gutfleisch, O.; Li, Z.; Raabe, D. A mechanically strong and ductile soft magnet with extremely low coercivity. Nature 2022, 608, 310–316. [Google Scholar] [CrossRef] [PubMed]
  15. Chiba, A.; Hayashi, H.; Nakamura, K.; Ito, S.; Tungpimolrut, K.; Fukao, T.; Rahman, M.A.; Yoshida, M. Test results of an SRM made from a layered block of heat-treated amorphous alloys. IEEE Trans. Ind. Appl. 2008, 44, 699–706. [Google Scholar] [CrossRef]
  16. Longfei, Z.; Jianguo, Z.; Wenming, T. Study on no-load losses of permanent magnet synchronous motor with amorphous alloy stator core. Electr. Mach. Control 2015, 19, 19–26. [Google Scholar] [CrossRef]
  17. Miyagi, D.; Maeda, N.; Ozeki, Y.; Miki, K.; Takahashi, N. Estimation of iron loss in motor core with shrink fitting using FEM analysis. IEEE Trans. Magn. 2009, 45, 1704–1707. [Google Scholar] [CrossRef]
  18. Takahashi, N.; Morimoto, H.; Yunoki, Y.; Miyagi, D. Effect of shrink fitting and cutting on iron loss of permanent magnet motor. J. Magn. Magn. Mater. 2008, 320, e925–e928. [Google Scholar] [CrossRef]
  19. Croccolo, D.; De Agostinis, M. Analytical solution of stress and strain distributions in press fitted orthotropic cylinders. Int. J. Mech. Sci. 2013, 71, 21–29. [Google Scholar] [CrossRef]
  20. Turnbull, D. Under what conditions can a glass be formed? Contemp. Phys. 1969, 10, 473–488. [Google Scholar] [CrossRef]
  21. Turnbull, D.; Cohen, M.H. Free-Volume Model of the Amorphous Phase: Glass Transition. J. Chem. Phys. 1961, 34, 120–125. [Google Scholar] [CrossRef]
  22. Zhang, W.; Meng, Y.; Wang, J.; Guan, S.; Zhang, T. Effect of continuous rapid annealing on the microstructure and properties of Fe85P11C2B2 amorphous alloy. Mater. Lett. 2022, 315, 131984. [Google Scholar] [CrossRef]
  23. Yu, H.; Li, J.; Li, J.; Chen, X.; Han, G.; Yang, J.; Chen, R. Enhancing the Properties of FeSiBCr Amorphous Soft Magnetic Composites by Annealing Treatments. Metals 2022, 12, 828. [Google Scholar] [CrossRef]
  24. Yin, L.; Zhu, Z.; Zheng, H.; Xu, X.; Liu, J. The coating with epoxy on Fe78Si9B13 amorphous alloy magnetic core and its influence on soft magnetic properties were studied. J. Funct. Mater. 2012, 43, 722–724. [Google Scholar] [CrossRef]
  25. Abrosimova, G.; Chirkova, V.; Matveev, D.; Pershina, E.; Volkov, N.; Aronin, A. Influence of a Protective Coating on the Crystallization of an Amorphous Fe78Si13B9 Alloy. Metals 2023, 13, 1090. [Google Scholar] [CrossRef]
  26. Qing, M.; Chong, T.; Jing, H.; Sun, B. Study on the Soft Magnetic Properties of FeSiB/EP Composites by Direct Ink Writing. Front. Mater. 2021, 8, 792768. [Google Scholar] [CrossRef]
  27. Cui, H.; Dong, B.; Xing, Y.; Cheng, Y.; Wang, L.; Zhou, S. Soft magnetic properties of FeCoSiBC amorphous alloys with high saturation magnetization. J. Mater. Sci. Mater. Electron. 2023, 34, 1801. [Google Scholar] [CrossRef]
  28. Duan, X.; Ju, S.; Li, Y.; Zhu, Z.; Zhang, H.; Zhang, W. Effects of B/P and Co/Fe substitutions on glass-forming ability and soft magnetic properties of a Fe80P13C7 metallic glass. J. Non-Cryst. Solids 2023, 615, 122480. [Google Scholar] [CrossRef]
  29. Luo, Q.; Li, D.; Cai, M.; Di, S.; Zhang, Z.; Zeng, Q.; Wang, Q.; Shen, B. Excellent magnetic softness magnetization synergy and suppressed defect activation in soft magnetic amorphous alloys by magnetic field annealing. J. Mater. Sci. Technol. 2022, 116, 72–82. [Google Scholar] [CrossRef]
  30. Li, S.; Li, L.; Li, D.; Lu, Z. Effect of magnetic annealing on magnetostrictive properties of Fe80Si9B11 amorphous alloys. J. Iron Steel Res. 2019, 9, 854–858. [Google Scholar] [CrossRef]
  31. Gong, W.; Zhang, Z.; Lin, A.; He, J.; Hou, R.; Xu, Z. Magnetostriction measurement in electrical steel and amorphous strip. In Proceedings of the 2018 Conference on Precision Electromagnetic Measurements, Paris, France, 8–13 July 2018; pp. 1–2. [Google Scholar] [CrossRef]
Figure 1. Schematic diagram of compressive stress loading and testing.
Metals 13 01823 g001
Figure 2. (a) HRTEM and SAED plots of as-cast CAF4; (b) DSC curves of 1K101 and CAF4; (c) XRD curves of the quenched state and under different annealing temperatures.
Metals 13 01823 g002
Figure 3. (a) Loss curves of 1K101 before impregnation curing under 1.2 T excitation at different temperatures and frequencies; (b) Loss curves of 1K101 after impregnation curing under 1.2 T excitation at different temperatures and frequencies; (c) Loss curves of CAF4 before impregnation curing under 1.2 T excitation at different temperatures and frequencies; (d) Loss curves of CAF4 after impregnation curing under 1.2 T excitation at different temperatures and frequencies.
Metals 13 01823 g003
Figure 4. (a) Loss growth rate curves of 1K101 (annealed at 380 °C) and CAF4 (annealed at 260 °C) under 1.2T excitation at different frequencies before and after impregnation curing; (b) Annealing magnetization curves of 1K101 (400 °C before impregnation curing, 380 °C after impregnation curing) and CAF4 (270 °C before impregnation curing, 260 °C after impregnation curing).
Metals 13 01823 g004
Figure 5. (a) Magnetostriction curves of the annealed amorphous strip CAF4 under an excitation of 200, 600, and 1000 A/m at a frequency of 50 Hz; (b) Peak-to-peak magnetostriction curves of annealed (NA) amorphous strips of 1K101, CAF4, and their as-cast (AC) counterparts.
Metals 13 01823 g005
Figure 6. (a) Loss curves of 1K101 under different compressive stresses and frequencies when the excitation was 1.2 T; (b) Loss curves of CAF4 under different compressive stresses and frequencies when the excitation was 1.2 T.
Metals 13 01823 g006
Figure 7. Loss growth rate curves for 1K101 and CAF4 excited at 1.2 T under different frequencies when the compressive stress varied from 1.1 to 3.1 to 5.3 MPa.
Metals 13 01823 g007
Figure 8. (a) Magnetization curves of 1K101 under different compressive stresses; (b) Magnetization curves of CAF4 under different compressive stresses; (c) Magnetization curves of 1K101 and CAF4 under compressive stresses of 1.1, 3.1, and 5.3 MPa.
Metals 13 01823 g008
Table 1. Thermodynamic properties of as-cast 1K101 and CAF4 strips.
ItemTx1 (°C)Tp1 (°C)Tp2 (°C)ΔTp = Tp2 − Tp1 (°C)
1K10150852456440
CAF4340383536153
Difference (T 1K101 − T CAF4)16814128
Table 2. Interference fit and pressure correspondence.
Interference/mm0.050.10.20.250.3
Pressure/MPa1–22–34–56–78–9
Disclaimer/Publisher’s Note: The statements, opinions and data contained in all publications are solely those of the individual author(s) and contributor(s) and not of MDPI and/or the editor(s). MDPI and/or the editor(s) disclaim responsibility for any injury to people or property resulting from any ideas, methods, instructions or products referred to in the content.

