Article

Effect of Controlled Heat Treatment and Aluminum Additions on the Strengthening of Cu–Ni-Based Alloys

by
Isai Rosales-Cadena
1,*,
Jose Gonzalo Gonzalez-Rodriguez
1,
Constancio Diaz-Reyes
1,
Rene Guardian-Tapia
1,
Juan Antonio Ruiz-Ochoa
2,
America Maria Ramirez-Arteaga
3 and
Roy Lopez-Sesenes
3
1
Center for Research in Engineering and Applied Sciences, Autonomous University of Morelos State, Cuernavaca 62209, Mexico
2
Faculty of Sciences of the Enginery and Technology, Universidad Autónoma de Baja California, Tijuana 22390, Mexico
3
Chemical Sciences and Engineering College, FCQeI, Autonomous University of Morelos State, Cuernavaca 62209, Mexico
*
Author to whom correspondence should be addressed.
Metals 2023, 13(11), 1835; https://doi.org/10.3390/met13111835
Submission received: 21 September 2023 / Revised: 23 October 2023 / Accepted: 28 October 2023 / Published: 31 October 2023

Abstract

:
In this investigation, Cu–Ni alloys with different aluminum additions were synthetized under a vacuum atmosphere to reduce the material density. Annealed alloys in a He atmosphere with low aluminum concentration exhibited a coarse dendritic structure, while samples with high aluminum concentration exhibited a refined dendritic structure. Structural defects analyses have shown relatively low vacancy concentrations. Hardness evaluations indicated an increment by approximately 5 times i.e., 370 HVN, more than that for the alloyed samples compared with the as-cast and unalloyed samples. Compression tests have shown a noticeable strengthening improvement (360 MPa), mainly in samples heat treated with 10 at.% Al, while samples with 5 at.% Al showed an acceptable resistance (270 MPa) as well. In general, the sample with 10 at.% Al presented the best performance to be considered as potential structural material.

1. Introduction

Alloys for different technological and highly specialized applications are required nowadays, specifically in the building industry, and copper–nickel-based alloys can be used due to their excellent mechanical and physical properties, providing good structural resistance [1,2]. Copper, along with other chemical elements such as Chromium, Cobalt and Titanium, can be easily alloyed with a wide range of metals, rendering them highly valuable for various applications. However, binary alloys exhibit some mechanical limitations; hence, many of the investigations focus on the addition of a third or fourth element instead of the binary copper–nickel alloys, mainly to produce an effect on the microstructural [1,2,3,4] and mechanical properties [5,6,7,8,9]. Thus, H. Fu [10], studied the mechanical properties of Al–Cu–Ni alloys by controlling the solidification process and modifying the stress state of grain boundaries, restricting intergranular cracking caused by local stress concentration. Martinez [11] developed an investigation in Cu–Ni-based alloy with zirconium additions as a ternary element by means of mechanical alloying and hot-pressing conditions, achieving a significant increment in hardness but also in brittleness. On the other hand, Nickel, as a reinforcing element, has been widely used in super-alloys due to its mechanical and chemical properties. Likewise, extensive research has also been developed related to its corrosion resistance in different environments [12,13,14,15,16,17,18,19]. Density studies in materials and their correlation with thermal point defects have always been essential to understand the origins of possible emerging structural defects. Due to the fact that aluminum possesses a density approximately one third lower (2.7 g/cm3) in comparison with that for nickel and copper (8.90 and 8.96 g/cm3, respectively), then, these aluminum-base alloys can be considered for applications such as in the automotive as well as aerospace industry, and other sectors low density materials are required. It is well known that heat treatment under inert atmospheres may allow for a better controlled cooling rate, reducing the formation of residual stresses. Hence, the novelty of this work is to determine the influence of the aluminum additions to obtain relatively low-density alloys, as well to understand the heat treatment effect via vacuum and He atmosphere on the microstructure, in order to elucidate the possible defects generation, which can be detrimental on the physical-mechanical properties of the Cu–Ni and Cu–Ni-Al alloys. Therefore, the main goal of this investigation is to achieve the best alloy performance for applications as structural materials. The purpose of adding aluminum into the alloys is to increase the alloy performance, in order to manufacture bearings, heat exchangers, shafts, and other specialized machinery components.

2. Materials and Methods

2.1. Materials Synthesis

The chemical composition of the as-cast alloys shown in Table 1 were prepared by melting pure Cu (99.99 wt.%), Ni (99.99 wt.%), and Al (99.999 wt.%) in an Induction Furnace Unit. The melting process took place in a quartz crucible under vacuum conditions (10−3 torr). Table 1 shows the alloy designation, considering the elemental analyses and aluminum contents in 0, 5, and 10 at.% Al alloys. Additionally, we considered an extra amount of aluminum due to evaporation to maintain the nominal composition of aluminum. The thermal treatment involved solid solution at 873 K for 120 min, followed by furnace cooling. These treatments were performed under He atmosphere with a flux of 3 mL/min inside of a chamber furnace (FELIZA 301series). Specimens under these conditions were designated with TT nomenclature.

2.2. Metallographic Evaluation

Specimens were sanded with up to 600 grit SiC emery paper, and afterwards they were polished using alumina powder with a particle size of 0.03 µm. Samples were etched with a reactant of 5 g Fe2Cl3, 25 mL HCl and 70 mL deionized water during 20 s by applying a rubbing process. Microstructure and surface analyses were carried out in a LEO-1450VP Scanning Electron Microscope (Southampton, UK), whereas chemical microanalysis was performed using the Energy Disperse System (EDS) attached to the equipment.

2.3. Physical Properties

Density measurements were carried out by using an AccuPyc II 1340 Tec He-Pycnometer (Norcross, GA, USA) and taking 10 measurements for each sample to obtain the average density value. The lattice parameter measurements were obtained from the X-ray diffraction patterns using high purity silicon powders (99.999 wt.%) as the standard. Lattice parameters were obtained by using the JADETM software and the internal silicon standard. The density was therefore obtained from the formulae. For this, a Bruker D2-PHASER X-ray Diffractometer (Karlsruhe, Germany) with a radiation of Cu–Kα: λ = 0.15406 nm and a scanning speed of 3°/min was used.

2.4. Mechanical Testing

Hardness Vickers measurements were carried out on the sample surface (previously polished with diamond paste with 0.03 µm average size), using a LECO, LM300AT Micro-hardness Tester (St. Joseph, MI, USA), with 0.2 kg load during 15 s. For this, a series of 10 indentations in different zones of the surface sample were taken, obtaining a better precision in the average and standard deviation of the hardness value, which is in agreement with the ASTM E384-22. For compression tests, specimens with cross sections of 5 × 5 mm and 10 mm height were machined according to the ASTM E9 standard by using an electro-discharge machine. After that, specimens were polished with up to 600 grit emery paper, obtaining parallel opposites surfaces, and compressed using an Instron 4501 Testing Machine (Norwood, MA, USA) with a strain rate of 10−3 s−1. Five tests were developed for each sample, and the average result was reported.

3. Results and Discussion

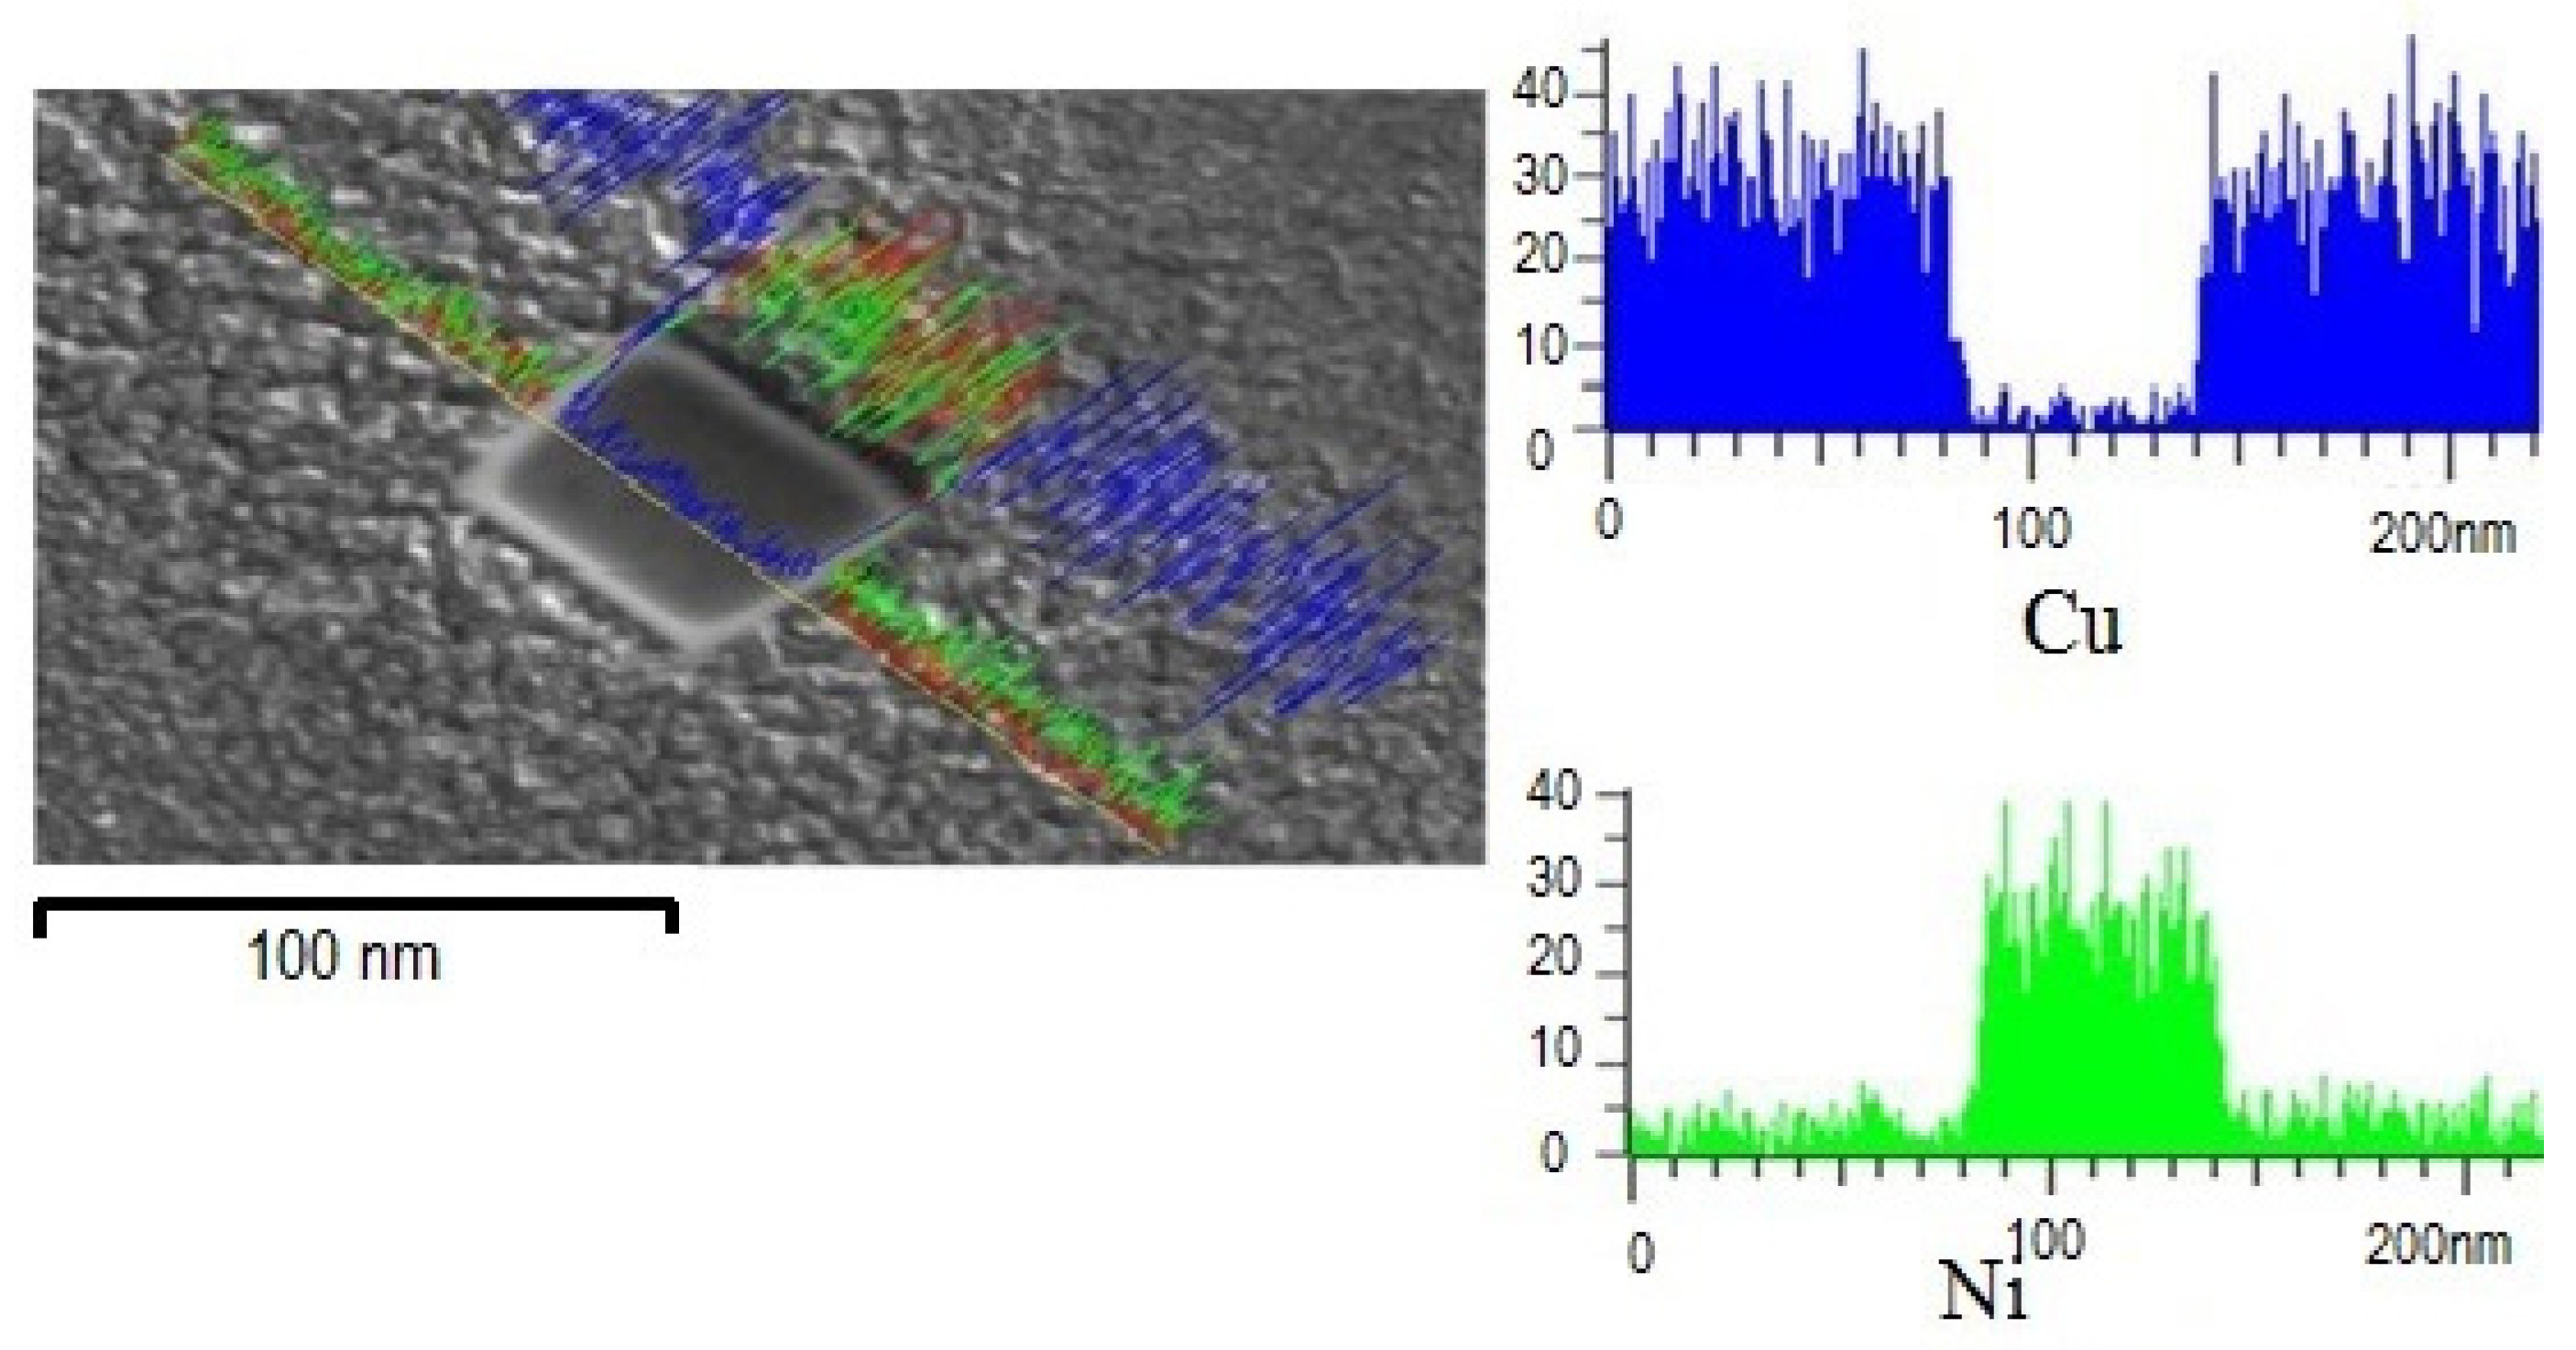
3.1. Microstructural Characterization

Figure 1 shows the alloys microstructure with and without heat treatment. It can be observed that the microstructure is a dendritic type in both conditions. Although in untreated alloys with 0, 5, and 10 at.% Al, a predominantly coarse dendritic structure is observed. On the other hand, samples in the annealing condition present a refined dendritic structure. Lei [2] reported a similar result in Cu–Ni-Si alloys. In these images, a reduction in the inter-dendritic spacing as well as in the dendrite arm length can be observed, especially in the heat-treated samples [20]. This effect is attributed to a saturation of aluminum atoms in the Cu–Ni structure, where posteriorly aluminum segregation is promoted through the inter-dendritic regions [21], which is possibly due to a diffusion process. Hence, this mechanism occurs when aluminum atoms with lower atomic radii in comparison with Cu and Ni (0.5 Å) take preferential positions in the Cu–Ni lattice during the casting–solidification process; thus, by analyzing the images in Figure 1, the apparition of a second phase in samples with 10 at.% Al is observed, indicating that aluminum solubility in the Cu–Ni alloy is lower than the mentioned composition [22]. On the other hand, in the heat-treated samples, a significant amount of precipitates randomly distributed over the surface in comparison with untreated samples is observed [23]. These precipitates come from the spontaneous reaction between the elements at the time the solidification occurs, creating a homogeneous distribution over the total area of the surface sample. Zones marked with 1, 2, and 3 are the places with the greatest precipitates concentration, the borders between the matrix and dendrite structure being the main observed precipitation zone (Zone 1). It is important to consider this observation as it can have a notable impact on the mechanical properties of the alloys.
On the other hand, the results of the X-ray diffraction analyses of the produced samples in different conditions are shown in Figure 2. Two different peaks are observed in this figure, i.e., CuNi (111) and CuNi (200), reflecting a solid solution mechanism, although aluminum peaks are diffracted at 2Ꝋ = 38 and 2Ꝋ = 44.8 degrees (which are almost undistinguished). It is observed that when the aluminum concentration increases, the peaks are shifted to the right as well. In other words, an increased Bragg angle would imply a reduction in the lattice parameter (these analyses will be presented in the lattice parameter section). The vertical dashed lines represent the Si peaks that were introduced as the standard for the lattice parameter calculations.

Lattice Parameter Analyses

Lattice parameter measurements were carried out in order to understand the lattice parameter variation in samples with different aluminum additions with and without thermal treatment as well. In Figure 3 it can be observed that for alloys with 5 and 10 at.% Al, the lattice parameter decreases as the aluminum content increases, and the observed slope in the plot for the heat-treated alloy containing 10 at.% aluminum content diminishes in comparison with the alloys of lower aluminum content, indicating a considerable lattice contraction. This was expected because the number of nickel atoms substituted by aluminum atoms in the lattice increases [24], obtaining the calculated reduction for 5 and 10 at.% Al of 0.012 and 0.011 Å, respectively, in this way producing a lattice contraction. In addition to this observation, these variations may indicate enough lattice distortion to promote dislocation generation, which means that the Burgers vector was affected as the lattice parameter was modified and that there exists some interference on the dislocation mobility that produces a plane misalignment. Thus, it is important to note in the plot that points for the different aluminum compositions do not fit a straight line along the aluminum compositions because this lattice parameter variation is not produced exclusively due to the aluminum incorporation, but also for the presence of the observed precipitates on the sample.

3.2. Physical Properties

Density and Thermal Defects Evaluation

Materials with low density and good mechanical resistance are interesting from an engineering point of view. In order to evaluate the aluminum effect on the alloys, density measurements were carried out in samples with different conditions. Table 2 shows that the density values decrease as the aluminum content increases, which is not surprising since aluminum atomic weight is lower than that for copper and nickel density in a ratio close to 3:1. Therefore, because the addition of aluminum is considered as a substitutional element within the alloy [2], it is necessary to evaluate if any thermal defects were produced during solidification. Calculations of vacancy concentration were carried out by taking considering the density values obtained in Table 2 and using the following relation described by Zhu [25].
C v = ρ X R D ρ p y c ρ p y c
where:
Cv = Vacancy concentration;
ρXRD = Density obtained by X-ray diffraction;
ρpyc = Density obtained by He-Pycnometry.
Table 2. Vacancies concentrations and densities values obtained from X-ray diffraction and He-pycnometer.
Alloy DesignationDensity by X-ray Diffraction [g/cm3]Density by He-Pycnometry
[g/cm3]
Vacancy Concentration
[%]
AB9.56019.55940.0073
ABTT9.55819.55700.0115
AT59.20859.20110.0804
AT5TT9.20719.20380.0358
AT108.93478.93070.0447
AT10TT8.93048.92570.0526
It is important to note that the obtained results of vacancies concentration (see Table 2) are lower than 1.0%, which means that thermal defects are minimal (these results are lower than the experimental error). Among the mechanisms that can produce a lattice parameter reduction [26], vacancies are one of the most common defects during the casting process. Nevertheless, due to the low range of vacancies concentration obtained for all alloys, it is demonstrated that by using this process under vacuum conditions and the applied heat treatments under He atmosphere, a considerable thermal defects reduction can be obtained. Thus, it is observed that defects generation by the incorporation of aluminum atoms in the structure increases slightly in comparison with the unalloyed sample in the as-cast condition, but it was controlled in a low range by using this atmosphere (since He possesses small atomic radii), allowing aluminum atoms to occupy most possible spaces in the lattice and therefore restricting the vacancies generation.
From the results above, it can be observed that these alloys present a good performance due to the density values produced by the aluminum incorporation into the alloys [27]. This fact allows us to consider the use of the material in several applications. On the other hand, the low index of thermal defects found in the alloys shows the reliability of the internal structural integrity of alloys and that it will not develop micro-cracks during the casting process due to these thermal defects.

3.3. Mechanical Characterization

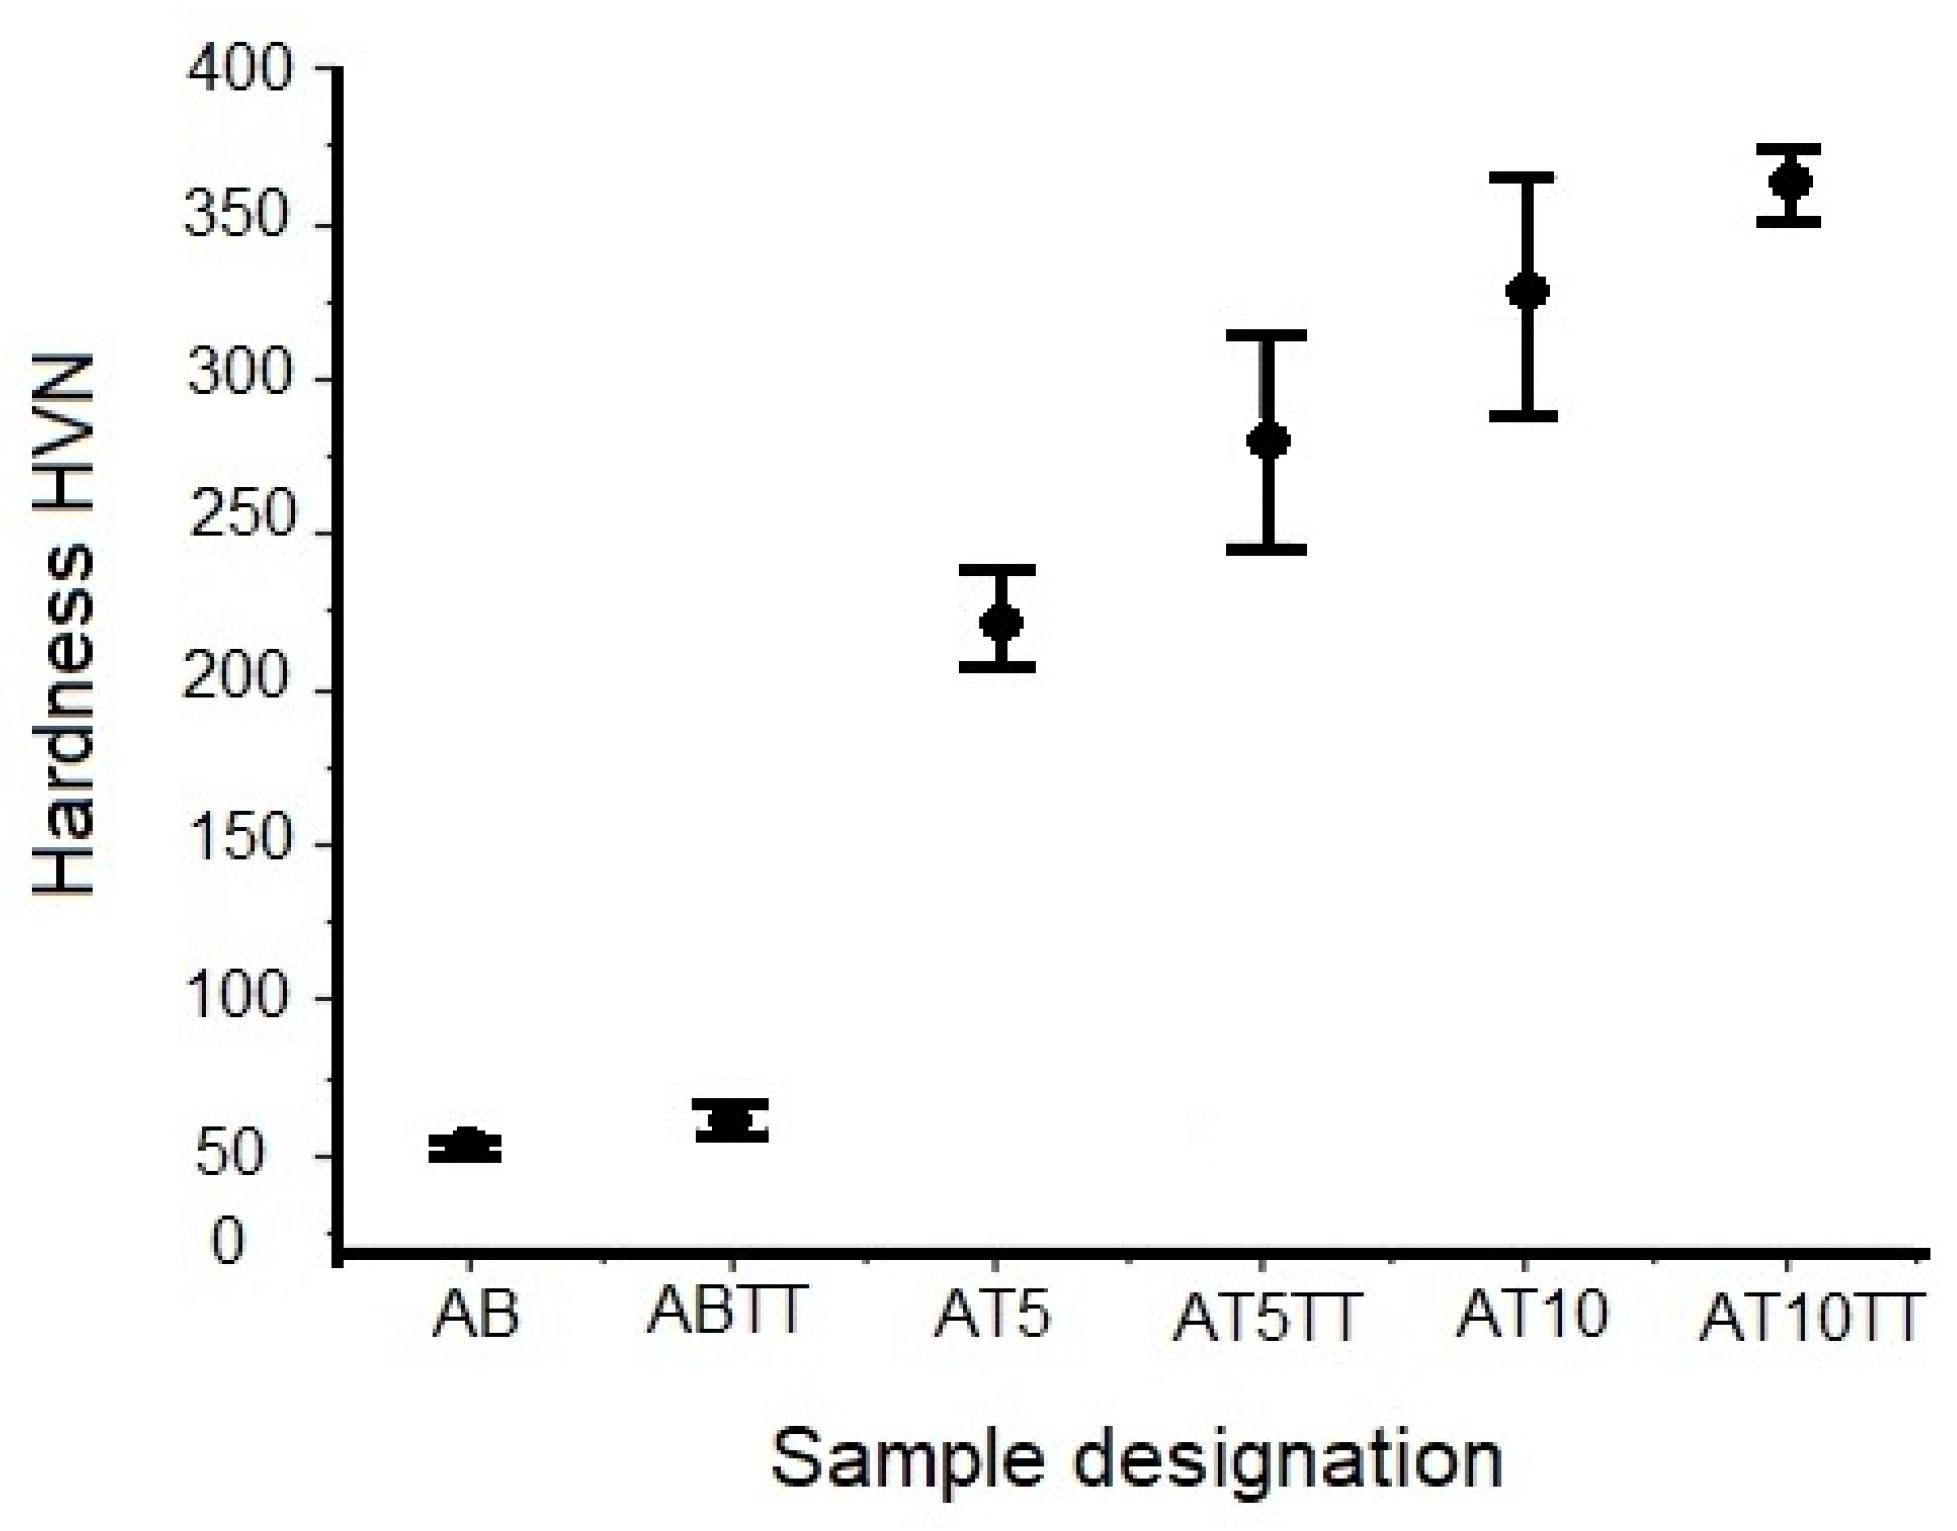
3.3.1. Hardness Evaluation

In structural applications, it is important to know the hardness of the components. In other words, it is very important to use materials with a specific hardness. The results of hardness evaluation are shown in Figure 4, where it can be observed that for samples without heat treatment, the average hardness value of ternary AT5 and AT10 alloys is 260 kg/mm2 and 350 kg/mm2 respectively, which represent considerable increment with respect to the unalloyed sample (binary AB), which possesses a hardness value of approximately 50 kg/mm2. On the other hand, by analyzing the effect of heat treatment, it is observed that the ABTT binary alloy does not present a significant variation. However, AT5TT and AT10TT alloys present a noticeable hardness increment (280 and 350 kg/mm2, respectively), representing an increment of approximately 20 and 40%, respectively, compared with the binary alloy. This hardening effect is produced partially by a dendrite refinement due to the applied heat treatment [28,29,30,31]. Therefore, low plastic deformation is reached when grain boundaries inhibit dislocation movement. Due to the fact that a big amount of finely dispersed precipitates were observed on the surface sample in Figure 1, it is likely that a hardening effect due to the precipitation mechanism can occur [7].
Therefore, in order to corroborate the former statement, SEM surfaces analyses on the precipitates were carried out. Figure 5 shows a line scan analysis carried out across the surface of a precipitate in the sample with 10 at.% Al. It was found that the precipitate composition is mainly of nickel, with some copper traces with a square-type morphology and an average size of 60 nm. The fraction area calculation of the precipitates using the IPA (Image Processing Analysis) of the SEM indicates 15% in an average area of 400 µm2. Such an amount of precipitates may take part in the alloy strengthening, mainly when a dislocation impacts a precipitate. On the other hand, it is important to consider that precipitates are not coherent with each other (i.e., oriented in a different direction), as can be observed in Figure 1. Thus, the observed disorientation in the precipitates contributes to enhancing the alloy hardening [32]. These precipitates work as an obstacle for dislocation mobility, which is an observation postulated by Brandstetter [6]. In addition, similar hardening behavior has been reported in Cu–Ni-Si alloys with a controlled aging treatment [8].

3.3.2. Compression Tests Evaluation

In order to analyze the strengthening effect of aluminum additions in Cu–Ni samples, some compression tests were carried out by using a moderate strain rate of 10−3 s−1. Figure 6 presents the σ-ε curves for the evaluated alloys, where it can be observed that binary alloy (AB) does not show a significant change in the yielding point as compared to the heat-treated sample. However, the AT5TT alloy exhibits an important improvement in resistance compared to the untreated sample (at the same compositions). Similar behavior is observed in the AT10TT sample, where an increment in the yield strength value can be appreciated, attributed to the presence of precipitates and the small grain size of treated samples compared to untreated samples. Regarding this observation, Cahn [33] established that the segregation of solute atoms produces deformation by stacking faults in the lattice. Besides, if plastic deformation can be affected by the incorporation of an element that produces lattice distortion that does not allow the dislocation movement [10,11], then, this phenomenon can be one of the main causes for the alloy strengthening. In fact, for all curves, strain continues above 2%, but after these values it starts to drop down until it reaches the final fracture. From the evaluated curves (considering the aluminum concentration), it is determined that alloys with 5 and 10 at.% Al acquired the biggest strengthening behavior in comparison with the unalloyed samples.

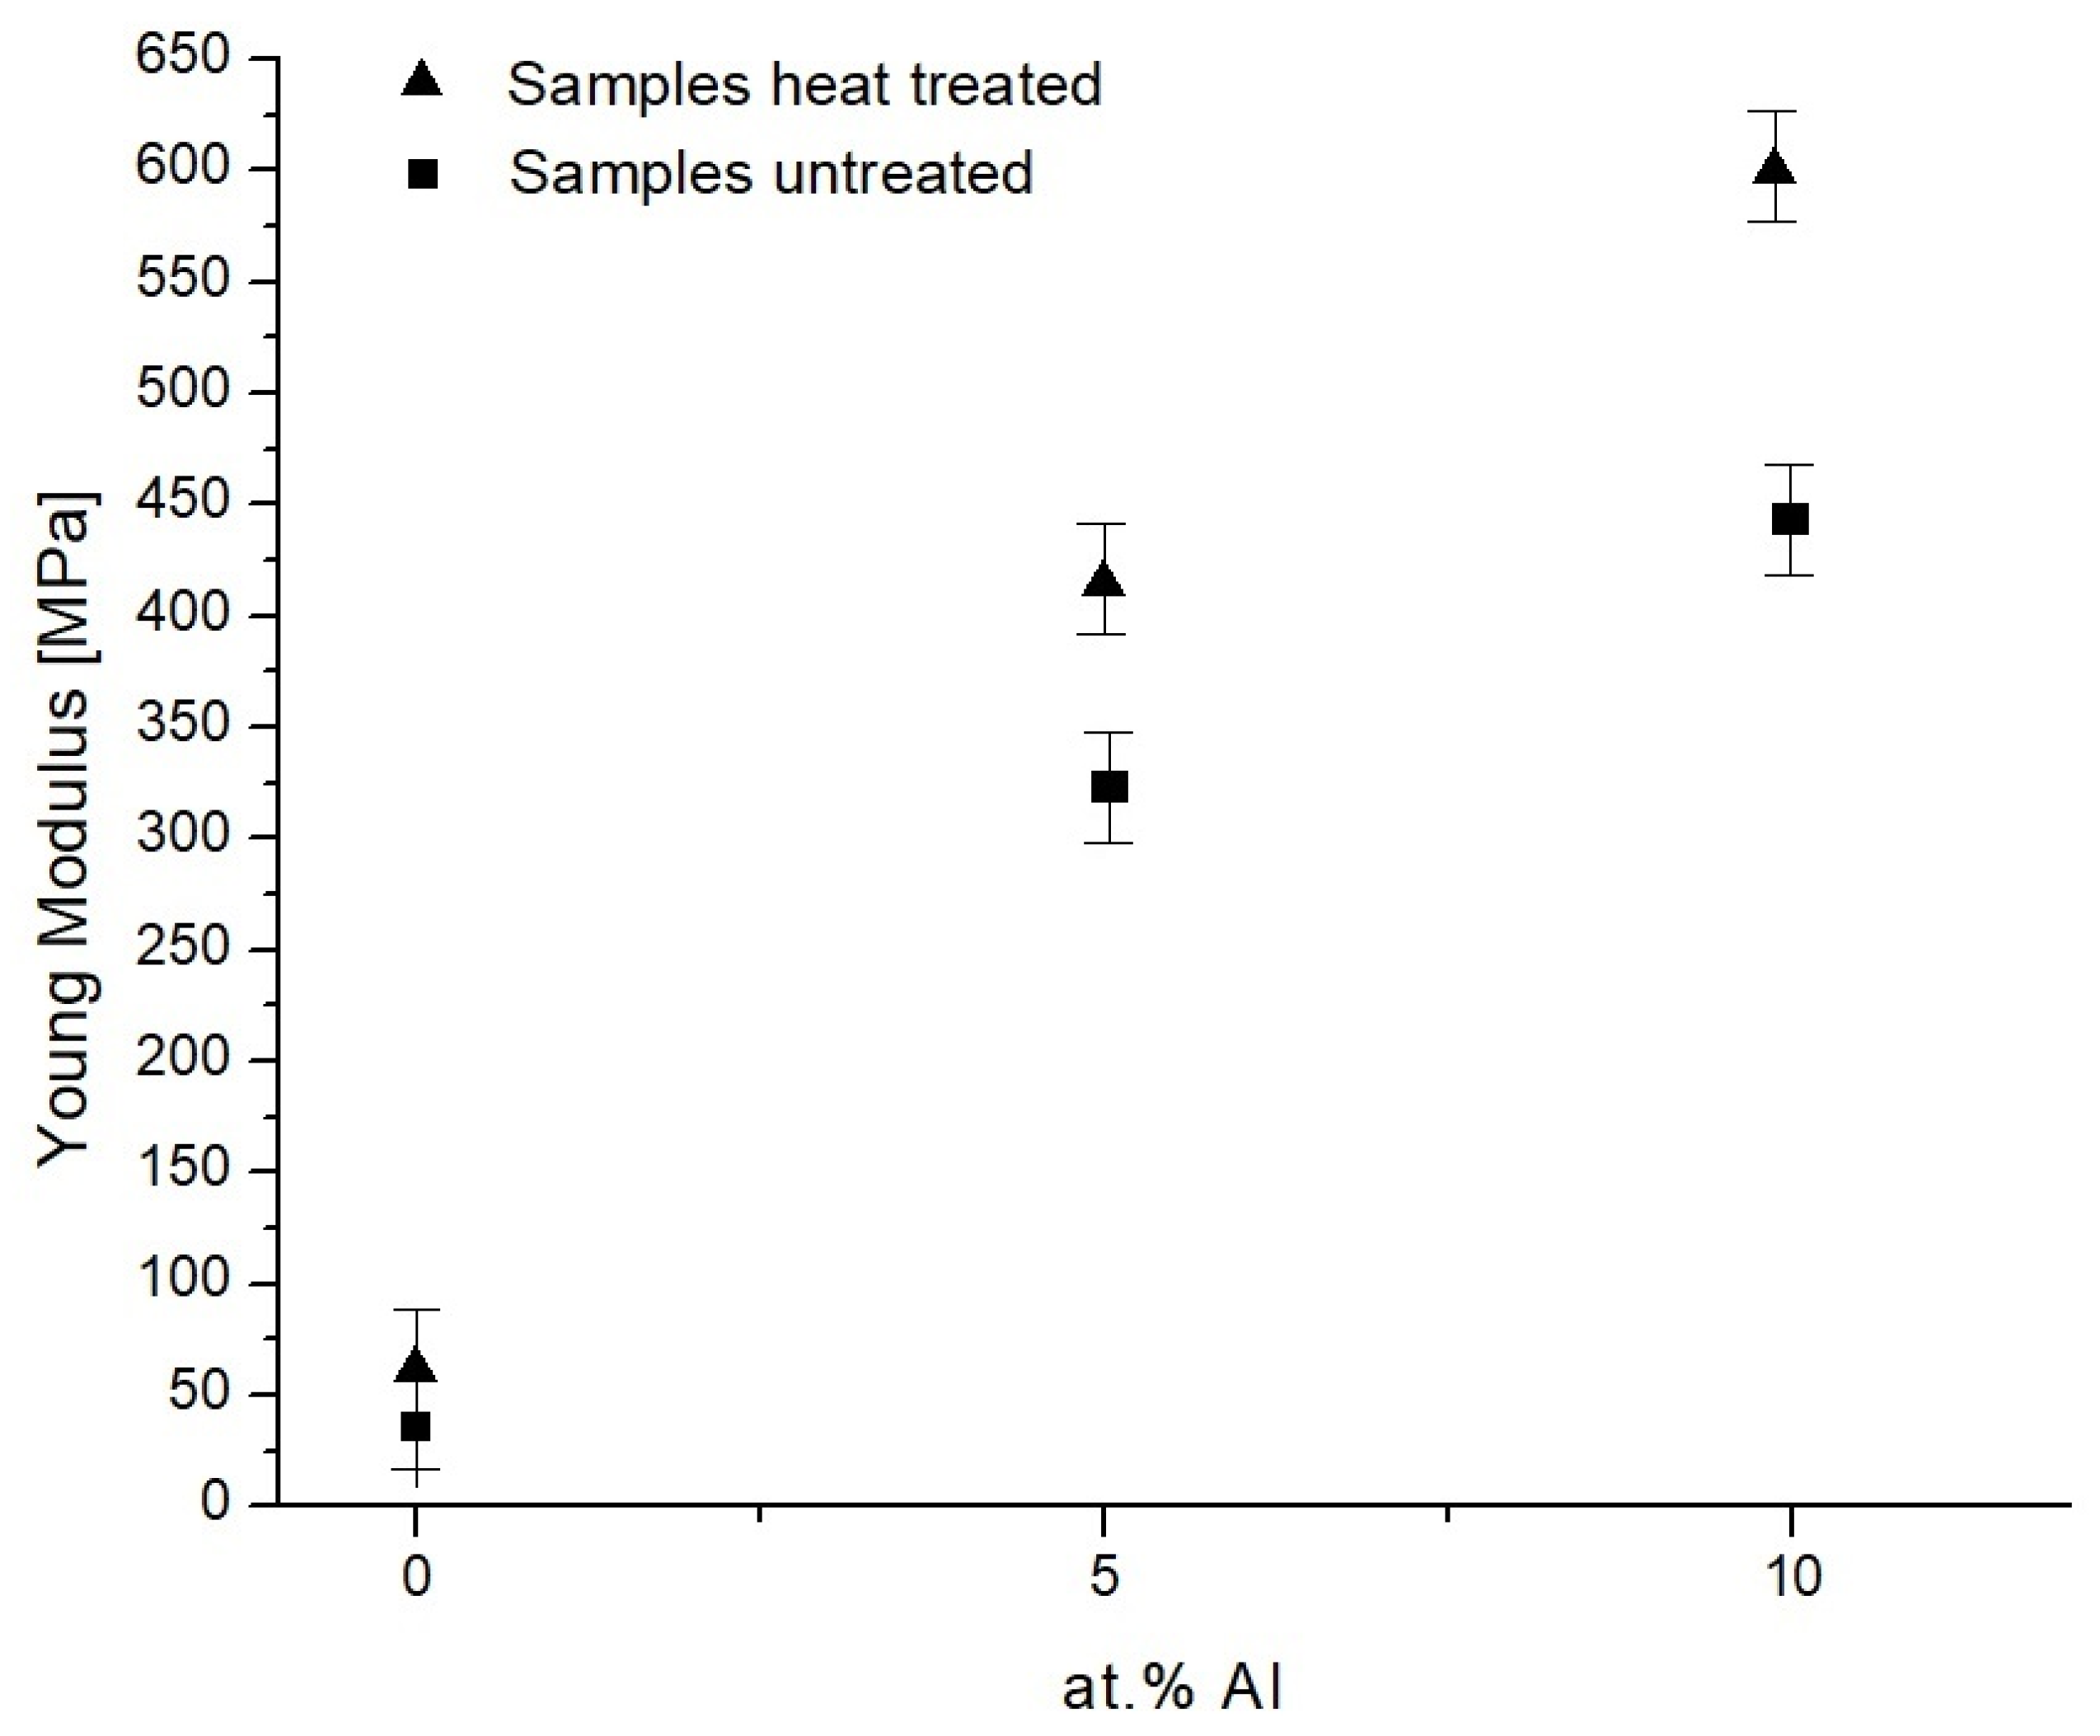
Young’s Modulus Evaluation

Due to the remarkable differences in slopes observed in the elastic zone of the curves of Figure 6, Young modulus was evaluated to understand the effect of the heat treatment and the aluminum addition. In the results shown in Figure 7, it can be observed that heat-treated alloys present a significant slope increment compared to the untreated samples, which means that the elastic modulus increases proportionally as a function of aluminum addition. It is well known that a plastic deformation during the compression test process reflects the correlation between the applied stresses with dislocation mobility. Therefore, the increment in aluminum addition promotes one of the characteristic hardening mechanisms observed in copper-based alloys [34], namely the solute segregation to dislocation. This way, if Young’s modulus is properly considered as the stiffness of a material, then a higher elastic modulus value directly reflects a small deformation behavior. Hence, a noticeable increment of the slope value in the elastic zone of the σ-ε curves is produced by the aluminum additions that produce the crystal structure disorder with the consequent low index in plastic flow, reflected mainly in samples with a high aluminum content.
Due to Young’s modulus, [E] is the relation between the differential of the applied stress and the differential of the obtained strain, which is described as follows:
E = Δ σ Δ ϵ
where ∆σ is the stress variation and Δϵ is the strain variation; this equation is considered for ideal materials, in other words, it does not consider the internal defects of the material. In this investigation, the internal defects index is close to zero, and therefore this equation can be directly applied with good approximation in the estimation of the Young’s modulus.

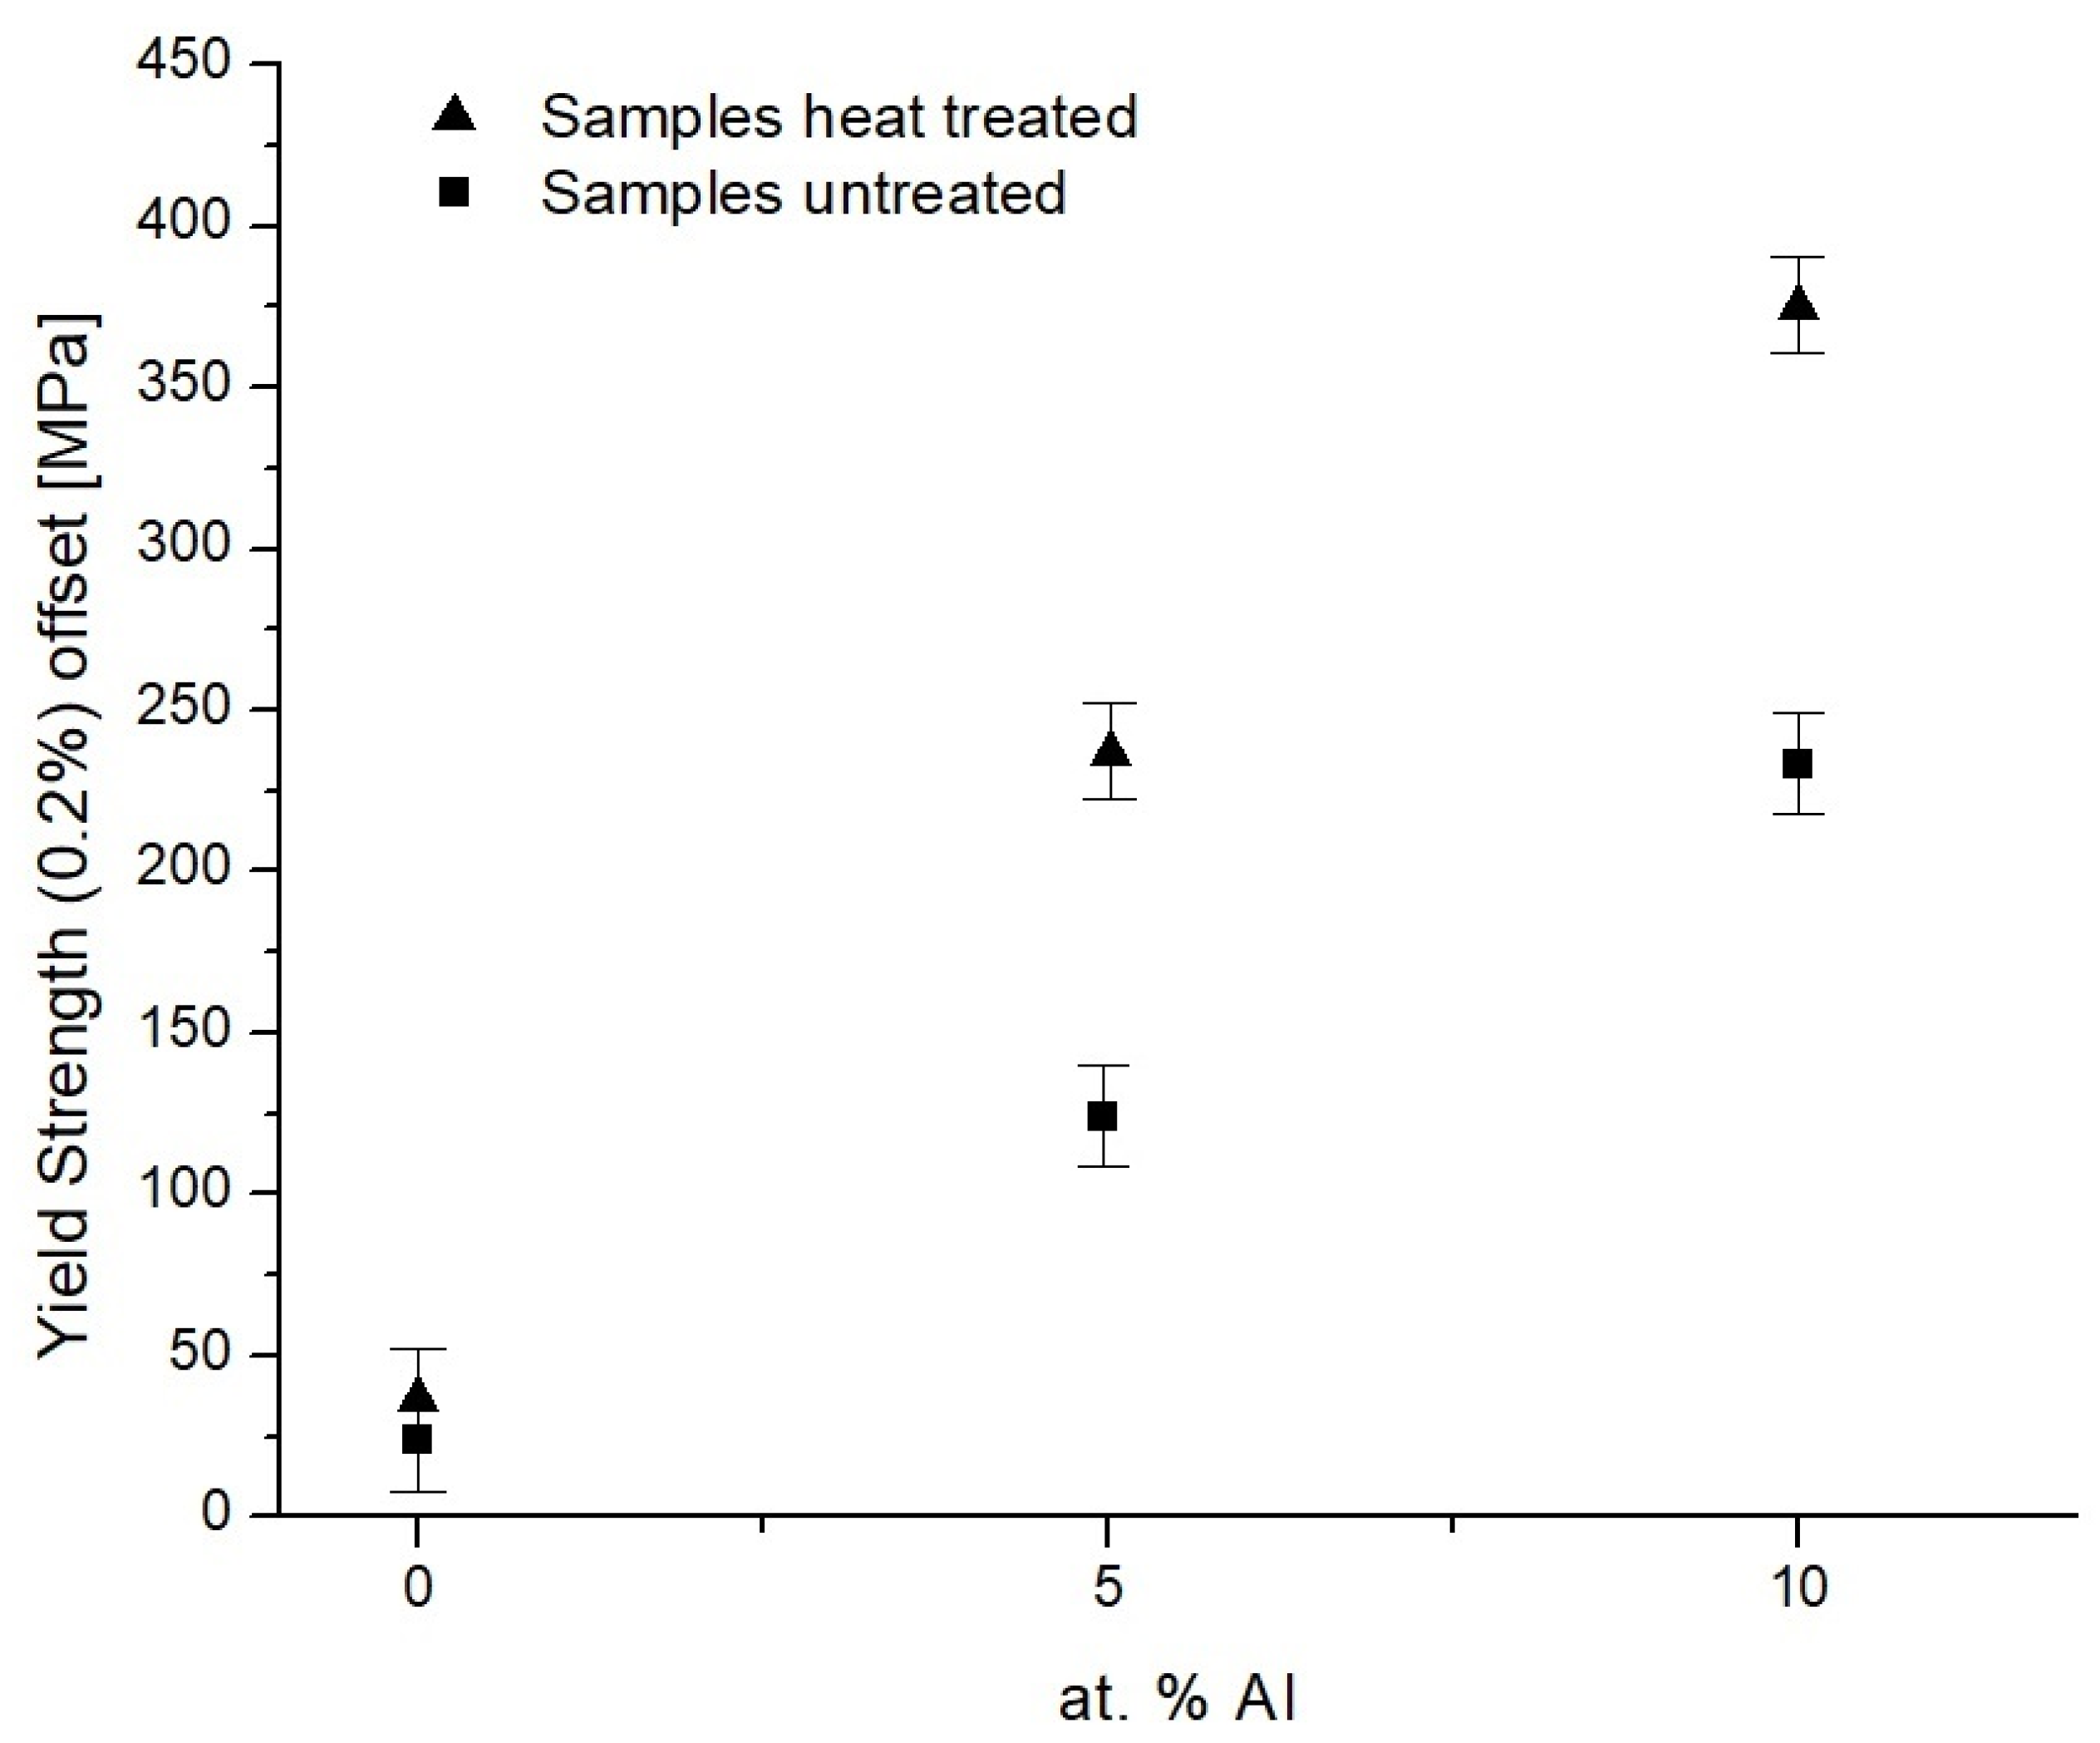
Yield Stress Evaluation

Yielding behavior is an important parameter in the strengthening of the alloys, where we obtain the value that will be used for structural calculations. Figure 8 shows the resulting values of the yield strength variation obtained from the evaluated compression tests, considering the 0.2% offset of deformation. In this plot, it can be observed that the yield strength value increases proportionally with the aluminum content [35]. For the as-casting samples, the following values were obtained, AB ≈ 26 MPa, AT5 ≈ 124 MPa, and AT10 ≈ 226 MPa, the former value representing a maximum increment of 5 times more than that of the unalloyed sample. A similar tendency is observed for samples in the annealing condition, where it is observed that samples with thermal treatment present a higher yielding value in comparison with untreated samples, reaching close to a 300% increment in comparison with the as-cast sample (ABTT ≈ 40 MPa, AT5TT ≈ 235 MPa, and AT10TT ≈ 376 MPa). However, due to the fact that the compression process is governed by the creation and annihilation of dislocations produced by the applied stresses, the dislocation movement can then be minimized when it crosses through the grain boundaries, reducing the dislocations mobility. Additionally, combined with the presence of precipitates, which works as an obstacle for plastic deformation, the combination of these factors produces an improvement in the yielding behavior [36].
The tendency of the yield strength of the samples (taking into consideration the aluminum additions) was found to be similar to that observed in the hardness behavior, i.e., when the aluminum addition increases, the yielding samples also increase.

4. Conclusions

Copper–nickel alloys were synthetized in order to consider the alloys as structural material. After a controlled heat treatment in a He atmosphere, a coarse dendritic structure was obtained in the as-cast samples while a refined dendritic structure was obtained in the thermally treated specimens. Due to the aluminum addition, a reduced density of approximately 6.6% was achieved.
The thermal defects analyses demonstrated a minimum effect of the heat treatments with a low range of defects concentration in the alloys that was essentially close to zero.
The hardening precipitation proved to be one of the main strengthening mechanisms in the alloys, increasing the alloy hardness to 370 HVN, by approximately 5 times higher than that of the unalloyed samples (50 HVN).
Furthermore, compression tests indicate that heat-treated samples with high aluminum addition presented enhanced resistance. The sample with 10 at.% Al showed the best alloy performance (50 vs. 376 MPa). In conclusion, we have established that the strengthening observed in alloys is proportional with the increment of substitutional aluminum.

Author Contributions

The authors who participated in material preparation. Experiments, data collection, and analysis results; C.D.-R., R.G.-T. and J.A.R.-O. The first draft of the manuscript was written by I.R.-C., A.M.R.-A., R.L.-S. and J.G.G.-R. commented on previous versions of the manuscript, developing a complete discussion of results. The final version of the manuscript was performed by I.R.-C. All authors have read and agreed to the published version of the manuscript.

Funding

This project was technically supported by PRODEP under grant UAEM/PTC-074.

Data Availability Statement

Not applicable.

Acknowledgments

The authors express their gratitude to A. Aguilar and J. Macedonio for their helpful support in mechanical characterization.

Conflicts of Interest

The authors declare no conflict of interest.

References

  1. Grandhi, M.; Nguyen, V.; Liu, Z.; Romo-De-La-cruz, C.-O.; Song, X. Copper-nickel functionally magnetic gradient material fabricated via directed energy deposition. J. Manuf. Process. 2023, 100, 47–54. [Google Scholar] [CrossRef]
  2. Lei, Q.; Li, Z.; Dai, C.; Wang, J.; Chen, X.; Xie, J.M.; Yang, W.W.; Chen, D.L. Effect of aluminum on microstructure and property of Cu–Ni–Si alloys. Mater. Sci. Eng. A 2013, 572, 65–74. [Google Scholar] [CrossRef]
  3. Schneider, M.S.; Kad, B.; Kalantar, D.H.; Remington, B.A.; Kenik, E.; Jarmakani, H.; Meyers, M.A. Laser shock compression of copper and copper–aluminum alloys. Int. J. Impact Eng. 2005, 32, 473–507. [Google Scholar] [CrossRef]
  4. Devi Janani, R.; Salman, S.A.; Pavithra Priyadharshini, K.; Karthik, V. Effect of composition on the stacking fault energy of copper-nickel alloys using molecular dynamics simulations. Mater. Today Proc. 2021, 39, 1796–1800. [Google Scholar] [CrossRef]
  5. McFadden, S.X.; Mishra, R.S.; Valiev, R.Z.; Zhilyaev, A.P.; Mukherjee, A.K. Low-temperature superplasticity in nanostructured nickel and metal alloys. Nature 1999, 398, 684–686. [Google Scholar] [CrossRef]
  6. Brandstetter, S.; Zhang, K.; Escuadro, A.; Weertman, J.R.; Van Swygenhoven, H. Grain coarsening during compression of bulk nanocrystalline nickel and copper. Scr. Mater. 2008, 58, 61–64. [Google Scholar] [CrossRef]
  7. Zhang, Y.; Liu, P.; Tian, B.-H.; Liu, Y.; Li, R.-Q.; Xu, Q.-Q. Hot deformation behavior and processing map of Cu–Ni–Si–P alloy. Trans. Nonferrous Met. Soc. China 2013, 23, 2341–2347. [Google Scholar] [CrossRef]
  8. Suzuki, S.; Shibutani, N.; Mimura, K.; Isshiki, M.; Waseda, Y. Improvement in strength and electrical conductivity of Cu–Ni–Si alloys by aging and cold rolling. J. Alloys Compd. 2006, 417, 116–120. [Google Scholar] [CrossRef]
  9. Naghash, A.R.; Etsell, T.H.; Xu, S. XRD and XPS Study of Cu−Ni Interactions on Reduced Copper−Nickel−Aluminum Oxide Solid Solution Catalysts. Chem. Mater. 2006, 18, 2480–2488. [Google Scholar] [CrossRef]
  10. Fu, H.; Song, S.; Zhuo, L.; Zhang, Z.; Xie, J. Enhanced mechanical properties of polycrystalline Cu–Al–Ni alloy through grain boundary orientation and composition control. Mater. Sci. Eng. A 2016, 650, 218–224. [Google Scholar] [CrossRef]
  11. Martínez, C.; Briones, F.; Rojas, P.; Aguilar, C.; Guzman, D.; Ordoñez, S. Microstructural and mechanical characterization of copper, nickel, and Cu-based alloys obtained by mechanical alloying and hot pressing. Mater. Lett. 2017, 209, 509–512. [Google Scholar] [CrossRef]
  12. Tassaoui, K.; Damej, M.; Molhi, A.; Berisha, A.; Errili, M.; Ksama, S.; Mehmeti, V.; El Hajjaji, S.; Benmessaoud, M. Contribution to the corrosion inhibition of Cu-30Ni copper-nickel alloy by 3-amino-1,2,4-triazole-5-thiol (ATT) in 3% NaCl solution. Experimental and theoretical study (DFT, MC and MD). Int. J. Corros. Scale Inhib. 2022, 11, 221–244. [Google Scholar] [CrossRef]
  13. Gonçalves, R.S.; Azambuja, D.S.; Serpa Lucho, A.M. Electrochemical studies of propargyl alcohol as corrosion inhibitor for nickel, copper, and copper/nickel (55/45) alloy. Corros. Sci. 2002, 44, 467–479. [Google Scholar] [CrossRef]
  14. Shao, G.; Gao, Y.; Wu, J.; Liu, P.; Zhang, K.; Li, W.; Ma, F.; Zhou, H.; Chen, X. Effect of Fe/Mn content on mechanical and corrosion properties of 90/10 copper–nickel alloy. Mater. Corros. 2022, 73, 1085–1098. [Google Scholar] [CrossRef]
  15. Kear, G.; Barker, B.D.; Stokes, K.R.; Walsh, F.C. Electrochemistry of non-aged 90–10 copper–nickel alloy (UNS C70610) as a function of fluid flow: Part 1: Cathodic and anodic characteristics. Electrochim. Acta 2007, 52, 1889–1898. [Google Scholar] [CrossRef]
  16. Martinez, S.; Metikoš-Huković, M. The inhibition of copper–nickel alloy corrosion under controlled hydrodynamic condition in seawater. J. Appl. Electrochem. 2006, 36, 1311–1315. [Google Scholar] [CrossRef]
  17. Metikoš-Huković, M.; Babić, R.; Škugor, I.; Grubač, Z. Copper–nickel alloys modified with thin surface films: Corrosion behaviour in the presence of chloride ions. Corros. Sci. 2011, 53, 347–352. [Google Scholar] [CrossRef]
  18. Melchers, R.E. Temperature Effect on Seawater Immersion Corrosion of 90:10 Copper-Nickel Alloy. Corrosion 2001, 57, 440–451. [Google Scholar] [CrossRef]
  19. Shams El Din, A.M.; El Dahshan, M.E.; Taj El Din, A.M. Dissolution of copper and copper-nickel alloys in aerated dilute HCl solutions. Desalination 2000, 130, 89–97. [Google Scholar] [CrossRef]
  20. Okulov, I.; Kühn, U.; Marr, T.; Freudenberger, J.; Soldatov, I.; Schultz, L.; Oertel, C.G.; Skrotzki, W.; Eckert, J. Microstructure and mechanical properties of new composite structured Ti–V–Al–Cu–Ni alloys for spring applications. Mater. Sci. Eng. A 2014, 603, 76–83. [Google Scholar] [CrossRef]
  21. Chikova, O.A.; Chezganov, D.S.; Tsepelev, V.S.; Yu Ilyin, V. SEM investigation of the microstructure of cast CuNiAlCoFe equiatomic high entropy alloy. IOP Conf. Ser. Mater. Sci. Eng. 2019, 699, 012007. [Google Scholar] [CrossRef]
  22. Svirid, A.E.; Afanasiev, S.V.; Davydov, D.I.; Kuranova, N.N.; Makarov, V.V.; Pushin, V.G.; Ustyugov, Y.M. Microstructure and Mechanical Behavior of Cu-Al-Ni-B Alloys with Thermoelastic Martensitic Transformation. Metals 2023, 13, 967. [Google Scholar] [CrossRef]
  23. Pushin, V.; Kuranova, N.; Svirid, A.E.; Ustyugov, Y. Mechanical Behavior and Structural Characterization of a Cu-Al-Ni-Based Shape-Memory Alloy Subjected to Isothermal Uniaxial Megaplastic Compression. Materials 2022, 15, 3713. [Google Scholar] [CrossRef] [PubMed]
  24. Loginova, I.S.; Sazerat, M.V.; Loginov, P.A.; Pozdniakov, A.V.; Popov, N.A.; Solonin, A.N. Evaluation of Microstructure and Hardness of Novel Al-Fe-Ni Alloys with High Thermal Stability for Laser Additive Manufacturing. JOM 2020, 72, 3744–3752. [Google Scholar] [CrossRef]
  25. Zhu, J.H.; Pike, L.M.; Liu, C.T.; Liaw, P.K. Point defects in binary Laves phase alloys. Acta Mater. 1999, 47, 2003–2018. [Google Scholar] [CrossRef]
  26. Tyagunov, A.; Milder, O.; Tarasov, D.; Tyagunov, G. LLT structural changes in metal liquids as a basis for a thermal treatment technology of melts: A review. Phase Transit. 2021, 94, 1–22. [Google Scholar] [CrossRef]
  27. Okulov, I.V.; Volegov, A.S.; Attar, H.; Bönisch, M.; Ehtemam-Haghighi, S.; Calin, M.; Eckert, J. Composition optimization of low modulus and high-strength TiNb-based alloys for biomedical applications. J. Mech. Behav. Biomed. Mater. 2017, 65, 866–871. [Google Scholar] [CrossRef]
  28. Alexey, E.S.; Elena, S.B.; Artemy, V.P.; Vladimir, G.P. Comparative Electron-Microscopic Study of Shape Memory Alloys of Systems Cu-Ni-Al and Ni-Mn-Al. KnE Eng. 2019, 4, 215–222. [Google Scholar] [CrossRef]
  29. Ding, H.; Xiao, Y.; Bian, Z.; Wu, Y.; Yang, H.; Wang, H.; Wang, H. Design, microstructure and thermal stability of a novel heat-resistant Al-Fe-Ni alloy manufactured by selective laser melting. J. Alloys Compd. 2021, 885, 160949. [Google Scholar] [CrossRef]
  30. Svirid, A.E.; Pushin, V.G.; Kuranova, N.N.; Belosludtseva, E.S.; Pushin, A.V.; Lukyanov, A.V. The Effect of Plastification of Cu–14Al–4Ni Alloy with the Shape Memory Effect in High-Temperature Isothermal Precipitation. Tech. Phys. Lett. 2020, 46, 118–121. [Google Scholar] [CrossRef]
  31. Svirid, A.E.; Pushin, V.G.; Kuranova, N.N.; Makarov, V.V.; Ustyugov, Y.M. Structural and Phase Transformations and Physical and Mechanical Properties of Cu-Al-Ni Shape Memory Alloys Subjected to Severe Plastic Deformation and Annealing. Materials 2021, 14, 4394. [Google Scholar] [CrossRef] [PubMed]
  32. Svirid, A.E.; Lukyanov, A.V.; Pushin, V.G.; Kuranova, N.N.; Makarov, V.V.; Pushin, A.V.; Uksusnikov, A.N. Application of Isothermal Upset for Megaplastic Deformation of Cu–Al–Ni β Alloys. Tech. Phys. 2020, 65, 1044–1050. [Google Scholar] [CrossRef]
  33. Cahn, R.W.; Davies, R.G. X-ray evidence for segregation of solute to stacking faults in a copper-aluminium alloy. Philos. Mag. J. Theor. Exp. Appl. Phys. 1960, 5, 1119–1126. [Google Scholar] [CrossRef]
  34. Marković, I.; Nestorović, S.; Markoli, B.; Premović, M.; Mladenović, S. Study of anneal hardening in cold worked Cu–Au alloy. J. Alloys Compd. 2016, 658, 414–421. [Google Scholar] [CrossRef]
  35. Pushin, V.G.; Kuranova, N.N.; Svirid, A.E.; Uksusnikov, A.N.; Ustyugov, Y.M. Design and Development of High-Strength and Ductile Ternary and Multicomponent Eutectoid Cu-Based Shape Memory Alloys: Problems and Perspectives. Metals 2022, 12, 1289. [Google Scholar] [CrossRef]
  36. Svirid, A.E.; Pushin, V.G.; Kuranova, N.N.; Makarov, V.V.; Uksusnikov, A.N. The Effect of Heat Treatment on the Structure and Mechanical Properties of Nanocrystalline Cu–14Al–3Ni Alloy Subjected to High-Pressure Torsion. Phys. Met. Metallogr. 2021, 122, 883–890. [Google Scholar] [CrossRef]
Figure 1. Comparative analysis by SEM of microstructures for heat-treated (a,c,e) and as-cast alloys (b,d,f) at 500×. Zones 1, 2, and 3 are the places where precipitates were found.
Metals 13 01835 g001
Figure 2. X-ray diffraction analyses for samples with different heat treatments and with different aluminum additions.
Metals 13 01835 g002
Figure 3. Variation of the lattice parameter as a function of the aluminum content and heat treatment.
Metals 13 01835 g003
Figure 4. Hardness of alloys with different aluminum additions with and without heat treatment.
Metals 13 01835 g004
Figure 5. Line scan analysis on the precipitate formed on the heat-treated sample with 10 at.% Al (the red line corresponds to Al).
Metals 13 01835 g005
Figure 6. Stress–strain curves obtained from the compression test for samples with 0, 5, and 10 at.% Al with and without heat treatment.
Metals 13 01835 g006
Figure 7. Young’s modulus values of the alloys calculated from the elastic-plastic transition zone of the σ-ε curve for the alloys in different conditions.
Metals 13 01835 g007
Figure 8. Yield strength values from calculation of the curves σ-ε, considering the 0.2% offset of the strain for the different samples as a function of the aluminum additions.
Metals 13 01835 g008
Table 1. Alloy designation with the element analyses for the Cu–Ni-Al alloys (as-cast and heat-treated condition). Chemical analyses were performed using the ICP (induction couple plasma) method.
Alloy DesignationChemical Composition wt.%
CuNiAl
AB90.689.32--
ABTT90.699.31--
AT578.4419.322.22
AT5TT78.5019.302.20
AT1075.4919.224.57
AT10TT75.9019.634.47
Disclaimer/Publisher’s Note: The statements, opinions and data contained in all publications are solely those of the individual author(s) and contributor(s) and not of MDPI and/or the editor(s). MDPI and/or the editor(s) disclaim responsibility for any injury to people or property resulting from any ideas, methods, instructions or products referred to in the content.

