Article

Fatigue Life Prediction of High Strength Steel with Pitting Corrosion under Three-Point Bending Load

1
School of Automotive Engineering, Dalian University of Technology, Dalian 116024, China
2
Ulsan Ship and Ocean College, Ludong University, Yantai 264025, China
*
Author to whom correspondence should be addressed.
Metals 2023, 13(11), 1839; https://doi.org/10.3390/met13111839
Submission received: 22 September 2023 / Revised: 27 October 2023 / Accepted: 30 October 2023 / Published: 2 November 2023
(This article belongs to the Section Corrosion and Protection)

Abstract

:
Offshore structures often suffer from pitting corrosion, which leads to local stress concentrations, a decrease in the cross-sectional area, the subsequent initiation and gradual propagation of cracks, and a shorter service life as a result. This study aims to investigate the impact of pitting corrosion on the fatigue life endurance of high-strength steel used for offshore structures. To this end, a three-point bending fatigue test was first performed on the specimens to obtain the fatigue test data. Then, a fatigue life prediction model consisting of two terms is proposed based on fracture mechanics, and the fatigue test data are used to verify the reliability of the model. Finally, the experimental results are discussed, and conclusions are drawn. The first term was designed for crack initiation. Combining with the energy theory and slip band dislocation theory, a novel equivalent surface defect model was proposed and used to predict the fatigue life of pitted corroded specimens before crack initiation. The second term is designed for crack propagation. The generalized Paris model is adopted for fatigue life prediction during the crack propagation process after the crack angle is taken as a variable. The mathematical model for predicting three-point bending fatigue life was finally obtained, and the average relative error of the data validation results did not exceed 16%, which proved the reliability of the prediction model.

1. Introduction

Corrosion is a common issue in mechanical structures, causing significant damage to their structural integrity [1]. Pitting corrosion is a kind of metal corrosion that usually occurs under harsh working conditions, and localized pitting corrosion accounts for approximately 70% of overall destruction caused by corrosion. It was reported that under identical mass loss rates, pitting corrosion is typically more harmful than uniform corrosion [2]. Under the influence of alternating load, dramatically increased local stress fields are generated around corrosion pits, which consequently decrease the bearing capacity of the structure and shorten its service life as well [3]. Therefore, it is necessary to deeply understand the process of fatigue crack initiation and propagation and explore approaches to fatigue life prediction of pitted corroded metal structures under alternating load.
Currently, studies on the prediction of fatigue life of corroded metal structures are mainly divided into two categories. One is corrosion fatigue, which takes into account the synchronization and coupling of corrosion and alternating load and believes that corrosion and fatigue damage always exist and interact with each other all the time. The other is pre-corrosion fatigue, which applies mechanical theories to corroded metal structures and focuses on the influence of pitting geometry and fatigue load on the damage process and fatigue life. This method can improve the accuracy and efficiency of fatigue life prediction [4]. For example, Zhang adopted the damage mechanics evolution equation and the finite element method to predict fatigue life. Although the prediction was basically well in agreement with the experimental result, the initial damage caused by pre-corrosion was not taken into consideration [5]. Zhan regarded the initial damage of pre-corrosion as a constant and calculated the additional damage caused by alternating load using the same theory. But, they found that it was difficult to generalize the damage mechanics to predict fatigue life by the damage evolution method [6]. At present, methods based on fracture mechanics are commonly used for fatigue life prediction of pre-corroded structures, and good accuracy has been achieved [7]. Barter proposed an equivalent surface defect size method, where the critical pits on the specimen were assumed to be initial cracks, and the service life of the specimen was defined as the propagation time of the cracks [8]. This method effectively predicted the crack propagation life, but the service life before the crack initiation was not taken into consideration. Alvarez clearly pointed out that the crack propagation curve is conservative and can only provide a conservative prediction [9]. Fernandez proposed a cross-section fiber model to evaluate the fatigue performance of metal structures suffering from pitting corrosion, in which local effects caused by pitting corrosion, such as uneven distribution of material properties, stress concentration, and local deformation, were considered, and both generalized and local pitting effects were taken into consideration except the fatigue crack propagation behavior [10]. Huang treated pits as initial cracks and proposed an equivalent crack size model to predict fatigue life using linear elastic fracture mechanics [11]. However, the model only focused on the crack propagation life and ignored the period before crack initiation. The whole fatigue life of a metal structure should consist of both crack initiation life and crack propagation life. In order to foretell exactly the fatigue life of pitted corroded materials, both periods should be taken into consideration [12,13].
The presence of notch and size effects should also be considered. Considering the cost of full-size testing of components and the limitations of test conditions, it is difficult to carry out fatigue tests on them, and local fatigue life is often measured by the fatigue test data of small-size specimens [14]. Factors to be considered are stress concentration due to notched structures (notch effect) [15] and fatigue life changes due to dimensional changes (dimensional effect) [16]. The presence of notch and size effects has a significant impact on the experimental results. For the size effect and notch effect, it can be simply understood that the larger the size of the structural notch, the lower its strength [15]. Similarly, the fatigue life of a material typically decreases as its defect size rises; i.e., the larger the influence of the specimen’s zone, the greater the probability that it will develop more severe structural defects or lead to failure [17,18]. Therefore, it is necessary to establish an equivalent surface defect model for different structures and defect sizes, through which notch and size are transformed into one variable to facilitate the establishment and validation of subsequent fatigue life prediction models.
In this paper, firstly, the influence of the notch effect and size effect on the experimental results is taken into account to establish an equivalent surface defect model with one variable to represent the influence of specimens’ notch size and structure on fatigue performance. Then, the three-point bending fatigue life prediction of pitted metal structures is divided into two parts: crack initiation life and crack extension life. For the crack initiation life, a new equivalent surface defect model is proposed in this paper, which utilizes the volume loss rate and the pitting depth-to-diameter ratio to quantitatively assess the effect of pitting on fatigue life. For crack extension life, the crack angle is used to represent the crack extension process, and the Paris model is employed to predict the fatigue life of pitted specimens. Finally, the reliability of the fatigue life prediction model is verified by a three-point bending fatigue test, and the prediction results are in good agreement with the experimental results.

2. Materials and Methods

2.1. Equivalent Surface Defect Model

An equivalent surface defect model can be used to evaluate the influence of pitting damage on the fatigue life of structural members. Although the size of an equivalent surface defect can be represented by the roughness of the material, it does not take the influence of pitting characteristics into consideration, which includes pitting size and shape [19]. In the methods based on fracture mechanics, pits are regarded as surface defects, and the size of initial defect can be obtained by establishing the relationship between the size of initial defect and pit geometrical parameters [20]. Following this idea, the relationship between equivalent surface defect size, volume loss rate, and pitting hole size can be defined as follows:
lna0 = AV0 + B(h/d) + C,
where a 0 is the size of equivalent surface defect, V 0 means the volume loss rate of specimens, h / d is pitting depth to diameter ratio, and A , B , and C are model parameters.

2.2. Fatigue Life Prediction Model

The total fatigue life N f is composed of crack initial life N i and crack propagation life N p :
Nf = Ni + Np,

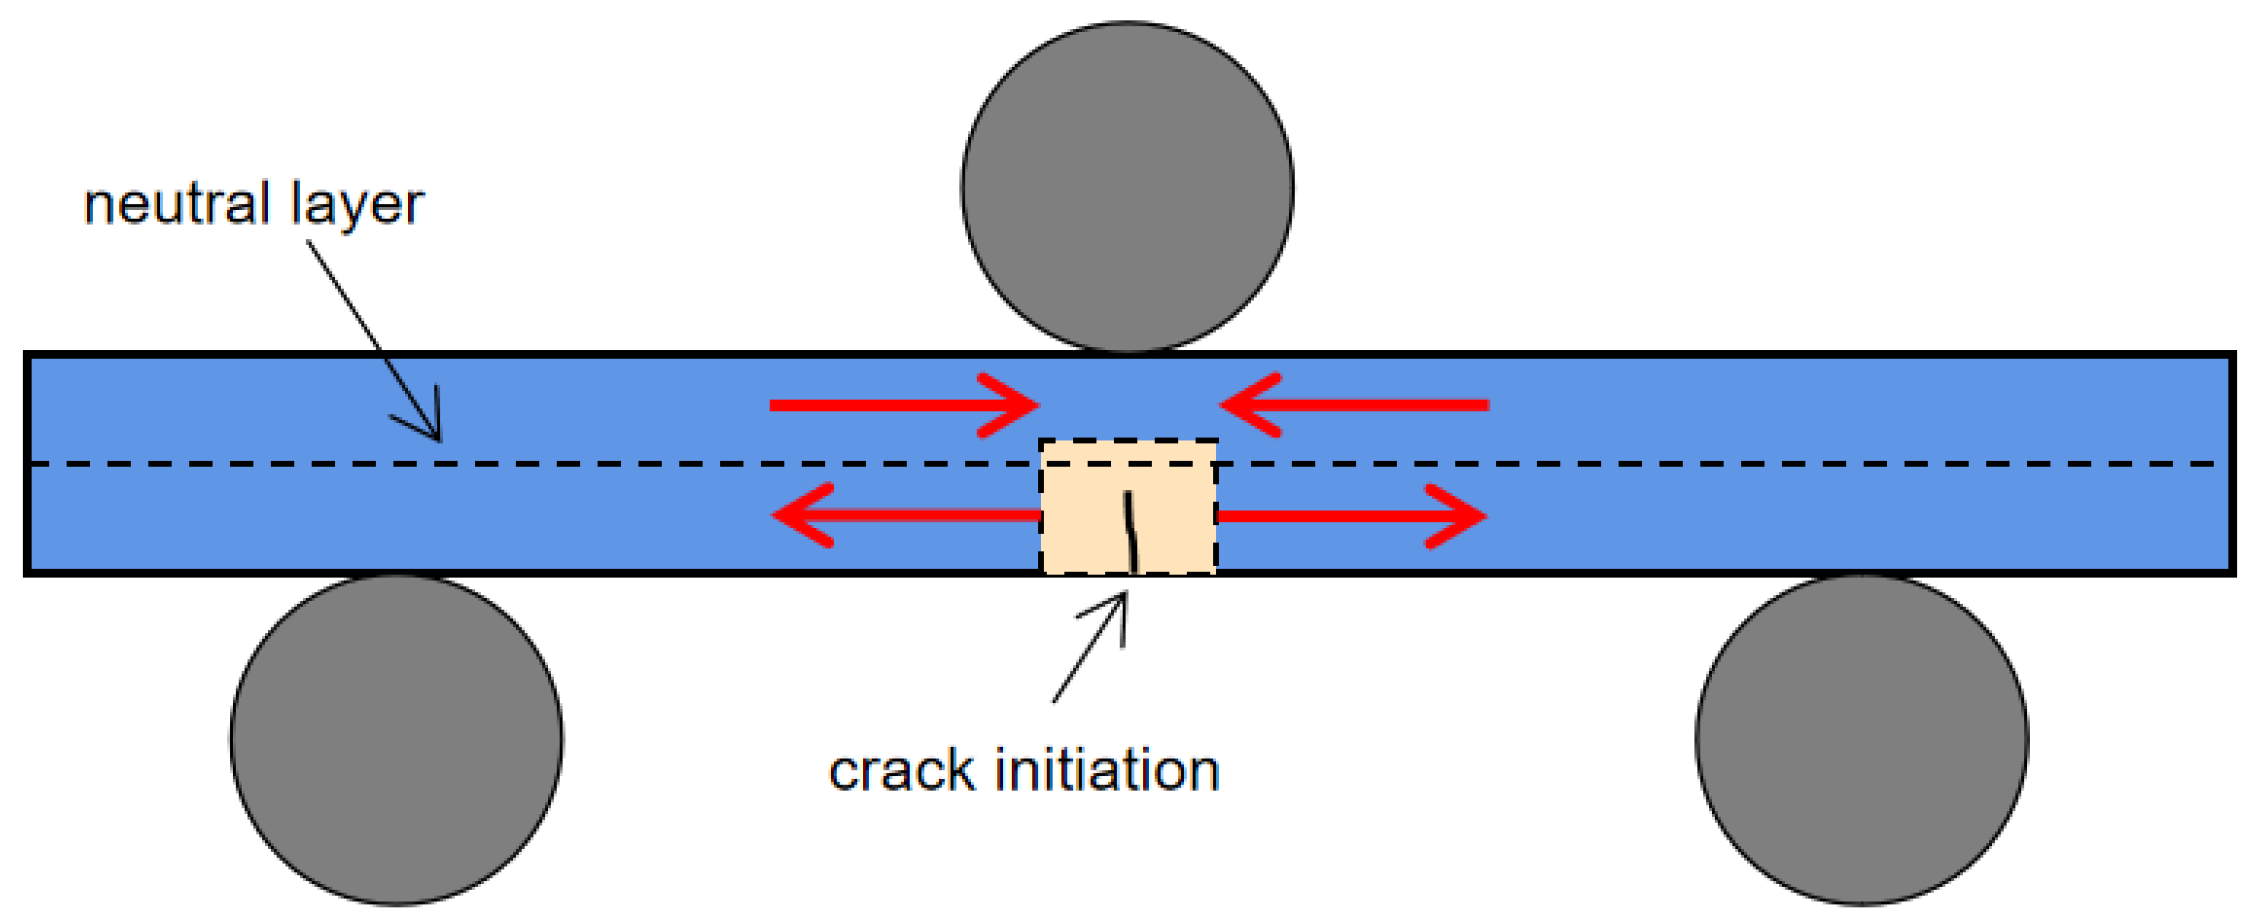
2.2.1. Prediction of Crack Initiation Life

Crack initiation life is defined as the number of load cycles before the generation of the crack. In order to foretell the crack initiation life, Tanaka and Mura assumed that the surface crack propagated forward along the grain boundary and proposed a method based on energy theory and slip band dislocation theory [21,22]:
N i = 9 K t h 2 G 2 E S S e 2 a 0 ,
where G is the shear modulus, E is the elastic modulus, S is the stress amplitude, and a 0 is the size of equivalent surface defect. The shear modulus and modulus of elasticity of DH36 steel are 80 GPa and 210 GPa, respectively.
S is given as follows:
S = 0.5(1 − R),
where Q is the destructive load, β is the stress level, and R is the stress ratio. In this paper, Q is shown in the experimental results section, β = 0.7, 0.8, 0.9. R = 0.2.
K t h is threshold of the range of stress intensity factors at which cracks do not extend [23] and S e is fatigue strength, MPa·m½.
K t h is given as follows:
Kth = 7(1 − 0.85R),
S e is defined as follows:
Se = (0.65fu + 14.48)/Kt,
where f u is the ultimate tensile strength of the material, which is 630 Mpa, and K t is the stress concentration factor. The stress concentration factor is related to the size of the pit and is defined as follows:
Kt = (1 + 6.6h/d)/(1 + 2h/d),

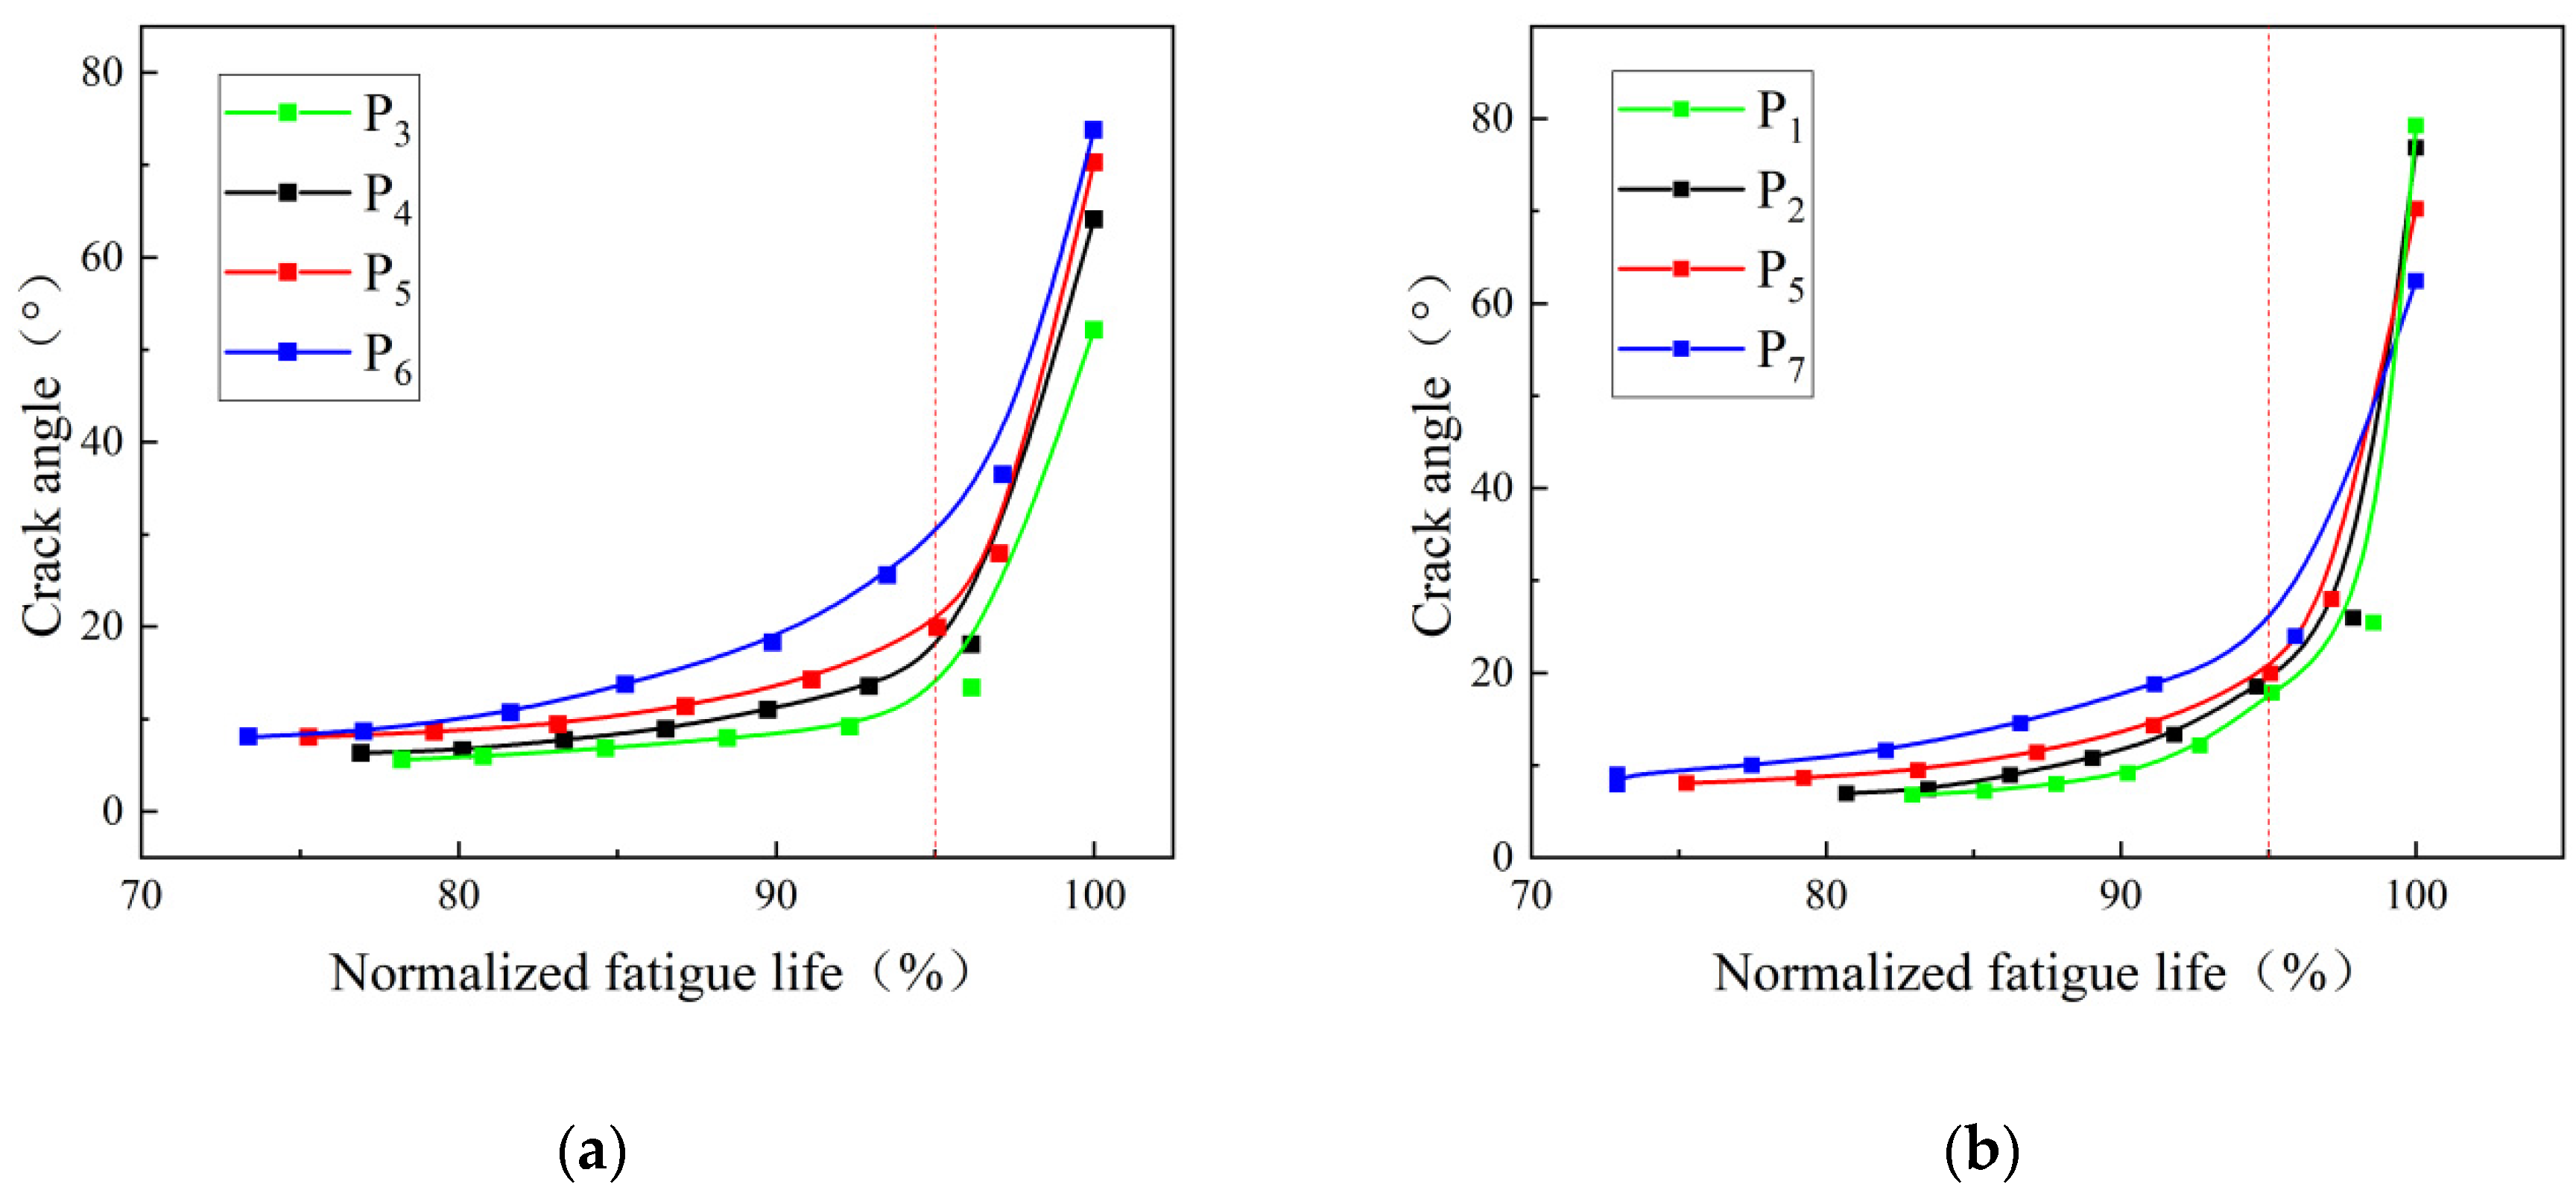
2.2.2. Prediction of Crack Propagation Life

The crack propagation life is defined as the number of load cycles from crack initiation to structural failure. The generalized Paris model is adopted to predict the crack propagation life, in which two parameters, namely fatigue coefficient C and fatigue index m, are used to represent the influence of the environment on crack propagation [24]. Although C and m can be computed by using experimental results, after referring to the fatigue coefficient and fatigue index of high-strength steel, C = 1 × 10⁻¹⁰ and m = 2.0 are used in this study. The prediction model is given as follows:
N p = a 1 a f 1 C K m d a ,
where a is crack length. The crack angle is used to represent the crack propagation process. a 1 is the initial angle during crack generation and a f is the final angle after specimen failure. K is the range of stress intensity factors, which is related to pit size and fatigue load. The expression of K is given below:
K = ( 2.2 K t σ π a / π ) ,
where K t is the stress concentration factor, and σ is the stress amplitude.
The crack propagation life of pitted corroded metal structures can be obtained by taking crack angles into the model, and the accuracy of prediction can be verified by comparing it to the experimental results.

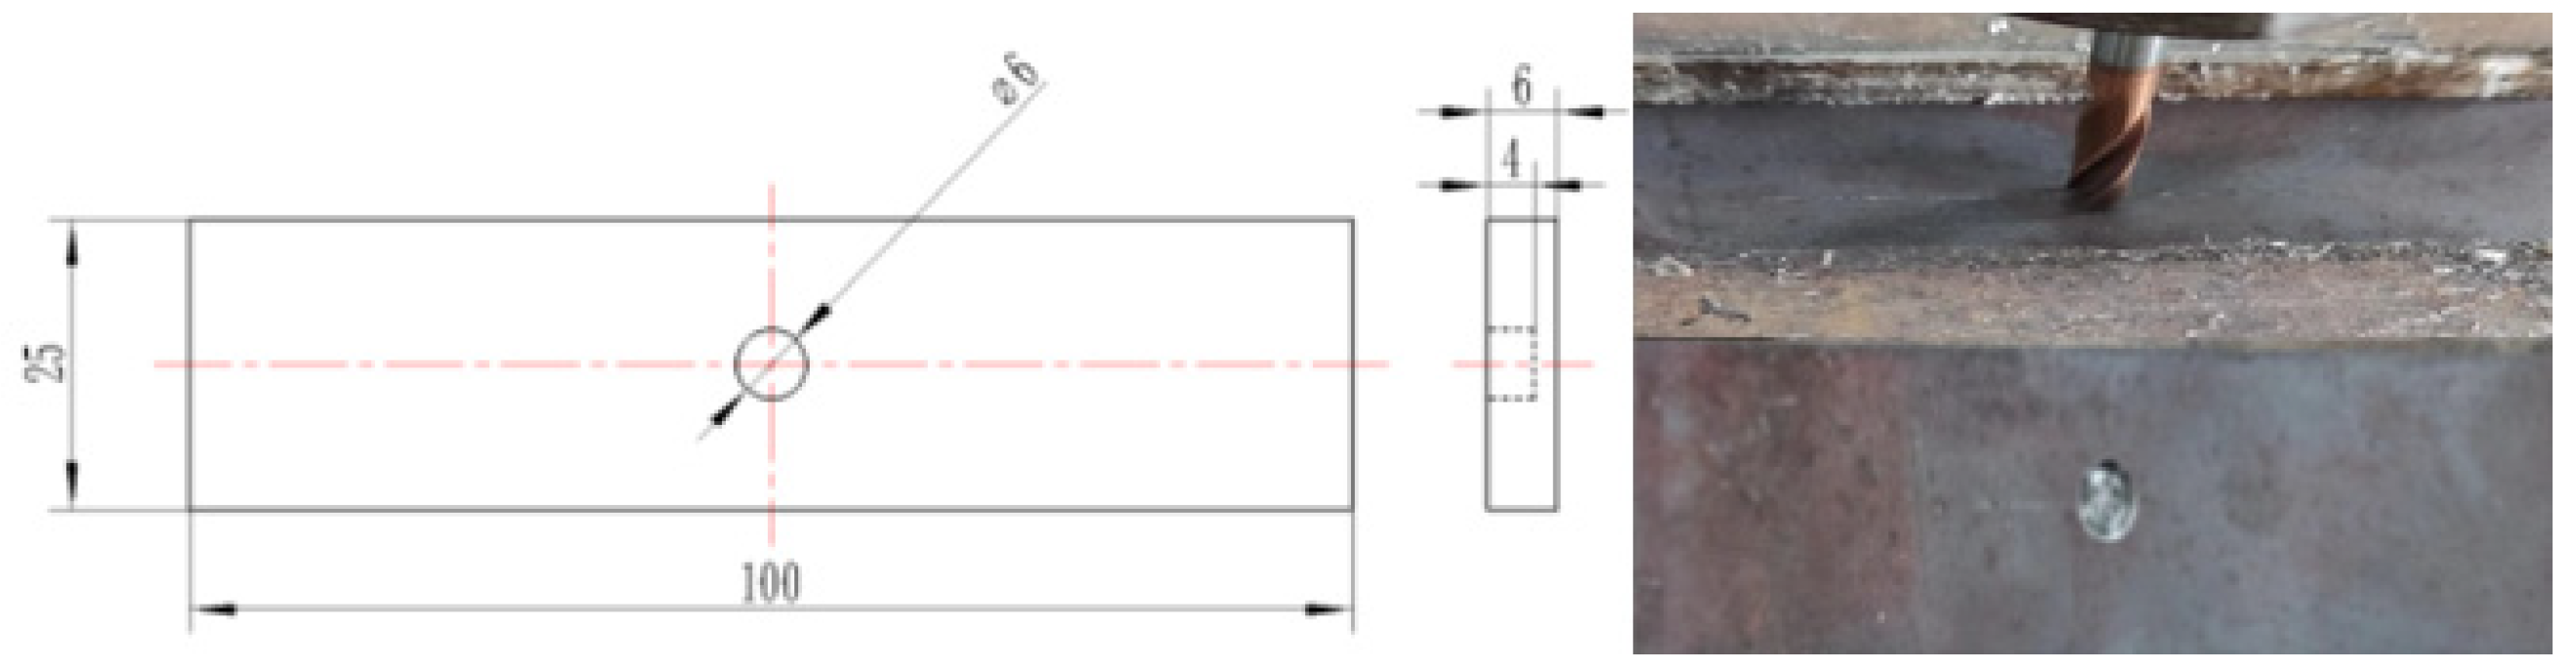
2.3. Materials and Specimens

The material used in the study is DH36 high-strength steel, and its chemical composition was obtained from the factory test report of the material. It is shown in Table 1.
According to GB/T 232-2010 [25], standard specimens are designed as plates. There are two approaches for producing pits through pre-corrosion treatment, namely electrochemical corrosion and mechanical processing. It has been reported that the shape of pits obtained by electrochemical etching is often arbitrary, leading to suboptimal outcomes. On the contrary, mechanical processing methods can bring high accuracy to cylindrical pits. Moreover, the shape of the corrosion spot has minimal impact on the mechanical properties of a component or structure, provided that the corrosion volume loss rate remains equivalent [26]. Therefore, the mechanical processing method is adopted to manufacture specimens with pitting corrosion. The volume loss rate V 0 can be defined in terms of the volume of the pitting hole and the volume of the specimen scale section. Figure 1 shows the design and machining process of a specimen.

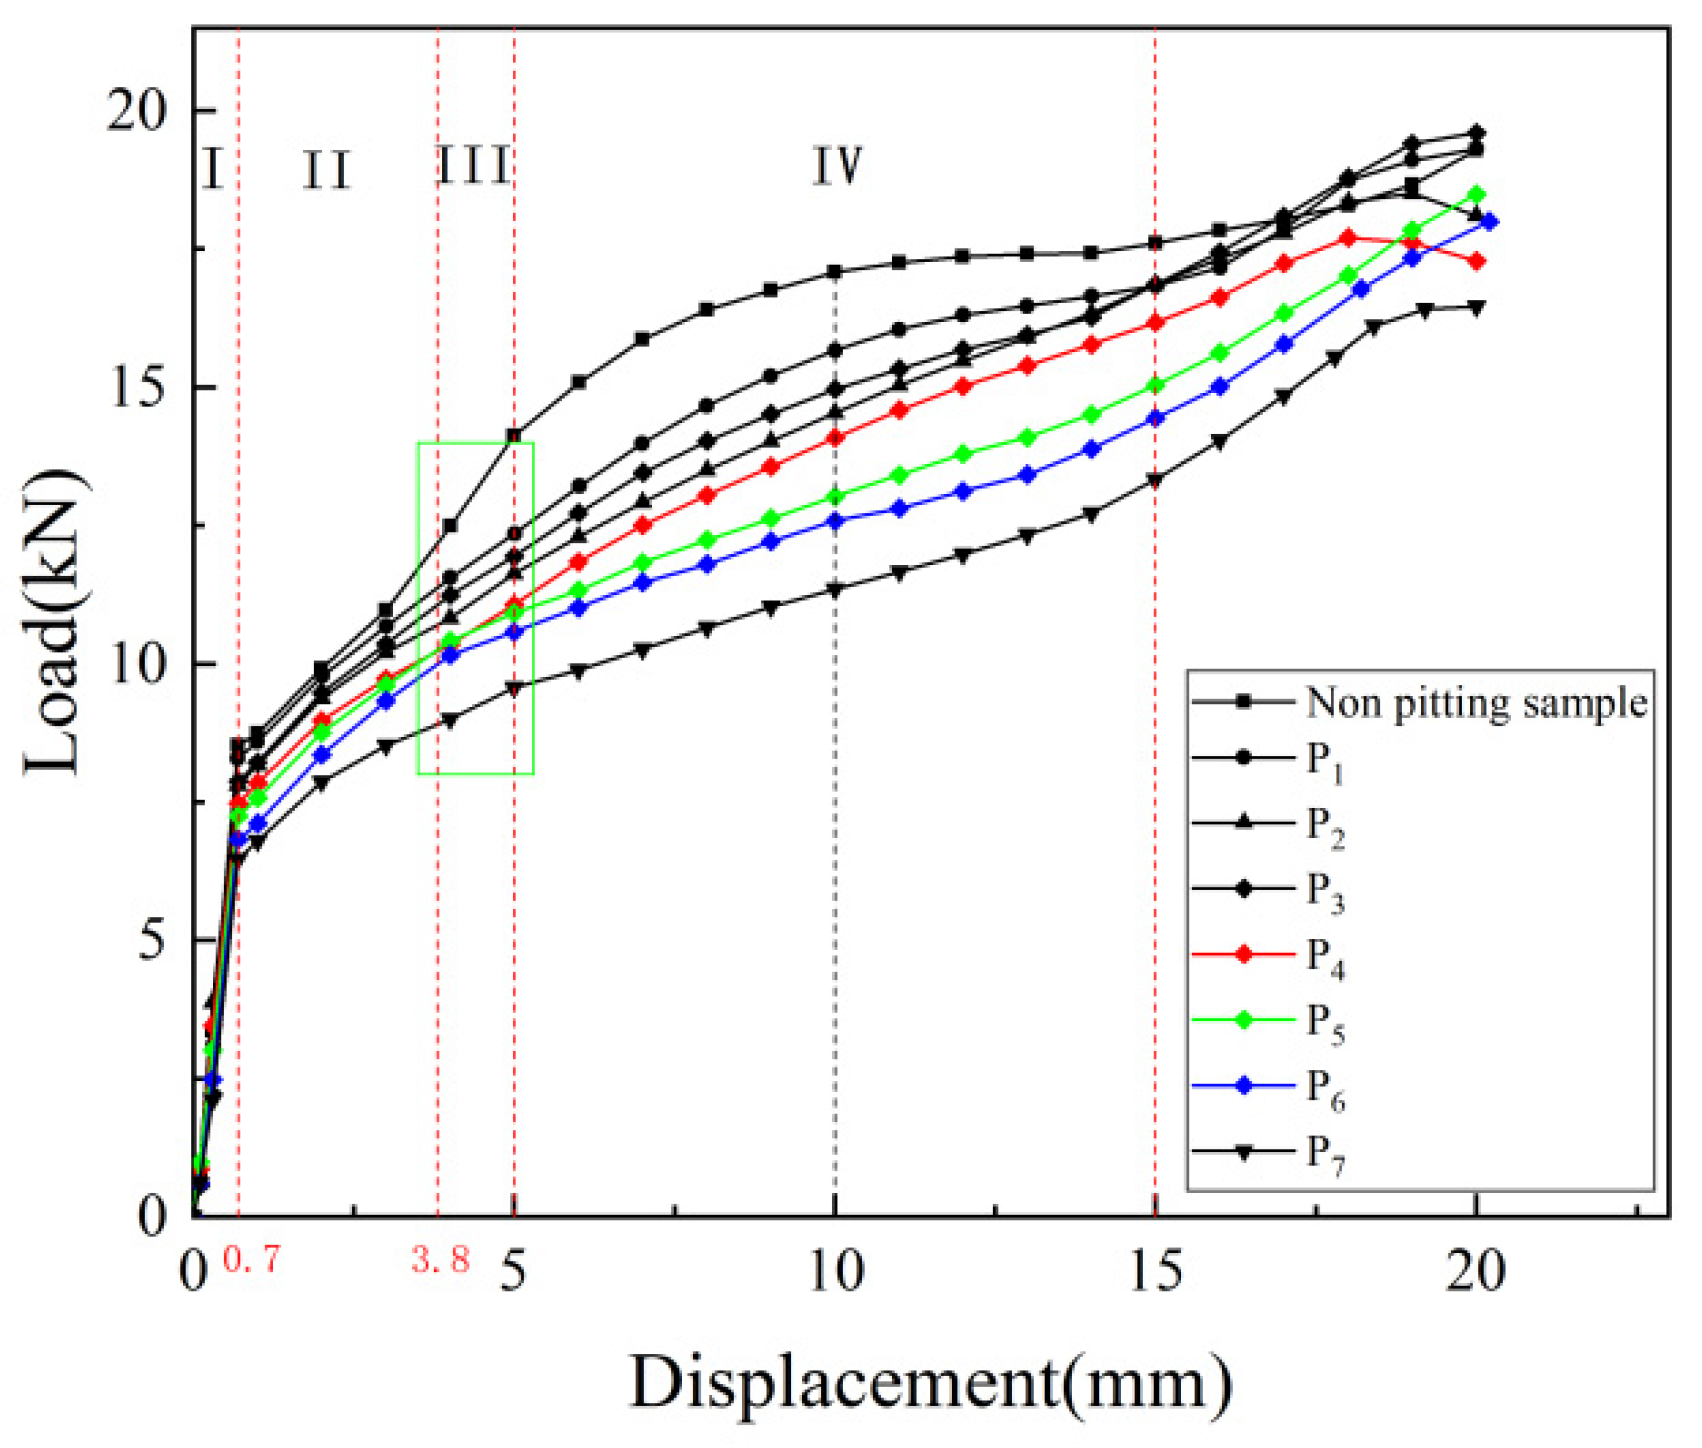
2.4. Three-Point Bending Static Test

Specimens with different pits were manufactured by machining. In order to simultaneously consider the effects of volume loss rate and diameter-to-depth ratio on the experimental results, it is necessary to design the depth and diameter of the pits as a difference in the presence of a certain gradient. This gradient should also be expressed in the volume loss rate and the diameter-to-depth ratio [27]. The details of the specimens are shown in Table 2.
Three-point bending static tests were carried out on an electronic universal testing machine, as shown in Figure 2. The loading speed is 1 mm/min, and the span of supports is 50 mm. The pitting hole is on the downside of the specimen, as shown in Figure 2b.

2.5. Three-Point Bending Fatigue Test

The three-point bending fatigue tests were carried out using the SD100 electro-hydraulic servo fatigue testing machine, shown in Figure 3. The supports had a span of 50 mm, loading frequency was 5 Hz, and stress ratio was 0.2. Referring to the fatigue test standard ASTM D7615 [28], loads of 70%, 80%, and 90% of static strength were applied in the fatigue test. The applied loads were defined as three different stress levels of 0.7, 0.8, and 0.9, respectively. Considering the high divergence of the fatigue test, each group of tests was repeated 5 times, and mean values were used as experimental results.

3. Results and Discussion

A discussion of the three-point bending static test data provides relevant results.
Each type of specimen was conducted five times, and averaged values were used to fit a curve. A load–displacement curve was obtained and shown in Figure 4. Due to the influence of pitting holes, the load–displacement curves can be divided into four stages for the sake of analysis and discussion. In the graph the curve is divided into four parts by red dashed lines.
Stage I: The displacement falls in the range of 0.0–0.7 mm, and the test is in its initial loading stage. During this stage, the specimen does not show any apparent deformation, and the load–displacement curves are increased linearly.
Stage II: The displacement falls in the range of 0.7–3.8 mm, and the specimen begins to deform with the increase in load. The load–displacement curves are still linearly increasing, but their slopes decrease a lot when compared to the first stage.
Stage III: The displacement falls in the range of 3.8–5.0 mm, and the slope of the load–displacement curve of the pitting-free specimen shows a sudden increase, as shown in the green dotted box in Figure 3, which may be due to the tensile strengthening occurred in the materials on the tensile side of the specimen. On the other hand, the load–displacement curves of pitted corroded specimens are nearly unchanged because of the appearance of pitting holes.
Stage IV: The displacement falls in the range of 5.0–15.0 mm, and the tensile strengthening effect has the greatest influence on the mechanical performance of the specimen. When displacement reaches 10.0 mm, the difference among load–displacement curves is the largest. After that, the changes in the load–displacement curves tend to be consistent.
Based on the analysis above, the displacement of 10.0 mm is regarded as the failure point of the specimen in the subsequent fatigue test. Thus, the corresponding load is defined as the failure load of the specimen. The failure loads of specimens with different pitting holes are obtained via the three-point bending static test and given in Table 3.
From the point of view of fatigue damage, this study focuses on the relationship between the generation and propagation of cracks and the number of load cycles under the influence of pitting corrosion, and then the prediction of fatigue life. As shown in Figure 5, during the loading process, materials under the neutral plane of the specimen bear a tensile load, and those above the neutral plane carry a compressive load. Cracks always appear in the tensile region, generate at the bottom edge of the pitting hole, and simultaneously evolve along the wall of the pitting hole and the bottom surface of the specimen until the failure of the specimen. So, in the process of crack initiation and propagation, crack length is not a suitable variable that can be used to establish the relationship between the crack and the mechanical performance of the specimen.
However, based on the observation of the failure process of the specimen, it is clear that the crack opening angle continuously increases after the crack initiation, as shown in Figure 6. Thus, the crack angle is chosen as an indicator for measuring the level of fatigue damage in this study.
It is difficult to accurately capture the number of load cycles N when a crack is generated during an actual test. As an alternative, N is defined as follows:
N = 0.5(N1 + N2),
where N 1 is the maximum number of load cycles when the crack is not observed on the specimen, and N 2 is the number of load cycles when the crack is first observed during the test. So, the accuracy of N absolutely depends on the time interval of observation during the fatigue test. However, considering the divergence of fatigue tests, the error caused by the observation interval is always acceptable.
A discussion of the three-point bending fatigue test data provides relevant results.
The results of three-point bending fatigue tests are shown in Table 4, where the subscript i in Pi–j is the same type of specimen as that shown in Table 2 and Table 3, i = 1, 2, … 7, j denotes the stress level, and where j = 1 corresponds to 0.7, j = 2 to 0.8, and j = 3 to 0.9. In addition, specimens are regarded as failures when the loading displacement reaches 10 mm, as explained above.
The relationships between fatigue life and volume loss rate V0 at different stress levels are shown in Figure 7. With the increase in V0, the fatigue life of the specimen decreases monotonically and significantly. When V0 is 2.68%, the fatigue life of the specimen decreases by more than 50%. It can be concluded that a small increase in the volume loss rate results in a substantial reduction in fatigue life. This experimental result proves that the value of the volume loss rate has a great influence on the fatigue life.
The changes in crack angle were recorded by a high-resolution camera after the first observation of a crack, and a photo was taken every 500 load cycles. The crack angles were measured by image processing software, and the changes in crack angles at 0.8 stress level are shown in Table 5. It can be seen that with the increase in load cycles, the crack angles increase.

3.1. Validation of Equivalent Surface Defect Model

Parameter regression analysis was adopted to validate the proposed equivalent surface defect model. The main steps are as follows: (1) bring one of the three sets of experimental data into the equivalent surface defect model expression to obtain the model parameters. (2) Verify the reliability of the equivalent surface defect model with the remaining two sets of the three sets of experimental data. (3) Further determine the feasibility of the model through the Bayesian approach. Firstly, substitute the results of Pi−2 in Table 4 and related parameters in Table 2 into Equation (1), and the following equation is obtained:
[lna0]T = Σ[A B C]T,
where
[lna0]T = [−17.66 − 17.24 − 16.93 − 16.76 − 16.53 − 16.41 − 15.84],
The coefficient matrix is as follows:
Σ = 0.168 0.67 0.754 1.131 1.508 1.885 2.681 2 1 0.333 0.5 0.667 0.833 0.5 1 1 1 1 1 1 1
The parameter matrix of the model is then given as follows:
[A B C]T = [0.598 − 0.229 − 17.331]
So, the proposed equivalent surface defect model is obtained:
lna0 = 0.598V0 − 0.229(h/d) − 17.331,
In order to verify the proposed method, any set of experimental results can theoretically be used for verification. However, it is well known that different sizes of data sets and components will result in different values of model parameters. Uncertainties between different specimens and tests arise for a variety of reasons, such as variability in tests and test procedures, which affect the validation result. The uncertainty of model parameters can be fully evaluated and quantified by the Bayesian method [29]. To understand the influence of volume loss rate and size of the pitting hole on the equivalent surface defect model, a new regression model is introduced based on the Bayesian method:
lna0 = AV0 + B(h/d) + C(h/d)V0 + D,
Using the same calculation process as mentioned above, the following equation is obtained:
lna0 = 0.653V0 0.203 (h/d) 0.088(h/d)V0 17.349,
The computed a 0 is compared with the regression analysis value, and the relationship between them is shown in Figure 8. It can be seen that the calculated a 0 is in good agreement with the regression analysis one. The validation results show that the equivalent surface defect model can measure the influence of the notch effect and size effect on the fatigue life of structural members well. The equivalent surface defect size can be applied to the fatigue life prediction model.

3.2. Validation of Fatigue Life Prediction Model

3.2.1. Life Crack Initiation Life Ni

To verify the prediction of crack initiation life, Pi−1 and Pi−3 are used. The verification process includes the following steps: first, the equivalent surface defect model is obtained by using Equation (1) and a 0 is obtained under the condition of given V0 and (h/d). Parameters are then substituted to Equations (3)–(6) to calculate the crack initiation life. The specific values of all practical significance parameters in Equations (3)–(6) have been given. By bringing the test data into the formula and connecting the equations, the fatigue crack emergence life can be solved. Results are shown in Table 6. It can be seen that the average relative error is 10.37%. The maximum relative error of Pi−1 is 15.91%, and that of Pi−3 is 21.84%.
Figure 9 shows the predicted crack initiation life versus the experimental results. In the figure, the test results at 0.7 stress level and 0.9 stress level refer to the test results at 70% and 90% static loading conditions for fatigue loading, respectively. Without loss of generality, the correlation lines with a scattering limit factor of 1.3 are used to evaluate the performance of the prediction of crack initiation life [30]. It can be seen that all the correlation points fall within the correlation lines, which means a good prediction performance. The validation results show that the prediction results obtained from the fatigue life prediction model at the crack initiation stage are reliable and accurate.

3.2.2. Life Crack Initiation Life Np

Based on the measured crack propagation data, as shown in Table 5, the relationships between the crack angle and normalized fatigue life are shown in Figure 10. It can be seen that when the normalized fatigue life reaches 95%, the crack angle increases suddenly. The crack initiation life accounts for more than 70% of the fatigue life. In addition, fatigue cracks often first appear on the bottom edge of the pitting hole in this study and gradually evolve mainly along the wall of pits toward the bottom in the axial direction, as shown in Figure 11. At this period, crack angles remain almost constant, and specimens do not show any failure phenomenon. After the crack reaches the bottom of the pit, it begins to evolve transversely, and the crack angle begins to increase rapidly.
Therefore, the final crack angle is defined as the angle when normalized fatigue life reaches 95%. The proposed model for crack propagation life is verified by using the data given in Table 5. The calculated fatigue life values can be obtained by substituting the crack initiation angle a 1 and crack extension angle a f of each specimen in Table 5 into the crack extension stage Expression (7) of the fatigue life prediction model. The calculated crack extension fatigue life values are compared with the experimental values. Results are shown in Table 7. It can be seen that the average relative error is 15.13%, and the maximum relative error is 22.16%.
Figure 12 shows the predicted fatigue life versus the actual fatigue life. Without loss of generality, correlation lines with a scattering limit factor of 1.2 are used to evaluate the prediction performance of crack propagation life. It can be seen that almost all the correlation points are within the correlation lines, which indicates a good prediction performance. The validation results show that the prediction results obtained from the fatigue life prediction model at the crack extension stage are reliable and accurate.

4. Conclusions

Considering the influence of notch effect and size effect on the fatigue life of specimens subjected to a three-point bending load, an equivalent surface defect model related to the volume loss rate and the depth-to-diameter ratio of the pitting hole is proposed, and the model is utilized to define the pitting hole notch as the equivalent surface defect size. The fatigue life of pit corrosion specimens subjected to three-point bending loads was predicted using fracture mechanics theory. The prediction consists of two stages: crack initiation and extension. In the crack initiation stage, the equivalent surface defect size was introduced into the prediction model in order to quantify the effect of pitting corrosion hole defects on the fatigue life at this stage. During the crack extension stage, a Paris model with crack angle as a variable was utilized to predict fatigue life. The model is verified by experimental results, and some findings are shown:
(1)
The variation of volume loss rate has a significant effect on fatigue life. A small increment in the volume loss rate can reduce the fatigue life substantially. Under the same stress level, the three-point bending fatigue life of DH36 steel decreases with the increase in volume loss rate. When the volume loss rate reaches 2.68%, the fatigue life decreases by more than 50%.
(2)
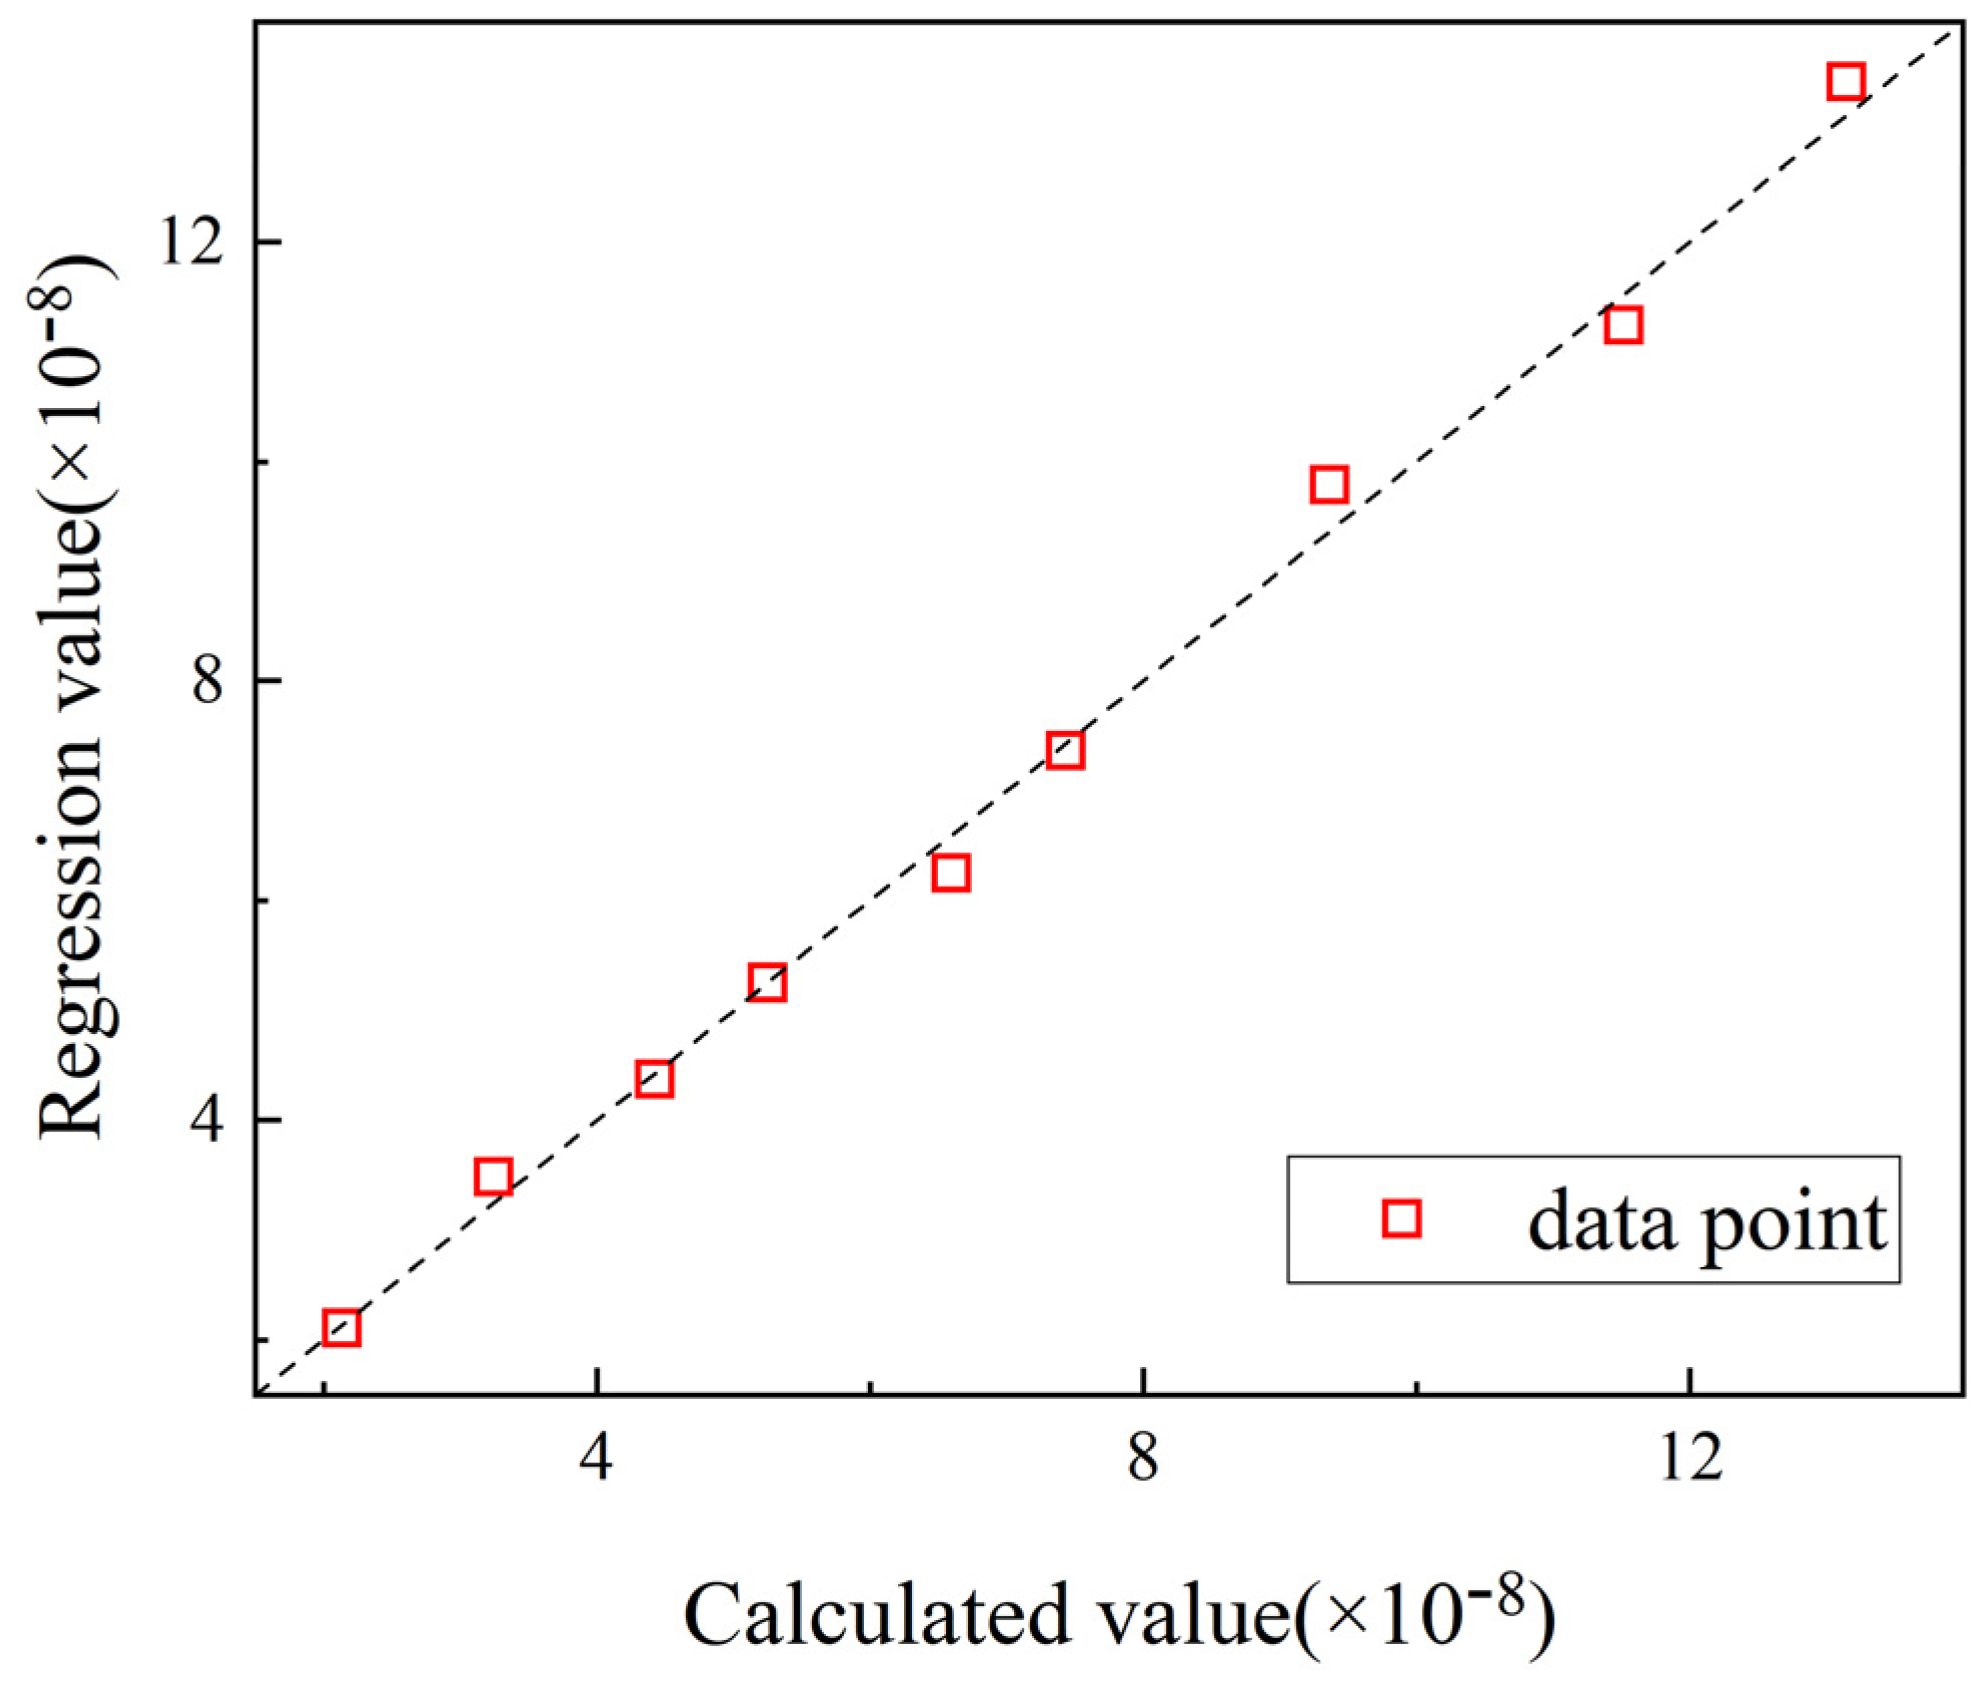
The influence of the pitting hole notch effect and size effect on fatigue life was quantified by volume loss rate and the pitting depth-to-diameter ratio, and an equivalent surface defect model was proposed. The model was validated using the Bayesian method, and the results were in good agreement that the equivalent surface defect model can be used to measure the influence of the notch effect and size effect on fatigue life.
(3)
Based on energy theory and slip band dislocation theory, an equivalent surface defect model is combined to predict crack initiation life. Compared with the experimental results, the average relative error is 10.37%, and the maximum relative errors are 15.91% and 21.84%, respectively. The reliability of the fatigue life prediction model at the crack initiation stage is verified.
(4)
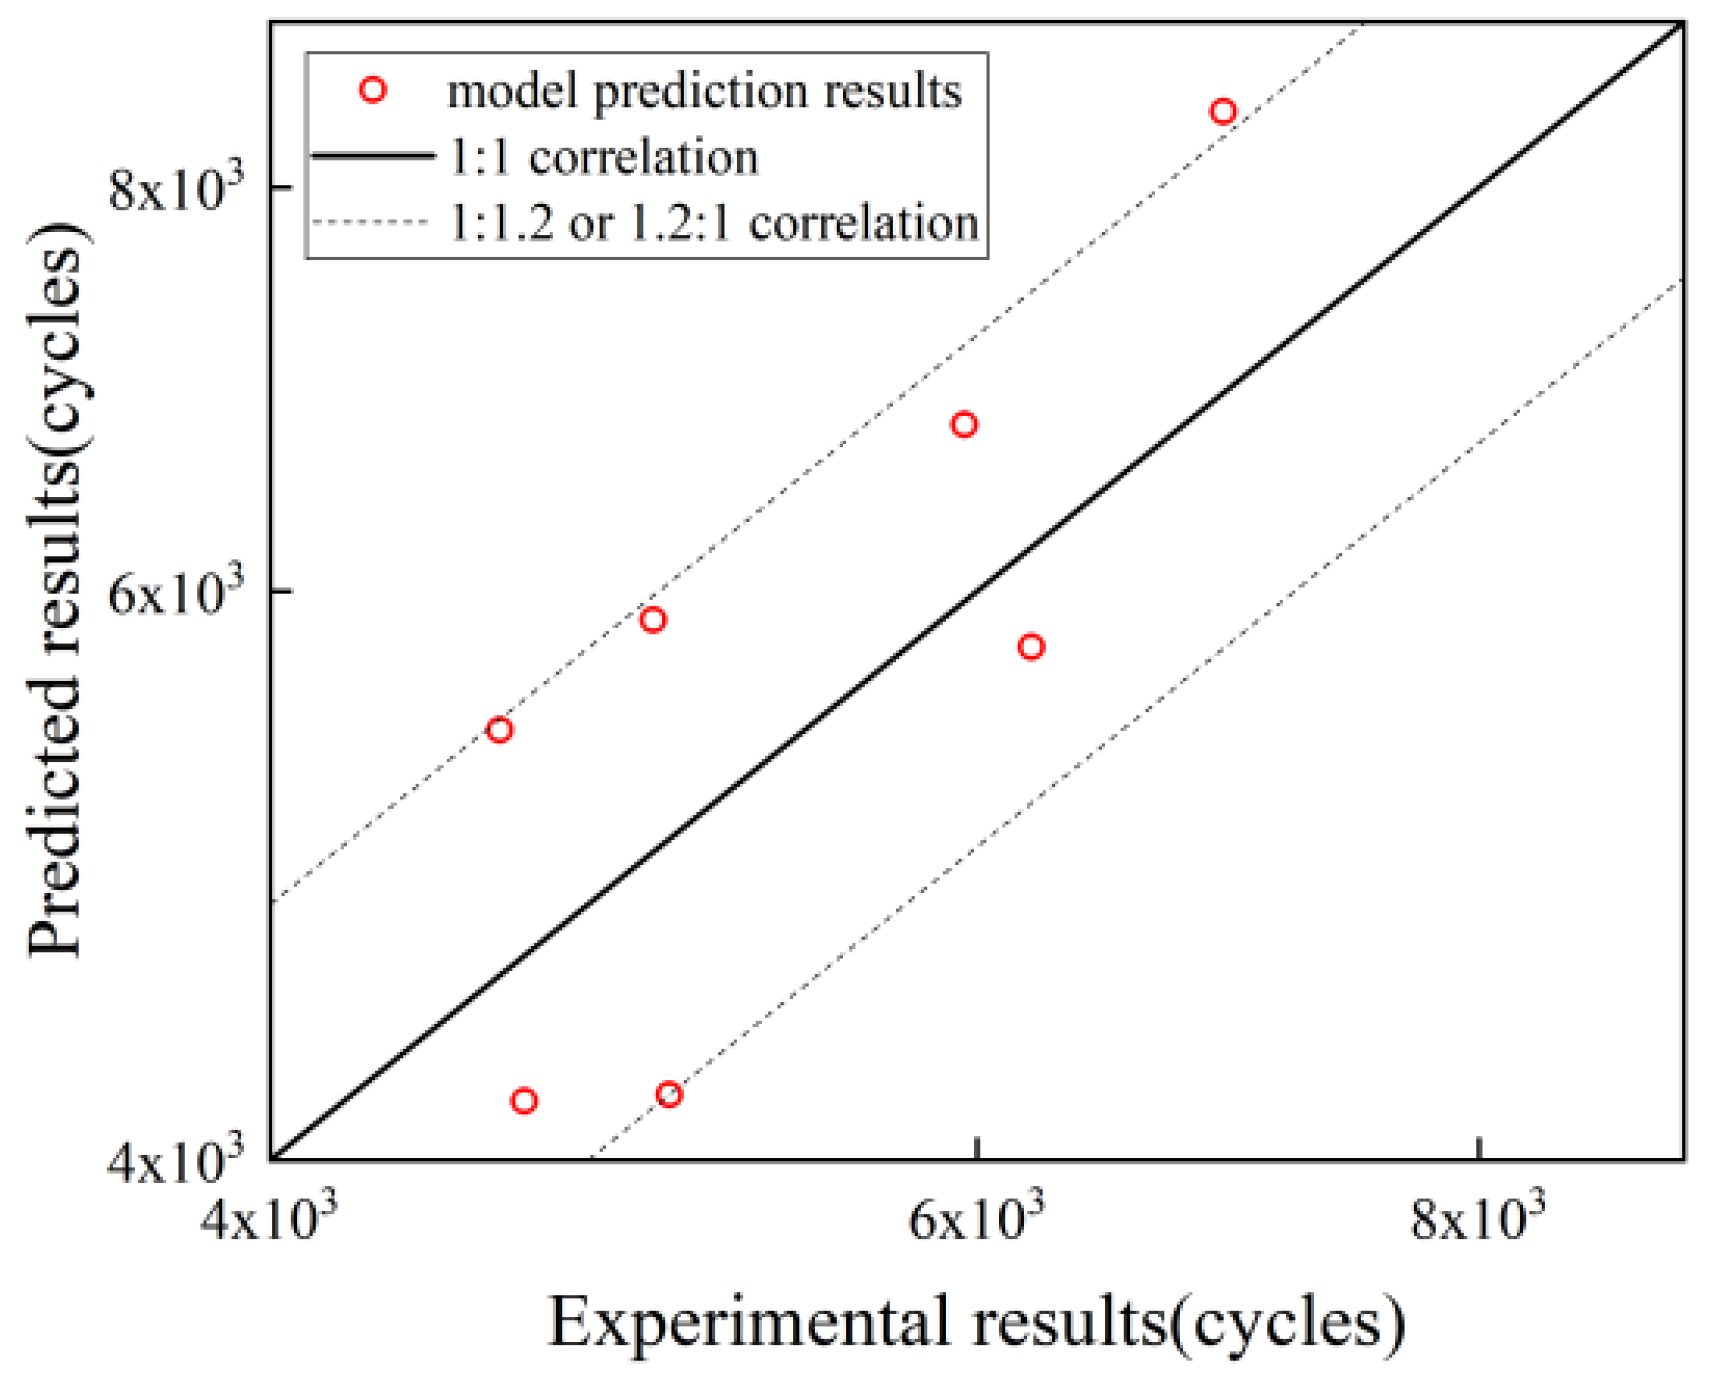
Based on the Paris fatigue life prediction model, the crack propagation life is predicted, where the crack angle is adopted as a variable. Compared with the experimental results, the average error is 15.13%, and the maximum relative error is 22.16%. The reliability of the fatigue life prediction model in the crack extension stage is verified.

Author Contributions

Conceptualization, X.L. and B.Y.; methodology, X.L.; software, X.L. and B.Y.; validation, X.L. and B.Y.; formal analysis, X.L. and B.Y.; investigation, X.L. and B.Y.; resources, X.L. and H.S.; data curation, B.Y.; writing—original draft preparation, B.Y.; writing—review and editing, X.L. and H.S.; supervision, X.L. and H.S.; project administration, X.L. and H.S.; funding acquisition, H.S. All authors have read and agreed to the published version of the manuscript.

Funding

This research was funded by the Open Project Program of Shandong Marine Aerospace Equipment Technological Innovation Center, Ludong University (Grant No. MAETIC2021-04), and the project ZR2022ME137 supported by Shandong Provincial Natural Science Foundation.

Data Availability Statement

Not applicable.

Conflicts of Interest

The authors declare no conflict of interest.

References

  1. Hu, Y.; Wu, S.; Withers, P.J.; Cao, H.; Chen, P.; Zhang, Y. Corrosion fatigue lifetime assessment of high-speed railway axle EA4T steel with artificial scratch. Eng. Fract. Mech. 2021, 245, 107588. [Google Scholar] [CrossRef]
  2. Katona, R.; Karasz, E.; Schaller, R. A Review of the Governing Factors in Pit-to-Crack Transitions of Metallic Structures. Corrosion 2022, 79, 72–96. [Google Scholar] [CrossRef] [PubMed]
  3. Seiler, M.; Linse, T.; Hantschke, P.; Kästner, M. An efficient phase-field model for fatigue fracture in ductile materials. Eng. Fract. Mech. 2020, 224, 106807. [Google Scholar] [CrossRef]
  4. Chamos, A.N.; Pantelakis, S.G.; Spiliadis, V. Fatigue behaviour of bare and pre-corroded magnesium alloy AZ31. Mater. Des. 2019, 31, 4130–4137. [Google Scholar] [CrossRef]
  5. Ma, Y.; Guo, Z.; Wang, L.; Zhang, J. Probabilistic Life Prediction for Reinforced Concrete Structures Subjected to Seasonal Corrosion-Fatigue Damage. J. Struct. Eng. 2020, 146, 04020117. [Google Scholar] [CrossRef]
  6. Zhixin, Z.; Xun, X.; Weiping, H.; Qingchun, M. Fatigue life prediction of aluminum alloy with pre-corrosion damage based on damage mechanics. J. Beijing Univ. Aeronaut. Astronaut. 2021, 47, 2434–2441. [Google Scholar]
  7. Huihui, X.; Ni, A.; Shengchuan, W.; Zhao, L.; Zhao, S.; Wei, W.; Zhiyong, L.; Guozheng, K. Research progress on prediction models for corrosion fatigue life of metal structural materials. Acta Mech. Solid Sin. 2023, 44, 1–33. [Google Scholar]
  8. Hajjioui, E.A.; Bouchaâla, K.; Faqir, M.; Essadiqi, E. A review of manufacturing processes, mechanical properties and precipitations for aluminum lithium alloys used in aeronautic applications. Heliyon 2022, 9, e12565. [Google Scholar] [CrossRef]
  9. Jiradilok, P.; Wang, Y.; Nagai, K.; Matsumoto, K. Development of discrete meso-scale bond model for corrosion damage at steel-concrete interface based on tests with/without concrete damage. Constr. Build. Mater. 2020, 236, 117615. [Google Scholar] [CrossRef]
  10. Fernandez, I.; Bairán, J.M.; Marí, A.R. Mechanical model to evaluate steel reinforcement corrosion effects on σ–ε and fatigue curves. Experimental calibration and validation. Eng. Struct. 2016, 118, 320–333. [Google Scholar] [CrossRef]
  11. Xu, L.; Yu, X.; Li, H.; Zhou, S. Fatigue life prediction of aviation aluminium alloy based on quantitative pre-corrosion damage analysis. Trans. Nonferrous Met. Soc. China 2017, 27, 1353–1362. [Google Scholar] [CrossRef]
  12. Rocha, M.; Brühwiler, E.; Nussbaumer, A. Microstructural influence on the scatter in the fatigue life of steel reinforcement bars. Int. J. Fatigue 2015, 75, 205–212. [Google Scholar] [CrossRef]
  13. Cao, W.; Wang, Y.; Zhou, P.; Yang, X.; Wang, K.; Pang, B.; Chi, R.; Su, Z. Microstructural material characterization of hypervelocity-impact-induced pitting damage. Int. J. Mech. Sci. 2019, 163, 105097. [Google Scholar] [CrossRef]
  14. Wang, R.; Liu, H.; Hu, D.; Li, D.; Mao, J. Evaluation of notch size effect on LCF life of TA19 specimens based on the stress gradient modified critical distance method. Fatigue Fract. Eng. Mater. Struct. 2018, 41, 1794–1809. [Google Scholar] [CrossRef]
  15. Liao, D.; Zhu, S.; Correia, J.A.F.O.; De Jesus, A.M.P.; Berto, F. Recent advances on notch effects in metal fatigue: A review. Fatigue Fract. Eng. Mater. Struct. 2020, 43, 637–659. [Google Scholar] [CrossRef]
  16. Ai, Y.; Zhu, S.; Liao, D.; José, A.F.O. Correia; Jesus; Behrooz Keshtegar. Probabilistic modelling of notch fatigue and size effect of components using highly stressed volume approach. Int. J. Fatigue 2019, 127, 110–119. [Google Scholar] [CrossRef]
  17. Arooran, S.; Jayantha, K. An advanced experimental investigation of size effect on flexural fatigue behaviour of cement-bound granular materials. Int. J. Pavement Eng. 2022, 1–20. [Google Scholar] [CrossRef]
  18. Pegues, J.; Roach, M.; Scott Williamson, R.; Shamsaei, N. Surface roughness effects on the fatigue strength of additively manufactured Ti-6Al-4V. Int. J. Fatigue 2018, 116, 543–552. [Google Scholar] [CrossRef]
  19. Wang, J.; Zhang, Y.; Sun, Q.; Liu, S.; Shi, B.; Lu, H. Giga-fatigue life prediction of FV520B-I with surface roughness. Mater. Des. 2016, 89, 1028–1034. [Google Scholar] [CrossRef]
  20. Alves, A.S.F.; Sampayo, L.M.C.M.V.; Correia, J.A.F.O.; De Jesus, A.M.P.; Moreira, P.M.G.P.; Tavares, P.J.S. Fatigue Life Prediction Based on Crack Growth Analysis Using an Equivalent Initial Flaw Size Model: Application to a Notched Geometry. Procedia Eng. 2015, 114, 730–737. [Google Scholar] [CrossRef]
  21. Tanaka, K.; Mura, T. A Dislocation Model for Fatigue Crack Initiation. J. Appl. Mech. 1981, 48, 97–103. [Google Scholar] [CrossRef]
  22. Tanaka, K.; Mura, T. A theory of fatigue crack initiation at inclusions. Metall. Trans. A 1982, 13, 117–123. [Google Scholar] [CrossRef]
  23. Sobieck, T.; Atadero, R.A.; Mahmoud, H.N. Fatigue Crack Propagation of Notched Steel Rebar in RC Beams Repaired with Externally Bonded CFRP. J. Compos. Constr. 2015, 19, 04014076. [Google Scholar] [CrossRef]
  24. Li, H.; Zhang, J.; Wu, S.; Zhang, H.; Fu, Y. Corrosion fatigue mechanism and life prediction of railway axle EA4T steel exposed to artificial rainwater. Eng. Fail. Anal. 2022, 138, 106319. [Google Scholar] [CrossRef]
  25. GB/T 232-2010; Bending Test Methods for Metallic Materials. Wang Ping, Liu Weiping, Dong Li, Ren Dandan, Gao Yifei; Standardization Administration of China: Beijing, China, 2010.
  26. Zhang, Q.; Yang, H.; Zeng, H.; Liu, K.; Huang, Y. Ultimate strength assessment of hull structural plates with general corrosion based on fractal theory. Ocean Eng. 2022, 245, 110417. [Google Scholar]
  27. Haghdadi, N.; Laleh, M.; Moyle, M.; Primig, S. Additive manufacturing of steels: A review of achievements and challenges. J. Mater. Sci. 2020, 56, 64–107. [Google Scholar] [CrossRef]
  28. D7615/D7615M−23; Standard Practice for Open-Hole Fatigue Response of Polymer Matrix Composite Laminates. Subcommittee D30.05 on Structural Test Methods; ASTM: West Conshohocken, PA, USA, 2023.
  29. Yang, J.; He, J.; Guan, X.; Wang, D.; Chen, H.; Zhang, W.; Liu, Y. A probabilistic crack size quantification method using in-situ Lamb wave test and Bayesian updating. Mech. Syst. Signal Process. 2016, 78, 118–133. [Google Scholar] [CrossRef]
  30. Liu, S.; Shin, Y.C. Additive manufacturing of Ti6Al4V alloy: A review. Mater. Des. 2019, 164, 107552. [Google Scholar] [CrossRef]
Figure 1. Design and machining of a pitting specimen (units: mm).
Metals 13 01839 g001
Figure 2. Three-point bending static test. (a) Electronic universal testing machine. (b) Static three-point bending. (c) Pitting hole deformation.
Metals 13 01839 g002
Figure 3. Three-point bending fatigue test. (a) Electronic hydraulic servo fatigue machine. (b) Three-point bending fatigue test. (c) Crack.
Metals 13 01839 g003
Figure 4. Load displacement curve of three-point bending static test.
Metals 13 01839 g004
Figure 5. Schematic diagram of crack initiation.
Metals 13 01839 g005
Figure 6. Crack initialization and propagation.
Metals 13 01839 g006
Figure 7. Relationship between fatigue life and volume loss rate under three stress levels.
Metals 13 01839 g007
Figure 8. Comparison of calculated values and regression values.
Metals 13 01839 g008
Figure 9. Comparison between predicted crack initiation life and experimental data.
Metals 13 01839 g009
Figure 10. (a) Relationship between crack angle and normalized fatigue life for specimens with different hole depths. (b) Relationship between crack angle and normalized fatigue life for specimens with different hole diameters.
Metals 13 01839 g010
Figure 11. (a) Crack propagation. (b) Crack reaching the bottom of the pit.
Metals 13 01839 g011
Figure 12. Comparison between predicted crack propagation life and experimental data.
Metals 13 01839 g012
Table 1. Chemical composition of DH36 (wt%).
Element%Element%Element%
C0.14Als0.039Ceq0.36
Si0.21Nb0.012Mo0.007
Mn1.19Cr0.05V0.003
S0.003Ni0.02Ti0.011
P0.014Cu0.05
Table 2. Specimens for three-point bending static tests.
Specimen IndexPitting Hole
Diameter d (mm)Depth h (mm) V 0 (%)
P 0 000
P 1 240.168
P 2 440.670
P 3 620.754
P 4 631.131
P 5 641.508
P 6 651.885
P 7 842.681
Table 3. Failure loads of pitted corroded specimens.
Specimen P 0 P 1 P 2 P 3
Load (kN)17.115.514.215.0
P 4 P 5 P 6 P 7
Load (kN)14.013.012.611.5
Table 4. Results of fatigue tests.
Specimen IndexMaximum Load (kN)Fatigue Life N (Cycle)Crack Initiation Life (Cycle)
P 1 1 10.991,03568,276
P 1 2 12.441,21834,072
P 1 3 14.025,29120,175
P 2 1 9.977,02158,536
P 2 2 11.435,98729,116
P 2 3 12.819,21115,177
P 3 1 10.579,19662,565
P 3 2 12.038,40131,265
P 3 3 13.521,13216,694
P 4 1 9.868,78153,649
P 4 2 11.231,02524,197
P 4 3 12.616,44512,745
P 5 1 9.168,21852,528
P 5 2 10.425,16919,124
P 5 3 11.713,97810,484
P 6 1 8.859,00543,075
P 6 2 10.119,25614,311
P 6 3 11.312,3918922
P 7 1 8.143,83631,225
P 7 2 9.220,12515,036
P 7 3 10.410,0187013
Table 5. Changes in crack angles.
Specimen No.Observation TimesExtension Angle (°)Life Percentage (%)
P 1 2 16.7782.9
27.2185.4
37.9887.8
49.1590.2
512.1192.7
617.8295.1
725.4198.6
879.23100
P 2 2 16.9680.7
27.3883.5
38.9186.3
410.7789.0
513.3291.8
618.4994.6
725.9397.9
876.83100
P 3 2 15.5978.2
25.9880.8
36.8184.6
47.9388.5
59.1592.3
613.3896.2
752.12100
P 4 2 16.3476.9
26.6580.1
37.7583.3
48.9186.5
511.0189.7
613.5592.9
718.1196.1
864.10100
P 5 2 18.0475.3
28.6179.2
39.4583.1
411.3787.1
514.2991.1
619.9295.1
727.9697.0
870.25100
P 6 2 18.0673.4
28.6477.0
310.7081.6
413.7485.3
518.2789.9
625.5493.5
736.4597.1
873.78100
P 7 2 18.9972.9
29.9877.5
311.5582.0
414.5286.6
518.7491.1
623.9395.9
762.44100
Table 6. Comparison of experimental results and predicted crack initiation life.
Specimen a 0
(×10−8)
Predicted Results (Cycles)Experimental Results (Cycles)Relative Error (%)
P 1 1 1.72476,39868,27611.90
P 2 1 2.84264,16058,5369.61
P 3 1 3.44867,38862,5657.71
P 4 1 4.09952,44353,6492.25
P 5 1 4.87854,19552,5283.17
P 6 1 5.81636,19243,07515.91
P 7 1 9.75434,40331,22510.18
P 1 3 1.72424,34720,17521.84
P 2 3 2.84213,69315,1779.76
P 3 3 3.44813,96816,69416.33
P 4 3 4.09911,51212,7459.67
P 5 3 4.87811,16210,4846.47
P 6 3 5.816853889224.3
P 7 3 9.7548144701316.13
Table 7. Comparison of experimental results and predicted crack propagation life.
SpecimenPredicted Results (Cycles)Experimental Results (Cycles)Relative Error (%)
P 1 2 4191502916.67
P 2 2 576661906.85
P 3 2 8443691222.16
P 4 2 6753595713.36
P 5 2 5878498317.96
P 6 2 5433456419.04
P 7 2 417146299.89
Disclaimer/Publisher’s Note: The statements, opinions and data contained in all publications are solely those of the individual author(s) and contributor(s) and not of MDPI and/or the editor(s). MDPI and/or the editor(s) disclaim responsibility for any injury to people or property resulting from any ideas, methods, instructions or products referred to in the content.

