Article

Electrochemical Noise Analysis Using Experimental Chaos Theory, Power Spectral Density and Hilbert–Huang Transform in Anodized Aluminum Alloys in Tartaric–Phosphoric–Sulfuric Acid Solutions

by
Cynthia Martínez-Ramos
1,
Javier Olguin-Coca
2,*,
Luis Daimir Lopez-Leon
2,
Citlalli Gaona-Tiburcio
1,
María Lara-Banda
1,
Erick Maldonado-Bandala
3,
Ivan Castañeda-Robles
2,
Jesús M. Jaquez-Muñoz
4,
Jose Cabral-Miramontes
1,
Demetrio Nieves-Mendoza
3 and
Facundo Almeraya-Calderón
1,*
1
Universidad Autónoma de Nuevo León, Centro de Investigación e Innovación en Ingeniería Aeronáutica, Faculty of Mechanical and Electrical Engineerin, San Nicolás de los Garza 66455, Mexico
2
Área Académica de Ingeniería y Arquitectura, Universidad Autónoma del Estado de Hidalgo, Carretera Pachuca-Tulancingo, Km 4.5, Hidalgo 42082, Mexico
3
Facultad de Ingeniería Civil, Universidad Veracruzana, Xalapa 91000, Mexico
4
Instituto de Ingeniería y Tecnología, Universidad Autónoma de Ciudad Juárez, Av. del Charro 450 Nte, Cd. Juárez 32310, Mexico
*
Authors to whom correspondence should be addressed.
Metals 2023, 13(11), 1850; https://doi.org/10.3390/met13111850
Submission received: 29 September 2023 / Revised: 24 October 2023 / Accepted: 26 October 2023 / Published: 4 November 2023
(This article belongs to the Section Corrosion and Protection)

Abstract

:
Aluminum and its alloys find widespread applications across diverse industries such as the automotive, construction, and aeronautics industries. When these alloys come into contact with ambient air, an Al2O3 thin oxide layer is naturally formed, typically measuring 2 to 4 nm and exhibiting remarkable hardness and protective qualities, rendering the alloys corrosion-resistant in specific atmospheric and chemical environments. This study aimed to characterize the electrochemical behaviors of anodized AA2024 and AA7075 alloys within a complex three-component electrolyte composed of tartaric–phosphoric–sulfuric acid (TPSA) solutions. The anodized specimens were subsequently exposed to 3.5 wt.% NaCl solution at room temperature, and their electrochemical performances were meticulously evaluated using an electrochemical noise (EN) analysis in accordance with ASTM G-199, respectively. In the EN, three methods of data analysis were used: the time domain analysis (chaos analysis: application of Lyapunov exponent and dimension correlation), the frequency domain analysis (power spectral density, PSD), and the time–frequency domains analysis (Hilbert–Huang transform, HHT). Scanning electron microscopy (SEM) was used to observe the morphologies of the anodized surfaces. The results indicated that the AA2024-0, AA2024-1, and AA2024-2 alloys and the AA7075-2 and AA7075-3 samples exhibited mixed corrosion according to the Lyapunov constant, with a notable inclination towards localized corrosion when analyzed using the PSD and HHT methods. The surface was not homogenous, and the corrosion process was predominately localized in specific zones.

1. Introduction

Corrosion corresponds to the breakdown of a metallic material after suffering from a chemical or electrochemical attack upon exposure to the environment, resulting in the deterioration of the material. During the corrosion process, the material seeks to return to a more natural or thermodynamically stable state by releasing metallic atoms from its structure [1,2].
In the aircraft industry, material advancement has been laser-focused on a trifecta of goals: maintaining a low density, prolonging component longevity, and curbing maintenance costs. Currently, aluminum alloys have taken center stage due to their commendable fatigue resistance, acceptable corrosion resistance, and notable specific stiffness, particularly in aerospace. As aviation technology has evolved, a gamut of novel aluminum alloys has emerged, each tailored to meet specific requisites. Among these alloys are AA2024 from the 2XXX series, with copper as its principal alloying element, and AA7075 from the 7XXX series, wherein zinc takes the spotlight as the primary alloying element [3,4,5,6].
Turning our attention to the 2XXX series alloys, they were ingeniously engineered to amplify strength and hardness by judiciously incorporating copper. This strategic addition serves to refine the grain size within the microstructure, curbing the excessive enlargement of grains. However, a notable trade-off accompanies this enhancement: including copper in the solid solution concurrently diminishes the corrosion resistance inherent in the 2XXX series alloys. In contrast, the 7XXX series alloys boldly claim the sweet spot between strength and fatigue resistance. This accomplishment is attributed to the amalgamation of copper and magnesium, complementing the presence of zinc. However, as with any equation, there is a counterbalancing factor; in this case, the amalgamation of elements leads to a reduction in the overall corrosion [7,8].
The AA7075 aluminum alloy commands its presence primarily in applications necessitating robust compressive strength, notably in fuselage construction, upper wing skin, and upper stringers. On the other hand, the 2024 aluminum alloy finds its purpose in regions subjected to tension, such as the fuselage and lower wing skin, as well as the ribs and spars [6,9]. Anodic oxidation, or just anodizing, focuses on the enhancement of corrosion resistance by growing a thick Al2O3 oxide layer on the surface of the aluminum alloy through an electrochemical process that induces electron exchange, with chromic and sulfuric acid baths being the most sought-after electrolytes [10].
The industry has been diligently striving to distance itself from using chromic acid baths, primarily driven by a collective awareness of their harmful impacts on the environment and human well-being [11]. In response, an ardent pursuit of alternatives has emerged. Two distinct categories of electrolyte bases have garnered attention as potential substitutes for Chromic Acid Anodizing (CAA). The first category revolves around phosphoric acid-based and alkaline electrolytes, which exhibit heightened adhesion properties while concurrently presenting lackluster performance in corrosion protection. The second category harnesses sulfuric acid-based electrolytes, which confer commendable corrosion protection albeit at the cost of reduced adhesion attributes [7].
Incorporating tartaric acid into the sulfuric acid anodizing (TSA) process has garnered notable attention in surface treatment. Extensive works in the literature highlight its efficacy in enhancing corrosion resistance for the AA2024 and AA7075 alloys [12,13,14,15,16,17,18,19]. Similarly, the combination of phosphoric and sulfuric acids in the anodizing process has also been explored [20]. These instances demonstrate the potential for improved performance, comparable to Chromic Acid Anodizing (CAA) [13]. Intriguingly, the realm of research has yet to traverse the avenue of combining tartaric acid with phosphoric and sulfuric acids.
Delving into the scientific rationale, phosphoric acid’s propensity to orchestrate a more uniform and dense anodic oxide layer, as compared to the standalone action of sulfuric acid, serves as a foundational premise. In parallel, tartaric acid’s intricate affinity for complexation brings forth the prospect of augmenting film formation, potentially culminating in a more refined and consistent oxide layer. The harmonious interplay among phosphoric, tartaric, and sulfuric acids further ignites the prospect of synergistic effects, thereby potentially elevating the anodizing process to unprecedented heights [15,21].
At the crossroads of science and innovation, the possibility of amalgamating these acids remains an uncharted territory, poised to unravel novel avenues of exploration. As of the current juncture, a potential union of these materials has yet to be established.
The discerning choice to assess the anodizing efficacy concerning corrosion resistance and to find the underlying corrosion mechanisms was best encapsulated within an electrochemical noise analysis. This technique focuses on collecting and analyzing the fluctuating currents and voltages that ebb and flow upon the surface of a designated sample [14,22,23,24].
The classical or traditional avenues of data analysis involve the time domain analysis, which gracefully extracts statistical insights from the seemingly stochastic signals inoculated by the corrosion system. Parameters of the essence, including the mean, standard deviation, skewness, kurtosis, and the root mean square of both current (i) and potential (E) noise, are meticulously deciphered and revealed through this method (interpretation of electrochemical noise data). Moreover, the frequency domain emerges as another stronghold for data analysis, where the manners in which the corrosion mechanism is carried out can be interpreted through spectral fingerprints provided by the power spectral density [25,26].
However, an essential notion to keep in mind is that the two realms of statistical and frequency-based methodologies are both firmly rooted within the linear predictive theory and the linear framework (electrochemical noise, EN), rendering them unable to assess the intricate tapestry of nonlinear corrosion mechanisms that are denoted by swift, sudden changes and a high sensitivity to initial conditions [7,11,22,27]. The use of traditional methodologies often loses these nuances.
While these strategies award us with a degree of certainty, their comfortable nestling within the linear sanctuaries make us unwittingly overlook the intricacies and dynamics of nonlinearity that are inherent in the corrosion phenomena, faltering to observe the bigger picture where higher degrees of nuance and insight are needed.
The complex and unpredictable behavior observed in electrochemical signals can be understood through nonlinear dynamics. In the context of electrochemical noise for corrosion detection, the signals exhibit fluctuations that may seem chaotic without a repetitive pattern.
Beneath this surface turbulence, a cardinal revelation emerges—chaos is not arbitrary; it is guided by the deterministic laws woven by the intricate tapestry of physics and chemistry, rooted in fundamental principles [2,3]. The enigma lies in the dance between the signal behavior and the deterministic nature of the corrosion process—a hallmark of deterministic chaos. This phenomenon divulges that while corrosion follows meticulous rules, and its signal behavior often creates chaos due to the delicate dance of the initial conditions and the intricate interplay of myriad factors within the corrosion ecosystem [28].
The chaos theory was introduced into electrochemical noise data analysis around the 1990s with pioneering works from Stringer and Markworth, E. García-Ochoa, and C. Gabrielli [29,30,31], amongst other authors who successfully implemented the technique and reported to obtain the present corrosion mechanism as well as the interpretation of the Lyapunov exponent, which is a key parameter used to quantify the degree of chaos in a system by measuring the system’s sensitivity to the initial conditions [17,27].
The implementation of the chaos theory is based on the reconstruction of a vector space named the “state space” or “phase space”, which represents the entire trajectory of the system where all points within it can be considered as an initial condition [19], and through its reconstruction, we can successfully capture the underlying dynamics and behavior of a complex system, particularly in chaotic systems. This process allows us to analyze how a system evolves and responds to different initial conditions.
The aim of the present work is to implement the chaos theory by obtaining the correlation dimension and Lyapunov exponent and using the frequency domain analysis (power spectral density, PSD) and time–frequency domains (Hilbert–Huang transform, HHT) to study the electrochemical noise behavior of AA2024 and AA7075 anodized in a three-part electrolyte consisting of a tartaric–phosphoric–sulfuric acid (TPSA) bath, while employing the techniques of electrochemical noise (EN). The anodized samples were exposed at 3.5 wt.% NaCl solutions as a simulation of marine atmospheres. Scanning electron microscopy (SEM) was used to observe the morphologies of the anodized surfaces. Aluminum that has been anodized in three parts has had few studies, as well as the application of the chaos theory as an analysis technique, so it is important to know the behavior of electrochemical corrosion in environments that simulate aircraft working conditions.

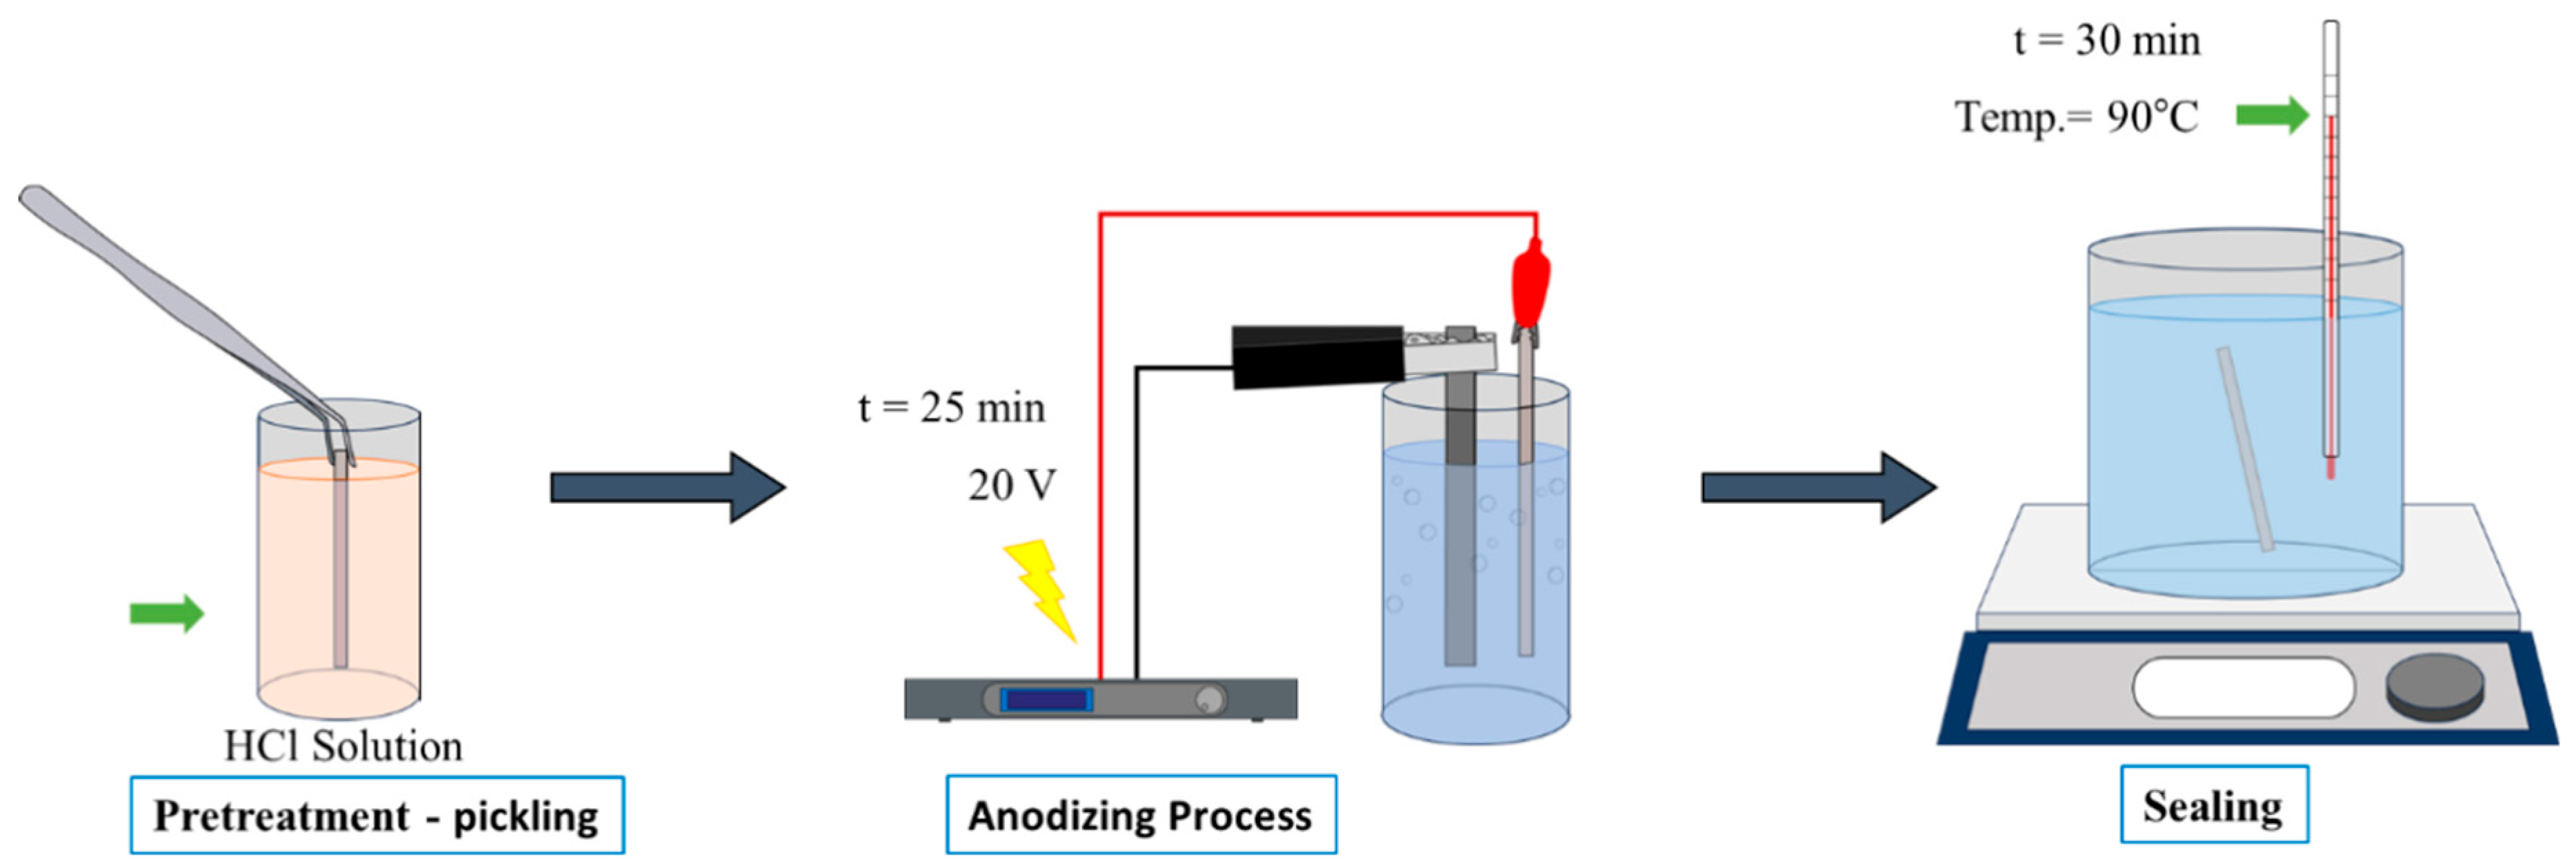
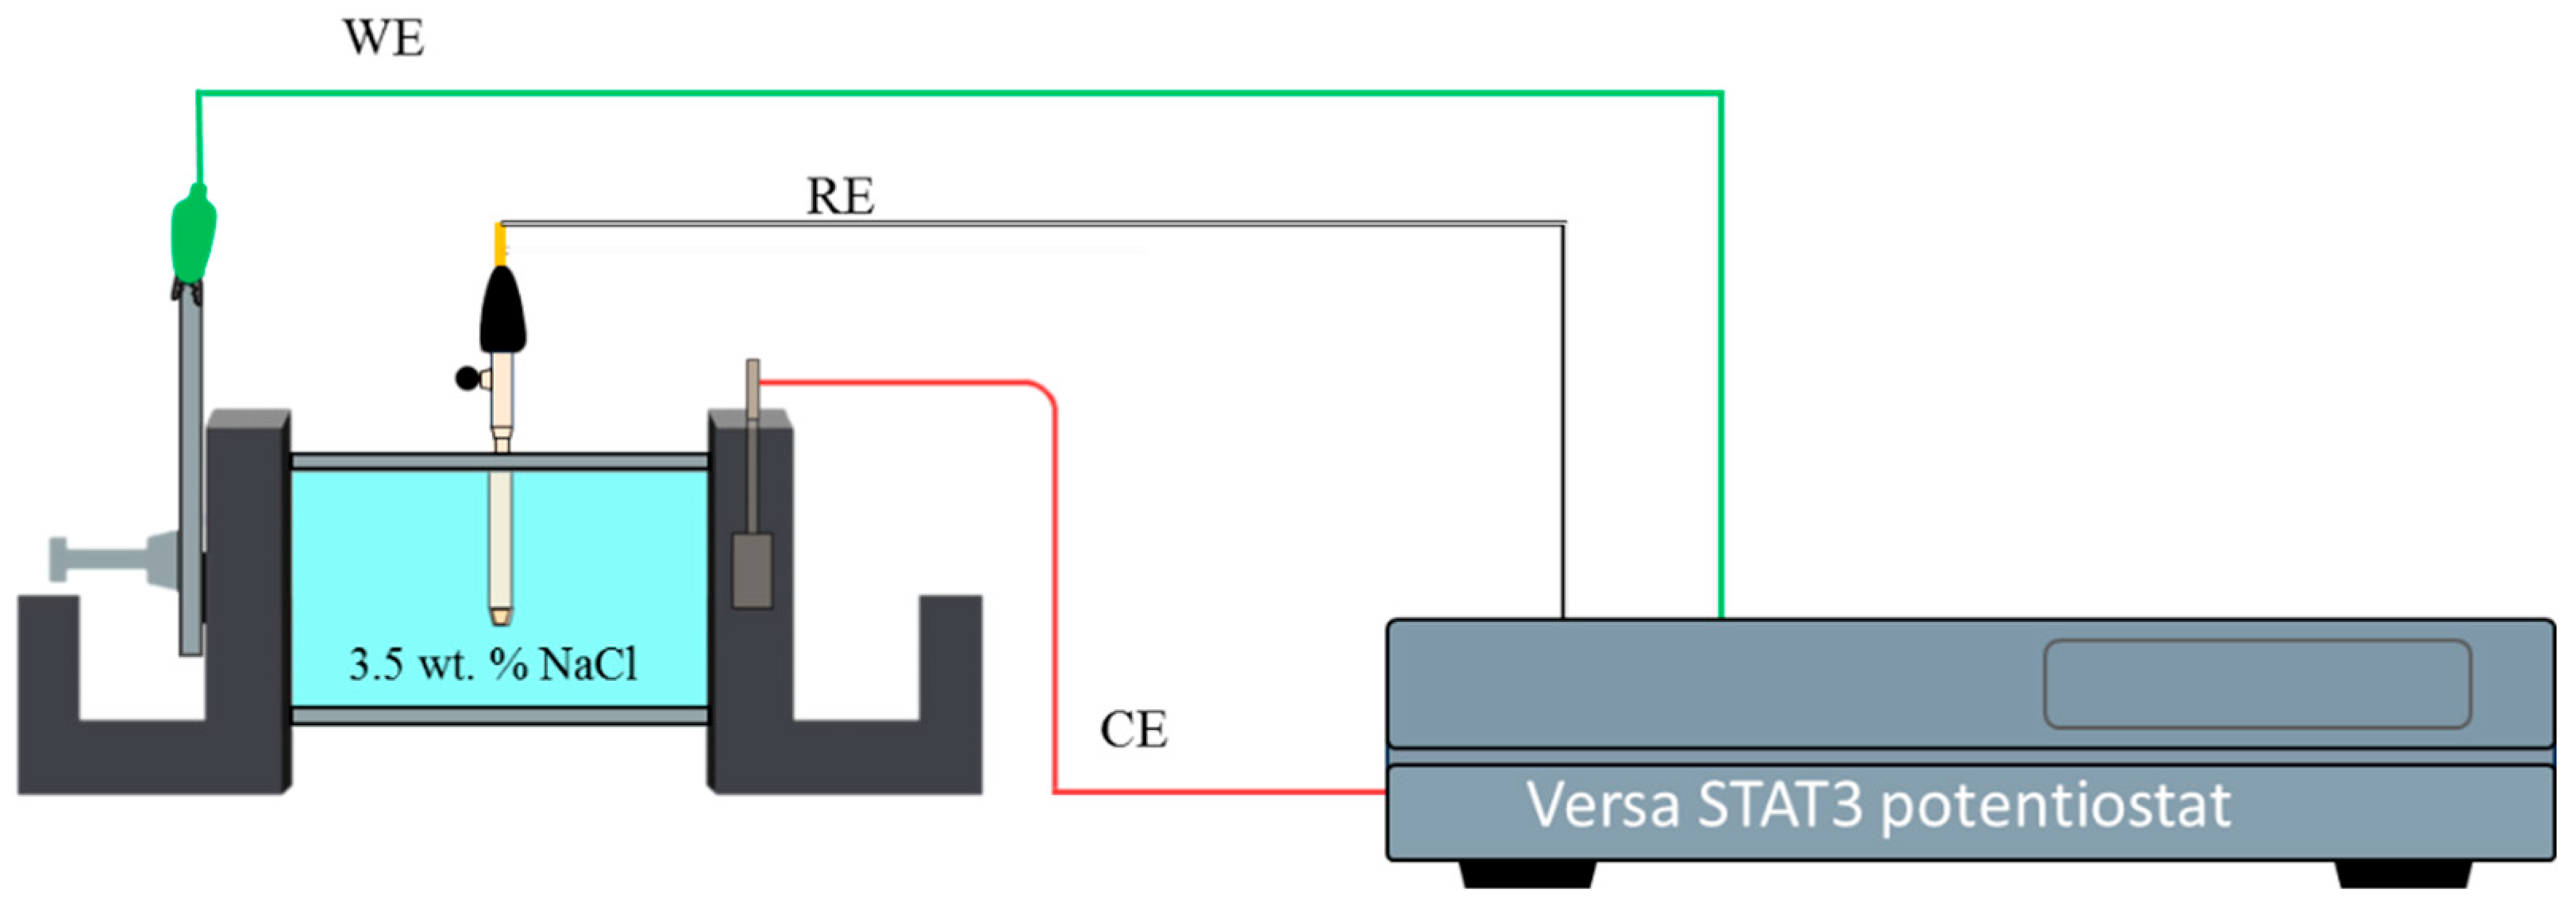
2. Materials and Methods

The materials employed were commercial: AA2024 and AA7075 alloys were utilized in the form of plates, which were cut to anodize and evaluate using electrochemical techniques. A total of 8 samples were obtained, 4 for each material.
X-ray fluorescence (Olympus DELTA XRF, Houston, TX, USA) was used to determine the chemical composition of this aluminum. The chemical composition of each aluminum alloy is shown in Table 1.
The AA2024 and AA7075 samples were processed before anodization by polishing the following ASTM E3 and E407 standards [32,33] with SiC grit papers: 180, 220, 320, 400, and 600 grades. This was followed by 10 min of ultrasonic cleaning in deionized water.
Anodizing Process: A total of 6 samples were anodized, while the remaining 2 were left as control samples. The anodizing process consisted of immersing the sample of a pickling for 50 wt.% HCl solution, followed by two rinses with deionized water.
The three electrolytes produced contained H2SO4, H3PO4, and C4H6O6 at different concentrations (see Table 2 to associate the concentration of each anodized sample). For all electrolytes, the concentration of H2SO4 remained the same. Electrolyte 1 contained equal parts of H3PO4 and C4H6O6, Electrolyte 2 had a higher concentration of H3PO4 and a lower concentration of C4H6O6, and Electrolyte 3 possessed a higher concentration of C4H6O6 and lower values of H3PO4 (Figure 1) [34].
The total time elapsed lasted 25 min with a constant voltage of 20 V at room temperature, where the samples were submerged into the electrolyte using a lead bar as a cathode. The power supply used consisted of a B&k Precision Model XLN30052-GL High Power Programmable DC with a capacity of 300 Volts (V) and 5 Amperes (A). This process was performed for all 6 samples, 2 for each electrolyte. Once the anodization process was completed, sealing in hot water was performed using deionized water for 30 min at 90 ± 2 °C to reduce the porous size.
Microstructural Characterization: The surface section of aluminum alloys was investigated using a backscattered electron (BES) detector in a scanning electron microscope (SEM, JEOL-JSM-5610LV, Tokyo, Japan) operating at 20 kV and with 8.5 and 12 mm work distances.
Electrochemical Measurements: Electrochemical noise was conducted at room temperature in accordance with the ASTM G199-09 [35,36] standard using a Versa STAT3 potentiostat/galvanostat/ZRA (Zero Resistance Ammeter) (AMETEK, Oak Ridge, TN, USA) in 3.5 wt.% NaCl solution. A conventional three-electrode cell was used. A symmetric configuration was used with the working electrode (WE) corresponding to the samples, a saturated calomel electrode was used as a reference electrode (RE), and a platinum mesh acted as the counter electrode (CE). Corrosion tests were realized in triplicate. The EN data acquisition rate was studied at 1 data point per second with a total number of points of 1024 (Figure 2).
For PSD (power spectral density) data, a Hann window was applied before being transformed to the frequency domain via an FFT (fast Fourier transform). EN analysis with Hilbert–Huang transform (HHT) was necessary to obtain the intrinsic functions (IMF) of EN signal using an empirical decomposition method (EMD), and finally, the instantaneous frequencies were plotted with a Hilbert spectrum. The EN signal was processed with MATLAB 2018a software (Math Works, Natick, MA, USA).

3. Results

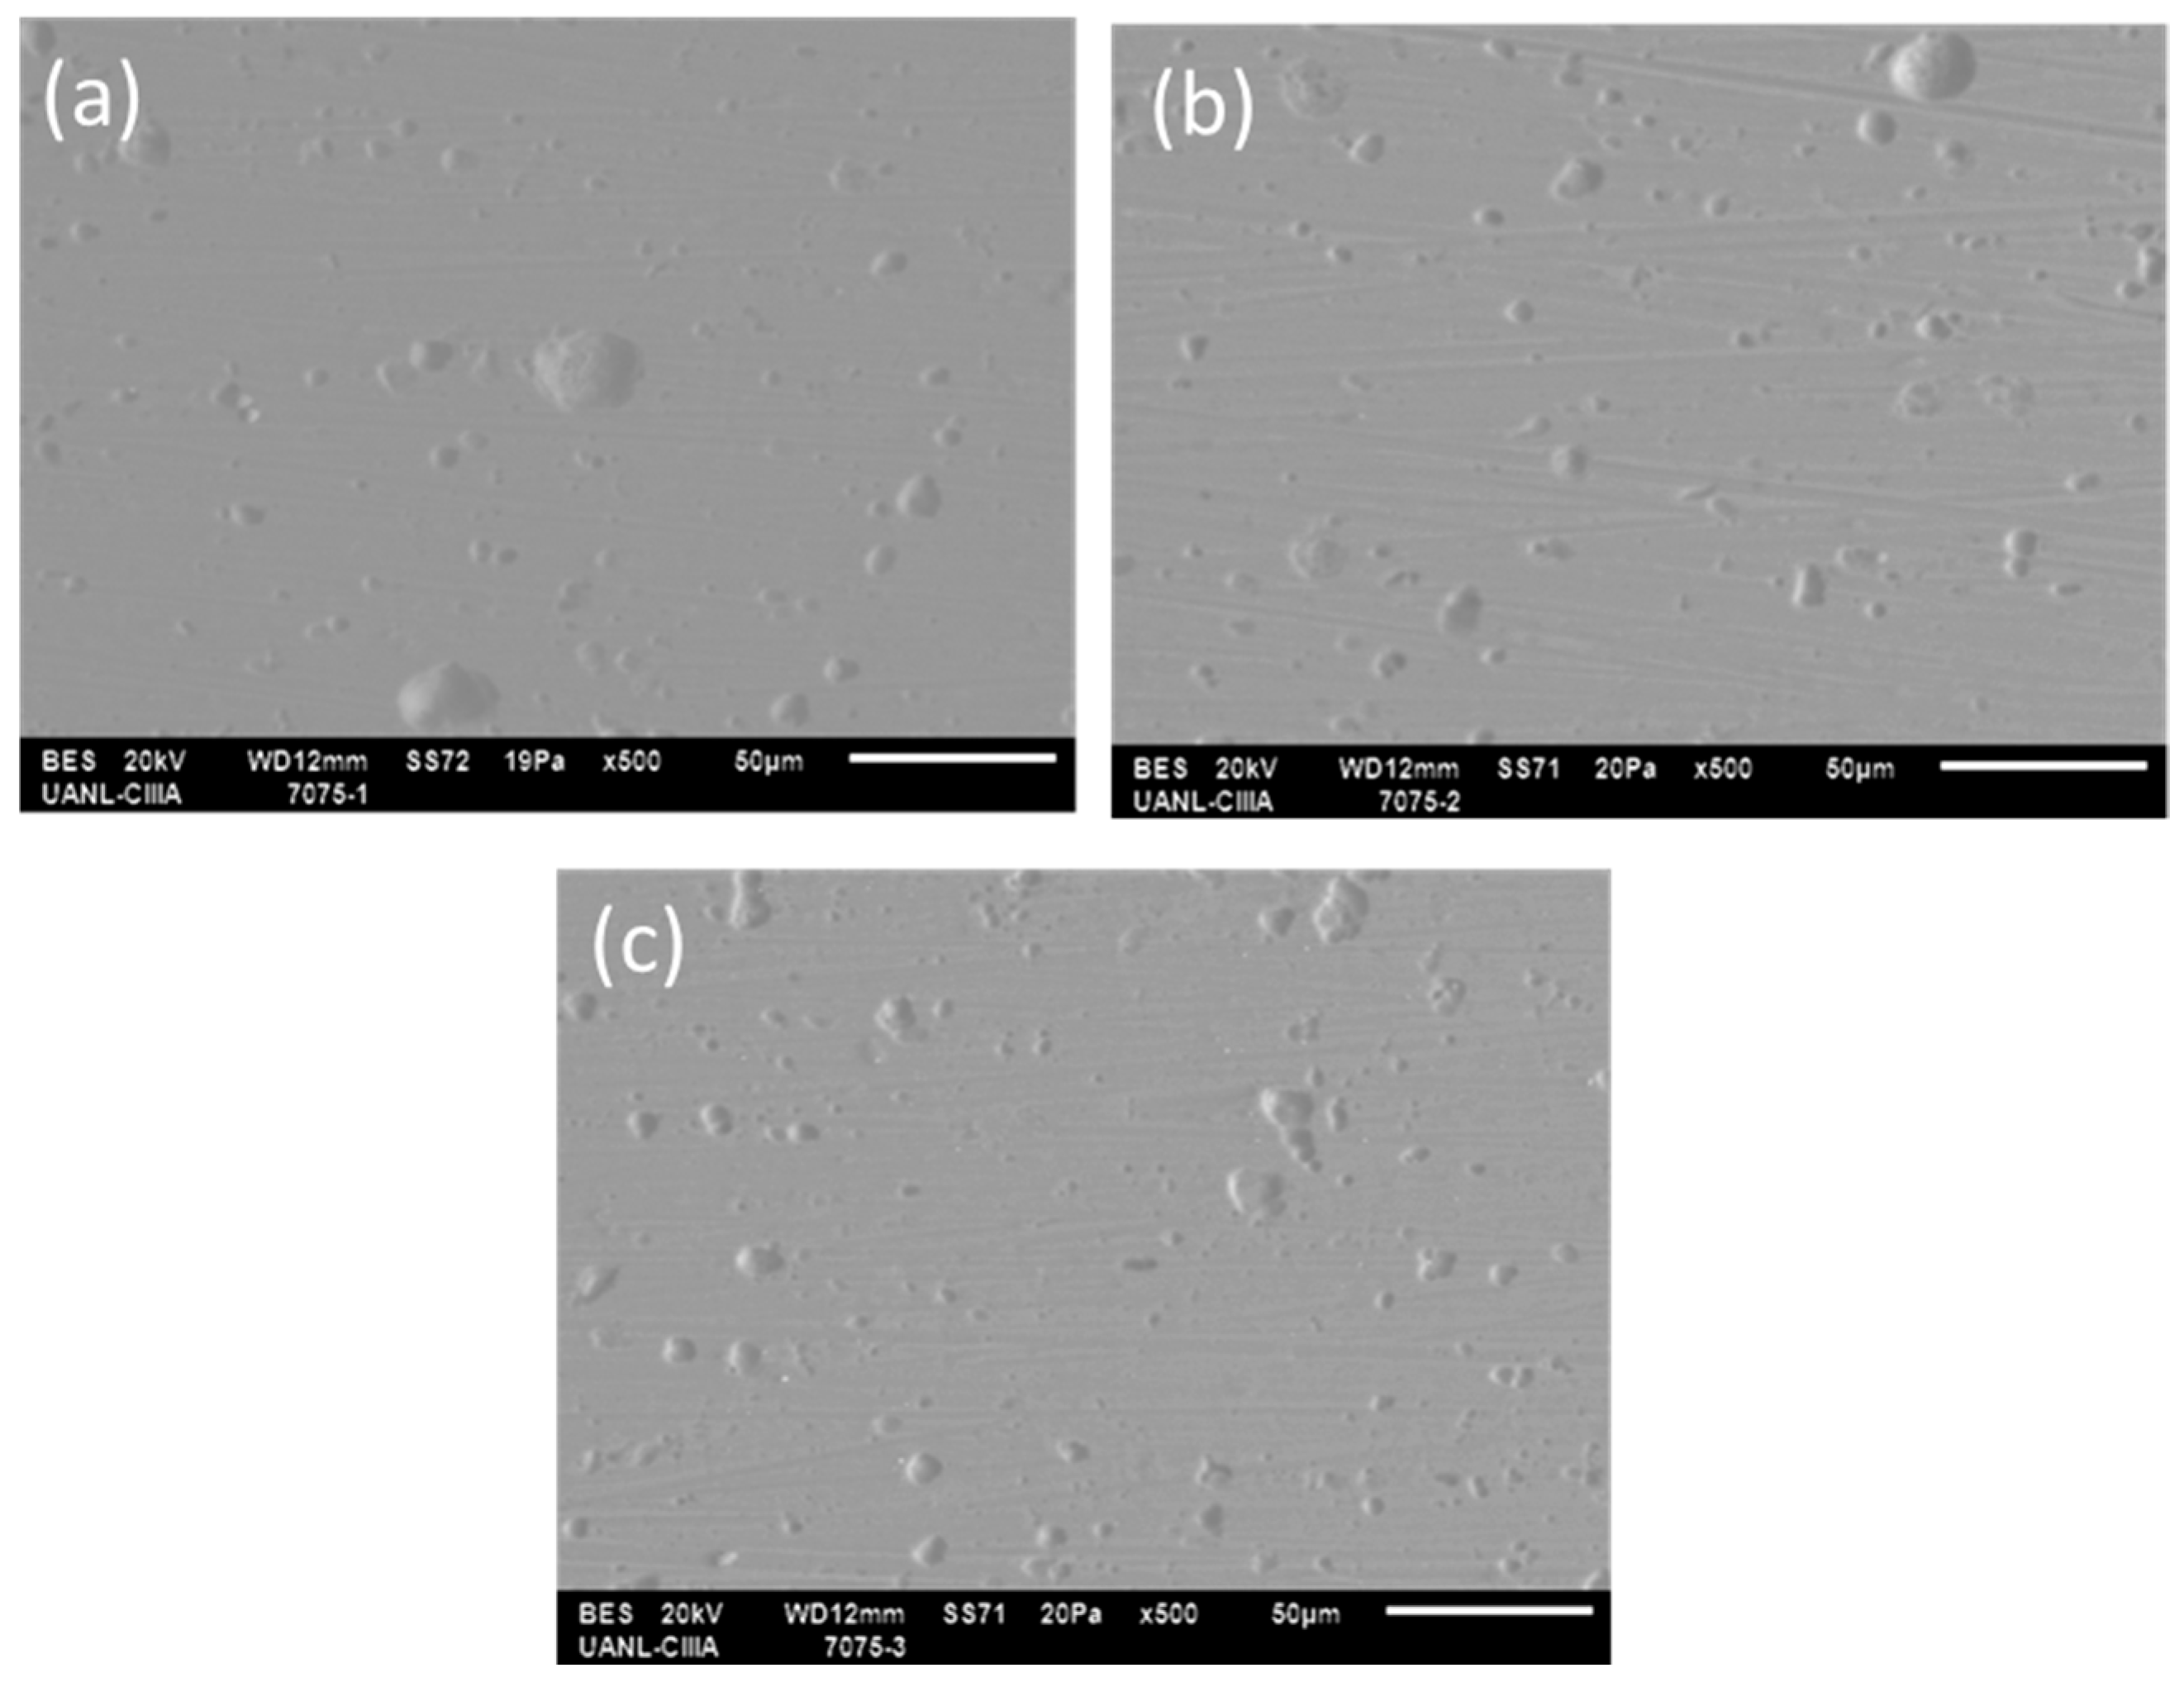
3.1. SEM Superficial Analysis

The different superficial morphologies of the anodized samples obtained via SEM of the anodized AA 2024 and AA7075 alloys under different conditions are shown in Figure 3 and Figure 4. The AA2024-1 sample presented a minor number of imperfections compared to the AA2024-3 sample. This behavior is associated with the increase in the concentration of H3PO4. Also, the imperfections can be related to the formation of an oxide layer in the preference zones, so the AA2024-3 sample has a major presence of anodized alloys. Still, it is increasing in a heterogeneous way.

3.2. Electrochemical Noise

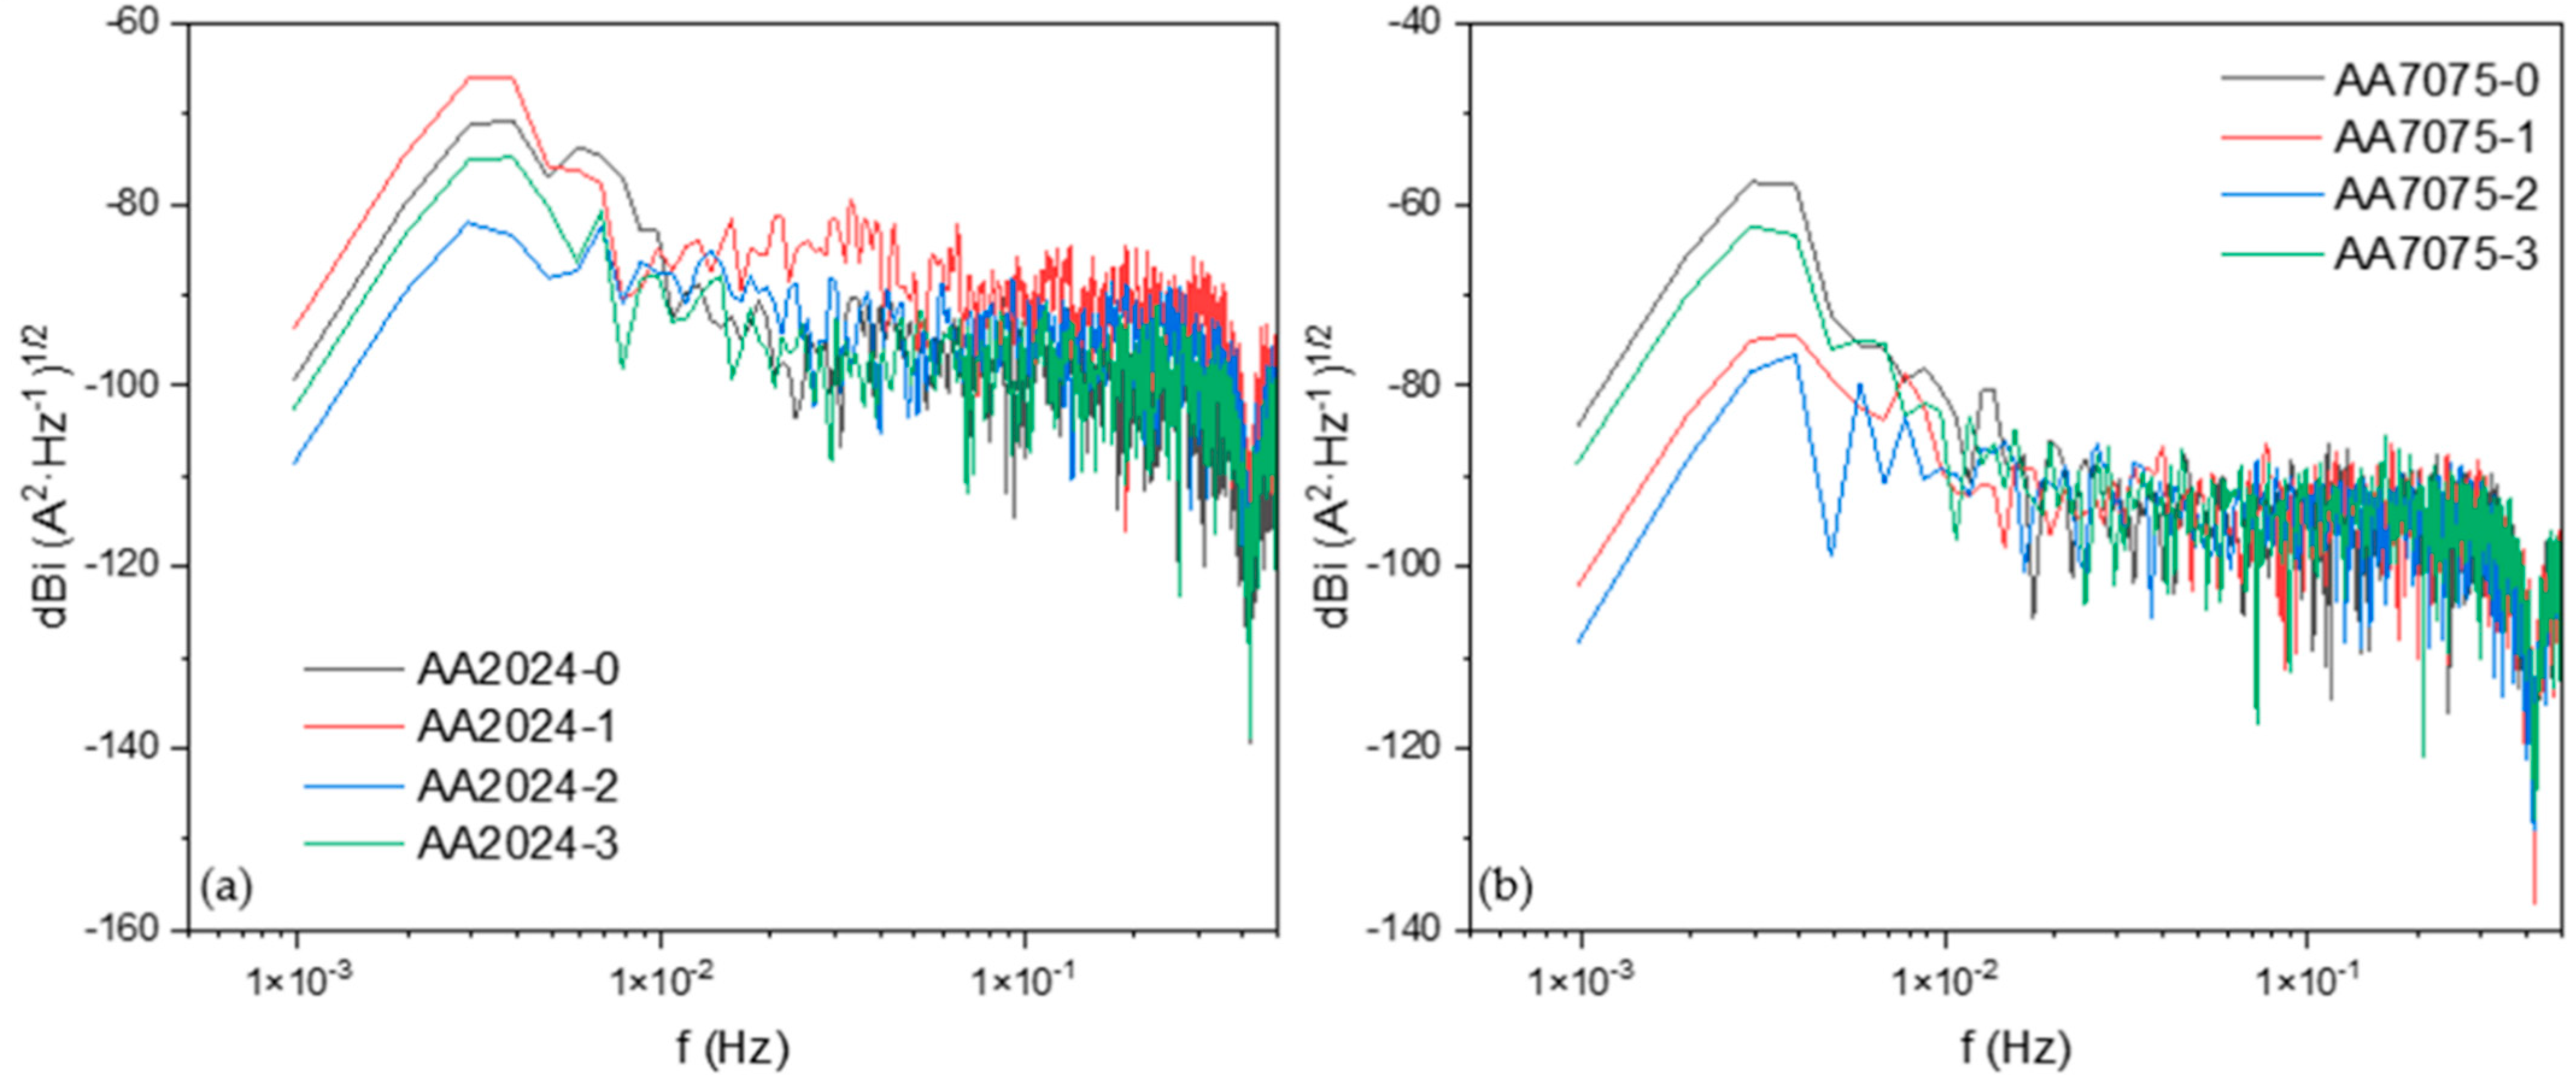
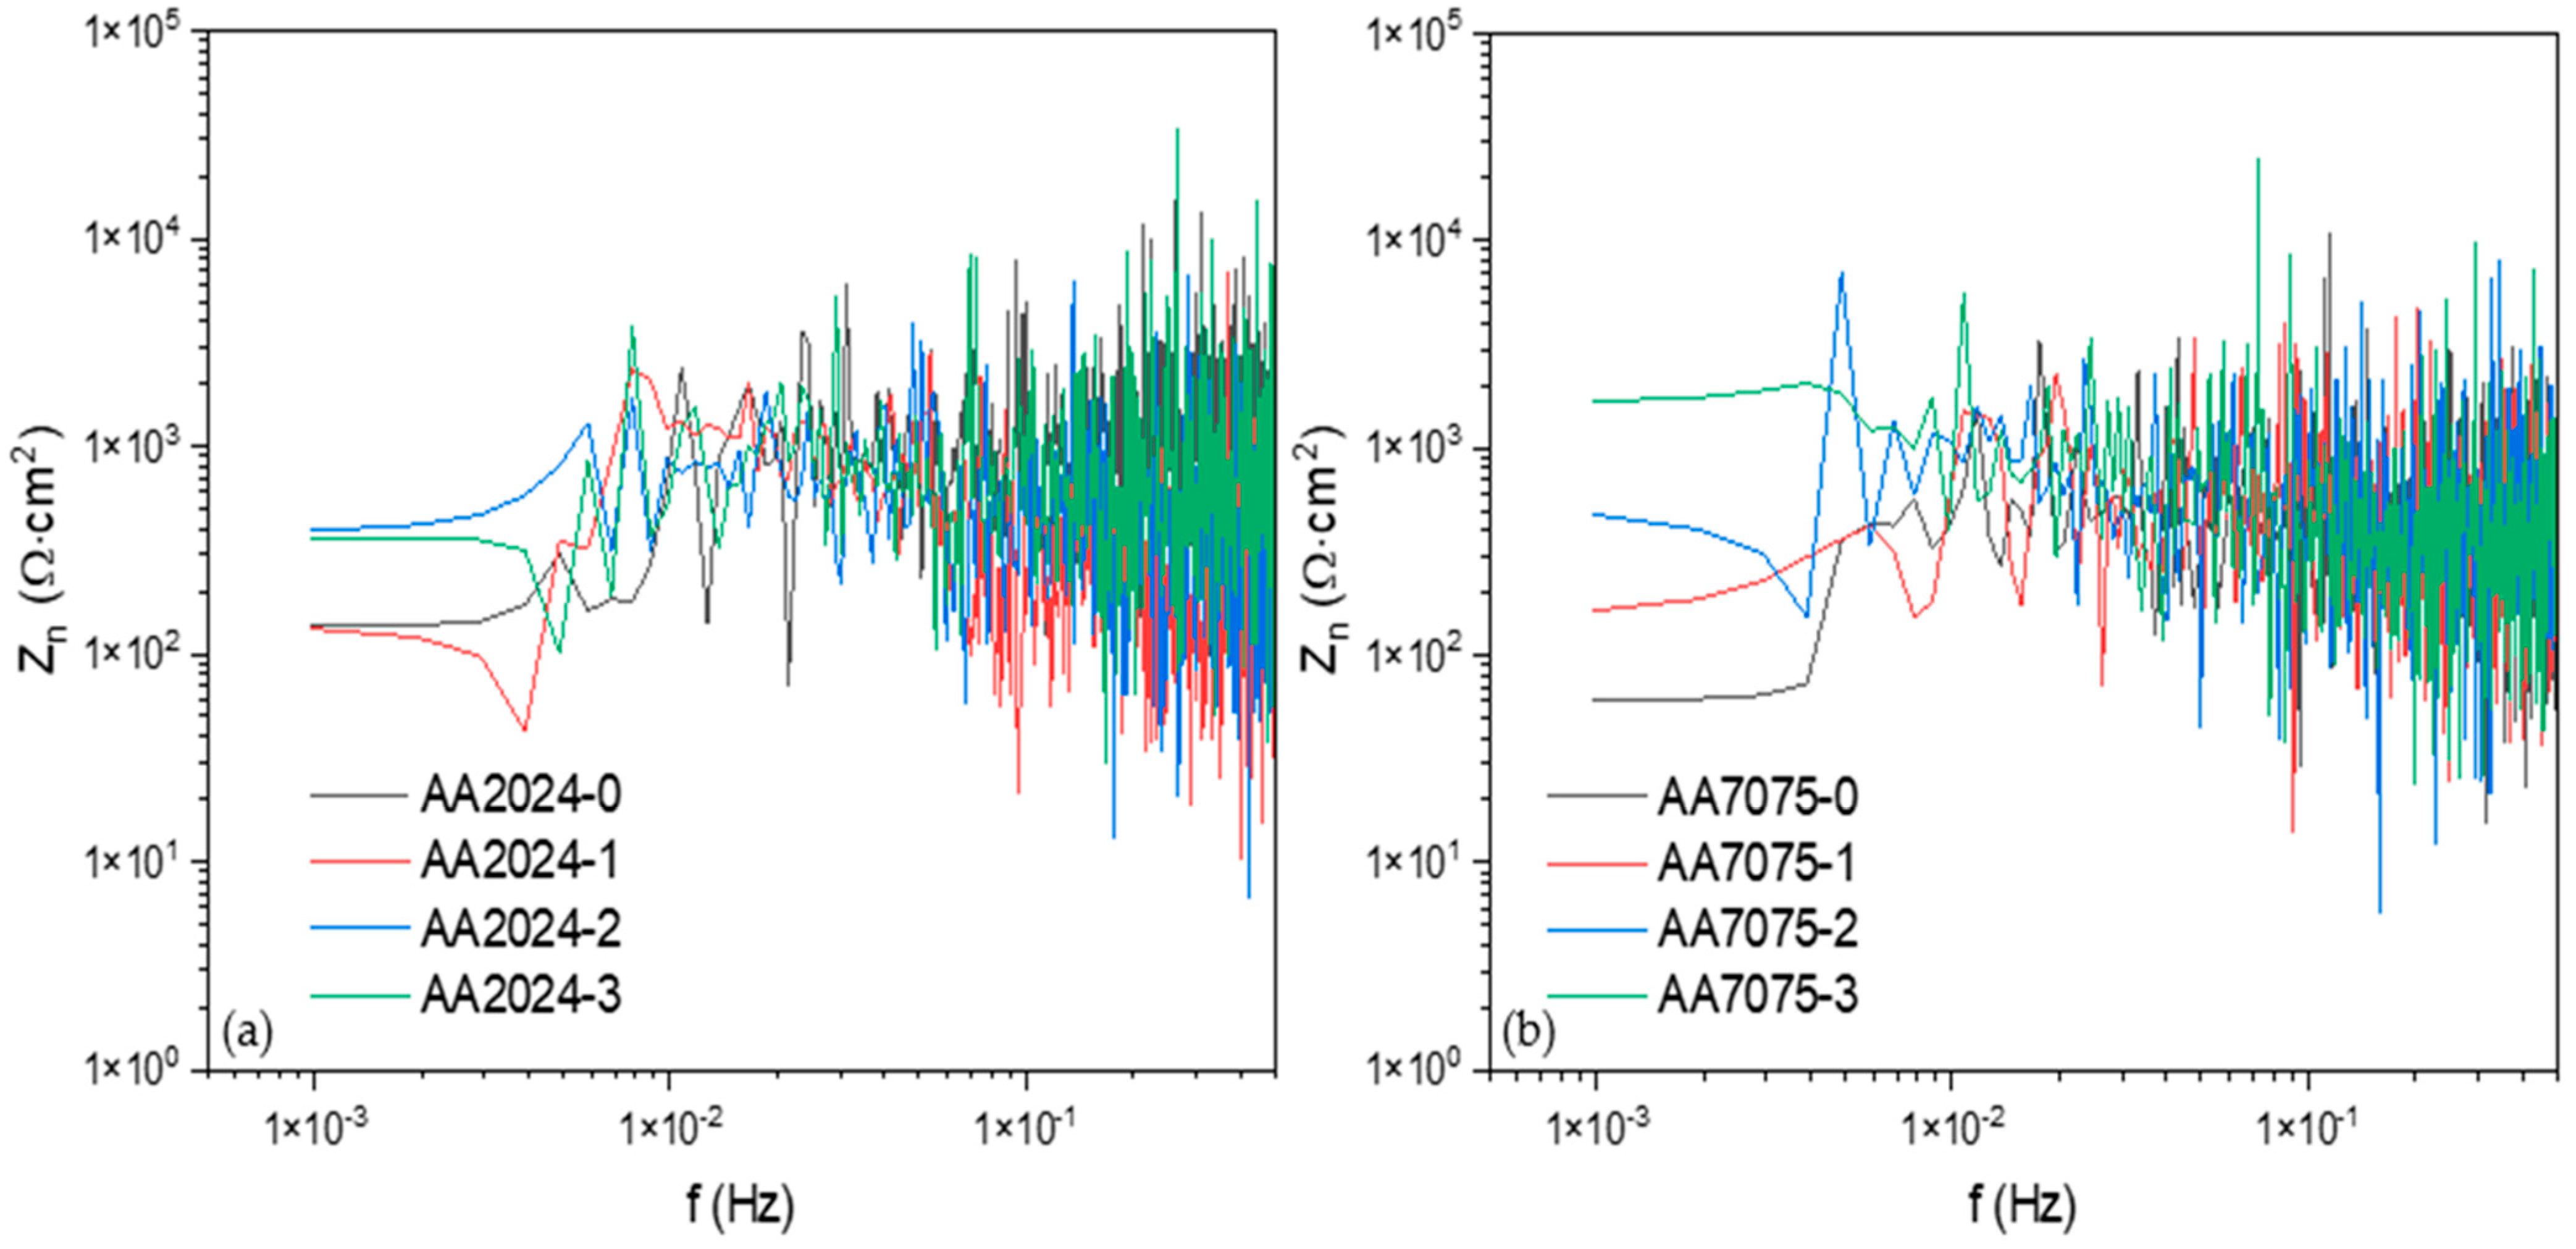
3.2.1. Frequency Domain Analysis: Power Spectral Density (PSD) and Noise Impedance (Zn)

The PSD was used to evaluate the electrochemical noise technique. Using a polynomial grade 9 filter, the PSD was made to remove the DC signal [37,38]. For a PSD analysis, it is necessary to transform to the frequency domain from the time domain when applying an FFT. The interpretation for the PSD will depend on the slope or the change in the slope behavior. The frequency zero limits (ψ0) result in material dissolution [39,40,41]. The associates the slope values with the corrosion types, and the following equation explains how to obtain the slope value. It is crucial to emphasize that some values are the same for two types of corrosion; this could create another way of studying the slope and frequencies [42].
l o g Ψ x = β x log f
Figure 5a shows the PSD in a current for the alloys, and when anodized, the AA2024-2 sample presented the lowest Ψ0, meaning that the electron change was lower, so the corrosion kinetic decreased (102 dBi). However, the value of the slope (see Table 3) is associated with uniform corrosion (−6), which means that the anodized sample is more homogenous and provokes equal reactions. However, the rest of the samples presented values of localized corrosion. Figure 5b shows the results of the anodized AA7075. In this case, the AA7075-2 sample presented a lower Ψ0 value, but all of the samples showed slope values that were associated with localized corrosion. All of the samples presented a change in the slope at low frequencies, even AA2024 and AA7075, which means that different electrochemical processes occur on the surface, maybe due to heterogeneous anodization.
The noise impedance (Zn), also called spectral noise resistance, is expressed by the following equation [43,44,45]:
Z n = ψ V f ψ I f
The PSD division of the potential and current square roots calculates the Zn. The electrochemical noise impedance zero (Zn0) is related to the corrosion resistance [46].
Figure 6 shows the alloys’ noise impedance (Zn) results and their anodized samples when exposed to NaCl. Figure 6a shows the results of the AA2024 samples and their anodized samples. In this graphic, the AA2024-2 and AA2024-3 samples showed bigger values of Zn0, which were 390 and 364 Ω·cm2, respectively (see Table 3), which means that the anodized samples presented better properties against the corrosion of AA2024. Also, the AA2024-1 sample showed low resistance against corrosion.
Figure 6b shows the results of the AA7075 samples and their anodization when exposed to NaCl. The AA7075-3 sample presented the highest value of Zn0, 1677 Ω·cm2, which is even higher than AA7075 and AA2024, meaning that it has better properties against corrosion. Also, the AA7075-2 sample presented good properties against corrosion, with a Zn0 value of 477 Ω·cm2. That value is bigger than all of the AA2024 samples. AA7075-0, the uncoated sample, presented a lower resistance against the corrosion with 60 Ω·cm2; that value is lower than that of AA2024-0.
Table 3 shows the results of the PSD parameters obtained and mentioned in this section. Only the AA2024-2 sample presented a slope value of uniform corrosion; the rest of the samples obtained values of localized corrosion. The localized corrosion value is related to a non-uniform surface.

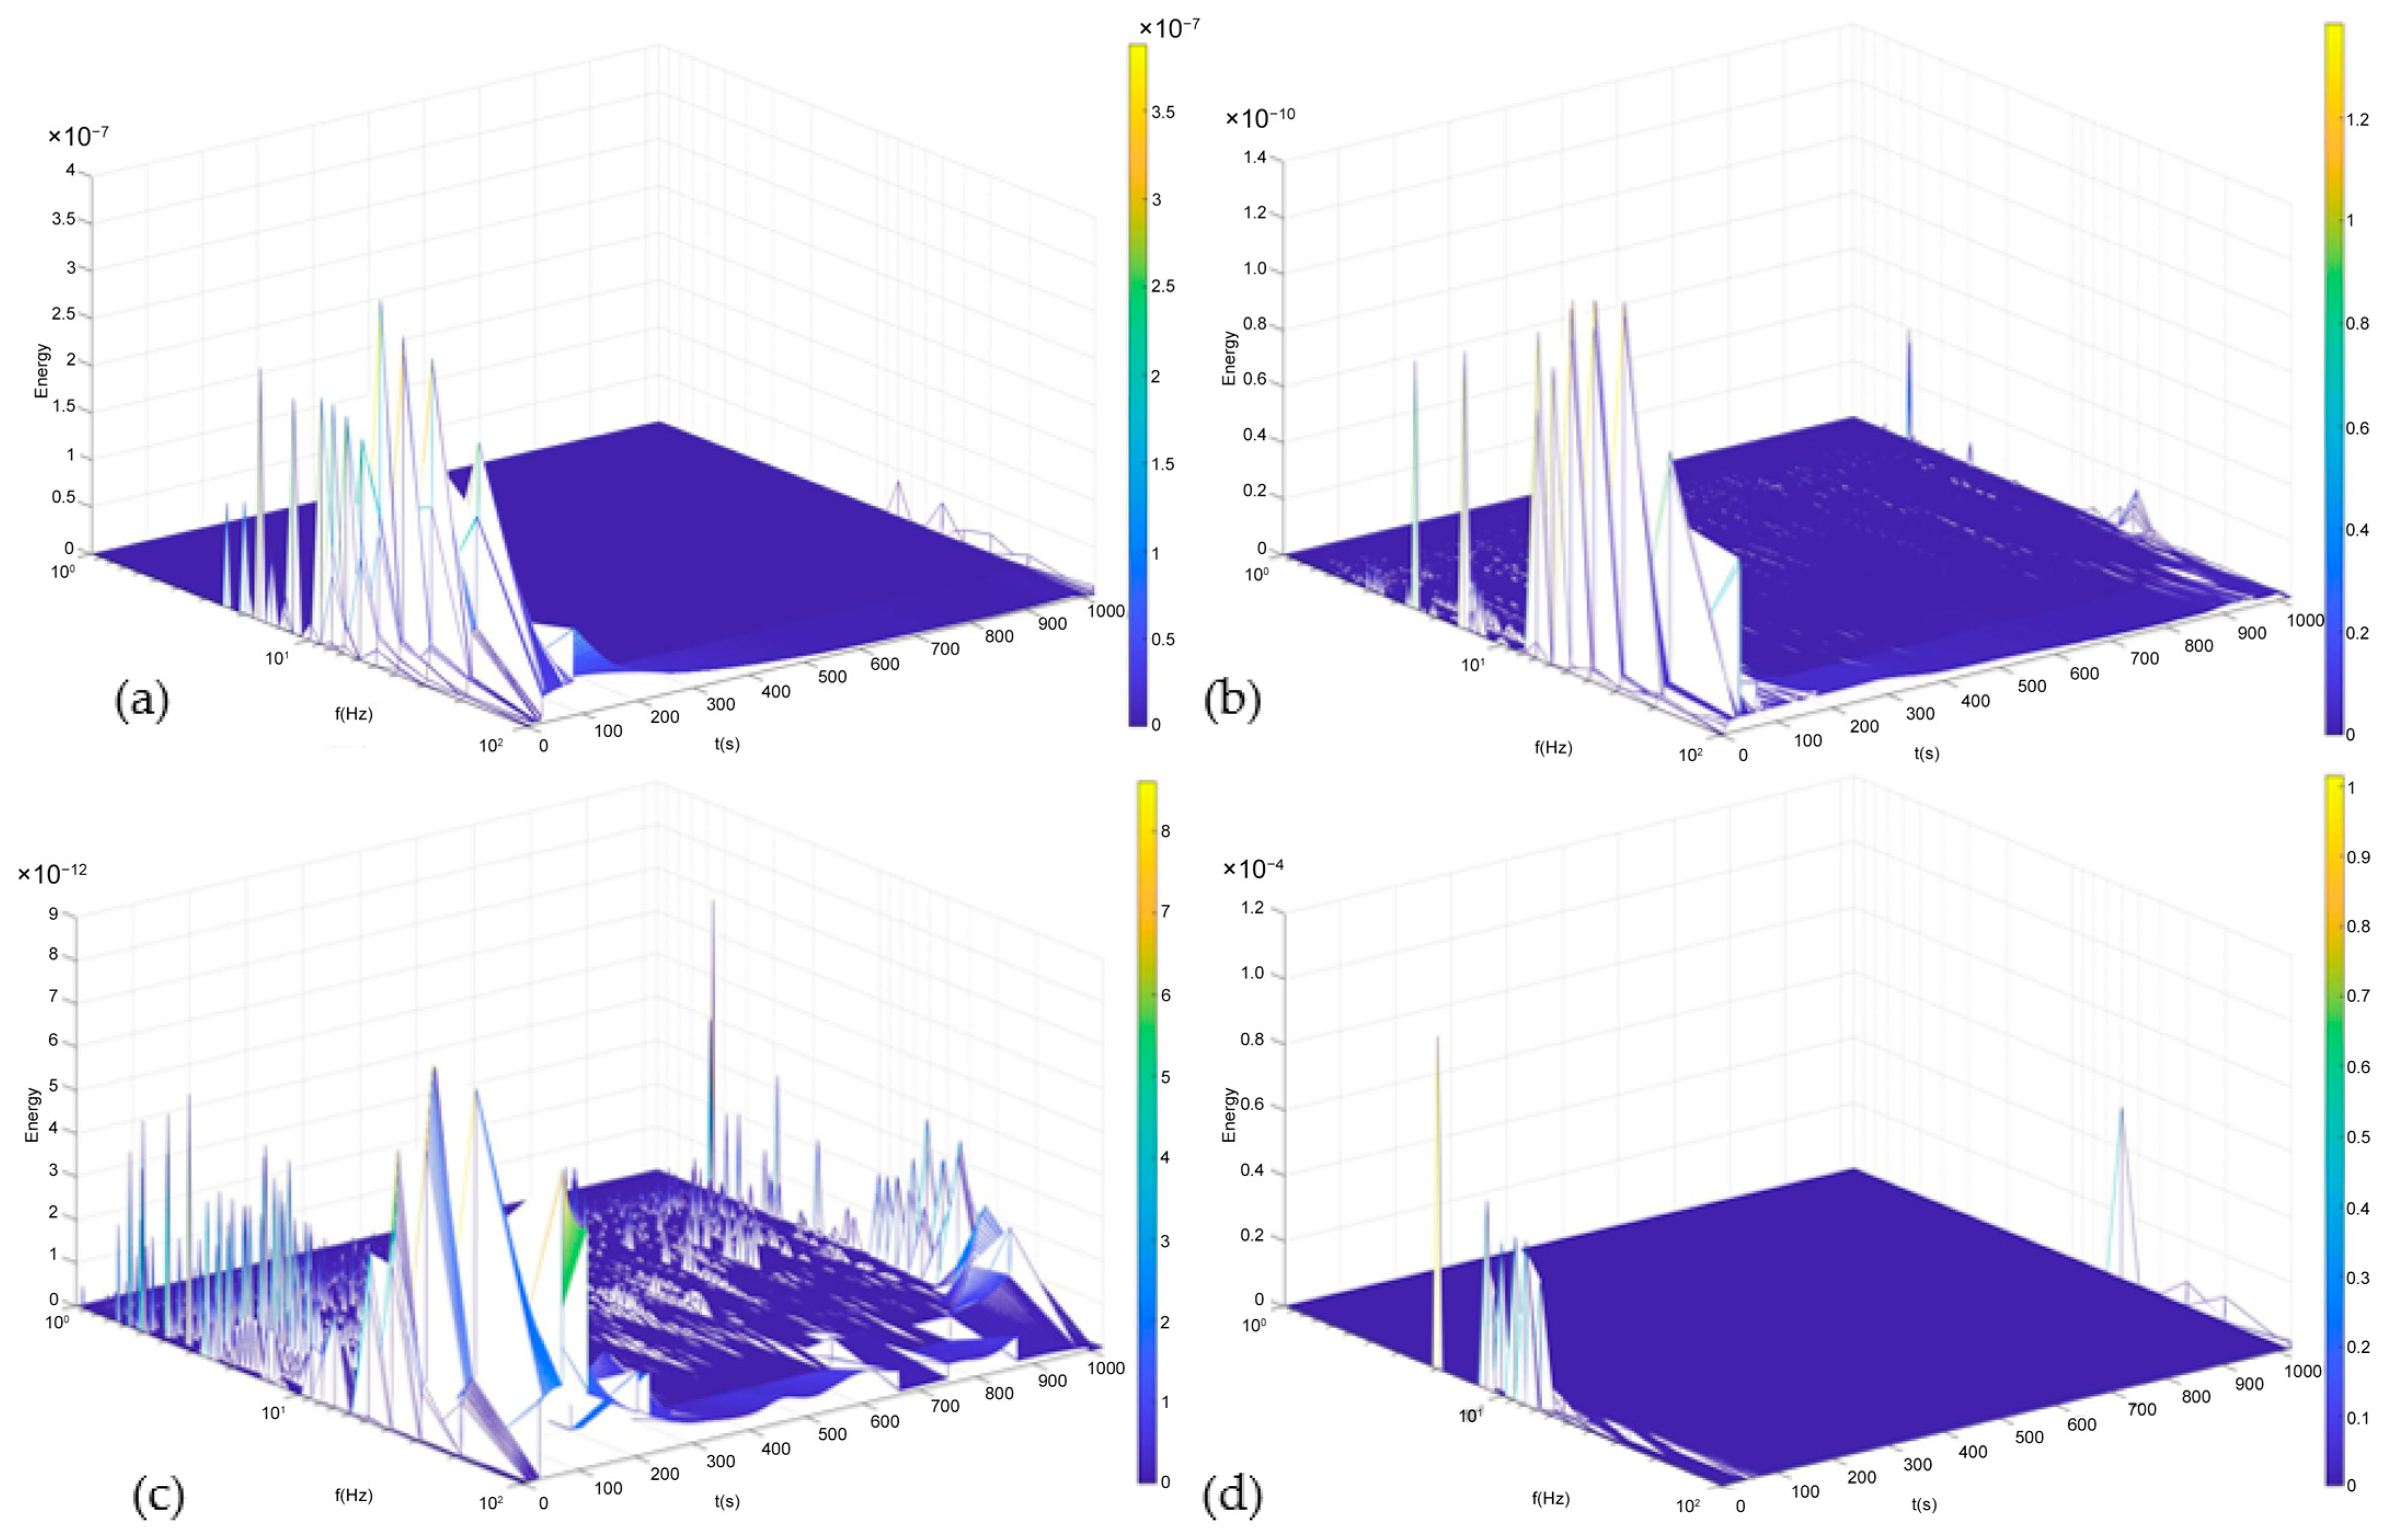
3.2.2. Time–Frequency Domain Analysis: Hilbert–Huang Transform ANALYSIS

Another advanced method used to determine the corrosion type and mechanism is the Hilbert–Huang transform (HHT), which helps to remove DC from the original signal [47]. Also, this method can localize the frequency and time when energy interchange occurs. This energy is called instantaneous energy and it is calculated using an empirical method of decomposition (EMD) to obtain the intrinsic functions (IMF) and to apply an HHT, which was proposed by Huang et al. [48] in 1998, to study non-stationary signals, where a spectrum with the distribution of time–frequency energy is generated. It permits the localization of the accumulated energy [44,46,49]. The EMD, proposed by Huang, is expressed in Equation (3):
x t = i = 1 N h i t + d t
d(t) is the average of the trend at the low frequency of the time series x(t) and cannot be decomposed, and h(i)(t) is the i-th term of the IMF that is generated; these numbers must satisfy that of the extreme and cross number and be equal or differ in one at the maximum, and each point, when using the local maximum and minimum, must have zero HHT. Equation (4) is governed by [50,51,52]:
y j t = 1 π p h j τ t τ d τ
where yj (t) is the Hilbert transform, and IMF is represented with hj; p is related to the Cauchy principle and is linked with the average of the IMF [53].
Figure 7 shows the results of the HHT for the AA2024 samples exposed to NaCl at 3.5%. Figure 7a shows a result for AA2024-0; that sample presented energy accumulation in the middle and high frequency zones, indicating that a localized process will occur in that sample. Figure 7b, for AA2024-1, showed energy accumulation in the middle and high frequencies. Also, the AA2024-3 sample presented a similar behavior, with localized process predominance. On the other hand, Figure 7c of AA2024-2 presented energy accumulation at high frequencies and at low frequencies, indicating that the localized process will be propagated.
Figure 8 shows the results of the AA7075 samples exposed to NaCl. The AA7075-0, AA7075-1, and AA7075-3 samples presented predominantly localized processes, indicating that the anodized surfaces are not homogenous. Figure 8c shows energy accumulation at low and high frequencies but with a predominance of localized processes, indicating that the anodized surface is not homogenous.

3.3. Time Domain Analysis—Chaos Theory

3.3.1. Signal Processing

Electrochemical noise is determined using the phase space reconstruction theory, so it is necessary to convert our time series data into state vectors through Takens’s Time Delay Embedding Theorem [54,55], where vectors are created in a higher-dimensional space by stacking delayed versions of the observed variables from the time series. The following equation represents this:
X t = x t , x t τ , x t 2 τ , , x t m 1 τ T
where the first term, X(t), corresponds to the m-dimensional vector in the reconstructed phase space at a given t time, and x(t) represents the observed variable at a given time, t. In contrast, τ represents the time delay or lag, and m is the embedding dimension.
The time delay and embedding dimension are critical values that must be determined carefully as they significantly impact the quality of the reconstructed phase space. As such, they impact the accuracy of the insights gained from the analysis. The methodology employed here consisted of the False Nearest Neighbors (FNNs) method proposed by Kennel et al. [55], where the general notion consists of finding points in the time series that are initially closer to the embedding space, but over successive time steps become distant due to their differing developments over time; these are the false neighbors, given that while they may appear to be near the reconstructed phase space, their future evolution diverges.
Initially, a relative threshold and an absolute threshold are established to determine if the distance between the neighboring points within the phase space falls within an acceptable range. The relative threshold assesses the extent to which the trajectory of the points may have deviated. In contrast, the absolute threshold examines the ratio of the point distances to the standard deviation of the time series data. Additionally, the standard deviation of the time series is computed, along with the dimensions of the time series matrix, including the numbers of rows and columns. Subsequently, the data undergo an iteration through a specified range of embedding dimensions and time delays. This iterative process is aimed at constructing an embedding matrix. The False Nearest Neighbors (FNNs) analysis is conducted within this loop for each embedding dimension and time delay combination. This analysis entails the calculation of the distances between neighboring points in the phase space, thereby identifying potential false nearest neighbors. For each time delay, the average false nearest neighbor is computed using the distances associated with potential false nearest neighbors. Upon iterating through all possible combinations of embedding dimensions and time delays, the combination that results in the minimum average false nearest neighbor is identified. This combination is deemed the optimal time delay and embedding dimension, effectively capturing the system’s dynamics. Once these values have been obtained, the phase space reconstruction may be performed according to the time delay theorem.
The Euclidean distances between the pairs of delay vectors within the reconstructed phase space were meticulously calculated to obtain a clear insight into the spatial closeness of individual points within the reconstructed phase space. Subsequently, point counts were arranged and meticulously assembled, systematically delineating the number of points existing within specific proximity ranges surrounding each point within the phase space. This matrix of point counts became pivotal in understanding the distribution of neighboring points. These steps formed a cohesive foundation to quantify the correlation dimension, a key indicator of the system’s underlying structure and complexity. After this is performed, the calculations for the Lyapunov exponent may begin.
Initializing parameters are established, such as the size of the data subsets to be processed, the maximum number of iterations, and the mean period to exclude certain distances from the calculations; these were instrumental in controlling the granularity of the analysis, the upper iteration limit, and the temporal extent over which certain distances would be excluded. An iterative loop was created to calculate the Lyapunov exponent for distinct segments of the time series, from which the false nearest neighbors were obtained to calculate the exponential divergence of the data points within the embedded space. This was carried out through the following equation:
D i s t k = j = 1 m Y i + k , j Y t , j 2    
Distk represents the Euclidean distance between a point in the subset at time i + k and its nearest neighbor at time t, and m signifies the embedding dimension. The calculated exponential divergences were accumulated to track the number of valid comparisons. Finally, the Lyapunov exponent was computed by dividing the cumulative exponential divergence by the count of valid comparisons.
L E = 1 N k = 1 N l n D i s t k D i s t k 0  
where N represents the number of valid comparisons and D i s t k 0 represents the Euclidean distance between a point and its corresponding neighbor at time, k, that is not within a certain temporal proximity.

3.3.2. Correlation Dimension

All of the obtained correlation dimension values are consistently lower than the number of embedding dimensions employed. This observation suggests a scenario characterized by relatively simple dynamics within the system’s phase space, indicating a limited degree of self-similarity. However, it is imperative to contextualize these findings in conjunction with the Lyapunov exponents (LEs) to gain a comprehensive understanding of the system’s behavior.
All of results are found within the 0–1 range, from which the AA2024-0 sample possesses the highest correlation dimension value with 0.339 overall. In contrast, the A7075-2 sample possesses the lowest overall value with 0.195 (see Table 4). Considering that the samples underwent an anodizing treatment, the anticipation was for a reduced complexity. This anticipation is rooted in the understanding that the corrosion process is inherently chaotic, and applying anodization is a preventive measure to mitigate this chaotic corrosion process.

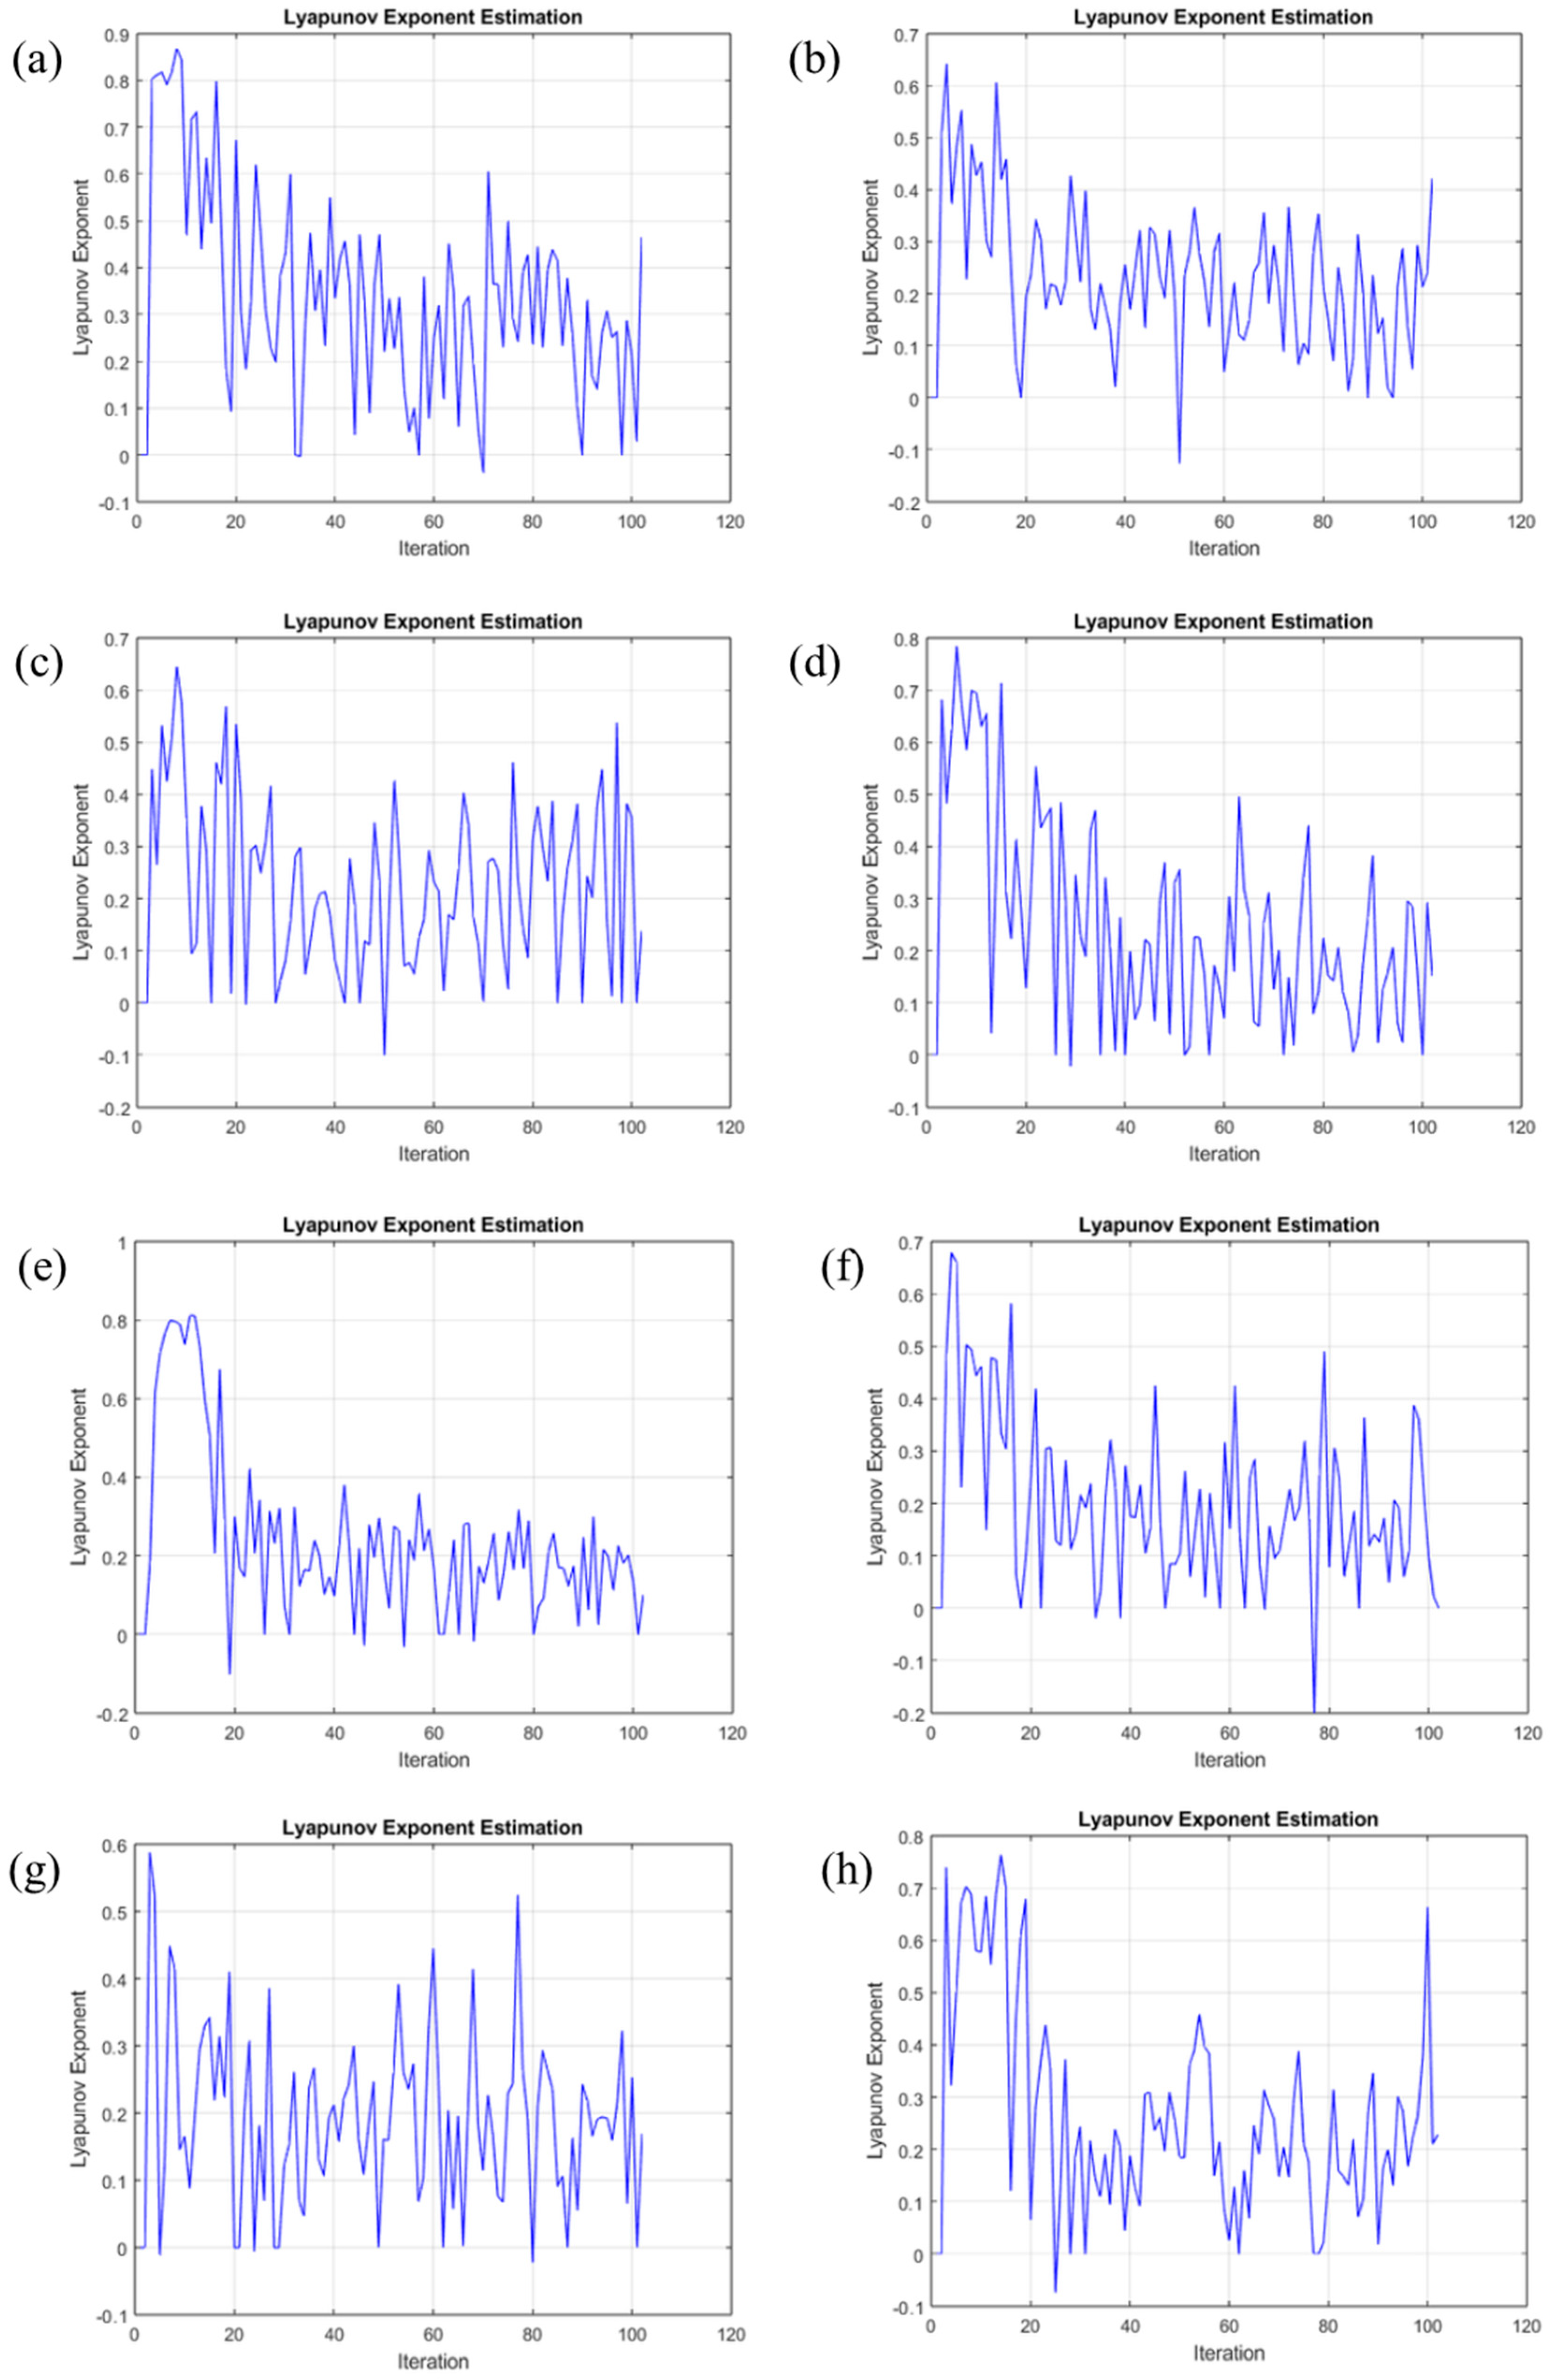
3.3.3. Average Lyapunov Exponent

A comprehensive analysis of the Lyapunov exponent was conducted, encompassing 100 distinct iterations. These repetitions were critical in fully understanding the Lyapunov exponent’s behavior in the examined system. Table 4 shows the results of the average Lyapunov exponent value.
The graphical representation of our data, as depicted in Figure 9, denotes the oscillations between each repetition. The dynamic character of the Lyapunov exponent and its sensitivity to the initial conditions are clearly illustrated in these graphical representations. Notably, most of the computed Lyapunov exponent values showed positive trends, indicating the system’s propensity for chaotic behavior. The graphical depiction visually explains the patterns and demonstrates our analytical technique’s success in capturing the underlying dynamics. This visual comprehension supplements the numerical data, promoting a comprehensive grasp of the complex interplay between the chaos, beginning circumstances, and the Lyapunov exponent.
Like the trend in Figure 9, the average results have positive values. The present sign is of the utmost importance, given that a positive Lyapunov exponent indicates that the system is chaotic. A value of 0 represents marginal stability. In contrast, a negative Lyapunov exponent suggests that the system is stable and predictable, as determined by Skokos et al. [28]. All values are positive yet close to 0, indicating moderate chaos in the system. The highest value corresponds to AA2024-0 sample, while the overall lowest value is present in the AA7075-2 sample. These mirror the correlation dimension results. Particularly for the AA2024 alloy, the lowest value corresponds to the AA2024-2 sample. In the AA7075 alloy samples, the highest values present are from the AA7075-3 sample (see Table 5).
Prior investigations by Bahena et al. [12] and García et al. [6] have documented distinct correlation patterns between the Lyapunov exponent values and corrosion mechanisms. Specifically, these studies established that Lyapunov exponent values below 0.2 indicate localized corrosion processes. In cases where the Lyapunov exponent falls within the range of 0.2 to 0.4, it aligns with mixed corrosion processes. Lyapunov exponent values exceeding 0.4 have been consistently associated with generalized corrosion phenomena. These empirical observations, drawn from previous research, serve as a valuable reference framework for interpreting our Lyapunov exponent results in the context of corrosion behavior.
Only the AA7075-1 and AA7075-2 samples presented values of localized corrosion, and this behavior is associated with the heterogenous surface that prophecies the localization of the electrochemical process. The rest of the samples presented values that are associated with mixed corrosion, meaning that two processes occur on the surface, localized and general corrosion, when one of the two processes predominates in the system.

4. Discussion

In a different study, the authors commented that adding tartaric did not affect the morphology of the anodized surface when AA2024 was anodized [56]. In this research, the anodized morphology changed when the percentages of sulfuric and phosphoric acids changed; tartaric acid did not influence the change in the morphology.
The increase in the phosphoric acid concentration provoked the development of an anodic layer with a heterogeneous distribution. This behavior is explained by Surganov et al. [57], who state that the anodic nucleation occurs in aluminum’s intergranular boundaries. So, the increases in the concentrations of sulfuric and phosphoric acids influence the velocity of the anodized generation.
Ma et al. [58] related the presence of tartaric acid to a selective dissolution of the anodic film, and this behavior was observed in the PSD analysis when almost all of the samples presented localized corrosion. Also, the results of the Lyapunov coefficients show mixed corrosion; the morphologies of the anodized samples induced a predominance of the localized process.
Different authors have mentioned the difficulty of determining the corrosion process that occurs on some materials’ surfaces; for that reason, it is important to apply different methods [27,46,56,58,59,60,61,62,63,64,65]. This research showed that methods such as HHT and the Lyapunov exponent are good options to determine the type of corrosion on the material’s surface. However, complementation with a PSD analysis is necessary to determine the corrosion kinetic. Suppose the HHT and Lyapunov constant are very efficient. In that case, those methods are semiqualitative and do not help to calculate the corrosion kinetic, which can be studied via noise impedance (Zn).
The increased concentrations of sulfuric acid and phosphoric acid increased the corrosion resistance. That can be associated with a better creation of the oxide layer, and those acids helped to nucleate the anodized process faster.
To interpret the findings, let us first consider the directional sign of the Lyapunov exponent. As previously mentioned, the results all present marginal instability, given that they are close to a trajectory where they persist in a state of constancy within the phase space but not yet fully, presenting slight divergencies and converging in certain points, and indicating that there is indeed chaotic behavior present, although on the lower side.
It was expected that the AA2024-0 and AA7075-0 samples should have had higher degrees of chaos, given that both were untreated and thus should have been more susceptible to corrosive attack from the electrochemical nose. This belief was correct for the AA2024-0 sample but not for AA7075-0; instead, the highest Lyapunov exponent for the AA7075 alloys corresponded to the AA7075-3 sample, although it was very similar to the AA7075-0 sample.
Revisiting the documented relationship between the corrosion mechanisms and the LE, we can establish that our results fell well within the ranges that they presented, corroborating the reported associations. The AA2024-0 and AA7075-2 samples exhibited localized corrosion; in contrast, the AA2024-1, AA2024-2, AA2024-3, AA7075-0, and AA7075 samples displayed corrosion profiles indicative of mixed corrosion, albeit with notable inclinations toward localized corrosion tendencies. AA2024-0 also demonstrated the highest value of mixed corrosion behavior. Our findings not only reaffirm the significance of the Lyapunov exponent but also extend its applicability to corrosion behavior classification, furnishing a valuable analytical tool for understanding and predicting corrosion dynamics [66,67,68].
Shifting our gaze into the correlation dimension results, we established that all given values identified within our analysis lean towards the lower end of the spectrum. This propensity for low correlation dimensions infers that the underlying attractor governing the system’s dynamics exhibits a relatively simplified configuration. Extending our insights into the context of previous studies, the works of Xia, Shi, Wang, Ma, and their contemporaries [25,54,69,70] offer significant resonance as they observed that low correlation dimensions can be attributed to a passivation process. Given the experimental conditions employed, this phenomenon aligns with the expectations for our anodized aluminum alloy samples. Throughout the testing period, the surfaces of these samples were consistently exposed to a corrosive environment of NaCl, known for its aggressive nature. Under such conditions, even minor defects in the protective oxide film can invoke a remarkable self-repair mechanism [71]. This mechanism effectively regenerates and restores the oxide layer, thus acting as a robust barrier against further corrosion. This ‘passivation’ process, which our findings seem to corroborate, plays a pivotal role in preventing the samples from reaching the underlying aluminum substrate. It underscores the effectiveness of anodization as a corrosion mitigation strategy. It underscores the intricate dynamics at play within the corrosion process. Birbilis and authors [72,73] investigated the effect of wetting time on aluminum alloys on localized corrosion in a dynamic seawater/air interface zone using electrochemical measurements, SEM, XRD, and XPS. The results indicate that a longer wetting time results in a more intense degree of localized corrosion, leading to an uneven and incomplete corrosion product film.

5. Conclusions

  • The result indicated that the AA2024-0, AA2024-1, and AA2024-2 samples and the AA7075-2 and AA7075-3 samples exhibit mixed corrosion via the Lyapunov constant, with a notable inclination towards localized corrosion when analyzed using the PSD and HHT methods. The surface is not homogenous, and the corrosion process is predominately localized in specific zones.
  • In the analysis conducted using the PSD slope, only AA2024-2 presented a uniform corrosion value (−6); meanwhile, the rest of the samples presented values of localized corrosion.
  • The AA7075-3 sample presented the highest corrosion resistance (1667 Ω·cm2), and the AA2024-1 sample presented the lowest corrosion resistance with 132 Ω·cm2.
  • The AA2024-0 sample, in contrast, exhibited a lower correlation dimension, implying less complex or self-replicating corrosion processes. This potentially indicates a more uniform or straightforward corrosion behavior, which may contribute to localized corrosion tendencies. The result obtained using the HHT method matched the result obtained using the correlation dimension.
  • Among the AA7075 alloy samples, it is noteworthy that only the AA7075-1 and AA7075-3 samples exhibited heightened passivity, as indicated by their higher correlation dimensions.
  • The successful application of the chaos theory in our study underscores its efficacy and capacity for an in-depth analysis of electrochemical noise results. It has proven to be instrumental in providing detailed insights into the nature and mechanisms of corrosion processes.

Author Contributions

Conceptualization, F.A.-C., C.M.-R. and C.G.-T.; methodology, C.M.-R., J.M.J.-M., D.N.-M., M.L.-B., J.C.-M. and L.D.L.-L.; data curation, F.A.-C., C.M.-R., J.M.J.-M., J.O.-C., I.C.-R., E.M.-B. and D.N.-M.; formal analysis, C.G.-T., L.D.L.-L., F.A.-C., C.M.-R., J.O.-C. and J.M.J.-M.; writing—review and editing, F.A.-C., C.M.-R., J.M.J.-M. and C.G.-T. All authors have read and agreed to the published version of the manuscript.

Funding

This research was funded by the Universidad Autónoma del Estado de Hidalgo.

Data Availability Statement

Not applicable.

Acknowledgments

The authors acknowledge the Academic Body UANL—CA-316 “Deterioration and integrity of composite materials”.

Conflicts of Interest

The authors declare no conflict of interest.

References

  1. Okene, S.U.; Abdullahi, M.; Gana, A. Corrosion Improvement of AA7075 through Precipitation Hardness and Anodization. Mater. Today Proc. 2021, 38, 729–736. [Google Scholar] [CrossRef]
  2. Totten, G.; Tiryankioglu, M.; Kessler, O. Encyclopedia of Aluminum and Its Alloys; CRC Press: Boca Raton, FL, USA, 2018; ISBN 9781351045636. [Google Scholar]
  3. Campbell, F.C. Manufacturing Technology for Aerospace Structural Materials; Elsevier: Amsterdam, The Netherlands, 2006; pp. 1–600. [Google Scholar] [CrossRef]
  4. Mouritz, A.P. Introduction to Aerospace Materials; Elsevier: Amsterdam, The Netherlands, 2012; ISBN 9781855739468. [Google Scholar]
  5. Acuña-González, N.; García-Ochoa, E.; González-Sánchez, J. Assessment of the Dynamics of Corrosion Fatigue Crack Initiation Applying Recurrence Plots to the Analysis of Electrochemical Noise Data. Int. J. Fatigue 2008, 30, 1211–1219. [Google Scholar] [CrossRef]
  6. García, E.; Hernández, M.A.; Rodríguez, F.J.; Genescá, J.; Boerio, F.J. Oscillation and Chaos in Pitting Corrosion of Steel. Corrosion 2003, 59, 50–58. [Google Scholar] [CrossRef]
  7. Markworth, A.J.; Stringer, J.; Rollins, R.W. Deterministic Chaos Theory and Its Applications to Materials Science. MRS Bull. 1995, 20, 20–28. [Google Scholar] [CrossRef]
  8. Rosenstein, M.T.; Collins, J.J.; De Luca, C.J. A Practical Method for Calculating Largest Lyapunov Exponents from Small Data Sets. Phys. D Nonlinear Phenom. 1993, 65, 117–134. [Google Scholar] [CrossRef]
  9. Terada, M.; Queiroz, F.M.; De Aguiar, D.B.D.S.; Ayusso, V.H.; Costenaro, H.; Olivier, M.; De Melo, H.G.; Costa, I. Corrosion resistance of tartaric-sulfuric acid anodized AA2024-T3 sealed with Ce and protected with hybrid sol–gel coating. Surf. Coat. Technol. 2019, 372, 422–426. [Google Scholar] [CrossRef]
  10. Bensalah, W.; Elleuch, K.; Feki, M.; Depetris-Wery, M.; Ayedi, H.F. Optimization of Tartaric/Sulphuric Acid Anodizing Process Using Doehlert Design. Surf. Coat. Technol. 2012, 207, 123–129. [Google Scholar] [CrossRef]
  11. Cottis, R.A. Interpretation of Electrochemical Noise Data. Corrosion 2001, 57, 265–285. [Google Scholar] [CrossRef]
  12. Bahena, D.; Rosales, I.; Sarmiento, O.; Guardián, R.; Menchaca, C.; Uruchurtu, J. Electrochemical Noise Chaotic Analysis of NiCoAg Alloy in Hank Solution. Int. J. Corros. 2011, 2011, 491564. [Google Scholar] [CrossRef]
  13. Critchlow, G.W.; Yendall, K.A.; Bahrani, D.; Quinn, A.; Andrews, F. Strategies for the Replacement of Chromic Acid Anodising for the Structural Bonding of Aluminium Alloys. Int. J. Adhes. Adhes. 2006, 26, 419–453. [Google Scholar] [CrossRef]
  14. Idusuyi, N.; Fayomi, O.S. Performance Study of Aluminium–Zinc Anode using Noise Resistance, Pitting Index and Recurrence Plots from Electrochemical Noise Data. J. Bio Tribo Corros. 2021, 7, 56. [Google Scholar] [CrossRef]
  15. Martínez-Viademonte, M.P.; Abrahami, S.T.; Hack, T.; Burchardt, M.; Terryn, H. A Review on Anodizing of Aerospace Aluminum Alloys for Corrosion Protection. Coatings 2020, 10, 1106. [Google Scholar] [CrossRef]
  16. Men, H.; Sun, B.; Zhao, X.; Li, X.; Liu, J.; Xu, Z. Dynamics of Stainless Steel Corrosion Based on the Theory of Phase Space Reconstruction and Chaos. Anti-Corrosion Methods Mater. 2016, 63, 214–225. [Google Scholar] [CrossRef]
  17. Jaume, J.; Marques, M.J.F.; Délia, M.L.; Basséguy, R. Surface modification of 5083 aluminum-magnesium induced by marine microorganisms. Corros. Sci. 2022, 194, 109934. [Google Scholar] [CrossRef]
  18. Vignoli Machado, T.; Atz Dick, P.; Knörnschild, G.H.; Dick, L.F.P. The effect of different carboxylic acids on the sulfuric acid anodizing of AA2024. Surf. Coat. Technol. 2020, 383, 125283. [Google Scholar]
  19. Del Olmo, R.; Mohedano, M.; Visser, P.; Matykina, E.; Arrabal, R. Flash-PEO coatings loaded with corrosion inhibitors on AA2024. Surf. Coat. Technol. 2020, 402, 126317. [Google Scholar]
  20. Ofoegbu, S.U.; Fernandes, F.A.; Pereira, A.B. The sealing step in aluminum anodizing: A focus on sustainable strategies for enhancing both energy efficiency and corrosion resistance. Coatings 2020, 10, 226. [Google Scholar]
  21. Attolico, M.A.; Casavola, C.; Moramarco, V.; Renna, G.; Furfari, D.; Buss, D. Influence of tartaric-sulfuric acid anodic film on four-point bending fatigue behavior of AA 7050-T7451 samples. Fatigue Fract. Eng. Mater. Struct. 2022, 45, 3716–3730. [Google Scholar] [CrossRef]
  22. Greisiger, H.; Schauer, T. On the Interpretation of the Electrochemical Noise Data for Coatings. Prog. Org. Coatings 2000, 39, 31–36. [Google Scholar] [CrossRef]
  23. Mubarok, M.; Sutarno, W.; Wahyudi, S. Effects of Anodizing Parameters in Tartaric-Sulphuric Acid on Coating Thickness and Corrosion Resistance of Al 2024 T3 Alloy. J. Miner. Mater. Charact. Eng. 2015, 3, 3. [Google Scholar] [CrossRef]
  24. Obot, I.B.; Onyeachu, I.B.; Zeino, A.; Umoren, S.A. Electrochemical Noise (EN) Technique: Review of Recent Practical Applications to Corrosion Electrochemistry Research. J. Adhes. Sci. Technol. 2019, 33, 1453–1496. [Google Scholar]
  25. Xia, D.; Shi, S.; Behnamian, Y.; Hu, W.; Cheng, Y.F.; Luo, J.; Huet, F. Review—Electrochemical Noise Applied in Corrosion Science: Theoretical and Mathematical Models towards Quantitative Analysis. J. Electrochem. Soc. 2020, 167, 081507. [Google Scholar] [CrossRef]
  26. Xia, D.H.; Song, S.Z.; Behnamian, Y. Detection of Corrosion Degradation Using Electrochemical Noise (EN): Review of Signal Processing Methods for Identifying Corrosion Forms. Corros. Eng. Sci. Technol. 2016, 51, 527–544. [Google Scholar] [CrossRef]
  27. Chen, A.; Cao, F.; Liao, X.; Liu, W.; Zheng, L.; Zhang, J.; Cao, C. Study of Pitting Corrosion on Mild Steel during Wet–Dry Cycles by Electrochemical Noise Analysis Based on Chaos Theory. Corros. Sci. 2013, 66, 183–195. [Google Scholar] [CrossRef]
  28. Skokos, C.; Gottwald, G.A.; Laskar, J. Erratum to: Chaos Detection and Predictability; Skokos, C., Gottwald, G.A., Laskar, J., Eds.; Lecture Notes in Physics; Springer: Berlin/Heidelberg, Germany, 2016; p. 915. ISBN 978-3-662-48408-1. [Google Scholar]
  29. Jirón-Lazos, U.; Corvo, F.; De la Rosa, S.C.; García-Ochoa, E.M.; Bastidas, D.M.; Bastidas, J.M. Localized Corrosion of Aluminum Alloy 6061 in the Presence of Aspergillus Niger. Int. Biodeterior. Biodegrad. 2018, 133, 17–25. [Google Scholar] [CrossRef]
  30. Stringer, J.; Markworth, A.J. Applications of Deterministic Chaos Theory to Corrosion. Corros. Sci. 1993, 35, 751–760. [Google Scholar] [CrossRef]
  31. Bertocci, U.; Gabrielli, C.; Huet, F.; Keddam, M.; Rousseau, P. Noise Resistance Applied to Corrosion Measurements: II. Experimental Tests. J. Electrochem. Soc. 1997, 144, 37–43. [Google Scholar] [CrossRef]
  32. ASTM E3-95; Standard Practice for Preparation of Metallographic Specimens. ASTM International: West Conshohocken, PA, USA, 1995.
  33. ASTM E-407-16; Standard Practice for Microetching Metals and Alloys. ASTM International: West Conshohocken, PA, USA, 2016.
  34. Villegas-Tovar, J.; Gaona-Tiburcio, C.; Lara-Banda, M.; Maldonado-Bandala, E.; Baltazar-Zamora, M.A.; Cabral-Miramontes, J.; Nieves-Mendoza, D.; Olguin-Coca, J.; Estupiñan-Lopez, F.; Almeraya-Calderón, F. Electrochemical Corrosion Behavior of Passivated Precipitation Hardening Stainless Steels for Aerospace Applications. Metals 2023, 13, 835. [Google Scholar] [CrossRef]
  35. ASTM G199-09; Standard Guide for Electrochemical Noise Measurement. ASTM International: West Conshohocken, PA, USA, 2020.
  36. Samaniego-Gámez, P.O.; Almeraya-Calderon, F.; Maldonado-Bandala, E.; Cabral-Miramontes, J.; Nieves-Mendoza, D.; Olguin-Coca, J.; Lopez-Leon, L.D.; Silva Vidaurri, L.G.; Zambrano-Robledo, P.; Gaona-Tiburcio, C. Corrosion Behavior of AA2055 Aluminum-Lithium Alloys Anodized in the Presence of Sulfuric Acid Solution. Coatings 2021, 11, 1278. [Google Scholar] [CrossRef]
  37. Xia, D.H.; Behnamian, Y. Electrochemical noise: A review of experimental setup, instrumentation and DC removal. Russ. J. Electrochem. 2015, 51, 593–601. [Google Scholar] [CrossRef]
  38. Cerezo, H.R.; Tiburcio, C.G.; Miramontes, J.A.C.; Nieves-Mendoza, D.; Maldonado-Bandala, E.; Almeraya-Calderon, F. Electrochemical characterization of Al–Li alloys AA2099 and AA2055 for aeronautical applications: Effect of thermomechanical treatments. J. Solid State Electrochem. 2023, 27, 3101–3117. [Google Scholar] [CrossRef]
  39. Li, L.; Qiao, Y.; Zhang, L.; Ma, A.; Ma, R.; Zheng, Y. Understanding the Corrosion Behavior of Nickel–Aluminum Bronze Induced by Cavitation Corrosion Using Electrochemical Noise: Selective Phase Corrosion and Uniform Corrosion. Materials 2023, 16, 669. [Google Scholar] [CrossRef] [PubMed]
  40. Lentka, Ł; Smulko, J. Methods of Trend Removal in Electrochemical Noise Data—Overview. Measurement 2019, 131, 569–581. [Google Scholar] [CrossRef]
  41. Moradi, M.; Rezaei, M. Electrochemical noise analysis to evaluate the localized anti-corrosion properties of PP/graphene oxide nanocomposite coatings. J. Electroanal. Chem. 2022, 921, 116665. [Google Scholar] [CrossRef]
  42. Mehdipour, M.; Naderi, R.; Markhali, B.P. Electrochemical Study of Effect of the Concentration of Azole Derivatives on Corrosion Behavior of Stainless Steel in H2SO4. Prog. Org. Coatings 2014, 77, 1761–1767. [Google Scholar] [CrossRef]
  43. Coakley, J.; Vorontsov, V.A.; Littrell, K.C.; Heenan, R.K.; Ohnuma, M.; Jones, N.G.; Dye, D. Nanoprecipitation in a Beta-Titanium Alloy. J. Alloys Compd. 2015, 623, 146–156. [Google Scholar] [CrossRef]
  44. Kroll, R.; Kearns, P.; Usman, B.J.; Zhou, X.; Engelberg, D.L. A novel approach to determine cathodic passivation characteristics and semiconducting properties of pure aluminum 99.5 wt% and aluminum alloy 7075-T6 with an electrochemical pen electrode. Corros. Sci. 2023, 211, 110898. [Google Scholar] [CrossRef]
  45. Butler, J.A.V. Studies in Heterogeneous Equilibria. Part II.—The Kinetic Interpretation of the Nernst Theory of Electromotive Force. Trans. Faraday Soc. 1924, 19, 729–733. [Google Scholar] [CrossRef]
  46. Lafront, A.M.; Safizadeh, F.; Ghali, E.; Houlachi, G. Study of the Copper Anode Passivation by Electrochemical Noise Analysis Using Spectral and Wavelet Transforms. Electrochim. Acta 2010, 55, 2505–2512. [Google Scholar] [CrossRef]
  47. Jáquez-Muñoz, J.M.; Gaona-Tiburcio, C.; Méndez-Ramírez, C.T.; Baltazar-Zamora, M.Á.; Estupinán-López, F.; Bautista-Margulis, R.G.; Cuevas-Rodríguez, J.; los Rios, J.P.F.-D.; Almeraya-Calderón, F. Corrosion of Titanium Alloys Anodized Using Electrochemical Techniques. Metals 2023, 13, 476. [Google Scholar] [CrossRef]
  48. Bertocci, U.; Huet, F. Noise Analysis Applied to Electrochemical Systems. Corrosion 1995, 51, 131–144. [Google Scholar] [CrossRef]
  49. Oliveira, N.T.C.; Guastaldi, A.C. Electrochemical Stability and Corrosion Resistance of Ti–Mo Alloys for Biomedical Applications. Acta Biomater. 2009, 5, 399–405. [Google Scholar] [CrossRef]
  50. Adamek, G.; Pałka, K.; Jakubowicz, J. Corrosion Properties of Ti Scaffolds Prepared with Sucrose as a Space Holder. Solid. State Phenom. 2015, 227, 519–522. [Google Scholar] [CrossRef]
  51. Seah, K.H.W.; Thampuran, R.; Teoh, S.H. The Influence of Pore Morphology on Corrosion. Corros. Sci. 1998, 40, 547–556. [Google Scholar] [CrossRef]
  52. Homborg, A.M.; Cottis, R.A.; Mol, J.M.C. An Integrated Approach in the Time, Frequency and Time-Frequency Domain for the Identification of Corrosion Using Electrochemical Noise. Electrochim. Acta 2016, 222, 627–640. [Google Scholar] [CrossRef]
  53. Strogatz, S.; Friedman, M.; Mallinckrodt, A.J.; McKay, S. Nonlinear Dynamics and Chaos: With Applications to Physics, Biology, Chemistry, and Engineering. Comput. Phys. 1994, 8, 532. [Google Scholar] [CrossRef]
  54. Xia, D.; Shi, S.; Wang, J.; Shi, J.; Bi, H.; Gao, Z. Determination of corrosion types from electrochemical noise by phase space reconstruction theory. Electrochem. Commun. 2012, 15, 88–92. [Google Scholar] [CrossRef]
  55. Kennel, M.B.; Brown, R.; Abarbanel, H.D.I. Determining Embedding Dimension for Phase-Space Reconstruction Using a Geometrical Construction. Phys. Rev. A 1992, 45, 3403. [Google Scholar] [CrossRef]
  56. Curioni, M.; Skeldon, P.; Koroleva, E.; Thompson, G.E.; Ferguson, J. Role of Tartaric Acid on the Anodizing and Corrosion Behavior of AA 2024 T3 Aluminum Alloy. J. Electrochem. Soc 2009, 156, C147. [Google Scholar] [CrossRef]
  57. Surganov, V.F.; Gorokh, G.G. Anodic Oxide Cellular Structure Formation on Aluminum Films in Tartaric Acid Electrolyte. Mater. Lett. 1993, 17, 121–124. [Google Scholar] [CrossRef]
  58. Ma, Y.; Zhou, X.; Liao, Y.; Chen, X.; Zhang, C.; Wu, H.; Wang, Z.; Huang, W. Effect of Anodizing Parameters on Film Morphology and Corrosion Resistance of AA2099 Aluminum-Lithium Alloy. J. Electrochem. Soc. 2016, 163, C369–C376. [Google Scholar] [CrossRef]
  59. Li, J.; Du, C.W.; Liu, Z.Y.; Li, X.G.; Liu, M. Effect of Microstructure on the Corrosion Resistance of 2205 Duplex Stainless Steel. Part 2: Electrochemical Noise Analysis of Corrosion Behaviors of Different Microstructures Based on Wavelet Transform. Constr. Build. Mater. 2018, 189, 1294–1302. [Google Scholar] [CrossRef]
  60. Jáquez-Munõz, J.M.; Gaona-Tiburcio, C.; Cabral, J.A.; Lara-Banda, M.; Estupinãn-López, F.H.; Zambrano, P.; Almeraya-Calderón, F. Corrosion Behavior of Titanium Alloys Using Electrochemical Noise. ECS Trans. 2021, 101, 167. [Google Scholar] [CrossRef]
  61. Arellano-Pérez, J.H.; Escobar-Jiménez, R.F.; Granados-Lieberman, D.; Gómez-Aguilar, J.F.; Uruchurtu-Chavarín, J.; Alvarado-Martínez, V.M. Electrochemical Noise Signals Evaluation to Classify the Type of Corrosion Using Synchrosqueezing Transform. J. Electroanal. Chem. 2019, 848, 113249. [Google Scholar] [CrossRef]
  62. Jáquez-Muñoz, J.M.; Gaona-Tiburcio, C.; Cabral-Miramontes, J.; Nieves-Mendoza, D.; Maldonado-Bandala, E.; Olguín-Coca, J.; Estupinán-López, F.; López-León, L.D.; Chacón-Nava, J.; Almeraya-Calderón, F. Frequency Analysis of Transients in Electrochemical Noise of Superalloys Waspaloy and Ultimet. Metals 2021, 11, 702. [Google Scholar] [CrossRef]
  63. Xia, D.; Mao, Y.; Zhu, Y.; Yuan, Q.; Deng, C.; Hu, W. A novel approach used to study the corrosion susceptibility of metallic materials at a dynamic seawater/air interface. Corros. Commun. 2022, 6, 62–66. [Google Scholar] [CrossRef]
  64. Ji, Y.; Xu, Y.; Zhang, B.; Behnamian, Y.; Xia, D.; Hu, W. A review of micro-scale and atomic-scale corrosion mechanisms of the second phases in aluminum alloys. Trans. Nonferrous Met. Soc. China 2021, 31, 3205–3227. [Google Scholar] [CrossRef]
  65. Jaquez-Muñoz, J.; Gaona-Tiburcio, C.; Lira-Martinez, A.; Zambrano-Robledo, P.; Maldonado-Bandala, E.; Samaniego-Gamez, O.; Nieves-Mendoza, D.; Olguin-Coca, J.; Estupiñan-Lopez, F.; Almeraya-Calderon, F. Susceptibility to Pitting Corrosion of Ti-CP2, Ti-6Al-2Sn-4Zr-2Mo, and Ti-6Al-4V Alloys for Aeronautical Applications. Metals 2021, 11, 1002. [Google Scholar] [CrossRef]
  66. Verro, V.; Di Franco, F.; Zaffora, A.; Santamaria, M. Enhancing corrosion resistance of anodized AA7075 alloys by electrodeposition of superhydrophobic coatings. Colloids Surf. A Physicochem. Eng. Asp. 2023, 675, 132040. [Google Scholar] [CrossRef]
  67. Wallot, S.; Mønster, D. Calculation of Average Mutual Information (AMI) and False-Nearest Neighbors (FNN) for the estimation of embedding parameters of multidimensional time series in Matlab. Front. Psychol. 2019, 9, 1679. [Google Scholar] [CrossRef]
  68. Wolf, A.; Swift, J.B.; Swinney, H.L.; Vastano, J.A. Determining Lyapunov exponents from a time series. Phys. D Nonlinear Phenom. 1985, 16, 285–317. [Google Scholar] [CrossRef]
  69. Xia, D.; Shi, J.; Gong, W.; Rong-Ji, Z.; Gao, Z.; Wang, J. The Significance of Correlation Dimension Obtained from Electrochemical Noise. Electrochemistry 2012, 80, 907–912. [Google Scholar] [CrossRef]
  70. Ma, C.; Wang, Z.; Behnamian, Y.; Gao, Z.; Wu, Z.; Qin, Z.; Xia, D.H. Measuring atmospheric corrosion with electrochemical noise: A review of contemporary methods. Measurement 2019, 138, 54–79. [Google Scholar] [CrossRef]
  71. Cabral-Miramontes, J.; Gaona-Tiburcio, C.; Estupinán-López, F.; Lara-Banda, M.; Zambrano-Robledo, P.; Nieves-Mendoza, D.; Maldonado-Bandala, E.; Chacón-Nava, J.; Almeraya-Calderón, F. Corrosion Resistance of Hard Coat Anodized AA 6061 in Citric–Sulfuric Solutions. Coatings 2020, 10, 601. [Google Scholar] [CrossRef]
  72. Xia, D.; Ji, Y.; Zhang, R.; Mao, Y.; Behnamian, Y.; Hu, W.; Birbilis, N. On the localized corrosion of AA5083 in a simulated dynamic seawater/air interface—Part 1: Corrosion initiation mechanism. Corros. Sci. 2023, 213, 110985. [Google Scholar] [CrossRef]
  73. Deng, C.M.; Xia, D.; Zhang, R.; Behnamian, Y.; Hu, W.; Birbilis, N. On the localized corrosion of AA5083 in a simulated dynamic seawater/air interface—Part 2: Effects of wetting time. Corros. Sci. 2023, 221, 111367. [Google Scholar] [CrossRef]
Figure 1. Diagram of anodizing process.
Metals 13 01850 g001
Figure 2. Electrochemical noise—conventional three-electrode cell system.
Metals 13 01850 g002
Figure 3. SEM-BES micrograph of anodized alloys: (a) AA2024-1, (b) AA2024-2, and (c) AA2024-3.
Metals 13 01850 g003
Figure 4. SEM-BES micrograph of anodized alloys: (a) AA7075-1, (b) AA7075-2, and (c) AA7075-3.
Metals 13 01850 g004
Figure 5. PSD in current for (a) AA2024 and its anodized sample; (b) AA7075 and its anodized sample exposed to NaCl at 3.5%.
Metals 13 01850 g005
Figure 6. Noise impedance for (a) AA2024 and its anodized samples; (b) AA7075 and its anodized samples exposed to NaCl at 3.5%.
Metals 13 01850 g006
Figure 7. Hilbert spectra for (a) AA2024-0, (b) AA2024-1, (c) AA2024-2, and (d) AA2024-3 exposed to NaCl at 3.5%.
Metals 13 01850 g007
Figure 8. Hilbert spectra for (a) AA2024-0, (b) AA2024-1, (c) AA2024-2, and (d) AA2024-3 exposed to NaCl at 3.5%.
Metals 13 01850 g008
Figure 9. Lyapunov exponent of the EN signals over 100 iterations. (a) AA2024-0, (b) AA2024-1, (c) AA2024-2, (d) AA2024-3, (e) AA7075-0, (f) AA7075-1, (g) AA7075-2, and (h) AA7075-3 exposed to NaCl at 3.5%.
Metals 13 01850 g009
Table 1. Chemical compositions of AA2024 and AA7075 (wt.%).
AlloysCuZnWFeCrMnPbAl
AA20244.320.174--0.2420.0490.4870.0022Balance
AA70751.725.610.270.1940.1660.036--Balance
Table 2. Process parameters of the anodizing electrolytes and nomenclature of the anodized samples.
AlloysAnodizing Electrolytes (%)Voltage (V)Time (min)SealingNomenclature
H2SO4H3PO4C4H6O6
AA2024------AA2024-0
5552025Deionized water at 90 ± 2 °C
for 30 min
AA2024-1
7.5510AA2024-2
7.5105AA2024-3
AA7075------AA7075-0
5552025Deionized water at 90 ± 2 °C
for 30 min
AA7075-1
7.5510AA7075-2
7.5105AA7075-3
Table 3. Parameters obtained via PSD.
NaCl
SampleΨ0 (dBi)Β (dB [A])Zn0 (Ω·cm2)
AA2024-0−99−13136
AA2024-1−93−9132
AA2024-2−108−6390
AA2024-3−102−8364
AA7075-0−84−1060
AA7075-1−102−7164
AA7075-2−108−8477
AA7075-3−88−91677
Table 4. Correlation dimension values of AA2024 and AA7075 samples.
AA2024AA7075
Samples01230123
Correlation Dimension0.3390.2290.2240.2470.2380.1990.1950.265
Table 5. Average Lyapunov exponent for AA2024 and AA7075 samples.
AA2024AA7075
Samples01230123
LE Average0.3390.2290.2240.2470.2380.1990.1950.265
Disclaimer/Publisher’s Note: The statements, opinions and data contained in all publications are solely those of the individual author(s) and contributor(s) and not of MDPI and/or the editor(s). MDPI and/or the editor(s) disclaim responsibility for any injury to people or property resulting from any ideas, methods, instructions or products referred to in the content.

