Article

Finite Element Method in L-PBF of Ti-6Al-4V: Influence of Laser Power and Scan Speed on Residual Stress and Part Distortion

Dipartimento di Ingegneria, Università degli Studi di Palermo, 90128 Palermo, Italy
*
Author to whom correspondence should be addressed.
Metals 2023, 13(11), 1907; https://doi.org/10.3390/met13111907
Submission received: 25 October 2023 / Revised: 14 November 2023 / Accepted: 17 November 2023 / Published: 19 November 2023
(This article belongs to the Section Additive Manufacturing)

Abstract

:
Laser powder bed fusion (L-PBF) is widely used in automotive, aerospace, and biomedical applications thanks to its ability to produce complex geometries. In spite of its advantages, parts produced with this technology can show distortion due to the residual stresses developed during the printing process. For this reason, numerical simulations can be used to predict thermal gradients and residual stresses that can result in part distortion. Thus, instead of performing experimental tests and using a trial and error approach, it is possible to use numerical simulation to save time and material. In this work, the effect of laser power and scan speed on residual stress and part distortion was analysed using a commercial finite element analysis (FEA) software DEFORM-3D™ with a layer-by-layer approach. Moreover, the accuracy of the numerical model with respect to process parameters and the utilised mesh was also studied. The results obtained from the numerical simulation were compared to the actual distortions to evaluate the accuracy of the FEM model. The predicted distortions using FEM analysis well fit the trend of the measured ones. The accuracy of the numerical model increases by considering a finer mesh.

1. Introduction

The use of additive manufacturing (AM) techniques is becoming increasingly common for the production of aerospace and medical components, which are often characterised by high and distinctive geometric complexity [1]. To adapt this form of production to large-scale commercial manufacturing, better predictability and control over the part qualities are required. Full simulations of the L-PBF process can help with this shift by providing information about the origins of defects and potential directions for improvement [2]. A common metallic additive manufacturing technique is laser powder bed fusion (L-PBF), which produces high-resolution components and allows for precise control of parts dimensions [3]. Components produced using metal additive manufacturing methods may exhibit significant residual stresses due to large heat gradients and quick solidification of molten powders [4]. This has the potential to cause undesirable distortions [5,6]. Limited research has been conducted in recent years to investigate the process mechanics and the role of the most important process parameters through numerical simulations. They are primarily concerned with the behaviour of the melt pool generated when the laser scans the powder bed, the microstructure that forms throughout the cooling and solidification process, and the part deformation and stress distribution. According to the existing literature, the simulation of L-PBF processes can be approached in three different ways: microscale based (i.e., microstructural evolution, mechanism of grain growth, and laser penetration), mesoscale based (i.e., melt pool dynamics, mechanism of pore formation), and macroscale based (i.e., residual stresses and distortions study, temperature profile detection). Peter S. et al. [7], using commercial Computational Fluid Dynamics (CFD) software, performed CFD simulations of selective laser melted Ti6Al4V components. They employed a graded multi-grid mesh to attain computational efficiency. They determined the absorption of Ti-6Al-4V during laser powder bed fusion by calibrating simulation versus experiment. The results accord with the absorptivity of Ti-6Al-4V recorded in other laser operations such as welding. Using a powder-free approach and Fourier’s heat conduction model with a moving laser heat source, Dutta et al. [8] examined the thermal characteristics of Ti-6Al-4V material subjected to the SLM process, including peak temperature, temperature-distribution curvature, pulse time, optical penetration depth, time of laser exposure, and laser absorption radius. The thermo-metallurgical-mechanical coupling model developed by Tan et al. [9] using the finite element method (FEM) in the ANSYS parametric design language, was used to predict temperature, solid-state phase, and residual stress fields for the multi-track multi-layer selective laser melting process of Ti-6Al-4V. The model considers the solid-state phase transformation and powder–liquid–solid transition, which includes melting, vaporization, solidification, shrinkage, and cooling phenomena. Song et al. [10] employ the ABAQUS AM module to simulate the selective laser melting process to enable process modelling of complicated 3D components and provide an automated interface that allows the user to define event data, such as element activation and heat input, as a function of both position and time. They determined that the automated AM module is a useful tool for investigating the effects of geometry, material qualities, and process parameters on distortion and residual stresses. Ali et al. [11] used ABAQUS to carry out a finite element simulation of the process to investigate the impact of the scanning and rescanning approach on residual stress production and mechanical characteristics of SLM Ti6Al4V components in order to understand the fundamental physics of the process. Jagatheeshkumar et al. [12] performed, in Ansys Additive Print software, numerical simulations of thin-walled Ti-6Al-4V geometries built using the L-PBF process. They computed residual stresses and distortions by varying the process parameters. They found that the numerical predictions of both residual stresses and distortions match with the corresponding experimental results with a deviation for residual stress of 3.3–20.4% and for maximum distortion of 5%. Liu et al. [13] reviewed the literature studies on the formation of residual stresses in additive manufacturing, the influence of various process parameters, and the modelling techniques for predicting residual stresses. They highlighted gaps and research opportunities in the areas of residual stress optimization, in additive manufacturing processes. Gan et al. [14] established a simulation model of the Ti-6Al-4V lattice structures during laser powder bed fusion (LPBF) based on the inherent strain method and studied the effects of geometric lattice parameters on residual deformation and stress. They emphasised that the effects of supports on residual deformation and stresses cannot be ignored. The effect of support on residual stress and deformation needs to be investigated. Based on the toolpath–mesh intersection approach, Li et al. [15] developed a thermo-mechanical framework to predict temperature evolutions, molten pool morphologies, and residual stresses of Ti-6Al-4V alloys in the L-PBF process. Based on the new plug-ins developed in the commercial code Abaqus 2020, a mesoscale numerical model was presented. They spoke about the effects of the laser power, process parameters, and mesh size. They emphasised that the suggested toolpath–mesh intersection approach can successfully predict the SLM process, but the grid size and incremental step of computation time have a significant impact on the simulation results, and further improving of the prediction accuracy requires additional investigation. Kaess et al. [16] studied the processes of residual stress and deformation development during laser powder bed fusion (L-PBF) of stainless steel 316L. To better understand the sources of residual stresses and distortion creation during manufacturing, numerical calculations were conducted using a finite element model at the scale of a few melt tracks and layers. They discovered that residual strains are strongly dependent on build plate preheating and energy per unit length, and that increasing build plate temperature and decreasing energy per unit length both result in reduced residual stresses. Bastola et al. [17] conducted a study of the literature on residual stress production in metal additive manufacturing. They underlined the need for numerical modelling in monitoring and forecasting the evolution of RS in metal AM with different process parameters. Ahmed et al. [18] investigated the generation of residual stresses in thin-walled structures using a thermomechanical computational simulation technique. They discovered that residual stresses reduce the effective elastic capabilities of the structures by 6% to 10%, while having no influence on the material’s effective plastic behaviour. Olleak et al. [19] used finite element modelling (FEM) to simulate additive manufacturing and predict the thermally induced residual stresses and distortion during the process or after the support-structure removal. They observed that FEM is computationally expensive without simplifying the boundary conditions and model assumptions and develop a thermomechanical model of the L-PBF process in two phases. The first one considers a 2D model to study yield strength, the temperature dependence of material properties, and layer thickness; in the second one, a framework is proposed, which addresses the computational expense of modelling from the meshing perspective. Promoppatum et al. [20] created a multiscale numerical model to investigate the influence of energy input and scanning length on residual stress reduction. The numerical model calls for a mesoscale model to disclose thermal histories and residual stress in a single layer, as well as a parametric analysis to create a process map that shows the relationship between the parameters of interest, the surface temperature rise, the cooling rate, and the residual stress. The mesoscale results enabled the creation of a macroscale model. Malmelöv et al. [21] simulated residual stresses in additive-manufactured alloy 625 samples using a thermo-mechanical finite element model. A mechanism-based material model, that accounts for microstructural and relaxation effects, was used to describe the elastoplastic behaviour of the material. Finally, Xiao et al. [22] employed the ANSYS indirect coupled thermal–structural analysis approach to investigate the interaction between process parameters and residual stress during Ti-6Al-4V SLM. The single-layer finite element model incorporated a conical moving heat source and temperature-dependent material characteristics.
As can be observed from the presented literature, each approach, i.e., microscale based, mesoscale based, and macroscale based, has distinct advantages and limitations with respect to the others. To the best author’s knowledge, in the literature there are usually studies presented where the model is validated considering only one process condition; in this way, it is not possible to evaluate the accuracy of the model by varying the process parameters such as the laser power and scan speed.
In this work, a part-scale modelling technique, using a commercial finite element analysis (FEA) software DEFORM-3D™ and using a Lagrangian implicit approach [23], was defined to investigate thermal stresses and distortions on Ti-6Al-4V components manufactured via L-PBF technology with varying laser power and feed rate. In order to save simulation time, the part-scale technique combines many actual layers into a single computational layer. After defining the numerical model, it was validated using experimental testing and fine-tuned with respect to mesh size. In order to acquire the actual geometries of the produced parts, a structured white-light object-digitization system was used. The comparison between the numerical prediction and the CAD model made it possible to evaluate the real distortions, thus using the proposed model as a process design tool.

2. Numerical Model

Printing parts via L-PBF processes can take dozens of hours, involving the deposition of hundreds of layers with a thickness between 30 and 100 µm. Furthermore, being the laser spot in the order of a few hundred microns, thousands or even millions of scans are needed to print the whole part. Considering all these factors and the current computational efficiency, it is nearly impossible to simulate the L-PBF processes without making some simplification of the real working conditions. In this study, a part-scale modelling approach has been adopted to study thermal stresses and distortions on Ti-6Al-4V parts produced with L-PBF technology. With the part-scale approach, a number of real layers are combined into one computational layer in order to reduce the simulation time. Moreover, an equivalent heat source is applied to the entire layer [24].
To further simplify the simulation model, powder bed is considered as a homogeneous, isotropic, and continuous media, and the thermal exchange is modelled indirectly on an equivalent heat-transfer condition. The commercial finite element analysis (FEA) software DEFORM-3D™ (V12.0, SFC, Columbus, OH, USA), Lagrangian implicit, was used to model the L-PBF process. The workpiece was modelled as an elasto-plastic object, and the platform was assumed to be rigid. This assumption is reasonable as the deformation of the plate is significantly lower than the deformation of the workpiece that is subjected to continuous thermal cycles.

2.1. Governing Equations

2.1.1. Thermal Analysis

In order to perform three-dimensional thermal analysis during the L-PBF process, according to a layer-by-layer model, the following balance equation can be considered (Equation (1)):
ρ c T t q = x   k x T x + y   k y T y + z   k z T z
where the product between the density ρ [kg/m3] and the specific heat c [J/kg °C] represents the heat capacity C; the thermal conductivities [W/m °C] along the x, y, and z directions are expressed as kx, ky, and kz, respectively; and q is the heat generated by the thermal source per unit volume within the part [W/m3] during the L-PBF process [25]. By considering T(x,y,z,t) = T0 as the initial condition (t = 0) for the thermal problem, the balance equation perpendicular to the surface being considered can be expressed as
k T n q + q c + q r = 0
where T0 is the build-chamber temperature equal to 40 °C, and n is the vector perpendicular to the surface.
Radiation is very low and can be neglected in thermal analysis without causing any significant errors [26]. To consider the thermal conduction between the printed part and the powder bed, Newton’s law was taken into account (Equation (3)):
q c o n d = h c o n d   T T p l a t e
where hcond is the conductive coefficient [W/m2 °C] between the part and the platform; T is the temperature of the part [°C]; and Tplate is the temperature of the plate [°C]. For the natural convection between the part and the surrounding gas, the following equation can be used (Equation (4)):
q c o n v = h c o n v   T T e n v  
In which, hconv is the convective coefficient [W/m2 °C] of the argon inert gas; T is the temperature of the part [°C]; and Tplate is the temperature of the plate [°C].

2.1.2. Mechanical Analysis

Because of the layer-by-layer deposition, high thermal gradient in L-PBF leads to the development of residual stress during the process, which eventually results in the distortion of the part. In order to evaluate the deformation, a simplified elastic-plastic hardening model can be adopted. In this way, the total strain vector can be expressed as (Equation (5))
ε = ε e + ε p + ε t
where {ε} is the total strain vector; {εe} is the elastic strain vector; {εp} is the plastic strain vector; and {εt} is the thermal strain vector. Considering an isotropic material and by using the constitutive equations from the theory of elasticity, the stress–strain relationship can be expressed as (Equations (6) and (7)):
ε x = 1 E   σ x ν σ y + σ z + ε x p + ε t                                                                                             ε y = 1 E   σ y ν σ x + σ z + ε y p + ε t                                                                                   ε z = 1 E   σ z ν σ x + σ y + ε z p + ε t                                                                                            
γ x y = τ x y 2 G + γ x y p ;   γ y z = τ y z 2 G + γ y z p ;   γ z x = τ z x 2 G + γ z x p
where the stresses along the x, y, and z directions are represented with σx, σy, and σz, respectively. γxy, γyz, γzx, instead, are the torsional deformation due to the tangential stresses within the plane XY, YZ, ZX, respectively. Finally, G, E, and ν are the shear modulus, the Young modulus and the Poisson’s ratio, respectively. Regarding the thermal strain, they can be calculated using the well-known expression as follows (Equation (8)):
ε t = α e T = α e T T r e f
In which, αe is the thermal expansion coefficient, function of the temperature T, and Tref is the temperature at the time t = 0 [27].

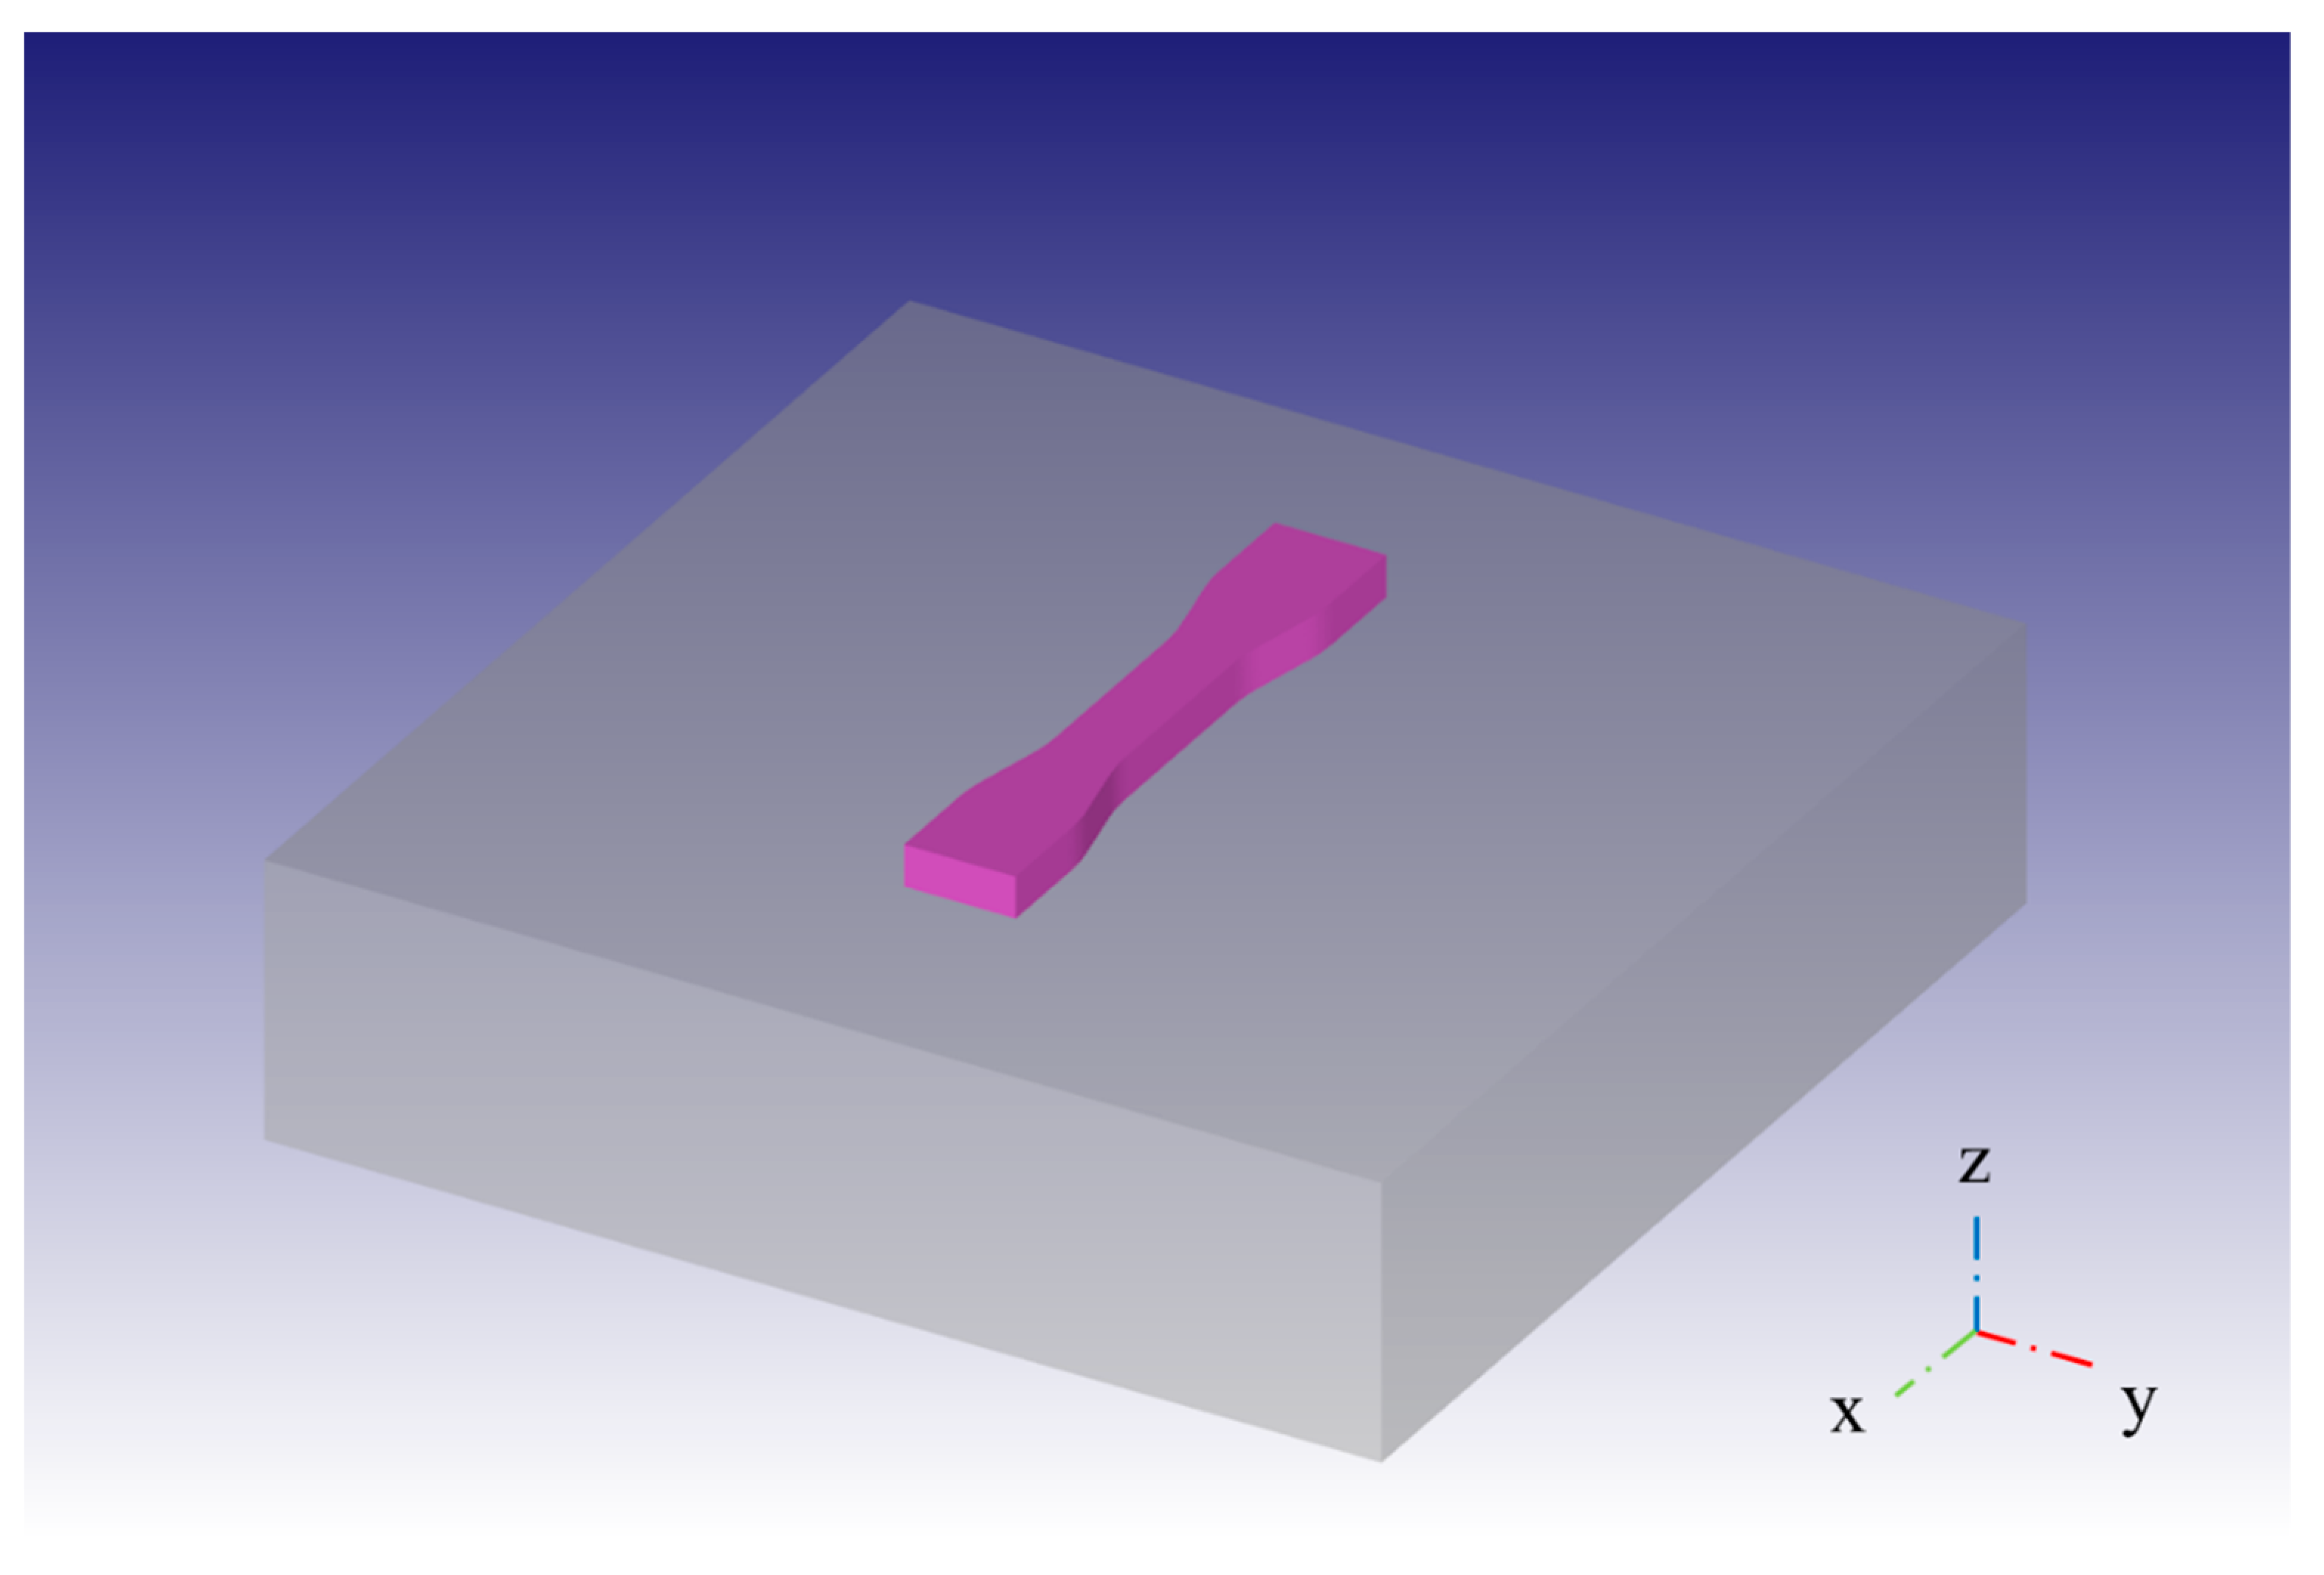
2.2. FEM Model for L-PBF

With the aim of investigating the temperature distribution and residual stresses generated during the L-PBF process, a layer-by-layer model was adopted during the numerical simulation within the FEA software DEFORM-3D™ v12.0 (V12.0, SFC, Columbus, OH, USA). Therefore, for each simulation step, the heat source is applied simultaneously to the entire layer. The elements are activated according to the born-dead-elements technique using the voxel mesh. The elements within the voxel mesh can be classified as active, inactive, and activated elements. At the beginning of the simulation process, the elements are all inactive and do not play any role in the computational analysis. For each time step, the elements affected by the power input are identified using a search algorithm and activated according to the powder deposition strategy defined by the user. In detail, by considering the interval Δt = tn+1 − tn, the melt pool will move from a starting position xn to the position xn+1 according to the scan strategy adopted. The volume affected by the heat source V p o o l t , h in the considered time step, also defined as heat-affected volume (HAV), can be represented as the sum of elemental cuboids as follows (Equation (9)):
V p o o l t , h = e H A V V ( e )
where V(e) can be expressed by the product of the cross-sectional area (lt × h) and the length (v × Δt), being lt the layer thickness, h the hatch spacing, v the scan speed, and Δt the considered time step. In this case, an equivalent heat source can be adopted with an average density distribution per unit of volume equal to (Equation (10))
q ˙ = η   P V p o o l
P being the laser power input and ƞ the energy absorption coefficient of the powder bed [28]. A dog-bone specimen with an external dimension of 46 × 8 × 3 mm3 was designed with Autodesk Fusion 360, and the STL file was imported within the numerical simulation software. The printed part being 3 mm high, and considering a layer thickness of 60 µm, it will result in 50 real layers. For the three-dimensional finite element model, 5 computational layers were used in this study, each one including 10 real layers. By using a voxel mesh of 0.4 × 0.4 × 0.15 mm3, four voxel mesh layers were included in the computational ones. The part was fixed to a base plate of 80 × 80 × 25 mm3 using sticking conditions (Figure 1).
The initial temperature of the platform was set at 200 °C, and the heat exchange with environment was defined through the convective coefficient of argon hconv = 1 W/m2 °C, and fixing the build chamber temperature at 40 °C. The same material was assigned for both the part and the plate. In detail, Ti-6Al-4V was used to simulate the printing process of the dog-bone specimen. The material properties used in this study are shown in Table 1.
The heat exchange was defined also for the specimen using the same parameters previously discussed for the heat exchange between the plate and the environment. In this study, in order to simplify the numerical model, the heat exchange with the powder bed was not considered. Concerning the powder bed thermal conductivity, a value between 0.2 W/m °C and 0.25 W/m °C is usually considered [30]. A Newton–Rapson iteration method together with a MUMPS (MUltifrontal Massively Parallel Sparse) solver were used to solve the thermomechanical problem. Regarding the process parameters, a deposition size of 0.1 mm along the X direction and 0.06 mm along the Z direction were used for the calculation of the equivalent heat source. The utilised voxel mesh was chosen in preliminary studies in order to have a good discretization along the z direction, and, considering that, for a layer-by-layer approach the voxel mesh size should be smaller than the layer dimension [24]. Two different meshes were used within the FEM model for the computational analysis: the first (M1) includes 413,488 elements and 78,580 nodes, and the finer (M2) consists of 782,566 elements and 144,581 nodes. Finally, the simulation time for the numerical model with mesh-type M2 was about 2 h 15 m, using a processor 12th Gen Intel (R) Core (TM) i9-12900 2.40 GHz, against an actual process time of approximately 8 h.

3. Experimental Details

In order to evaluate the impact of laser power (P) and scan speed (v) on residual stress and deformation in L-PBF of Ti-6Al-4V parts, five samples with different combinations of P and v (Table 2) were printed with an SLM280HL machine provided by SLM Solutions (SLM Solutions, Lubecca, Germany).
In Table 2, the linear energy-density value, equal to P/v, represents the input energy per unit length. This is a synthetic process parameter that mostly reflects laser parameters in the process.
Hatch distance (h), build orientation, layer thickness (lt), and scan strategy (s) were kept constant and equal to 100 µm, 0°, 60 µm 0°, and 0°, respectively. A build orientation equal to 0° was chosen to better evaluate part distortion. A scan strategy equal to 0°, where the scan vector remains with the same orientation between successive layers, was adopted to have more accuracy during the simulation by using a layer-by-layer approach.
Ti-6Al-4V gas-atomised spherical powder with a Gaussian size distribution of 20–63 µm and mass density of 4.43 g/cm3 were used in this study. The chemical composition of the powder is shown in Table 3. Dog-bone specimens with an external dimension of 46 × 8 × 3 mm3 and a cross-section of 5 × 3 mm2 were made as a reduction of the ASTM/E8.
The build chamber was filled with argon to reduce the oxygen level to 0.1%, while the build platform temperature was kept constant and equal to 200 °C to reduce thermal gradients and the amount of residual stress. After the part removal from the platform, a 3D COMET V system (Steinbichler, Neubeuern, Germany) was used to acquire the geometry of the sample to compare the printed part geometry with the original CAD model in order to quantitatively evaluate the part distortion (Figure 2). In detail, the difference along the z-direction (Δz) between the original CAD model and the acquired geometry after the printing process was used to quantify the distortion of the part. Moreover, the distortions obtained with the experimental analysis were compared with the predicted one by considering the displacement Δz of the top right corner of the object.
This 3D acquisition method is based on the fringe projection approach, which involves projecting a structured light pattern onto the object surface using a projection unit. The image acquisition unit records the picture of the fringe pattern, which is phase-modulated with the geometric aspects of the object. During the 3D scanning procedure, the printed specimens are put on a rotating table to collect data on component shape at various rotation angles. The point-cloud data sets are combined and meshed to generate a three-dimensional representation of the item.
In this way, it is possible to obtain a point-cloud image that can be converted to an STL file using a processing/analysis unit. This capture technique enables non-contact high-resolution 3D reconstruction.

4. Results

4.1. Accuracy of FEM Model to Predict the Part Distortion

First, the distortion Δz that the specimen experience was analysed. The comparison between the real distortion values, measured on the printed samples once detached from the printing plate, and the values predicted using the numerical model allowed for the assessment of the accuracy of the model with varying laser power and scanning speed. Regarding the experimental distortions, for each set of process parameters, three measurements were taken, one on each printing replica, and the reported values were presented as the average ± the standard deviation.
The accuracy of the numerical model was also evaluated with varying dimensions of the mesh used, according to the case studies previously defined (M1 and M2). Figure 3 displays the measured and predicted distortion Δz, taking into account the constant scanning-speed values of 1500 mm/s and the increasing laser power values.
The results show that using a finer mesh increases the accuracy of the numerical model. For mesh type M1, the accuracy of the model is poor and the results are only scarcely affected by the laser power variation. This causes a deviation between the simulated distortion values and the real ones between 34% and 39%. For mesh type M2, the accuracy of the numerical model increases significantly, ranging from a minimum of 1% for P = 300 W, a value of 11% for P = 350 W, and a maximum of 21% for P = 400 W. Moreover, a trend similar to the experimental one is found, as the distortion along the z axis first increases with laser powder and then decreases for the highest value considered in this study. It is worth noting that a maximum for the ID2 samples was observed because of the high thermal gradient along the building direction and the resulting residual stress profile as it will be better shown in the following. The trend of experimentally measured distortions compared to the simulated ones is shown in Figure 4 for constant laser power (equal to 350 W) and varying scanning speed. Also in this case, the accuracy of the numerical model is significantly improved in the case of a finer mesh, and the error remains quite constant for the different scanning-speed values taken into account.
Specifically, the error between the actual distortions and those simulated using the numerical model with mesh type M1 is between 35% and 39%, while the minimum error between the real and simulated distortions with the M2 type mesh model is 12% for a scanning speed of 1400 mm/s, 11% for a scanning speed of 1500 mm/s, and 17% for a scanning speed of 1600 mm/s.

4.2. FEM Simulation Results

Based on the previous observations, in the following only the results obtained with the M2 mesh are shown.
The results of FEM simulations with the finer mesh, in terms of temperature residual stress and distortion, are shown in Figure 5, Figure 6 and Figure 7 for all the considered case studies. Temperature profiles were specifically examined in the longitudinal section of the samples in the zx plane at the end of the layer-deposition process. The gradient of residual stresses σx was observed at the end of the cooling process in the same sections. Finally, the Δz distortion contours were observed after the cutting phase when the samples were separated from the printing backplate.
Temperature profiles (Figure 5), at the end of the scanning process, with constant power (P = 350 W) and increasing scanning speed, show that the increased scanning speed affects the temperature distribution in the end zones (left and right) of the samples, resulting in a reduction of thermal gradients in these areas. In turn, the core areas of the samples exhibit no significant changes in temperature profiles. The temperature of the sample increases and thermal gradients decrease along the building direction as laser power increases with a constant scanning speed of 1500 mm/s. Furthermore, the temperature-distribution difference between the edges and the central part of the samples becomes less evident as the power of the laser increases. Hence, it can be stated that low laser-power-values result in lower temperature profiles, but with higher gradients along the building direction.
The temperature profiles, previously mentioned, are closely linked to the distribution of residual stress σx (Figure 6) at the end of the sample-cooling process. The results show that scanning speed does not have a significant impact on residual stresses in the x direction, as highlighted for temperature profiles. The right and left end areas of the samples experience less residual stress σx when scanned at faster speeds, which also reduces the section affected by significant residual stress gradients along the building direction. After the samples are separated from the printing plate, the built residual stress determines distortions Δz that vary slightly with the scanning speed, decreasing for a high-scanning-speed value. A progressive increase in the residual stress value in the x-direction through the sample section occurs with constant scanning speed and increasing laser power. This occurs as, with high laser power values, the stress gradient along the building direction decreases, resulting in a significant decrease in distortion in the z-direction of the samples (Figure 7).
With the accuracy previously discussed, the numerical model predicts Δz distortions that mirror the observed trends of the samples’ actual distortions. From the numerical results, it can be noted that the distribution of the Δz distortions remains almost constant along the axis of the sample with varying scanning speed. However, a significant reduction is observed in the area affected by the major distortions at the unbound end of the samples. The distortion initially grows as the laser power increases, but this pattern changes as the residual stress gradient reduces in the building direction z. Because the residual stresses gradient decreases in the building direction z, the higher power level results in smaller distortion values.
For a better comparison of the results, temperature and residual stress profiles in the middle part of the sample were plotted in Figure 8.

5. Conclusions

In this study, a numerical model was established to carry out FEM simulations of the L-PBF process for Ti-6Al-4V parts with the aim to study the effect of laser power and scan speed on residual stress and distortions. A commercial FEM software DEFORM 3D, Lagrangian implicit, was used with a layer-by-layer approach to reduce the computational time. From the numerical results, the following main findings were found:
-
The accuracy of the model is strictly dependent on the mesh used for the numerical analysis. In particular, a finer mesh allows for better activations of the elements according to the utilised voxel mesh.
-
The model accuracy varies when the laser power increases and the scan speed is kept constant. Instead, increasing scan speed does not have a significant influence on the model accuracy. When the laser power increases, while maintaining the scanning-speed constant, the volume of the material affected by remelting increases. In these conditions, the assumption made when not considering the presence of the surrounding powder can have a significant influence.
-
Laser power has a bigger impact on the residual stress and part distortion with respect to the scan speed. This is due to the small variation in the thermal gradients when the scan speed increases, which results in similar residual stress profiles and distortions. Instead, by increasing the laser power a significant variation in the thermal gradients and residual stress profiles is observed.
-
Simulation results, in agreement with the experimental ones, highlighted that the amount of distortions along the z-direction has a maximum when the laser power attains the value of 350 W and decreases for higher laser power values. For low laser power values, both temperature and temperature gradients along the building direction increase, with consequent increase for residual stress gradients and distortions; on the contrary, with higher laser power values, a decrease of the thermal gradient and consequent increase in the remelting zone of the material is found, resulting in decreasing residual stress gradients and distortions.
-
From the experimental analysis, the ID4 sample with laser power equal to 300 W and a scan speed of 1500 mm/s has shown better results in terms of distortion because of the smaller temperature gradients developed during the printing process, which led to a smaller amount of residual stress with respect to the other samples. Moreover, for ID4 the best results in terms of model accuracy were also obtained.
-
Even if it was possible to obtain the same trend between experimental and numerical analysis, the accuracy of the numerical model decreased with the increase of the laser power. This can be explained by a greater amount of the remelting area being involved in the numerical computation. In this case, using more computational layers and increasing the voxel mesh in the z-direction can help improve the model accuracy. This will be a topic of interest for future studies.

Author Contributions

Conceptualization, D.P. and F.M.; methodology, D.P., G.P. and F.M.; software, G.P. and R.L.; validation, D.P., G.P. and R.L.; formal analysis, R.L.; investigation, R.L.; writing—original draft preparation, D.P. and G.P.; writing—review and editing, D.P., G.P., R.L and F.M.; supervision, F.M. All authors have read and agreed to the published version of the manuscript.

Funding

This research received no external funding.

Data Availability Statement

The data presented in this study are available on request from the corresponding author.

Conflicts of Interest

The authors declare no conflict of interest.

References

  1. Gao, S.; Tan, Z.; Lan, L.; Lu, G.; He, B. Experimental Investigation and Numerical Simulation of Residual Stress and Distortion of Ti6Al4V Components Manufactured Using Selective Laser Melting. J. Mater. Eng. Perform. 2022, 31, 8113–8123. [Google Scholar] [CrossRef]
  2. Ivanov, S.; Artinov, A.; Zemlyakov, E.; Karpov, I.; Rylov, S.; Em, V. Spatiotemporal Evolution of Stress Field during Direct Laser Deposition of Multilayer Thin Wall of Ti-6Al-4V. Materials 2022, 15, 263. [Google Scholar] [CrossRef] [PubMed]
  3. Gh Ghanbari, P.; Wrobel, R.; Rheingans, B.; Mayer, T.; Leinenbach, C.; Mazza, E.; Hosseini, E. Advancing Efficiency and Reliability in Thermal Analysis of Laser Powder-Bed Fusion. Int. J. Mech. Sci. 2023, 260, 108583. [Google Scholar] [CrossRef]
  4. Monu, M.C.C.; Afkham, Y.; Chekotu, J.C.; Ekoi, E.J.; Gu, H.; Teng, C.; Ginn, J.; Gaughran, J.; Brabazon, D. Bi-Directional Scan Pattern Effects on Residual Stresses and Distortion in As-Built Nitinol Parts: A Trend Analysis Simulation Study. Integr. Mater. Manuf. Innov. 2023, 12, 52–69. [Google Scholar] [CrossRef] [PubMed]
  5. Jażdżewska, M.; Kwidzińska, D.B.; Seyda, W.; Fydrych, D.; Zieliński, A. Mechanical Properties and Residual Stress Measurements of Grade IV Titanium and Ti-6Al-4V and Ti-13Nb-13Zr Titanium Alloys after Laser Treatment. Materials 2021, 14, 6316. [Google Scholar] [CrossRef]
  6. Buffa, G.; Costa, A.; Palmeri, D.; Pollara, G.; Barcellona, A.; Fratini, L. A New Control Parameter to Predict Micro-Warping-Induced Job Failure in LPBF of TI6AL4V Titanium Alloy. Int. J. Adv. Manuf. Technol. 2023, 126, 1143–1157. [Google Scholar] [CrossRef]
  7. Cook, P.S.; Ritchie, D.J. Determining the Laser Absorptivity of Ti-6Al-4V during Laser Powder Bed Fusion by Calibrated Melt Pool Simulation. Opt. Laser Technol. 2023, 162, 109247. [Google Scholar] [CrossRef]
  8. Dutta, J.; Bhanja, D.; Narendranath, S. Theoretical Evolution of Thermal Behaviour of Ti-6Al-4V Subjected to Selective Laser Melting: A Powder Free Approach. Optik 2023, 273, 170483. [Google Scholar] [CrossRef]
  9. Tan, P.; Shen, F.; Li, B.; Zhou, K. A Thermo-Metallurgical-Mechanical Model for Selective Laser Melting of Ti6Al4V. Mater. Des. 2019, 168, 107642. [Google Scholar] [CrossRef]
  10. Song, X.; Feih, S.; Zhai, W.; Sun, C.N.; Li, F.; Maiti, R.; Wei, J.; Yang, Y.; Oancea, V.; Romano Brandt, L.; et al. Advances in Additive Manufacturing Process Simulation: Residual Stresses and Distortion Predictions in Complex Metallic Components. Mater. Des. 2020, 193, 108779. [Google Scholar] [CrossRef]
  11. Ali, H.; Ghadbeigi, H.; Mumtaz, K. Effect of Scanning Strategies on Residual Stress and Mechanical Properties of Selective Laser Melted Ti6Al4V. Mater. Sci. Eng. A 2018, 712, 175–187. [Google Scholar] [CrossRef]
  12. Jagatheeshkumar, S.; Raguraman, M.; Siva Prasad, A.V.S.; Nagesha, B.K.; Chandrasekhar, U. Study of Residual Stresses and Distortions from the Ti6Al4V Based Thin-Walled Geometries Built Using LPBF Process. Def. Technol. 2023, 28, 33–41. [Google Scholar] [CrossRef]
  13. Liu, Y.; Shi, J.; Wang, Y. Evolution, Control, and Mitigation of Residual Stresses in Additively Manufactured Metallic Materials: A Review. Adv. Eng. Mater. 2023, 2300489. [Google Scholar] [CrossRef]
  14. Gan, M.; Wu, Q.; Long, L. Prediction of Residual Deformation and Stress of Laser Powder Bed Fusion Manufactured Ti-6Al-4V Lattice Structures Based on Inherent Strain Method. Mater. Res. 2023, 26, e20220516. [Google Scholar] [CrossRef]
  15. Li, X.; Zhang, M.; Qi, J.; Yang, Z.; Jiao, Z. A Simulation Study on the Effect of Residual Stress on the Multi-Layer Selective Laser Melting Processes Considering Solid-State Phase Transformation. Materials 2022, 15, 7175. [Google Scholar] [CrossRef]
  16. Kaess, M.; Werz, M.; Weihe, S. Residual Stress Formation Mechanisms in Laser Powder Bed Fusion—A Numerical Evaluation. Materials 2023, 16, 2321. [Google Scholar] [CrossRef]
  17. Bastola, N.; Jahan, M.P.; Rangasamy, N.; Rakurty, C.S. A Review of the Residual Stress Generation in Metal Additive Manufacturing: Analysis of Cause, Measurement, Effects, and Prevention. Micromachines 2023, 14, 1480. [Google Scholar] [CrossRef]
  18. Ahmed, N.; Barsoum, I.; Abu Al-Rub, R.K. Numerical Investigation of Residual Stresses in Thin-Walled Additively Manufactured Structures from Selective Laser Melting. Heliyon 2023, 9, e19385. [Google Scholar] [CrossRef]
  19. Olleak, A.; Xi, Z. A Study of Modeling Assumptions and Adaptive Remeshing for Thermomechanical Finite Element Modeling of the LPBF Process. Int. J. Adv. Manuf. Technol. 2021, 115, 3599–3615. [Google Scholar] [CrossRef]
  20. Promoppatum, P.; Yao, S.C. Influence of Scanning Length and Energy Input on Residual Stress Reduction in Metal Additive Manufacturing: Numerical and Experimental Studies. J. Manuf. Process. 2020, 49, 247–259. [Google Scholar] [CrossRef]
  21. Malmelöv, A.; Hassila, C.J.; Fisk, M.; Wiklund, U.; Lundbäck, A. Numerical Modeling and Synchrotron Diffraction Measurements of Residual Stresses in Laser Powder Bed Fusion Manufactured Alloy 625. Mater. Des. 2022, 216, 110548. [Google Scholar] [CrossRef]
  22. Xiao, Z.; Chen, C.; Zhu, H.; Hu, Z.; Nagarajan, B.; Guo, L.; Zeng, X. Study of Residual Stress in Selective Laser Melting of Ti6Al4V. Mater. Des. 2020, 193, 108846. [Google Scholar] [CrossRef]
  23. DEFORM 3D V12.0 User’s Manual; SFC: Columbus, OH, USA, 2020.
  24. Chiumenti, M.; Neiva, E.; Salsi, E.; Cervera, M.; Badia, S.; Moya, J.; Chen, Z.; Lee, C.; Davies, C. Numerical Modelling and Experimental Validation in Selective Laser Melting. Addit. Manuf. 2017, 18, 171–185. [Google Scholar] [CrossRef]
  25. Xu, R.; Wang, W.; Wang, K.; Dai, Q. Finite Element Simulation of Residual Stress Distribution during Selective Laser Melting of Mg-Y-Sm-Zn-Zr Alloy. Mater. Today Commun. 2023, 35, 105571. [Google Scholar] [CrossRef]
  26. Zeng, K.; Pal, D.; Stucker, B. A Review of Thermal Analysis Methods in Laser Sintering and Selective Laser Melting. In Proceedings of the 23rd Annual International Solid Freeform Fabrication Symposium—An Additive Manufacturing Conference, SFF 2012, Austin, TX, USA, 6–8 August 2012; pp. 796–814. [Google Scholar]
  27. Chen, C.; Xiao, Z.; Zhu, H.; Zeng, X. Deformation and Control Method of Thin-Walled Part during Laser Powder Bed Fusion of Ti–6Al–4V Alloy. Int. J. Adv. Manuf. Technol. 2020, 110, 3467–3478. [Google Scholar] [CrossRef]
  28. Chiumenti, M.; Lin, X.; Cervera, M.; Lei, W.; Zheng, Y.; Huang, W. Numerical Simulation and Experimental Calibration of Additive Manufacturing by Blown Powder Technology. Part I: Thermal Analysis. Rapid Prototyp. J. 2017, 23, 448–463. [Google Scholar] [CrossRef]
  29. Lu, X.; Chiumenti, M.; Cervera, M.; Slimani, M.; Gonzalez, I. Recoater-Induced Distortions and Build Failures in Selective Laser Melting of Thin-Walled Ti6Al4V Parts. J. Manuf. Mater. Process. 2023, 7, 64. [Google Scholar] [CrossRef]
  30. Bartsch, K.; Herzog, D.; Bossen, B.; Emmelmann, C. Material Modeling of Ti–6Al–4V Alloy Processed by Laser Powder Bed Fusion for Application in Macro-Scale Process Simulation. Mater. Sci. Eng. A 2021, 814, 141237. [Google Scholar] [CrossRef]
Figure 1. Dog-bone specimen and base plate geometry for the L-PBF process simulation.
Metals 13 01907 g001
Figure 2. (a) Alignment between the acquired geometry and the original CAD model to evaluate the part distortion along the Z direction; (b) printed sample, top and side view.
Metals 13 01907 g002
Figure 3. Comparison of parts distortions (Δz [mm]) along the Z direction between the real measured value, the simulate M1 value, and the simulate M2 value for different laser power P [W] values.
Metals 13 01907 g003
Figure 4. Comparison of parts distortions (Δz [mm]) along the Z direction between the real measured value, the simulate M1 value, and the simulate M2 value for different scan speed v [mm/s] values.
Metals 13 01907 g004
Figure 5. Temperature profiles at the end of layer-deposition process in an axial section in the z,x plane of parts for all the set of process parameters (P and v).
Metals 13 01907 g005
Figure 6. Residual stress σx profiles at the end of the cooling phase in an axial section in the z, x plane of parts for the entire set of process parameters (P and v).
Metals 13 01907 g006
Figure 7. Δz distortion profiles at the end of the cutting phase, where the samples are detached from the printing plate, in an axial section in the zx plane of the samples for all process parameters (P and v).
Metals 13 01907 g007
Figure 8. Temperature and residual stress profiles in the middle part of the sample for (a) fixed laser power equal to 350 W, and (b) fixed scan speed equal to 1500 mm/s.
Metals 13 01907 g008
Table 1. Material properties of Ti-6Al-4V as functions of temperature. Adapted from ref. [29].
Temperature [°C]Density [kg/m3]Specific Heat
[J/(kg °C)]
Thermal Conductivity [W/(m°C)]Poisson’s RatioYoung’s Modulus [GPa]Thermal Expansion [(µm/m)/°C]Yield Stress [MPa]
20442054670.3451108.78850
20543955848.750.3510010630
500435065112.60.377611.2470
995428275322.70.431512.313
1100426764119.30.43512.45
12004252660210.43412.421
1600419873225.80.43112.50.5
16503886831350.430.112.50.1
20003818831350.430.0112.50.01
Table 2. Process parameters used in this study.
P [W]v [mm/s]P/v [J/mm]
ID135014000.250
ID235015000.233
ID335016000.219
ID430015000.200
ID540015000.267
Table 3. Chemical composition [mass fraction in %] of Ti-6Al-4V powder.
TiAlVCONFeH
Balance5.50–6.503.50–4.500.080.130.030.250.0125
Disclaimer/Publisher’s Note: The statements, opinions and data contained in all publications are solely those of the individual author(s) and contributor(s) and not of MDPI and/or the editor(s). MDPI and/or the editor(s) disclaim responsibility for any injury to people or property resulting from any ideas, methods, instructions or products referred to in the content.

