Article

Development of a High-Frequency Test System to Study the Wear of Ultrasonic Welding Tools

1
Walter-and-Ingeborg-Herrmann Chair for Power Ultrasonics and Engineering of Functional Materials, Department of Sustainable Systems Engineering (INATECH), Faculty of Engineering, University of Freiburg, 79110 Freiburg, Germany
2
Freiburg Materials Research Center (FMF), 79104 Freiburg, Germany
3
Fraunhofer Institute for High-Speed Dynamics (EMI), 79104 Freiburg, Germany
*
Author to whom correspondence should be addressed.
Metals 2023, 13(12), 1935; https://doi.org/10.3390/met13121935
Submission received: 13 October 2023 / Revised: 21 November 2023 / Accepted: 22 November 2023 / Published: 25 November 2023

Abstract

:
In current automotive lithium-ion battery manufacturing, Ultrasonic Metal Welding (USMW) is one of the major joining techniques due to its advantages in welding multiple thin sheets of highly conductive materials. The sonotrode, serving as the welding tool, transmits high-frequency oscillation to the joining parts. Due to the high frequency of thermal-mechanical loading, the knurl pattern on the sonotrode wears with an increasing number of welds, which significantly influences the welding process, resulting in poor joint quality. In this study, a high-frequency test system was developed to investigate the wear mechanisms of the sonotrode. Based on the comparable relative motion to the welding process, the thermal-mechanical loadings on the contact area were analyzed. As the oscillation amplitude of the sonotrode increased, the estimated frictional force between the sonotrode and the copper counter body remained constant, while an increase in the sliding distance was observed in the contact area. Temperature development showed a strong correlation with mechanical loading. A first approach of continuous testing was performed but was limited due to the failure of the copper counter body under ultrasonic stimulation.

1. Introduction

Advanced joining technology plays an important role in modern manufacturing. One main driving force is the growing demand for multi-material structures that combine different materials to increase the performance and functionality of components [1,2]. Joining dissimilar materials is often challenging due to the differences in chemical, mechanical, thermal, or electrical properties. As a low-cost and environment-friendly technique, ultrasonic welding is extensively used to join dissimilar materials, such as aluminum/steel [3,4,5], aluminum/magnesium [6,7], aluminum/titanium [8], and metal/fiber-reinforced polymers [9] in automotive, aviation, and aerospace applications. As ultrasonic welding provides advantages in joining multiple thin sheets of highly conductive materials, it serves as one of the major joining techniques in current automotive lithium-ion-based battery manufacturing [10,11,12].
Ultrasonic Metal Welding (USMW) is a solid-state welding process that uses high-frequency shear vibrations, usually 20 kHz or higher, to generate relative motion between joining partners clamped under a defined pressure [11,13,14]. The key elements of the ultrasonic welding system are the ultrasonic generator, piezoelectric converter, booster, sonotrode, and anvil. The ultrasonic generator converts the mains AC voltage with a frequency of 50 Hz to a high-frequency voltage of 20 kHz. In the piezoelectric converter, this high-frequency electrical oscillation was transformed into mechanical oscillations of the same frequency based on the inverse piezoelectric effect. Between the converter and sonotrode, a booster was mounted to amplify the oscillation amplitude. This oscillation amplitude was further amplified by the sonotrode. The transverse oscillations (u) from the sonotrode introduced shear loads into the weld zone, which is parallel to the oscillation direction (OD). Furthermore, a welding force (Fus) was applied with a pneumatic cylinder in the thickness direction (TD), which maintained a constant pressure on the joining partners during the welding process.
Usually, the sonotrode and the anvil have a knurl pattern on their coupling surfaces, which prevents excessive slippage and ensures a good transmission of the oscillation from the sonotrode onto the joining partners. Both the shape and geometry of the knurl pattern significantly influence the joint formation process as well as the joint quality [7,15,16,17,18].
The commonly used knurl patterns are pyramidal, trapezoidal, and serrated, depending on the application field. Komiyama et al. [15] compared the trapezoidal and serrated knurl patterns. The results showed that the relative amplitude of the serrated edge was larger than that of the trapezoidal edge, while the penetration of the serrated edge into the specimen was smaller than that of the trapezoidal edge. Moritz et al. [16] and Feng et al. [7] suggested that the pyramid-shaped can generate higher deformation stresses than the serrated-shaped, resulting in an effective bond. However, these higher deformation stresses can lead to excessive deformation or material damage for soft metals [17,19,20,21,22] or sonotrode sticking.
Several other studies have investigated the influence of knurl geometry on the welding process and the welded joint. Shin et al. [17] conducted welding experiments with different sonotrode and anvil knurl patterns and reported that the knurl geometry influenced the temperature rise on the weld surface. Du et al. [18] studied the influence of knurl geometry with finite element models (FEM) and revealed that the average equivalent plastic strain and temperature of the welding area increased as the knurl tooth angle increased.
However, the knurl pattern will wear in the form of material loss with an increasing number of welds. A major cause of this wear is the relative motion between the welding tools and joining partners [23,24,25,26,27]. In our previous study [23], we investigated the system dynamics during USMW by using Laser-Doppler Vibrometry (LDV) and revealed an in-phase relative motion between the sonotrode and the welded joint after the formation of the main bond. Shao et al. [26] characterized the wear progression of the pyramidal knurl pattern using a 3-D microscope and suggested that the knurl wear can be divided into four stages, with different wear patterns in two directions. This change in the knurl geometry not only affects the welding process but also the joint quality. To address these issues, Nazir et al. [28] proposed an online Tool Condition Monitoring (TCM) system by using sensor fusion and machine learning techniques to classify the tool condition into four categories.
The review of related literature has revealed limitations and gaps in the following aspects: Firstly, in most of the studies, the shape or geometry of the knurl pattern was varied to investigate its influences on the welding process, while the impacts on the tool’s service life were not discussed. Secondly, the optimization of the knurl pattern mainly focuses on the structural direction. One potential solution for increasing tool service life can be the adoption of new materials or coatings, which has not received a lot of consideration thus far. And finally, despite extensive research in the area of wear progression, the actual wear mechanisms still have to be addressed. A thermal-mechanical analysis of the loading condition on the sonotrode is very challenging due to the process characteristics, including small oscillation amplitudes, high frequency, and complex contact conditions. However, this analysis was crucial for understanding interfacial phenomena. Therefore, this novel study aims to develop a high-frequency testing system that can provide comparable loading conditions on the sonotrode to those generated in service conditions. This will simplify the thermal-mechanical analysis for the investigation of the wear mechanisms. Furthermore, such a testing system is needed for the exploration of suitable sonotrode materials or optimized structures in an application-oriented way.
The chronological development process is presented in the remainder of this paper as follows: Section 2 describes the experimental materials and methods, including modal analysis for specimen design and the introduction of the loading system as well as the in-situ monitoring system. The main results are presented and discussed in Section 3, which includes the validation and control of the thermo-mechanical loading in the contact area. Section 3.5 presents the current limitations of the high-frequency testing system. Section 4 provides conclusions and recommendations for future work.

2. Materials and Methods

2.1. Base Material and Specimen Design

A sonotrode with a pyramidal profile on the knurl pattern was used in this study, as shown in Figure 1a,b. The knurl pattern had dimensions of 10 mm × 10 mm, and the pyramidal tip had a height of 0.4 mm, a width of 0.8 mm, and a profile angle of 45°. The sonotrode used in this work was made from highly corrosion-resistant tool steel, produced by the powder metallurgy process. After complete heat treatment of the material, a remarkably high hardness of 697 HV30/12 was measured using a ZwickRoell ZHU universal hardness testing machine (ZwickRoell, Ulm, Germany). The microstructure of the sonotrode material was further characterized by using a Zeiss EVO 15 scanning electron microscope (SEM) (Zeiss, Oberkochen, Germany) with energy-dispersive X-ray spectroscopy (EDX), as presented in Figure 1c. A fine microstructure can be recognized, consisting of two different primary carbides embedded in the steel matrix: chromium-based Cr7C3 (grey) and vanadium-based VC (black).
The USMW is used in the assembly of cell terminals and bus bars for lithium-ion batteries, where the targeted metals are usually aluminum, copper, and other high-conductivity materials. In this study, the oxygen-free pure Cu C1020 (JIS H3100) in half-hard condition was selected for the counter body to simulate the base material for the bus bar or battery tab.
To conduct an in-phase relative motion in the contact area, the Cu counter body (Cu) must be specifically designed to be stimulated with resonance vibrations at 20 kHz. For this, a suitable geometry needs to be determined through modal analysis in the Ansys Workbench 17.1 software (Ansys, Washington, PA, USA). The modal frequencies are determined by solving the eigenvalues of the equation of motion based on Young’s modulus, Poisson’s ratio, and the mass density, as given in Table 1. “SOLID 186” elements with a size of approximately 2 mm were used to mesh the specimen.
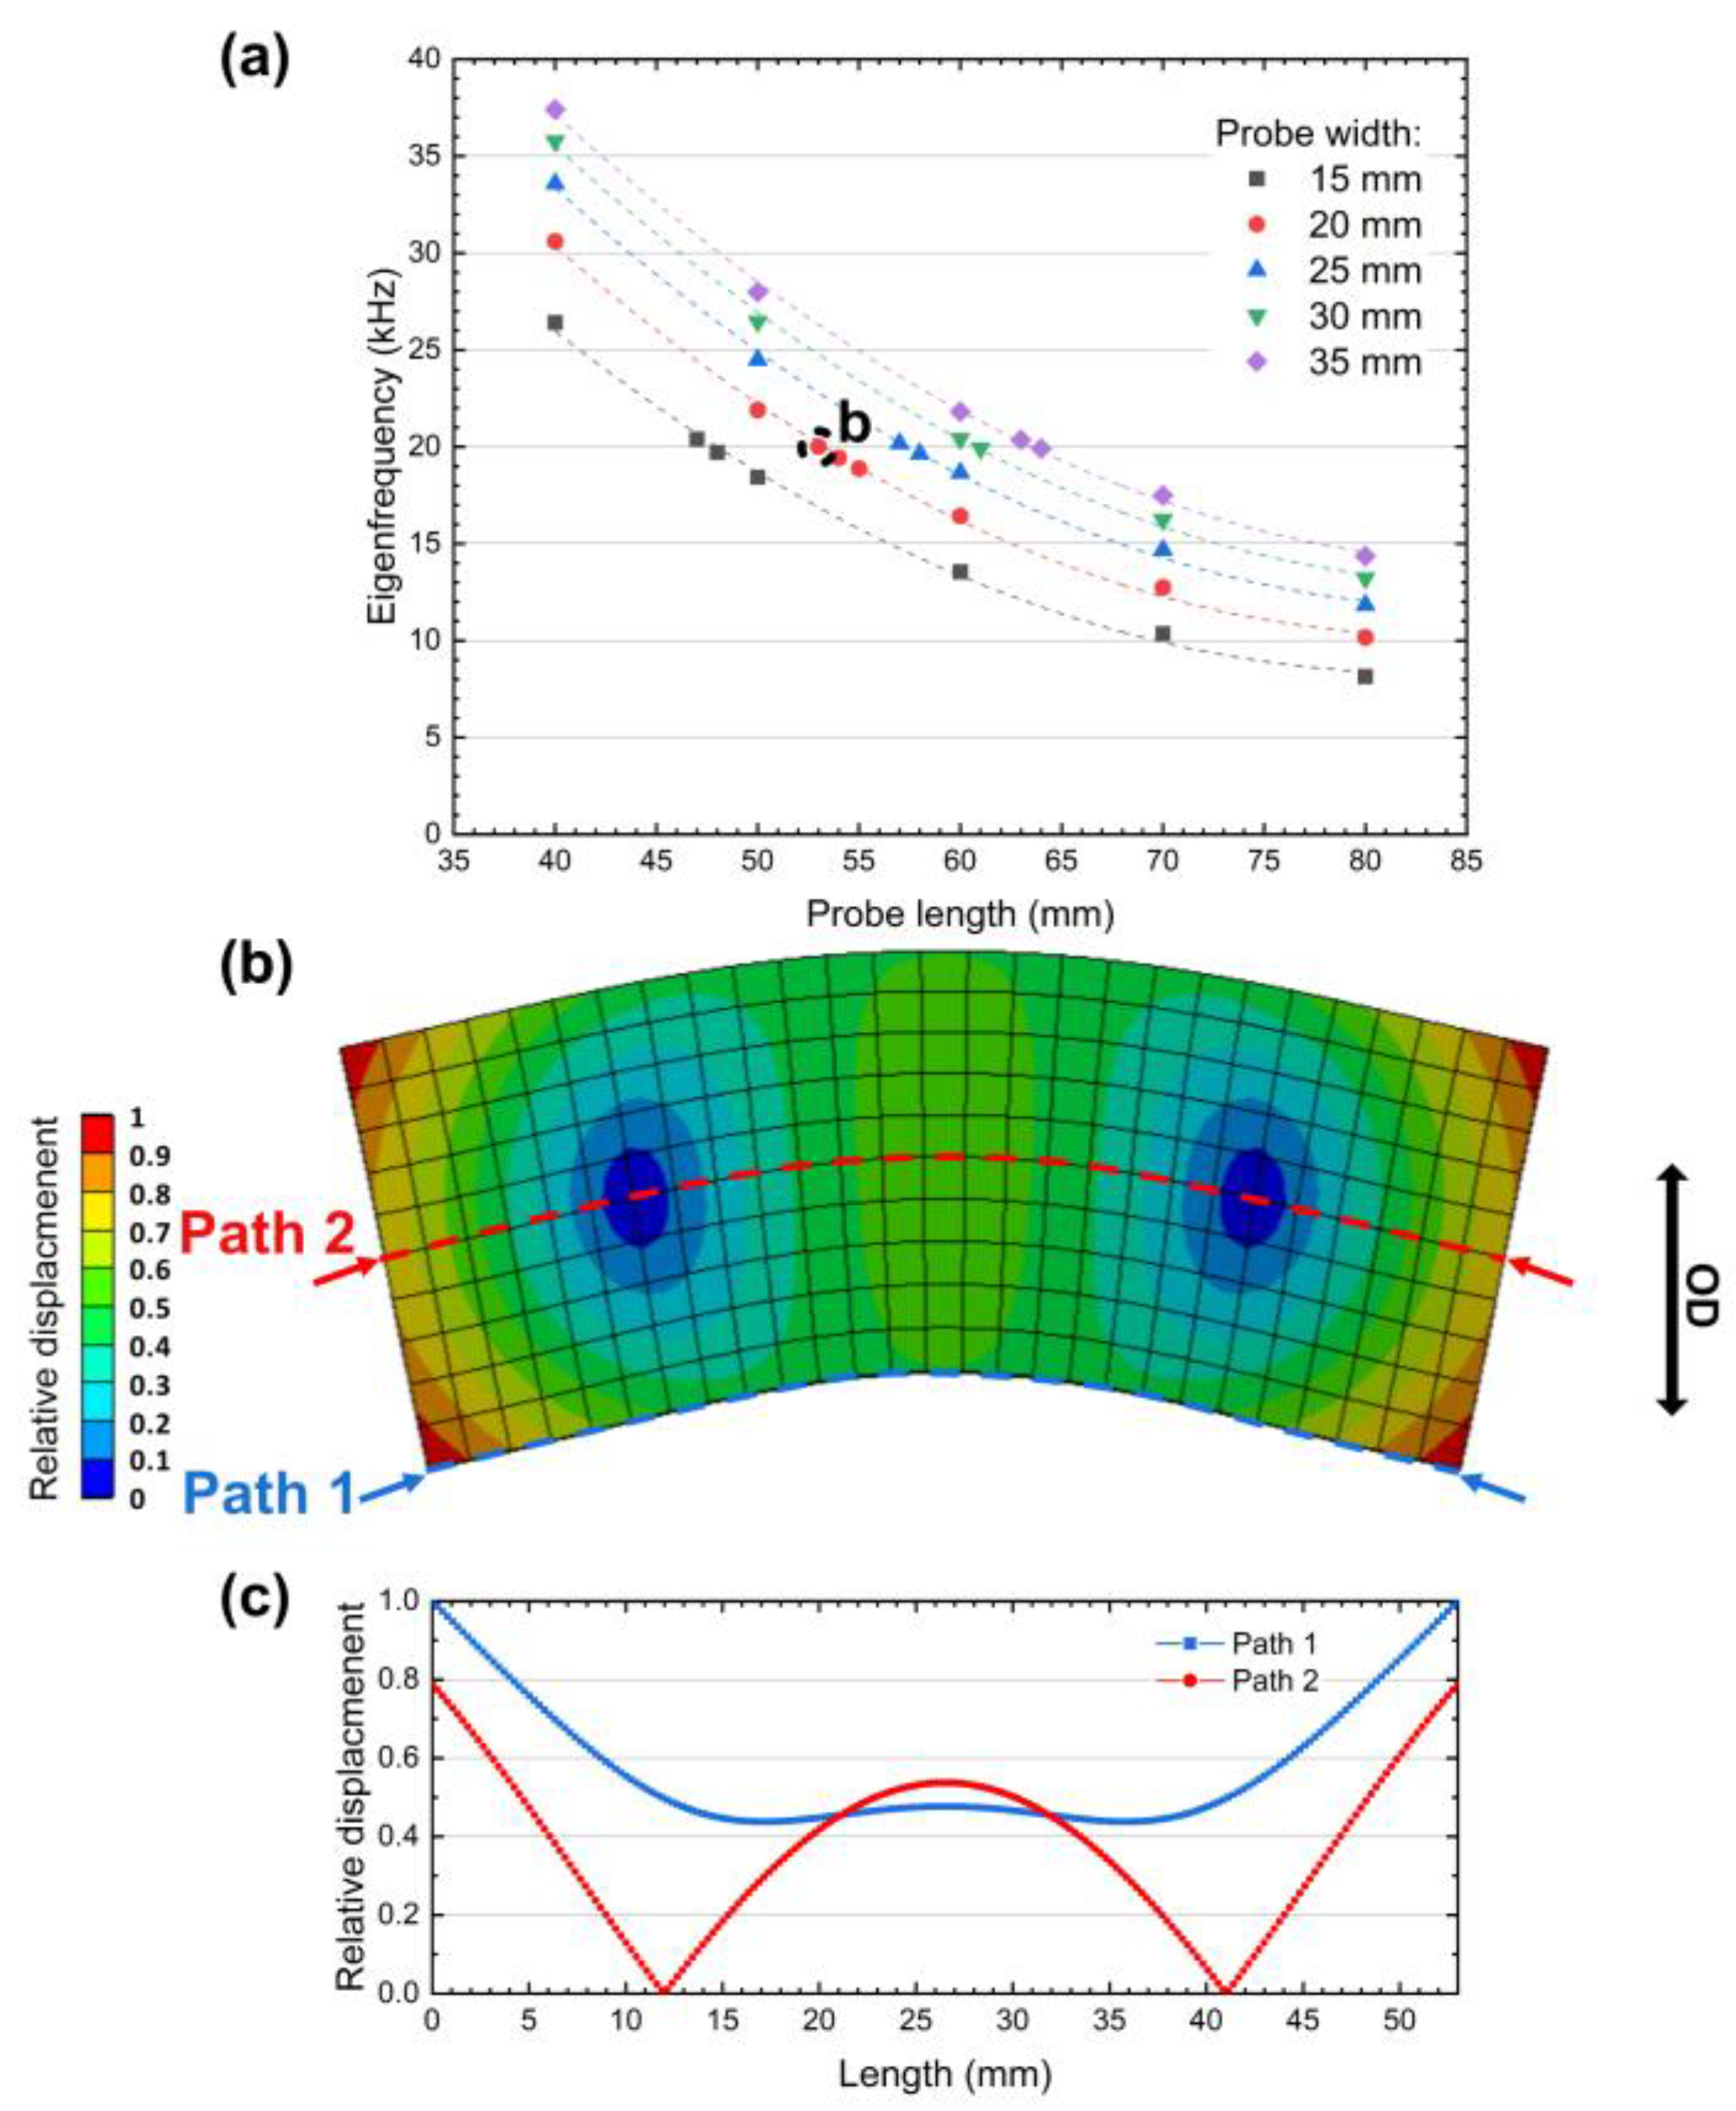
The geometry of the Cu counter body was iteratively adjusted until the desired oscillation mode at 20 kHz was achieved. To prevent welding to the support unit, the Cu counter body must be thick enough to absorb the vibrating energy from the sonotrode and distribute the normal force. Some pretests were performed, resulting in a thickness of 10 mm, which remained stable in the modal analysis. The results of finite element calculations are summarized in Figure 2a, which shows the relationship between the dimensions and the eigenfrequency. It can be seen that the eigenfrequency increases with higher width and lower length. Based on modal analysis, a Cu counter body with a geometry of 53 × 20 × 10 mm3 was used for further experiments in this study. Figure 2b shows the deformation of the Cu counter body under ultrasonic stimulation at 20 kHz, revealing a transversal bending eigenmode. The relative displacement as a function of position is illustrated through paths 1 and 2, as shown in Figure 2c. Two nodal displacement points were found at positions of 12 mm and 41 mm. The actual oscillation behavior of the Cu counter body was further validated using Laser Doppler Vibrometry (LDV) during the experiments. All surfaces of the Cu counter body were treated with 600 # sandpaper and then cleaned using ethanol in an ultrasonic bath to remove contaminants before the experiments. The contact area was positioned at the center of the Cu counter body.

2.2. Test System with In-Situ Measurements

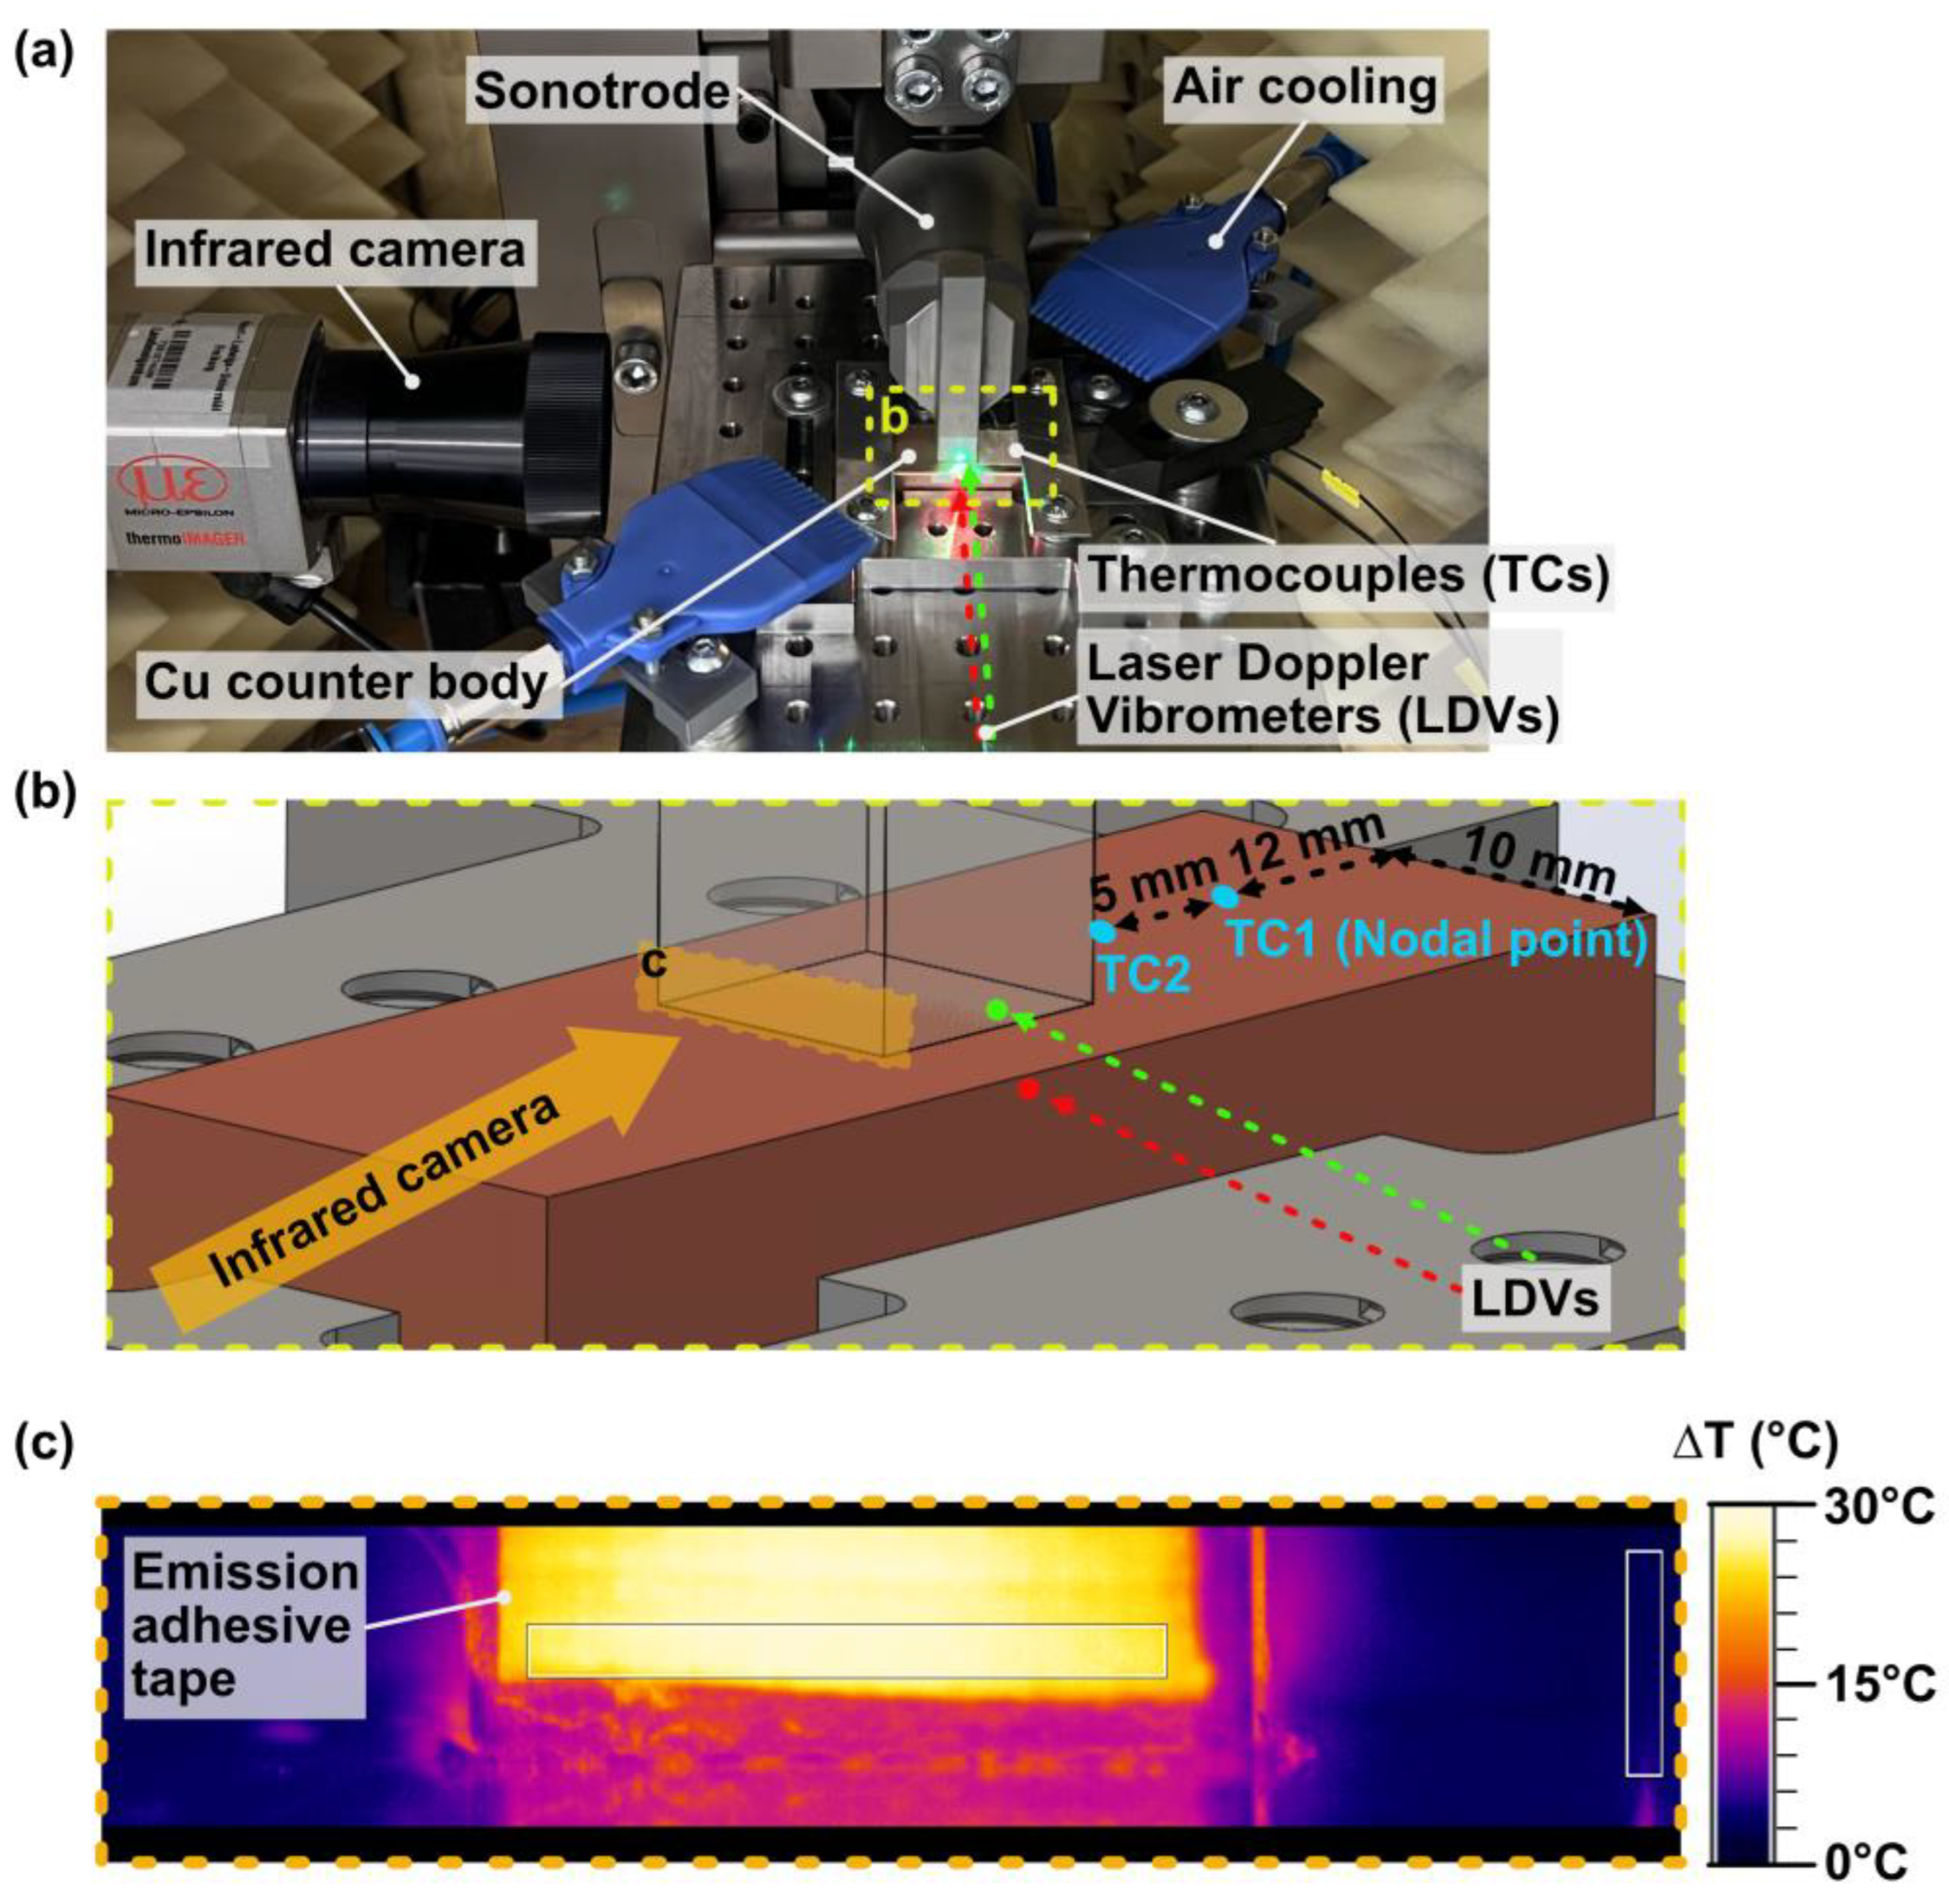
The test system was designed based on a commercial ultrasonic metal welding system by Herrmann HiS Vario B (Herrmann Ultraschalltechnik, Karlsbad, Germany) with small modifications. The main components of the high-frequency test system are shown in Figure 3a, which can be categorized into the loading system and the in-situ monitoring system.
In the loading system, the sonotrode is the actual moving body, which can oscillate with a maximum amplitude of up to 30 µm at 20 kHz in this study. The main requirement for the loading system was to conduct an in-phase relative motion at the sonotrode/Cu interface, which leads to the sonotrode wear due to the high-frequency micro-slip. To fulfill this requirement, the Cu counter body should resonate at 20 kHz through a suitable geometry. Furthermore, in-phase relative motion can only be achieved with an unfixed Cu counter body. Rigid mounting results in an out-of-phase relative motion with a 180° phase shift, as the Cu counter body behaves like the anvil in the welding process. A holder was used to maintain the position of the Cu counter body and was mounted on a massive base. A normal force of 700 N was generated pneumatically by the welding system itself, and it remained constant throughout this study. The ultrasonic pulse was set to 1s for all experiments.
During the experiments, two synchronized LDVs, OFV-5000 Xtra and VibroGo, from Polytec GmbH (Polytec, Waldbronn, Germany), were used to monitor the relative motion at the sonotrode/Cu interface. The velocity in the oscillation direction was measured with a high sampling rate of 1280 kHz. Furthermore, the velocity measurements were converted into time-frequency domain signals through the Short-Time Fourier Transform (STFT) to analyze the oscillation behavior of both the sonotrode and the Cu counter body. Changes in the surface temperature on the sonotrode and the Cu counter body were monitored using an infrared camera of type (IR camera) TIM640 from Micro-Epsilon Messtechnik (Micro-Epsilon Messtechnik, Ortenburg, Germany) and thermocouples (TCs) type J, respectively. Figure 3b shows the arrangement of the measurement points for LDVs and TCs in detail. An additional thermocouple was placed near the contact area to measure the environmental temperature. The thermography on the sonotrode surface was calibrated using an emission adhesive tape with an emissivity of 0.98, as shown in Figure 3c. The maximum temperature in both rectangle boxes was recorded to calculate the change in surface temperature on the sonotrode. However, the emission tap cannot be placed too close to the contact area due to the penetration of the sonotrode and the formation of particles and dust, which could lead to measurement errors. The sampling rate for the thermometric and thermographic measurements was set to 125 Hz. In addition to the external measurements mentioned above, power, frequency, and normal force from the USMW system were recorded by the welding system.
A control unit was employed to control the load sequences and record all the measured data synchronously. To stabilize the temperature increase within a reasonable range, an additional compressed-air cooling system was adapted for continuous testing.

3. Results and Discussion

3.1. Validation of the Oscillation Behavior

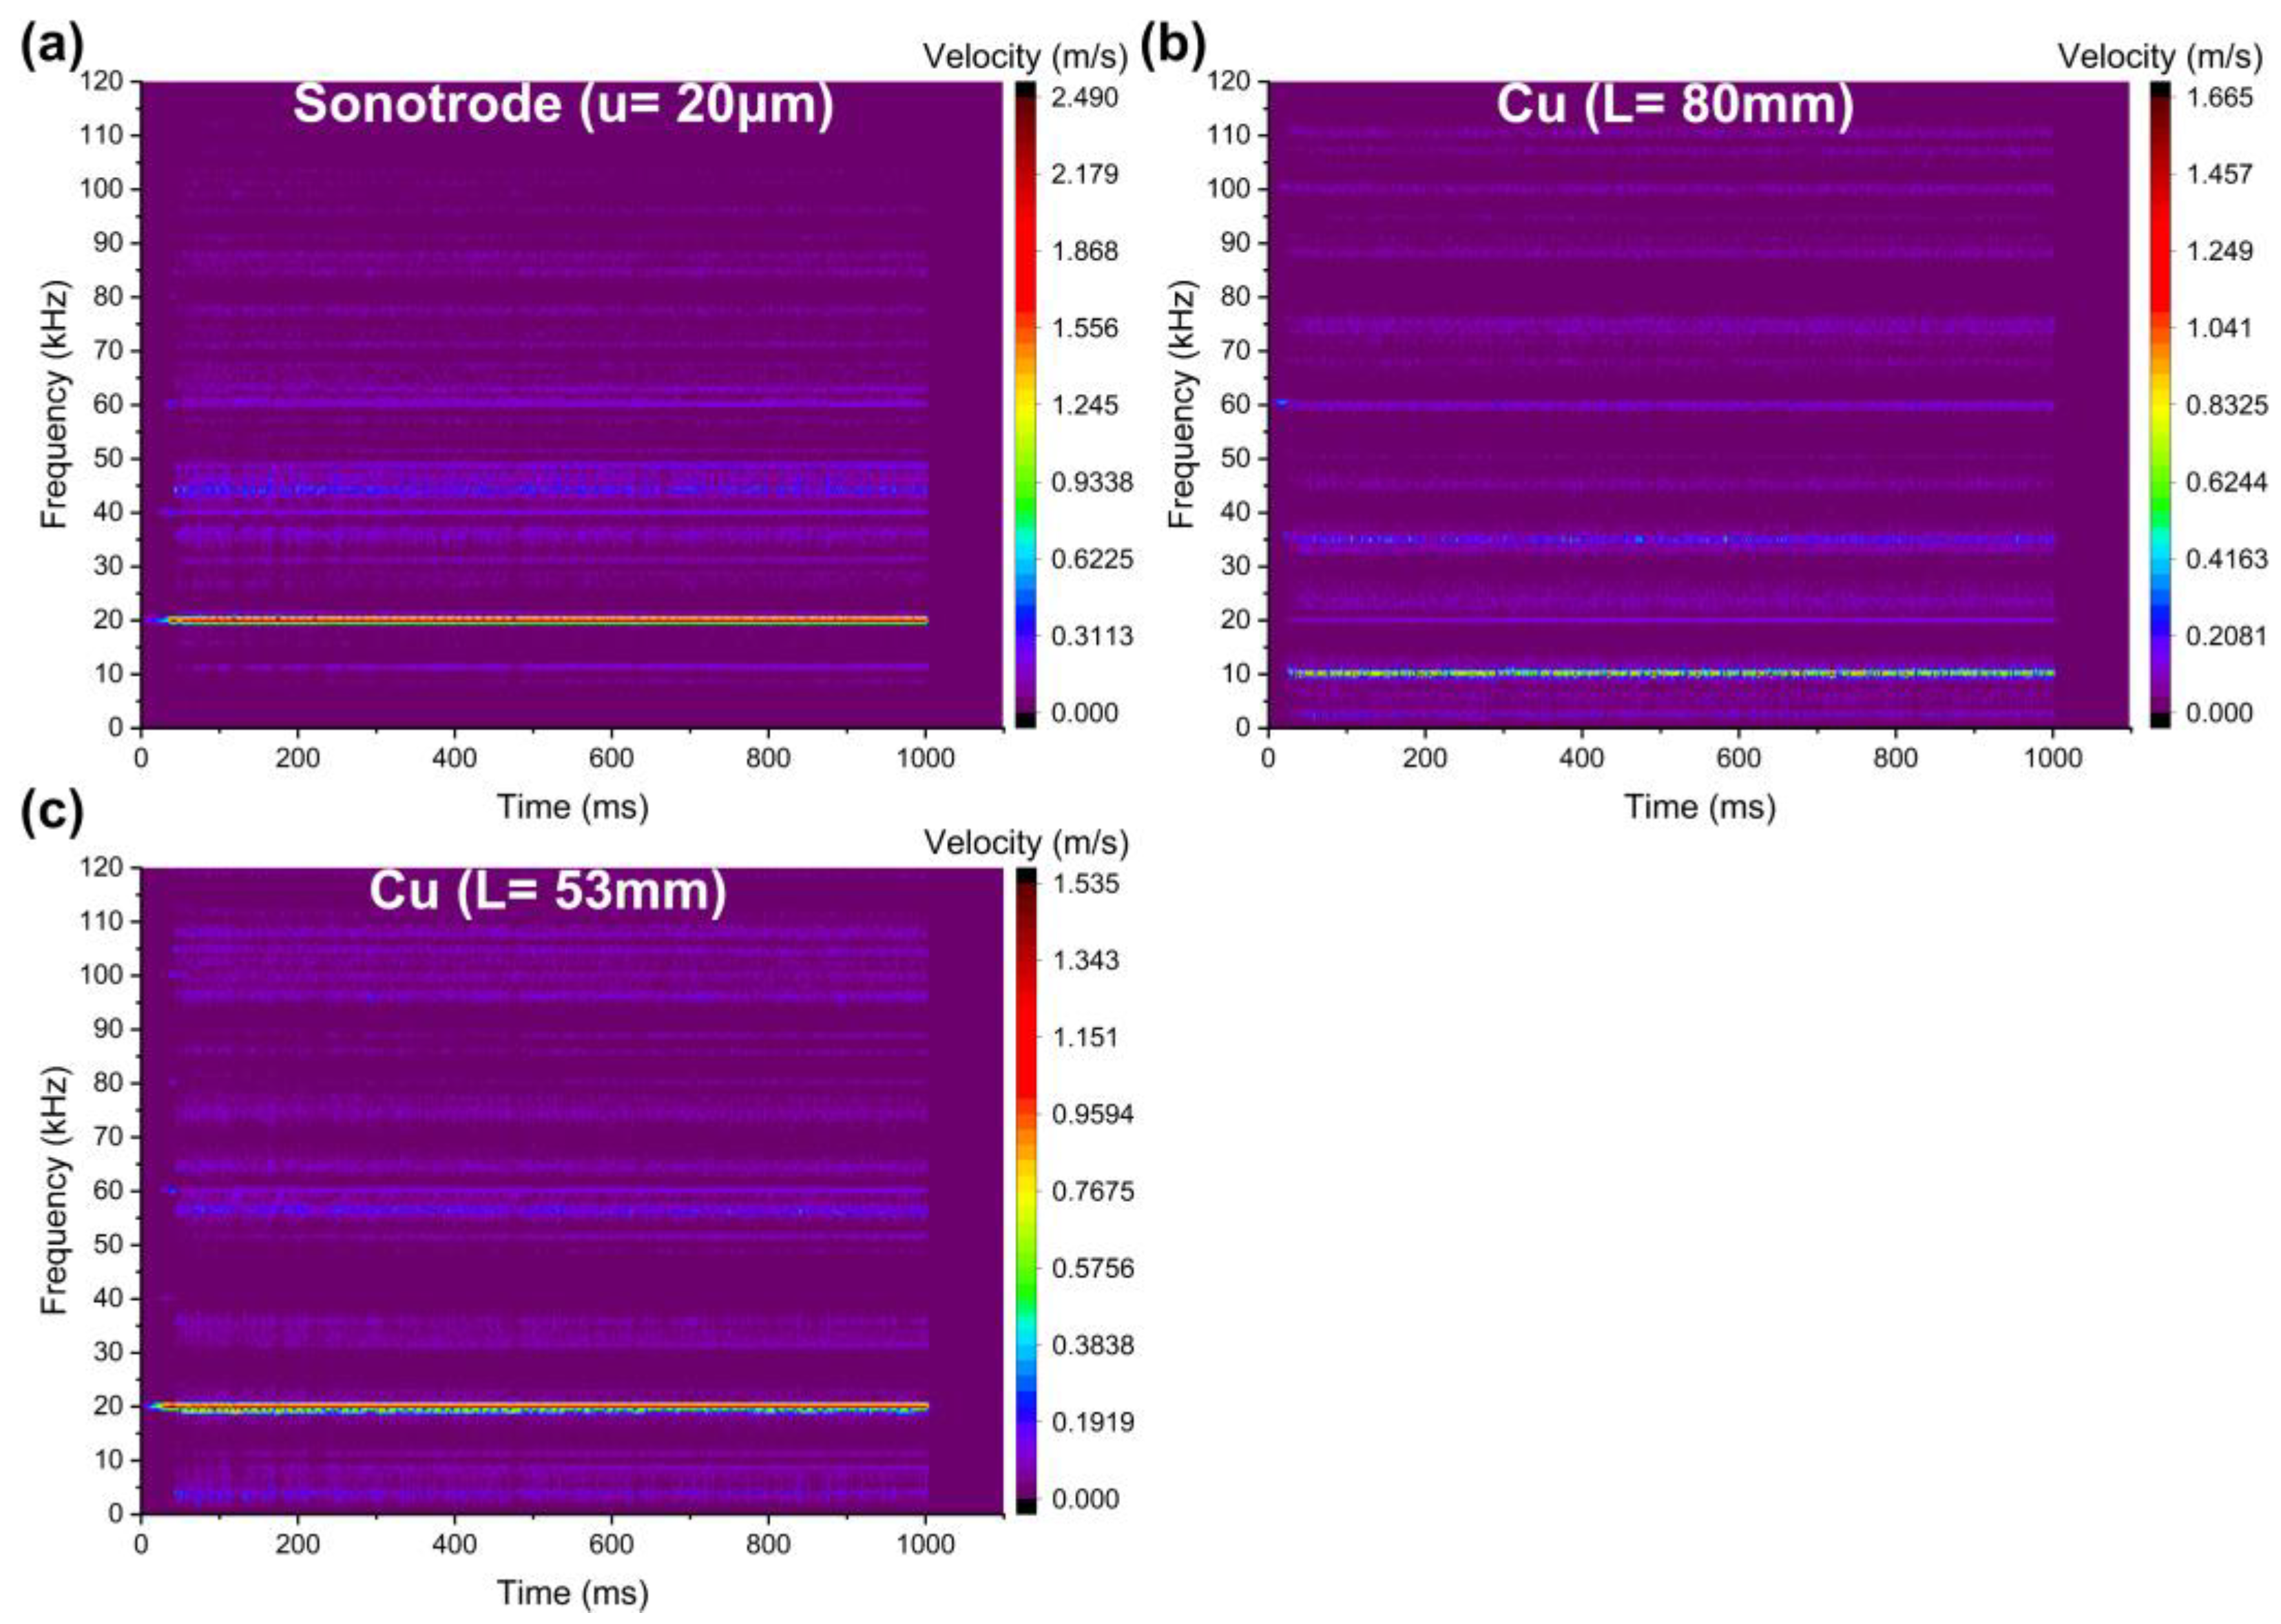
To validate the modal analysis, the modal frequencies of the Cu counter body were determined using LDV during the test. Two Cu counter bodies with different lengths, 80 mm and 53 mm, were stimulated, while the sonotrode oscillated with an amplitude of 20 µm. The measured velocity signals from LDVs were converted into the time-frequency domain through STFT, which provides the frequency spectrum as well as its changes over time. Figure 4 shows the time-frequency spectra for the sonotrode and Cu counter bodies of different lengths. As depicted in Figure 4a, the sonotrode oscillated in its operational mode at 20 kHz, and other eigenmodes were mainly observed in higher harmonics. Under this ultrasonic stimulation, the 80 mm Cu counter body oscillated at 10 kHz, whereas the 53 mm Cu counter body oscillated at 20 kHz. The experimental results mentioned above were in good agreement with the modal analysis from finite element models (see Figure 2a). Additionally, no shift of the eigenfrequency occurred, and the oscillation amplitude of all components remained almost constant after the ramp-up phase. Thus, stable in-phase relative motion was achieved to simulate the loading condition in the contact area.

3.2. Relative Motion at the Sonotrode/Cu Interface

During USMW, cyclic loads on the sonotrode are primarily induced through relative motion at the interface between the sonotrode and the welded joint, which contributes to the wear of the sonotrode during the entire welding process [23,24,25]. To monitor the relative motion, two synchronized LDVs were used to measure the velocity close to the sonotrode/Cu interface. A bandpass filter between 18 kHz and 22 kHz was used to eliminate irrelevant vibrations. The oscillation amplitude increased gradually from 20 µm to 28 µm. The experiment was repeated three times, continuously at each amplitude level.
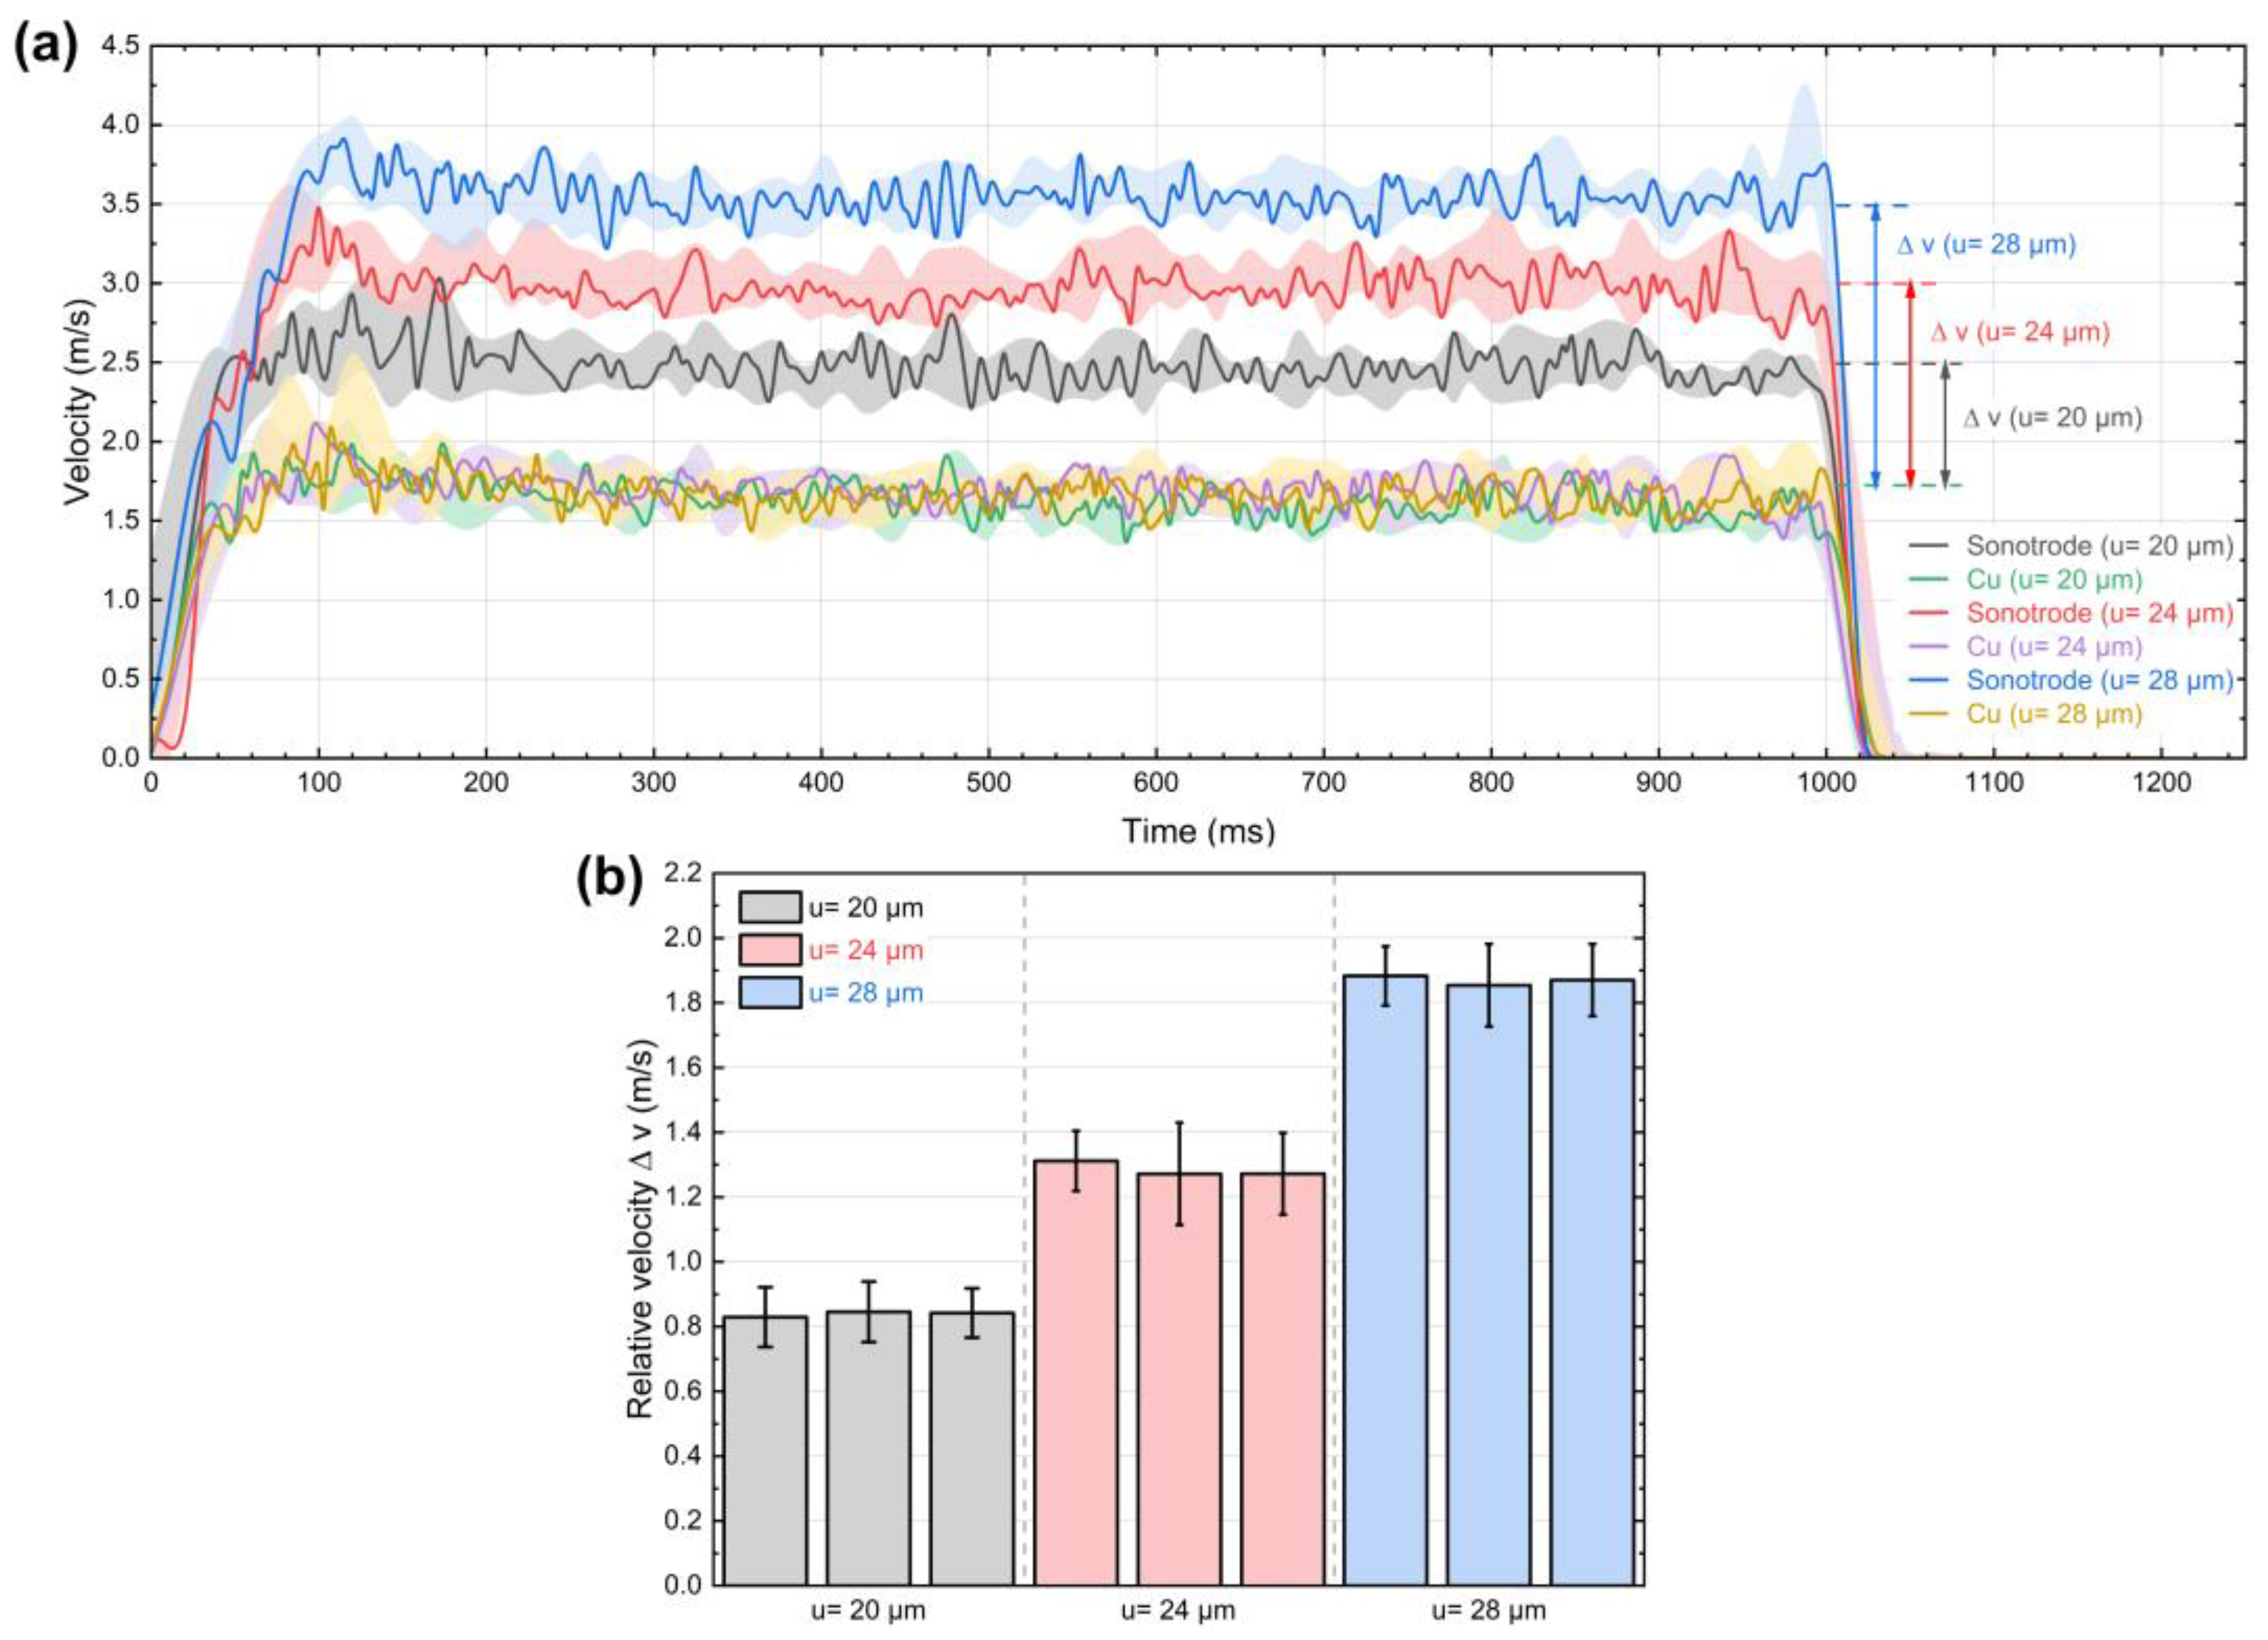
Figure 5a shows the velocity envelopes for the tests conducted with three different amplitudes. The shaded areas represent the velocity spectrum resulting from the repetitive tests, and the lines are the velocity envelopes of a representative measurement. It can be seen that the velocity of both components remained stable after the initial ramp-up phase. Nevertheless, fluctuations were observed during the experiments, which can be explained by the friction at the Cu/holder interface and the inertia of Cu. This assumption was further supported by the correlation of the outlines of velocity envelopes.
With an increase in oscillation amplitude from 20 μm to 28 μm, the velocity of the sonotrode tip rose from 2.5 m/s gradually to 3.5 m/s, which is consistent with the calculation for sinusoidal oscillation at 20 kHz. At the same time, the velocity of Cu remained constant at 1.75 m/s and was unaffected by the amplitude increase. It can be interpreted that the acting force at the sonotrode/Cu interface, which drives the Cu counter body, remained nearly constant. The relative velocity was further calculated and plotted in Figure 5b, which shows a linear relationship between the oscillation amplitude and the relative velocity at the sonotrode/Cu interface after the ramp-up phase. The reproducibility of the output relative motion (difference between columns) shows a slight difference compared to the fluctuation within one experiment (error bar). The results indicate that the high-frequency microslip at the sonotrode/Cu interface can be well controlled by varying the oscillation amplitude. As the oscillation amplitude increased from 20 μm to 28 μm, the relative velocity at the sonotrode/Cu interface rose from 0.83 m/s to 1.88 m/s, resulting in a longer slip distance for the same duration.

3.3. Estimation of the Frictional Force

Direct measurement of the acting frictional force is limited by the resolution of state-of-the-art force sensors. However, Spaltmann et al. [29,30] suggested a method to estimate the acting force by monitoring the power loss due to friction and proposed the following relationship:
F ƒ = P 4 · u · ƒ
where u is the amplitude, ƒ is the frequency of the sonotrode, and P is the generator power. In their study, the counter body was rigidly mounted on a massive base plate, which made the amplitude of the sonotrode practically the amplitude difference in the contact area. The generator power required to vibrate the sonotrode was recorded under loaded conditions with different normal forces as well as in unloaded conditions, i.e., free oscillation.
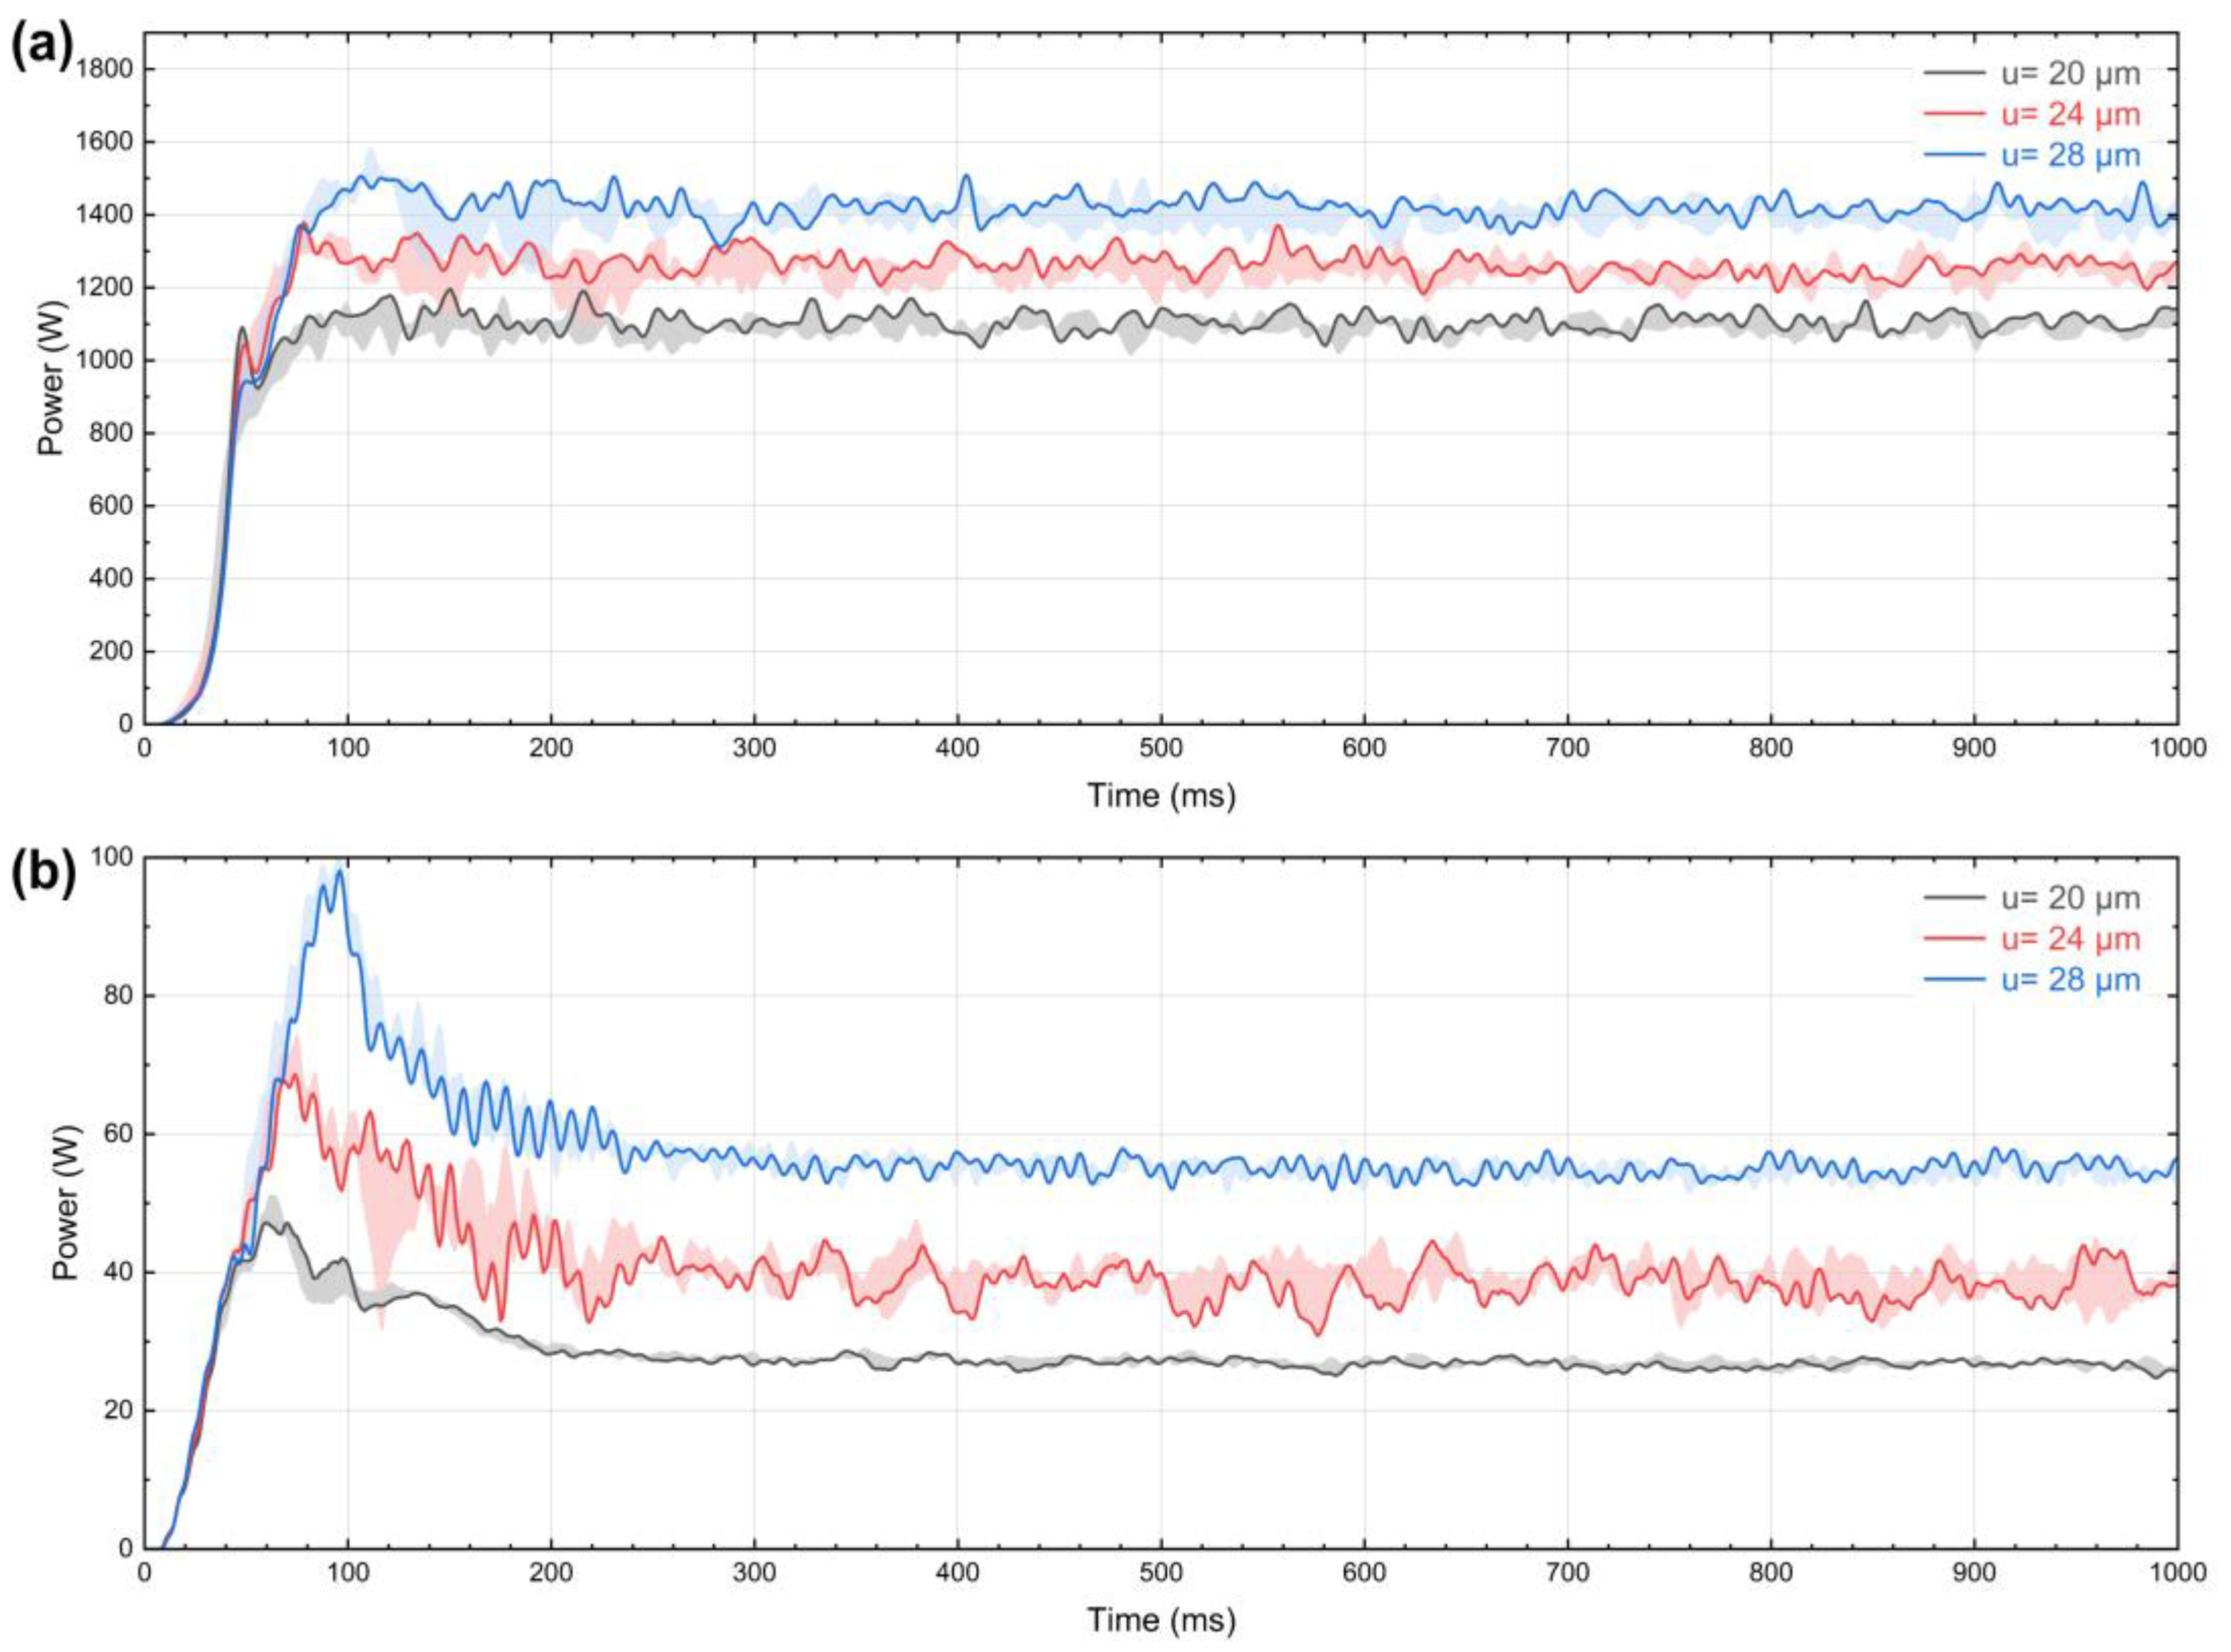
This method was applied to estimate the frictional force in this study. However, the normal load remained constant, whereas the amplitude difference at the sonotrode/Cu interface increased with the oscillation amplitude of the sonotrode. Figure 6 shows the generator power curves during the experiments and free oscillations. In the case of the loading condition, the average generator power increased gradually from around 1100 W to around 1400 W, while it rose slightly from 27 W to 55 W to vibrate the sonotrode under unloaded conditions. Based on the increase in power due to the amplitude difference, the estimated friction force can be calculated using Equation (1), which results in 428 N (u = 20 → 24 μm) and 422 N (u = 24 → 28 μm). It can be seen that the frictional force in the contact area remained almost stable, which led to a constant oscillation amplitude of the Cu counter body, increasing the amplitude of the sonotrode. A variation in frictional force can be realized by adjusting the normal force.

3.4. Temperature Development during Continuous Testing

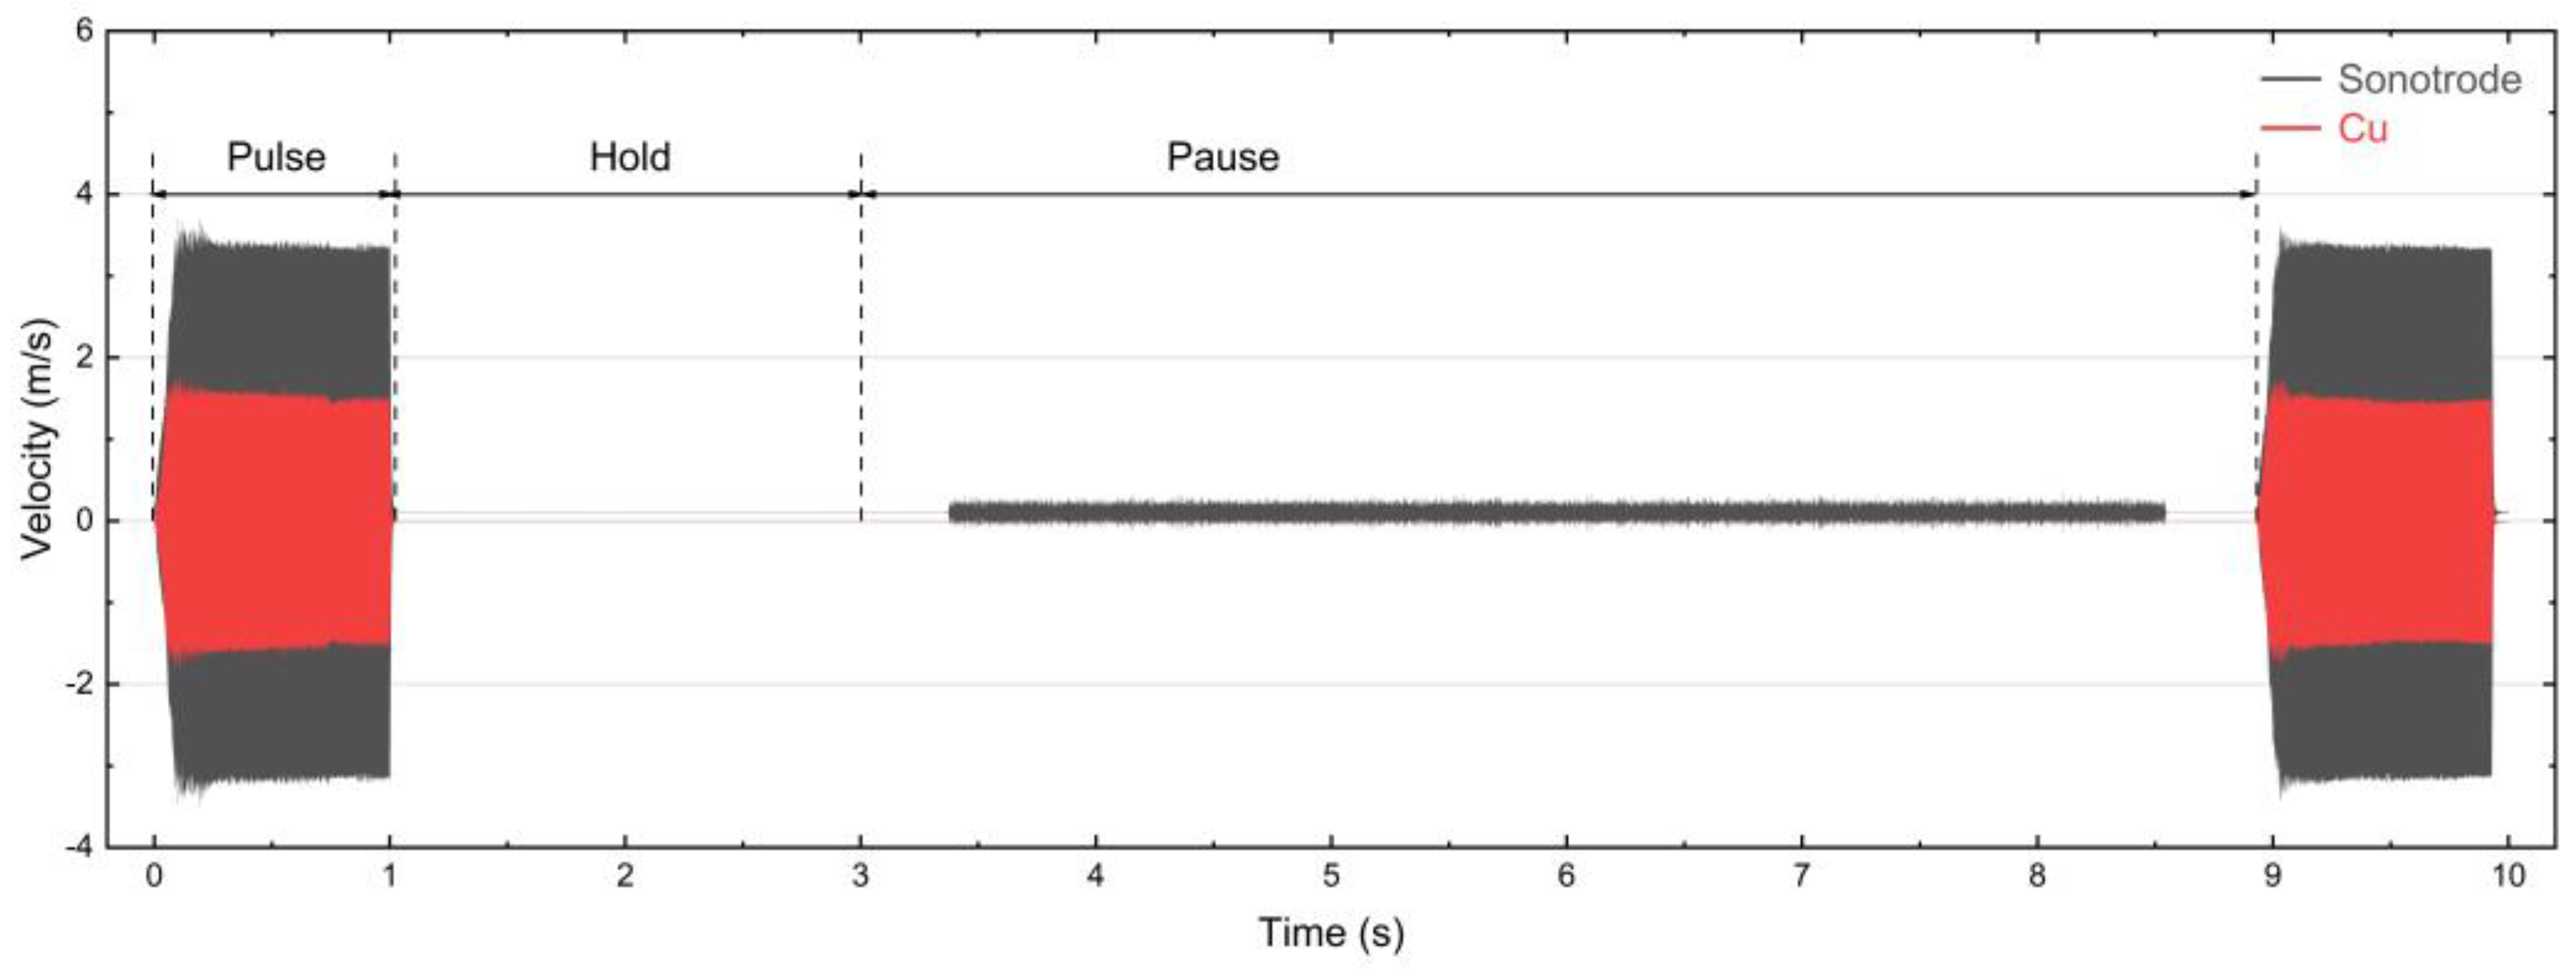
Previous high-resolution studies of the oscillation behavior during USMW with different measuring and welding setups [23,24,27,31,32] have revealed that the relative motion between the welding tool and the joint has a velocity difference in the range of 1–2 m/s after the formation of a macroscopic joint. Thus, an oscillation amplitude of 28 μm was selected for continuous testing, which can be varied by changing the oscillation amplitude of the sonotrode for other loading conditions. To control the loading sequences, a characteristic pulse/hold/pause combination was employed, as presented in Figure 7 with the data measured from LDVs.
The part of the pulse was set to 1000 ms, including a ramp-up time of 100 ms, which was used to generate the high-frequency micro-slip at the sonotrode/Cu interface. After the pulse phase, the hold phase was followed, in which the sonotrode maintained contact on the Cu counter body but without oscillation. Finally, the sonotrode returns to the base position and then returns to the work position again for the next pulse. Due to this vertical movement of the sonotrode, the LDV with the measurement point on the sonotrode was temporarily out of focus in the pause phase, as seen by the signal noise (black line) from 3.3 s to 8.5 s in Figure 7. This test procedure aims to simulate the continuous welding processes in the actual application. Because the compressed-air cooling remained in a fixed position, the Cu counter body was cooled all the time, whereas the sonotrode was cooled only during the pulse and hold phases. To evaluate the correlation between temperature development and the loading sequences, three different pulse/hold/pause combinations were set in this study: 1 s/2 s/6 s, 1 s/4 s/7 s, and 1 s/6 s/8 s.
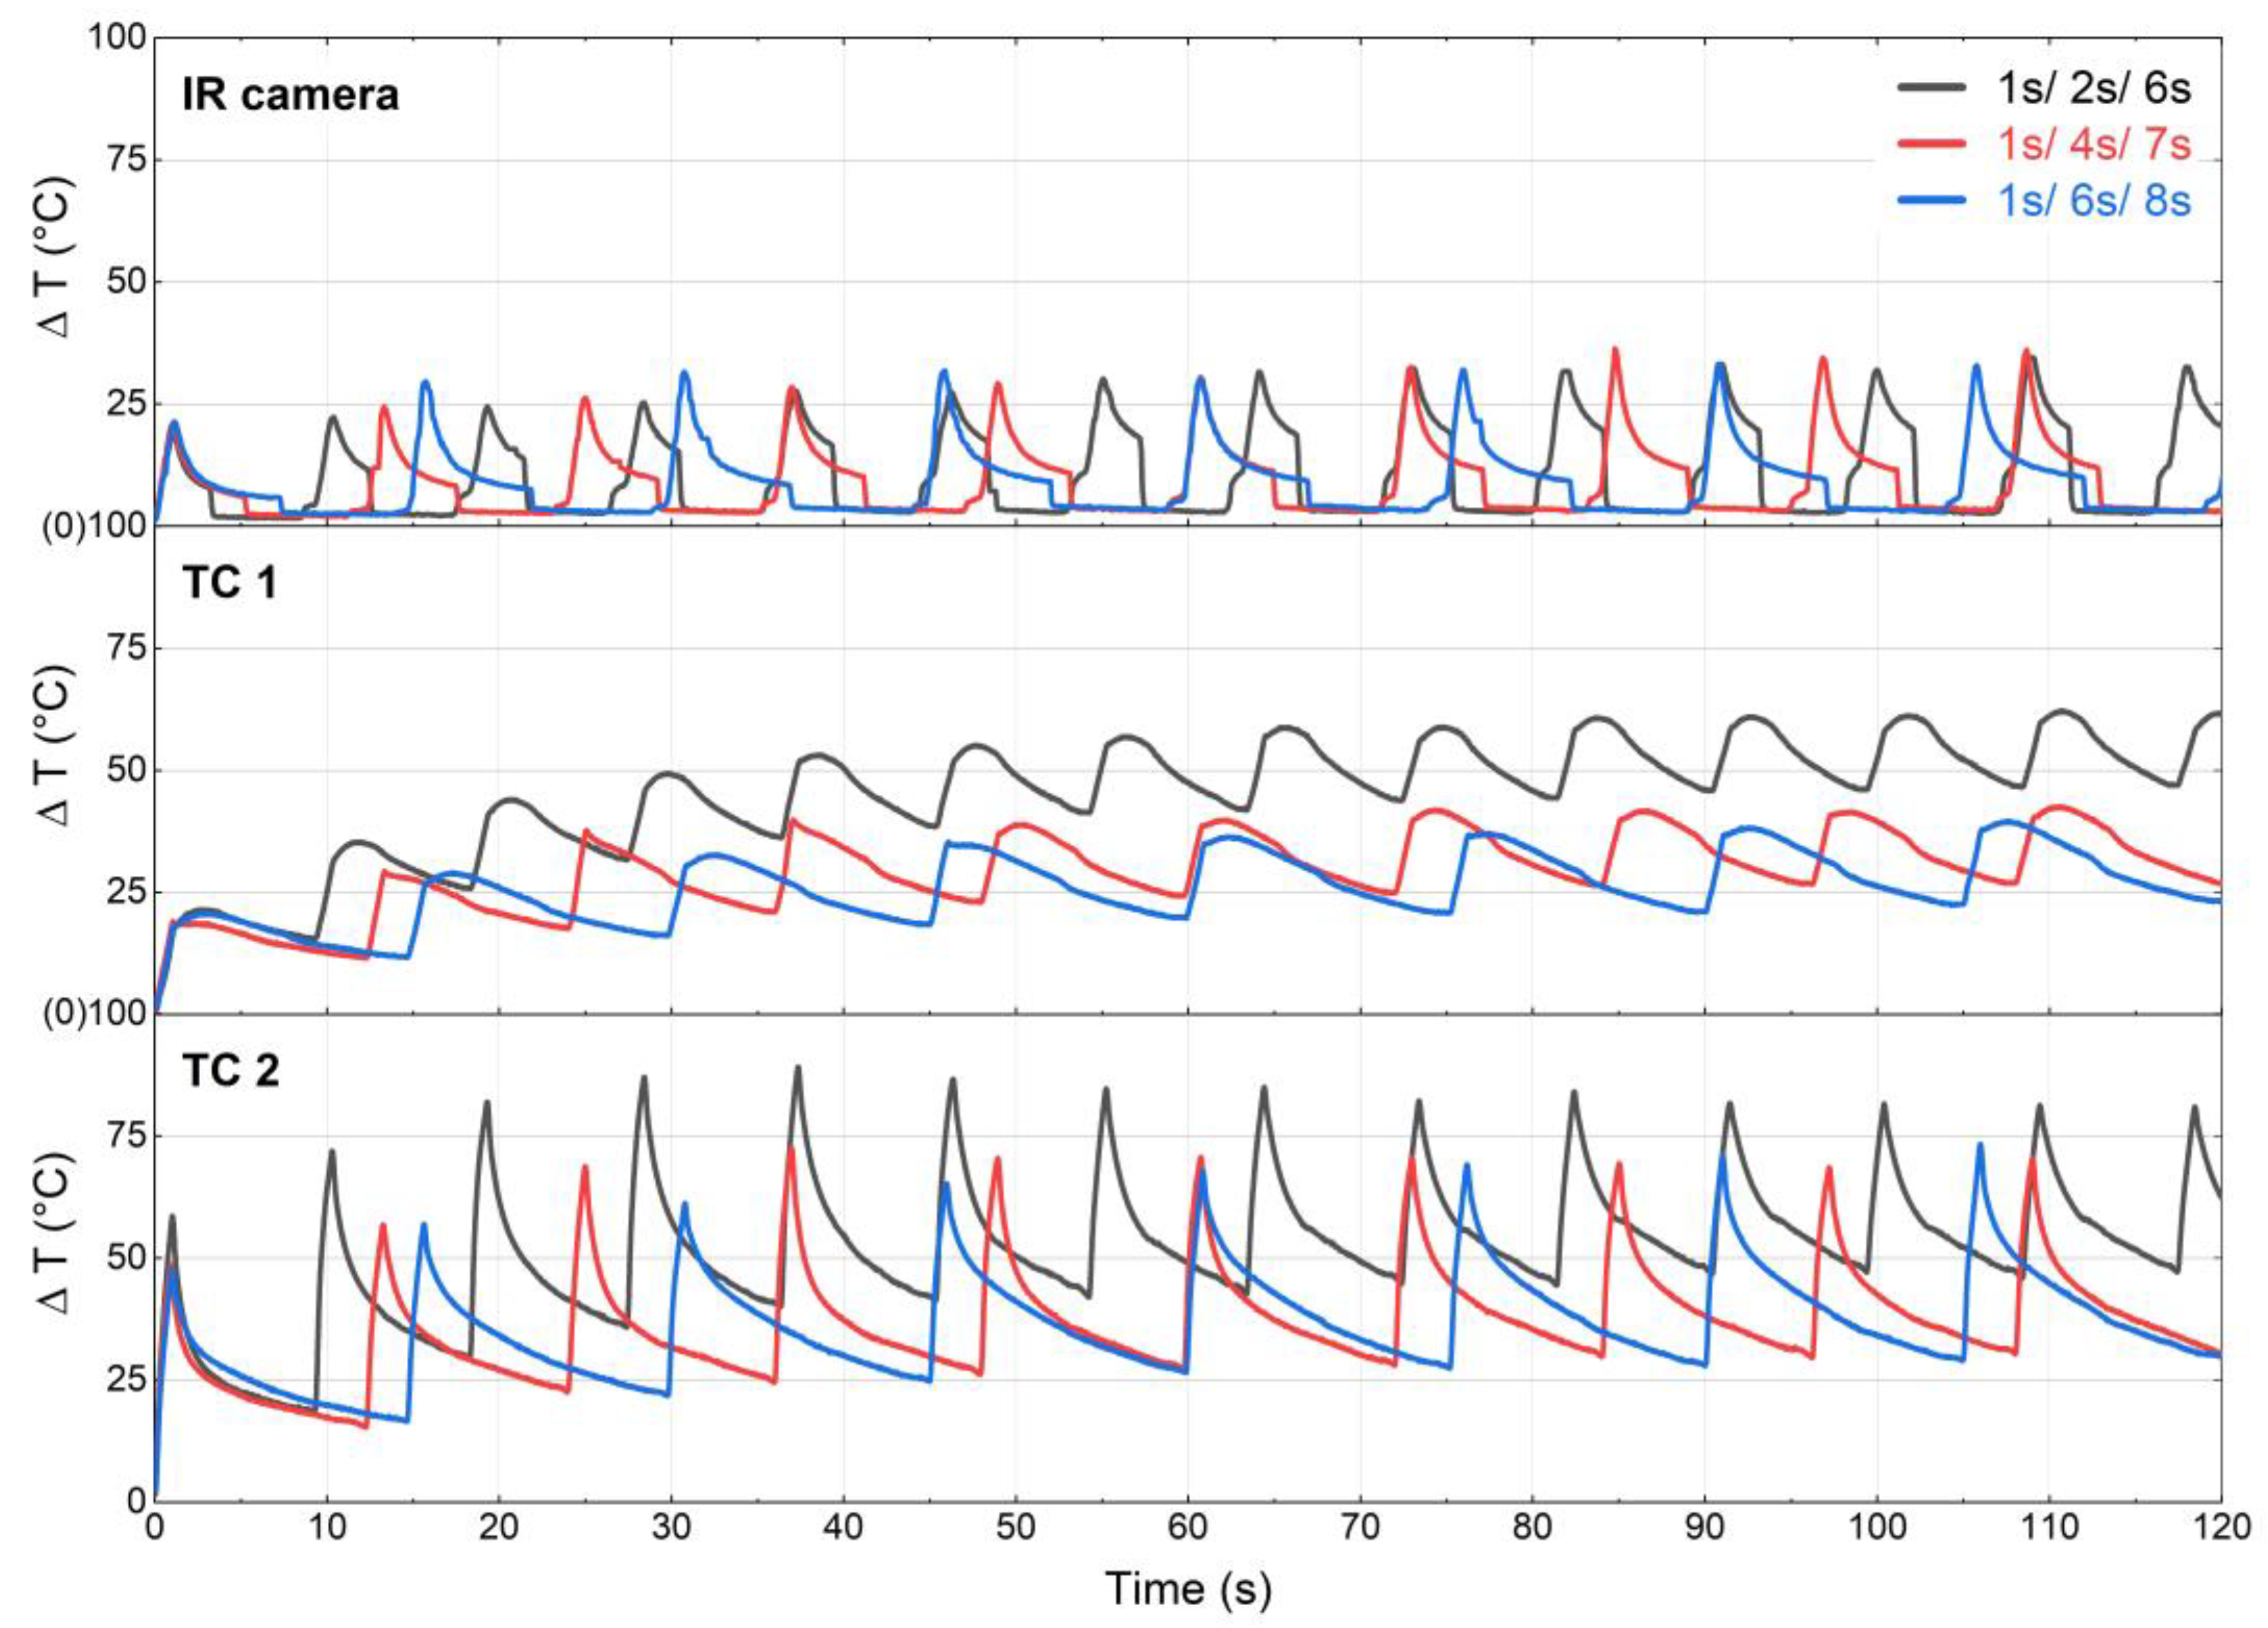
Figure 8 shows time-temperature plots captured using thermometric and thermographic measurement systems, where the increase in surface temperature (∆T) was calculated and plotted as a function of time. The accurate temperature in the contact area, or even close to it, cannot be captured. The high-frequency displacement of the Cu counter body can shake off the thermocouples, and the formation of particles and dust can lead to measurement errors in the IR camera. Nevertheless, the temperature development can be used to analyze the thermal loading, as the heat generated during the ultrasonic pulse and the cooling air eventually result in temperature stabilization. Under these conditions, the temperature difference between the contact area and the measurement points remained dynamically stable.
In the pulse phase, the change in surface temperature increased similarly in all measurements, and the maximum was observed at the end. During the holds and pause phase, the surface temperature initially decreases rapidly and then slows down in measurements conducted by the IR camera and TC2, which shows a trend similar to the interface temperature measurements during the USMW [33,34]. Simultaneously, the temperature in TC1 decreased with an almost constant slope. This difference suggests that the temperature changes in the IR camera and TC2 were primarily influenced by friction in the contact area, whereas TC1 was affected by thermal conduction in the Cu counter body.
Within two minutes, all measurements show temperature stabilization for three different pulse/hold/pause combinations. The longer cooling time (incl. hold and pause) slows the temperature increase on the Cu surface, while the surface temperature of the sonotrode quickly reaches its stabilization state instead. Furthermore, the peak ∆T on the Cu surface was significantly reduced from 81 °C to 70 °C in TC2 and from 61 °C to 41 °C in TC1, with an increased cooling time from 8 s (2 s + 6 s) to 11 s (4 s + 7 s). A further increase in the cooling time shows no remarkable effect, but the total testing duration will increase. The peak ∆T on the sonotrode appears to be unaffected by the loading sequences. This phenomenon may be related to the significant difference in thermal conductivity between the two materials. However, the difference in peak-to-peak temperature within each pulse was not strongly influenced by cooling, implying that thermal loading was mainly induced by friction in the contact area. As the friction force and sliding distance remained constant, the temperature rise due to the frictional work was stable. This result ties well with energy consumption for each pulse that remained at a constant level.

3.5. Failure of the Cu Counter Body

Continuous testing turned out to be more challenging than initially expected. The Cu counter body mostly failed after 250–350 pulses under ultrasonic stimulation. Subsequently, a reliable relative motion cannot be generated in the contact area, and the Cu counter body needs to be replaced by a new one. Various measurements can be employed to characterize this failure process. For further analysis, continuous testing with 1 s/4 s/7 s loading sequences was evaluated as an example.
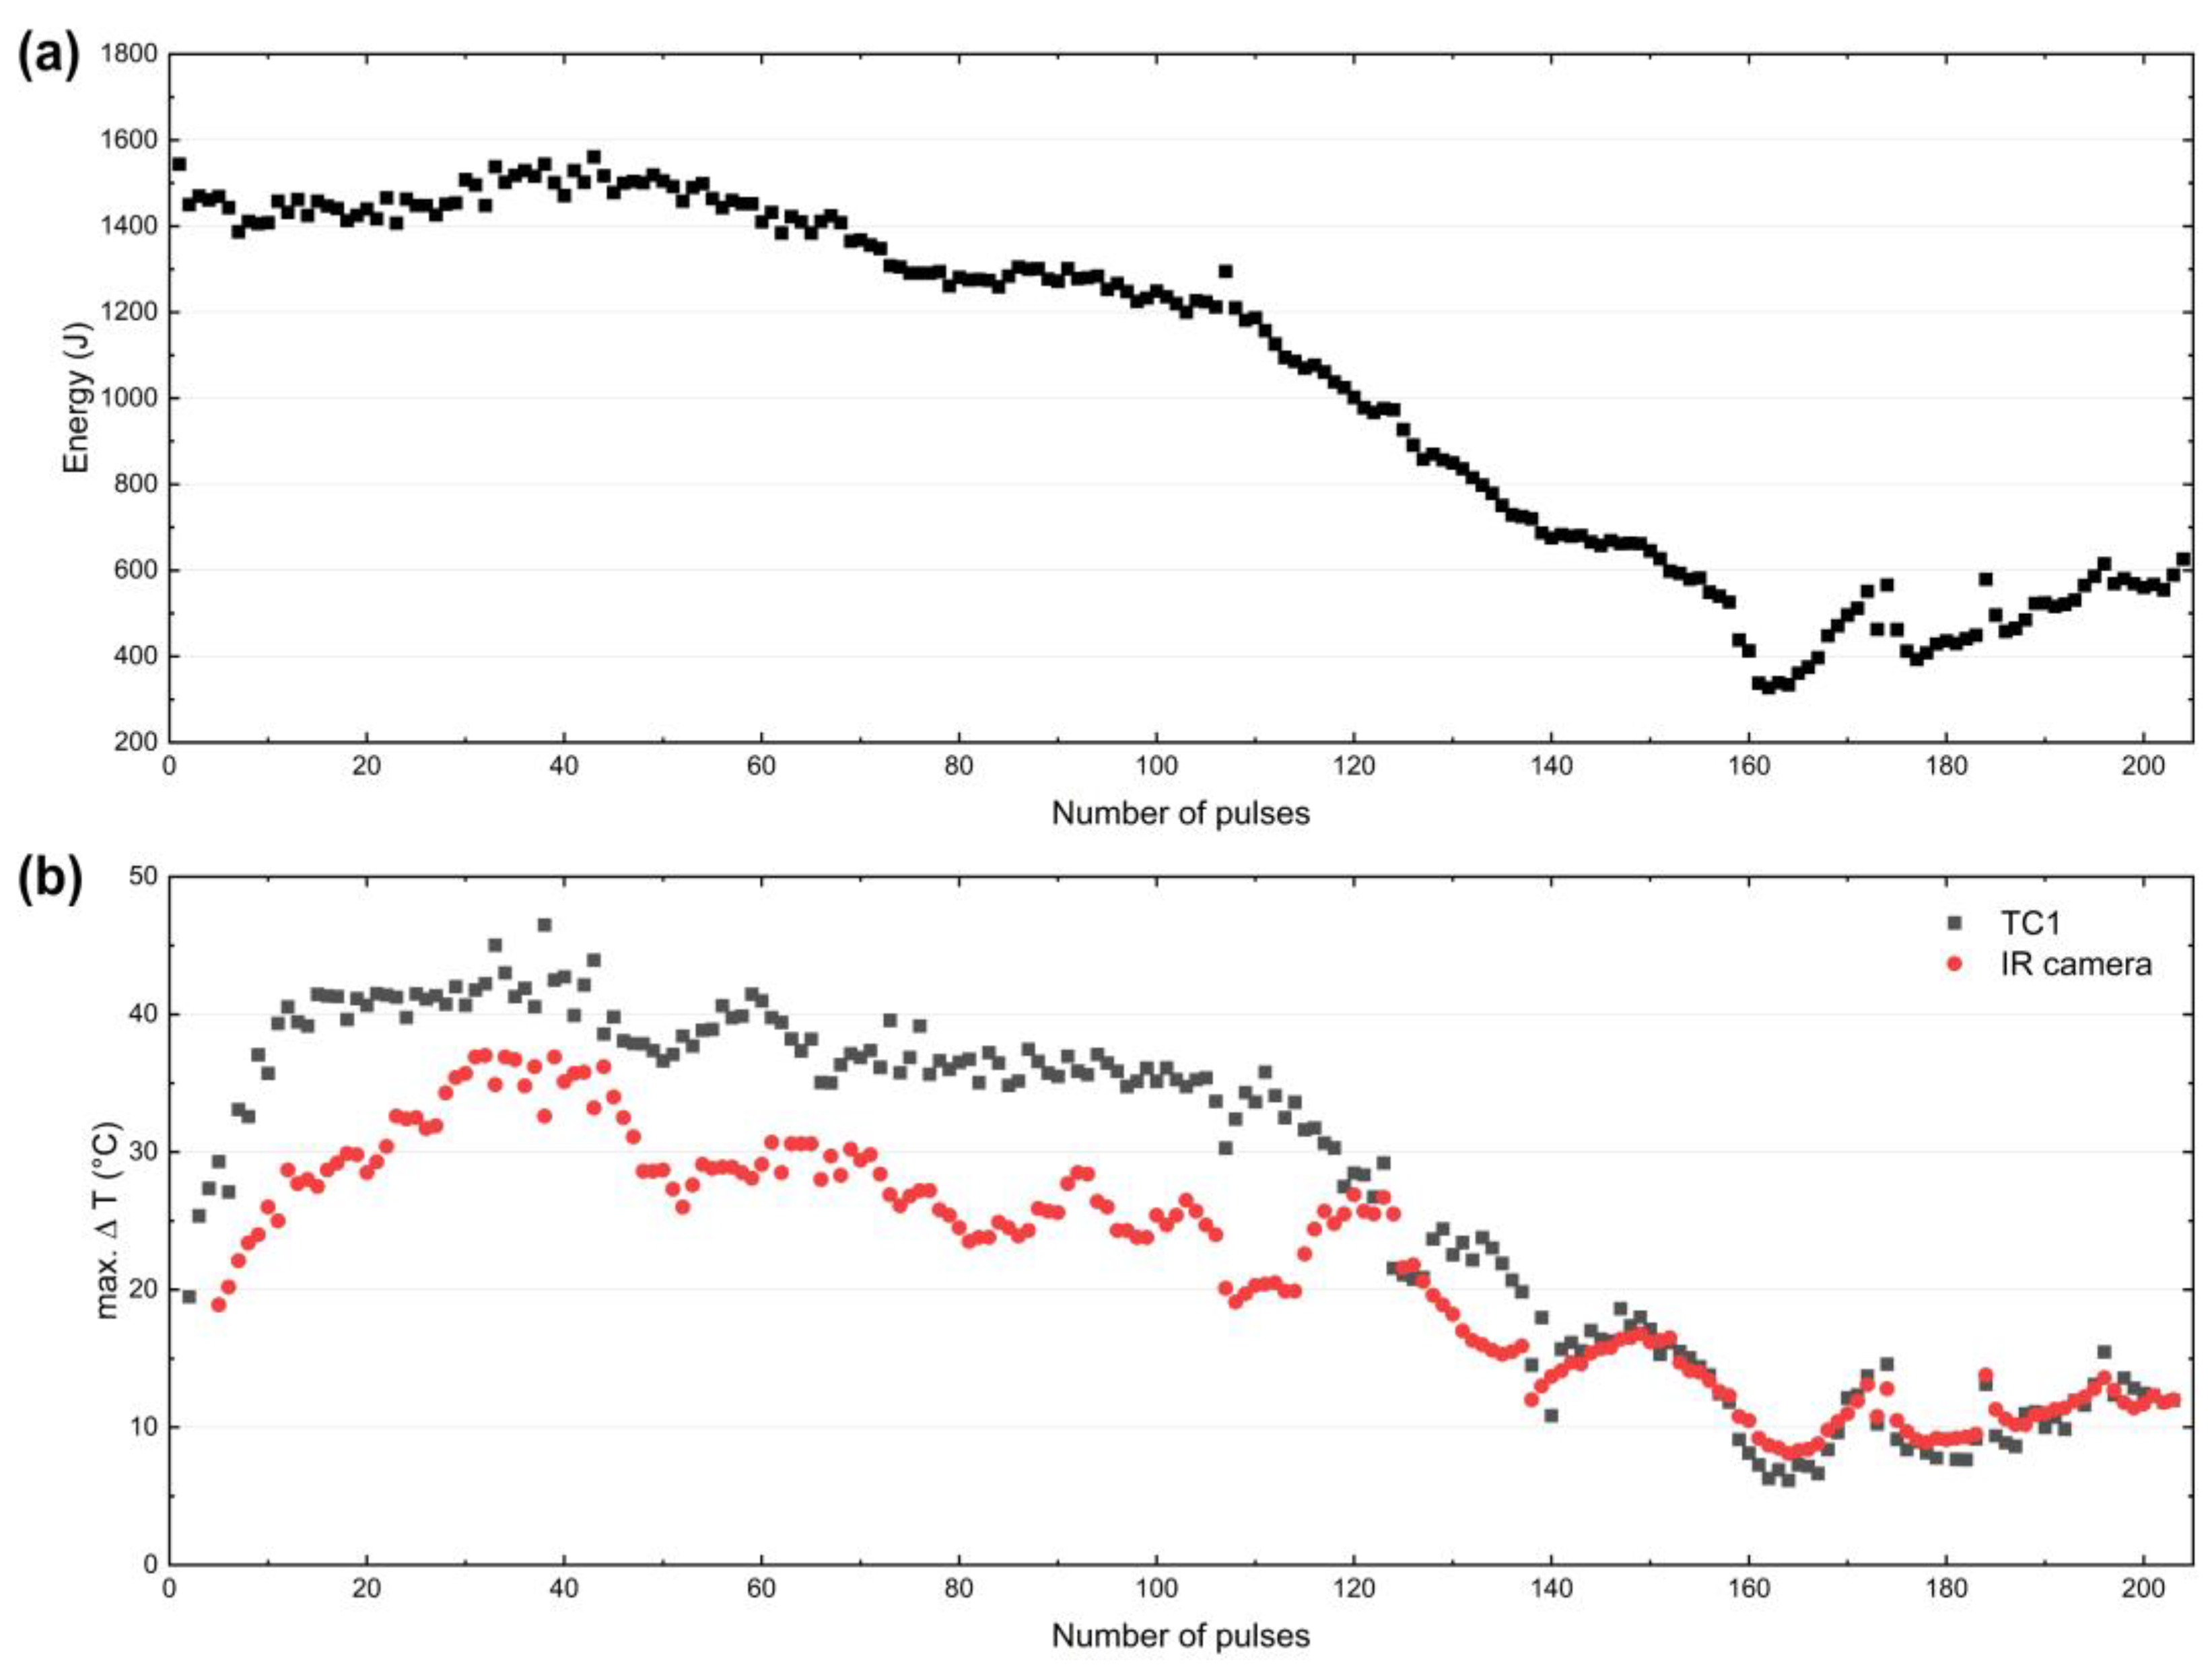
The energy consumption for each pulse can be calculated by integrating the power curve over time and is plotted as a function of pulses in Figure 9a. As the pulse time remained constant at 1 s in this study, energy consumption can represent the mean power that strongly correlates with the friction in the contact area. It can be seen that the energy consumption decreased significantly after 110 pulses and reached a plateau of 400–600 J. Based on this change in energy consumption, the failure process can be divided into three different stages: high energy consumption (stage 1: <110), energy drop (stage 2: 110–160), and low energy consumption (stage 3: >160).
In Figure 9b, the changes in peak temperature within the pulses are plotted against the number of pulses. Owing to the deformation of the Cu counter body under ultrasonic stimulation, the TC2 was dislodged after a certain number of pulses in stage 1, which cannot provide reliable measurements in stages 2 and 3. The temperature developments both on the sonotrode (IR camera) and the Cu (TC1) surface show similar trends as the changes in energy consumption, which implies reduced friction in the contact area and less energy absorption by the Cu counter body.
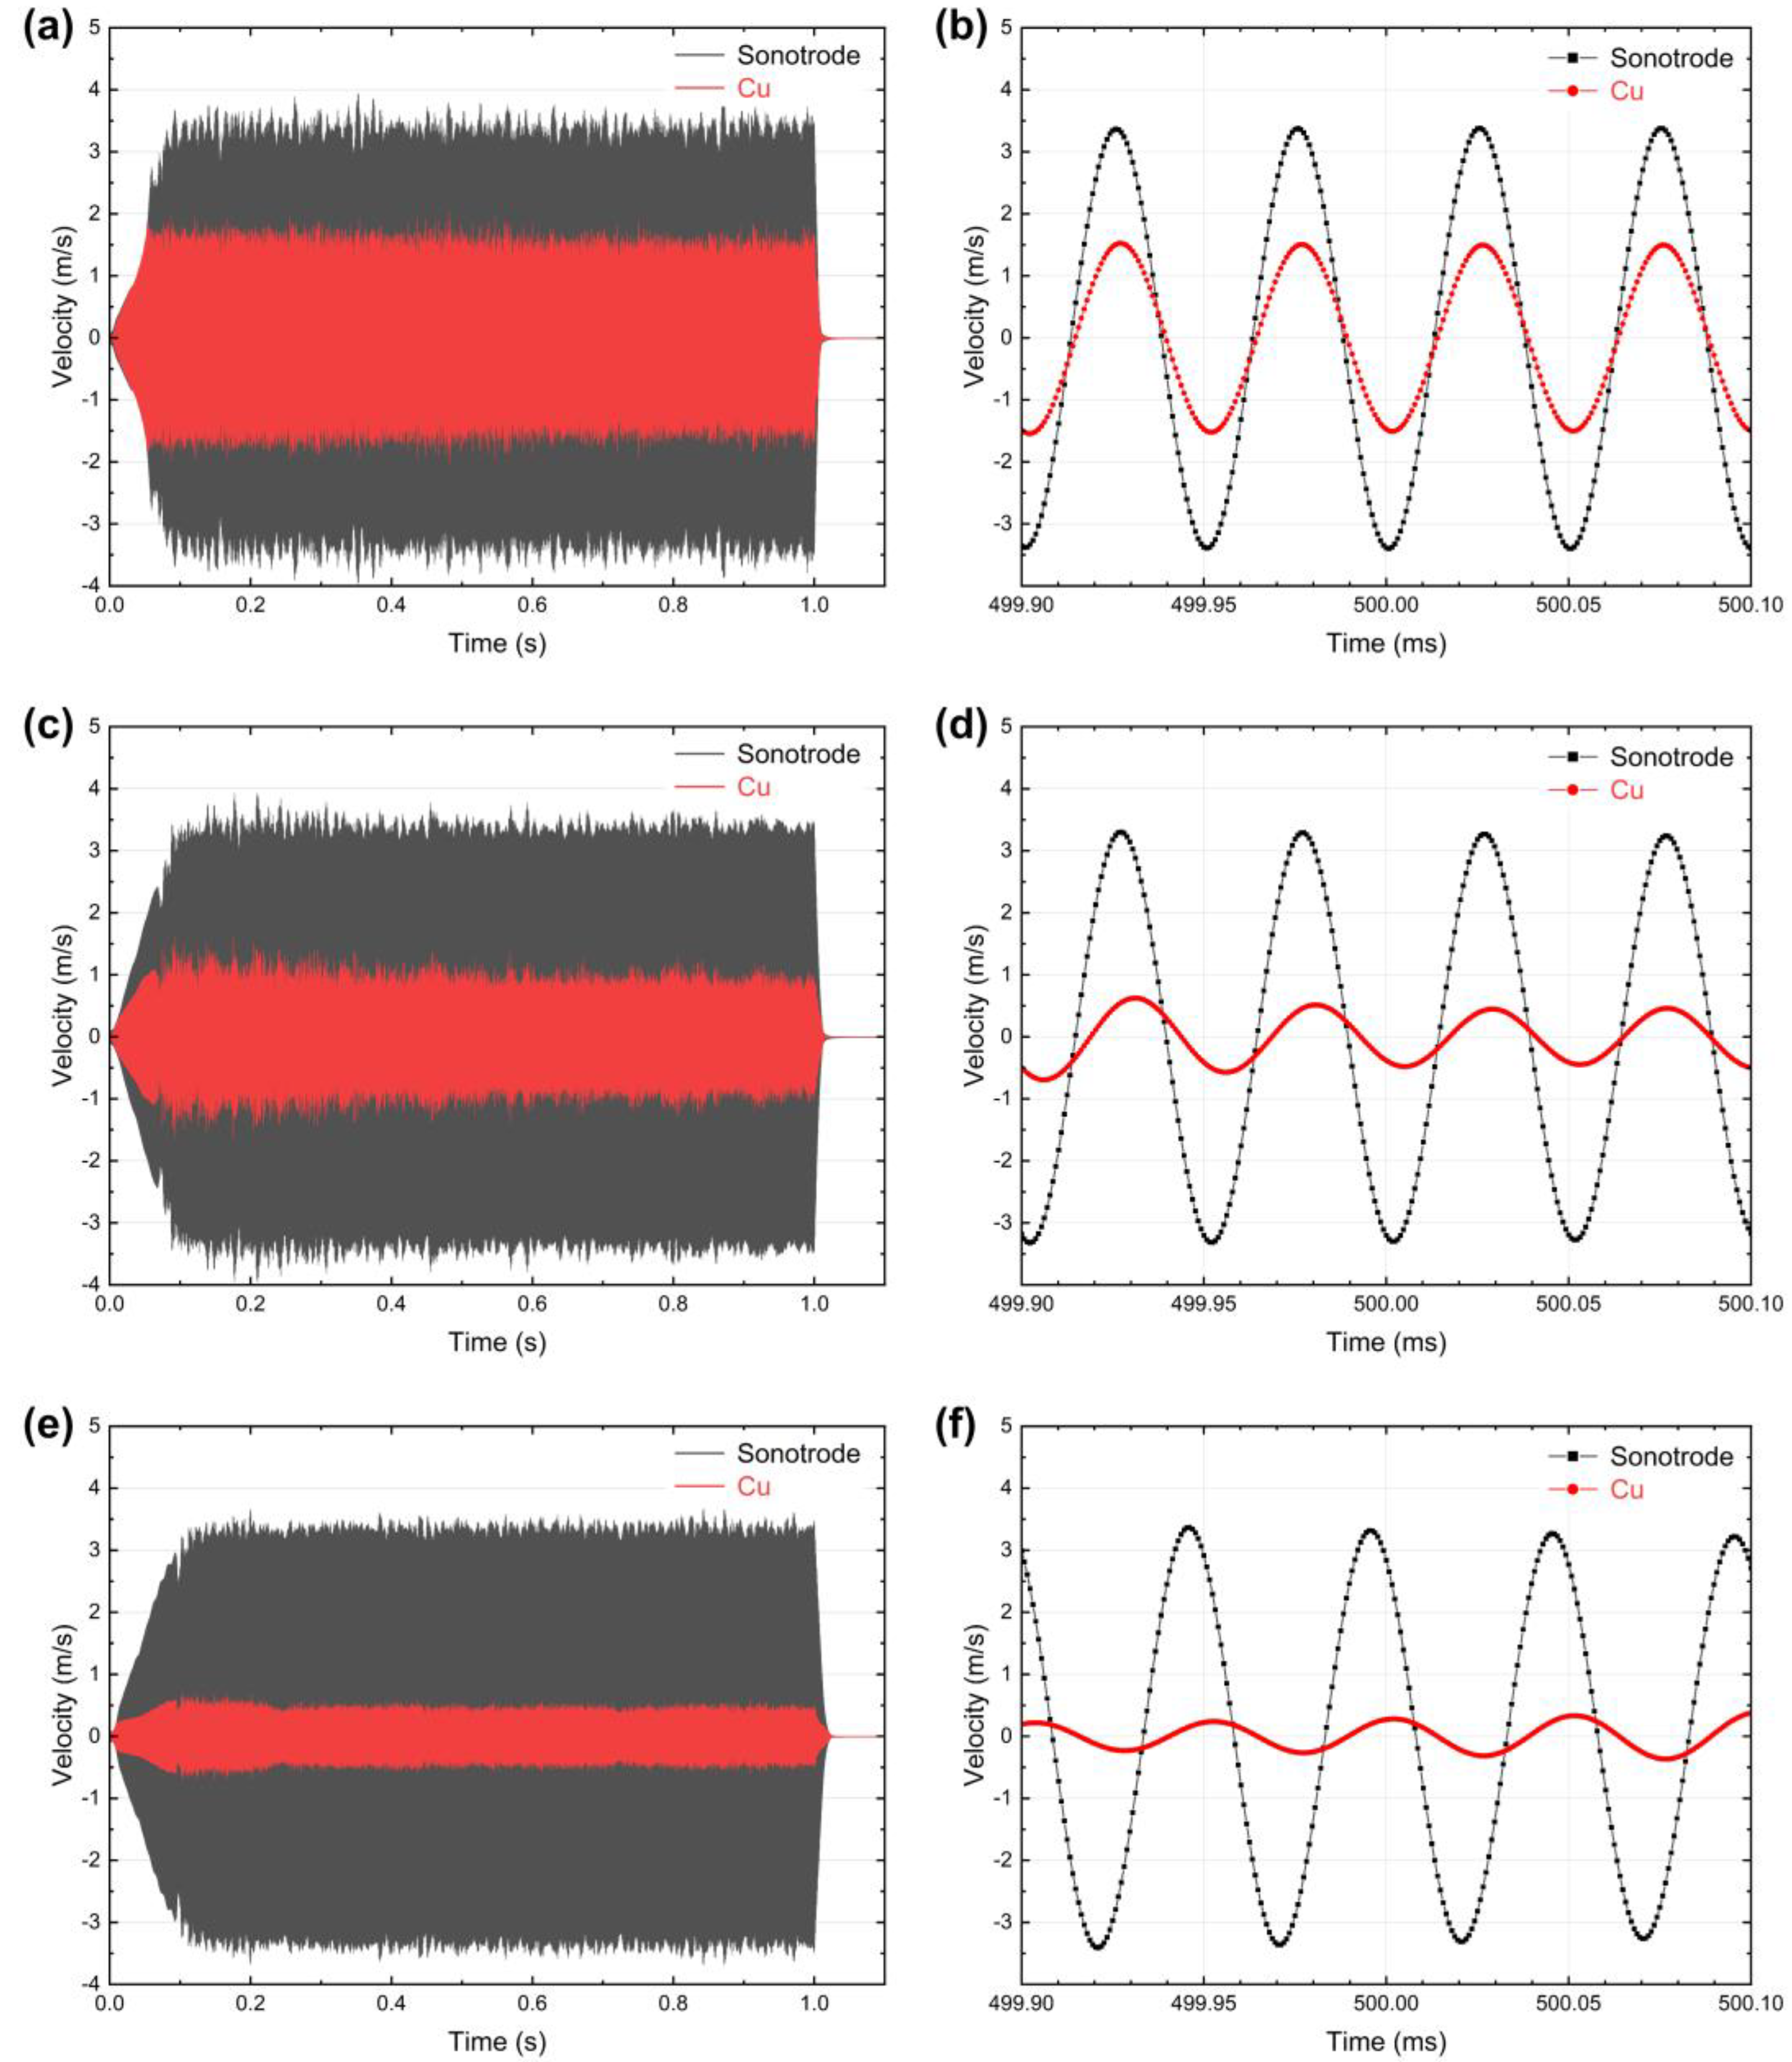
The LDV measurements at the 11th, 132nd, and 187th pulses in three different stages are selected to analyze the variation in the relative motion during the failure process, as shown in Figure 10. While the velocity of the sonotrode remained at 3.5 m/s, it significantly decreased on Cu from 1.7 m/s in stage 1 to 1 m/s in stage 2 and eventually to 0.4 m/s in stage 3. This decrease in velocity is linked to the change in the oscillation behavior of the Cu counter body, which can be attributed to the formation of fractures in the Cu. Furthermore, an explicit velocity difference between the sonotrode and the Cu was observed in the ramp-up phase (<100 ms) when the Cu counter body was in stages 2 and 3, indicating a surface change in the contact area. To analyze the phase angle data, temporal progressions of the velocity signal are extracted at 500 ms and plotted in Figure 10b,d,f. While the sonotrode and Cu oscillations were in phase in stage 1, an initial out-of-phase relative motion was observed in stage 2, as shown in Figure 10d. In stage 3, the relative motion was completely out-of-phase, which differs from the loading conditions during USMW. Despite the velocity difference increasing from stage 1 to stage 3, the energy consumption, or rather the mean power within each pulse, decreased. The friction force is expected to be less, which could be associated with surface changes such as the formation of gaps. This fact results in a lower temperature increase, as observed in Figure 9b.
Figure 11a shows the time-frequency spectrum of the Cu counter body when the final failure occurs. In comparison to the fresh Cu counter body (see Figure 4c), new signal bands were detected at 60 kHz, 80 kHz, and 100 kHz, indicating the shifts in the frequency spectrum and the change in the oscillation behavior. Additionally, periodic fluctuations were observed in each band. This implies that the Cu counter body cannot oscillate at the target resonance frequency of 20 kHz. The frequency and power curves from the generator further confirmed the absence of resonance, as shown in Figure 11b. Figure 11c shows the appearance of the Cu surface. A crack extended nearly along the center line, aligning well with the failure mode under bending loads.

4. Conclusions and Outlook

In this study, a high-frequency test system was developed to study the wear of the sonotrode. An in-phase microslip was successfully generated in the contact area through the specific design of the Cu counter body. The oscillation behavior was validated by time-frequency analysis using LDVs. A thermal-mechanical analysis in the contact area was realized by using this in-house test system.
With an increase in oscillation amplitude from 20 μm to 28 μm, the velocity difference at the sonotrode/Cu interface increased proportionately from 0.83 m/s to 1.88 m/s, resulting in a longer slip distance for the same duration. The frictional force in the contact area was estimated by monitoring the power loss and remained nearly constant throughout the experiments at around 425 N, keeping the Cu counter body oscillating at a constant amplitude. A higher frictional force can be achieved by increasing the normal force.
Temperature evolution was analyzed during the continuous testing. Different loading sequences were applied to investigate their influences on thermal loading. Temperature stabilization was achieved within two minutes under all loading sequences. Although the cooling air and a longer cooling time could suppress the peak temperature, the difference in peak-to-peak temperature within each pulse was not significantly affected, which implies a correlation between thermal and mechanical stress. However, it is important to note that temperature increases can change the material properties, especially for the Cu counter body, which should be improved in future investigations.
Continuous testing in this study was limited due to the failure of the Cu counter body after 250–350 pulses. The failure process can be characterized by various parameters, such as energy consumption, temperature reduction, and changes in oscillation behavior. After the fatigue failure of the Cu counter body, comparable loading conditions could not be generated in the contact area, and the Cu counter body needed to be replaced. As the counter body, materials with high resistance against high-frequency dynamic loading are desired for continuous testing in future investigations.

Author Contributions

Conceptualization, J.L. and F.B.; methodology, J.L.; software, M.R. and J.L.; investigation, J.L.; writing—original draft preparation, J.L.; writing—review and editing, F.B.; project administration, F.B. All authors have read and agreed to the published version of the manuscript.

Funding

This research received no external funding.

Data Availability Statement

The data presented in this study are available in the article.

Acknowledgments

We would like to thank the Walter and Ingeborg Herrmann Foundation for their support of our ultrasonic activities at INATECH. Many thanks to our colleague Balaji Ragupathi for proofreading.

Conflicts of Interest

The authors declare no conflict of interest.

References

  1. Lambiase, F.; Balle, F.; Blaga, L.A.; Liu, F.; Amancio-Filho, S.T. Friction-Based Processes for Hybrid Multi-Material Joining. Compos. Struct. 2021, 266, 113828. [Google Scholar] [CrossRef]
  2. Martinsen, K.; Hu, S.J.; Carlson, B.E. Joining of Dissimilar Materials. CIRP Ann. Manuf. Technol. 2015, 64, 679–699. [Google Scholar] [CrossRef]
  3. Zhang, C.; Li, H.; Liu, Q.; Huang, C.; Zhou, K. Ultrasonic Welding of Aluminum to Steel: A Review. Metals 2023, 13, 29. [Google Scholar] [CrossRef]
  4. Mirza, F.A.; Macwan, A.; Bhole, S.D.; Chen, D.L.; Chen, X.G. Microstructure, Tensile and Fatigue Properties of Ultrasonic Spot Welded Aluminum to Galvanized High-Strength-Low-Alloy and Low-Carbon Steel Sheets. Mater. Sci. Eng. A 2017, 690, 323–336. [Google Scholar] [CrossRef]
  5. Macwan, A.; Kumar, A.; Chen, D. Ultrasonic Spot Welded 6111-T4 Aluminum Alloy to Galvanized High-Strength Low-Alloy Steel: Microstructure and Mechanical Properties. Mater. Des. 2017, 113, 284–296. [Google Scholar] [CrossRef]
  6. Peng, H.; Chen, D.L.; Guo, S.F.; Hong, H.; Zheng, K.H.; Bai, X.F.; Li, D.Y.; Jiang, X.Q. Dissimilar Ultrasonic Spot Welding of Rare-Earth Containing ZEK100 Magnesium-to-Aluminum Alloy with a Zinc Interlayer: Microstructural Evolution and Mechanical Properties. J. Manuf. Process. 2023, 92, 422–434. [Google Scholar] [CrossRef]
  7. Feng, M.N.; Luo, Z. Interface Morphology and Microstructure of High-Power Ultrasonic Spot Welded Mg/Al Dissimilar Joint. Sci. Technol. Weld. Join. 2019, 24, 63–78. [Google Scholar] [CrossRef]
  8. Feng, W.; Zhang, J.; Gao, J.; Xiao, Y.; Luo, G.; Shen, Q. Microstructure and Texture Evolution of Aluminum and Titanium Ultrasonic Welded Joints. Mater. Charact. 2023, 195, 112542. [Google Scholar] [CrossRef]
  9. Liu, Z.; Li, Y.; Liu, Z.; Yang, Y.; Li, Y.; Luo, Z. Ultrasonic Welding of Metal to Fiber-Reinforced Thermoplastic Composites: A Review. J. Manuf. Process. 2023, 85, 702–712. [Google Scholar] [CrossRef]
  10. Zwicker, M.F.R.; Moghadam, M.; Zhang, W.; Nielsen, C.V. Automotive Battery Pack Manufacturing—A Review of Battery to Tab Joining. J. Adv. Join. Process. 2020, 1, 100017. [Google Scholar] [CrossRef]
  11. Cai, W.; Daehn, G.S.; Vivek, A.; Li, J.; Khan, H.; Mishra, R.S.; Komarasamy, M. A State-of-the-Art Review on Solid-State Metal Joining. J. Manuf. Sci. Eng. Trans. ASME 2019, 141, 031012. [Google Scholar] [CrossRef]
  12. Lee, S.S.; Hyung Kim, T.; Hu, S.J.; Cai, W.; Abell, J.A. Joining Technologies for Automotive Lithium-Ion Battery Manufacturing: A Review. In Proceedings of the ASME 2010 International Manufacturing Science and Engineering Conference, Erie, PA, USA, 12–15 October 2010; pp. 541–549. [Google Scholar] [CrossRef]
  13. Lee, S.S.; Hyung Kim, T.; Jack Hu, S.; Cai, W.; Abell, J.A.; Li, J. Characterization of Joint Quality in Ultrasonic Welding of Battery Tabs. J. Manuf. Sci. Eng. 2013, 135, 021004. [Google Scholar] [CrossRef]
  14. Pati, P.R.; Das, S.; Satpathy, M.P.; Routara, B.C.; Sahoo, S.K.; Bhuyan, S.K. Ultrasonic Spot Welding of Al-Cu Sheets: A Comprehensive Study. Mater. Today Proc. 2020, 33, 5168–5173. [Google Scholar] [CrossRef]
  15. Komiyama, K.; Sasaki, T.; Watanabe, Y. Effect of Tool Edge Geometry in Ultrasonic Welding. J. Mater. Process. Technol. 2016, 229, 714–721. [Google Scholar] [CrossRef]
  16. Liesegang, M.; Yu, Y.; Beck, T.; Balle, F. Sonotrodes for Ultrasonic Welding of Titanium/Cfrp-Joints—Materials Selection and Design. J. Manuf. Mater. Process. 2021, 5, 61. [Google Scholar] [CrossRef]
  17. Shin, H.S.; De Leon, M. Parametric Study in Similar Ultrasonic Spot Welding of A5052-H32 Alloy Sheets. J. Mater. Process. Technol. 2015, 224, 222–232. [Google Scholar] [CrossRef]
  18. Du, P.; Chen, W.; Deng, J.; Li, K.; Liu, Y. Effects of Knurl Tooth Angle on Mechanical and Thermal Behaviors of Aluminum Ultrasonic Welding. Ultrasonics 2020, 108, 106207. [Google Scholar] [CrossRef]
  19. Das, A.; Masters, I.; Williams, D. Process Robustness and Strength Analysis of Multi-Layered Dissimilar Joints Using Ultrasonic Metal Welding. Int. J. Adv. Manuf. Technol. 2019, 101, 881–900. [Google Scholar] [CrossRef]
  20. Singh, A.R.; Sudarsan, C.; Das, A.; Hazra, S.; Panda, S.K. Process Optimization and Characterization of Ultra-Thin Dissimilar Sheet Material Joints for Battery Applications Using Ultrasonic Welding. J. Mater. Eng. Perform. 2022, 31, 4133–4149. [Google Scholar] [CrossRef]
  21. Ni, Z.; Yang, J.J.; Gao, Z.T.; Hao, Y.X.; Chen, L.F.; Ye, F. Joint Formation in Ultrasonic Spot Welding of Aluminum to Copper and the Effect of Particle Interlayer. J. Manuf. Process. 2020, 50, 57–67. [Google Scholar] [CrossRef]
  22. Satpathy, M.P.; Das Mohapatra, K.; Sahoo, A.K.; Sahoo, S.K. Parametric Investigation on Microstructure and Mechanical Properties of Ultrasonic Spot Welded Aluminium to Copper Sheets. IOP Conf. Ser. Mater. Sci. Eng. 2018, 338, 012024. [Google Scholar] [CrossRef]
  23. Li, J.; Balle, F. In-Situ Observation of the Bond Formation Process during Ultrasonic Metal Welding of Al / Cu Joints Using Laser Doppler Vibrometry. J. Manuf. Process. 2023, 106, 1–11. [Google Scholar] [CrossRef]
  24. Lee, S.S.; Hyung Kim, T.; Jack Hu, S.; Cai, W.; Abell, J.A. Analysis of Weld Formation in Multilayer Ultrasonic Metal Welding Using High-Speed Images. J. Manuf. Sci. Eng. 2015, 137, 031016. [Google Scholar] [CrossRef]
  25. Gester, A.; Wagner, G.; Pöthig, P.; Bergmann, J.P.; Fritzsche, M. Analysis of the Oscillation Behavior during Ultrasonic Welding of EN AW-1070 Wire Strands and EN CW004A Terminals. Weld. World 2022, 66, 567–576. [Google Scholar] [CrossRef]
  26. Shao, C.; Hyung Kim, T.; Jack Hu, S.; Jin, J.; Abell, J.A.; Patrick Spicer, J. Tool Wear Monitoring for Ultrasonic Metal Welding of Lithium-Ion Batteries. J. Manuf. Sci. Eng. 2015, 138, 051005. [Google Scholar] [CrossRef]
  27. Balz, I.; Rosenthal, E.; Reimer, A.; Turiaux, M.; Schiebahn, A.; Reisgen, U. Analysis of the Thermo-Mechanical Mechanism during Ultrasonic Welding of Battery Tabs Using High-Speed Image Capturing. Weld. World 2019, 63, 1573–1582. [Google Scholar] [CrossRef]
  28. Nazir, Q.; Shao, C. Online Tool Condition Monitoring for Ultrasonic Metal Welding via Sensor Fusion and Machine Learning. J. Manuf. Process. 2021, 62, 806–816. [Google Scholar] [CrossRef]
  29. Spaltmann, D.; Hartelt, M.; Woydt, M. Triboactive Materials for Dry Reciprocating Sliding Motion at Ultra-High Frequency. Wear 2009, 266, 167–174. [Google Scholar] [CrossRef]
  30. Spaltmann, D.; Hartelt, M.; Woydt, M. Ultra-High Frequency Tribometer for Reciprocating Sliding Motion. Tribo Test 2007, 13, 153–164. [Google Scholar] [CrossRef]
  31. Lu, Y.; Song, H.; Taber, G.A.; Foster, D.R.; Daehn, G.S.; Zhang, W. In-Situ Measurement of Relative Motion during Ultrasonic Spot Welding of Aluminum Alloy Using Photonic Doppler Velocimetry. J. Mater. Process. Technol. 2016, 231, 431–440. [Google Scholar] [CrossRef]
  32. Arimoto, K.; Sasaki, T.; Doi, Y.; Kim, T. Ultrasonic Bonding of Multi-Layered Foil Using a Cylindrical Surface Tool. Metals 2019, 9, 505. [Google Scholar] [CrossRef]
  33. Li, H.; Cao, B. Effects of Welding Pressure on High-Power Ultrasonic Spot Welding of Cu/Al Dissimilar Metals. J. Manuf. Process. 2019, 46, 194–203. [Google Scholar] [CrossRef]
  34. Fujii, H.T.; Endo, H.; Sato, Y.S.; Kokawa, H. Interfacial Microstructure Evolution and Weld Formation during Ultrasonic Welding of Al Alloy to Cu. Mater. Charact. 2018, 139, 233–240. [Google Scholar] [CrossRef]
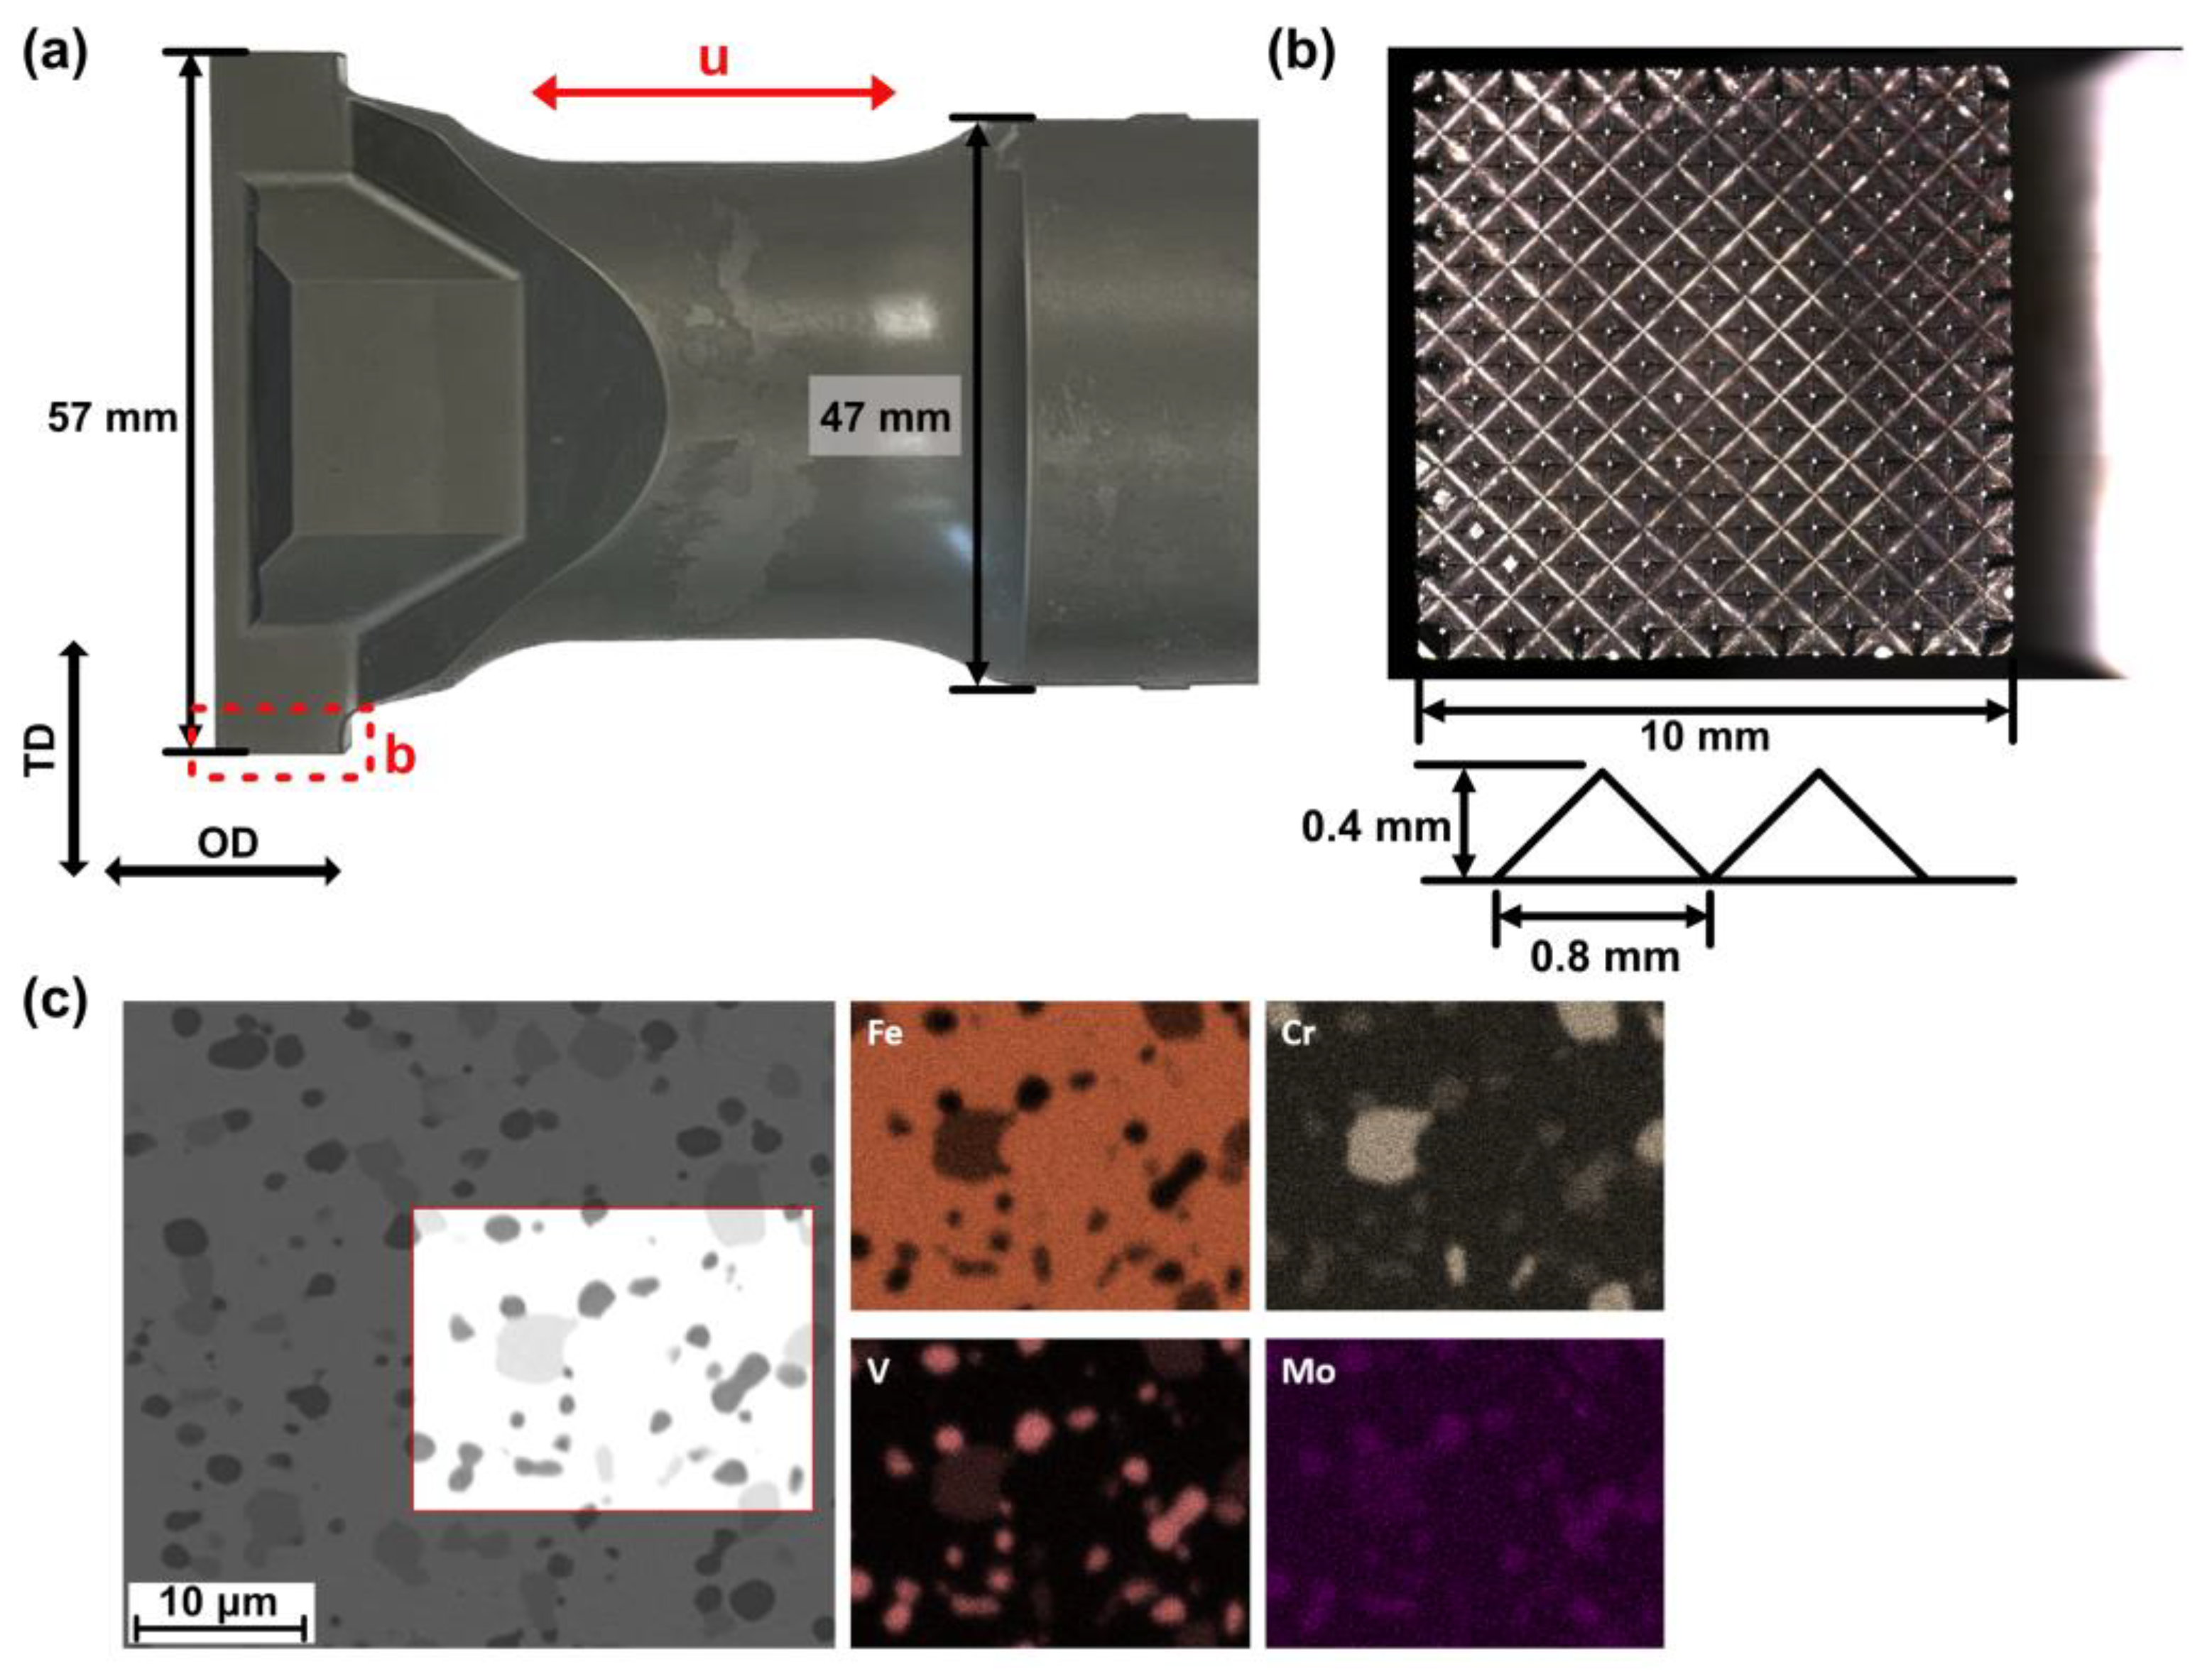
Figure 1. (a) Sonotrode used in this study, (b) Sonotrode knurl geometry, and (c) SEM/EDX analysis of sonotrode material.
Metals 13 01935 g001
Figure 2. (a) Result of finite element calculations for different specimen geometry (thickness = 10 mm), (b) transversal bending eigenmode at 20 kHz, and (c) relative displacement as a function of position.
Metals 13 01935 g002
Figure 3. (a) Experimental setup, (b) arrangement of measurement points for TCs and LDVs, and (c) IR thermography.
Metals 13 01935 g003
Figure 4. STFT-spectra for (a) the sonotrode and Cu counter bodies with (b) 80 mm and (c) 53 mm length.
Metals 13 01935 g004
Figure 5. (a) Velocity envelopes of the sonotrode and the Cu counter body and (b) calculated relative velocity after the ramp-up phase with different oscillation amplitudes: 20 µm, 24 µm, and 28 µm.
Metals 13 01935 g005
Figure 6. Generator power curves during (a) experiments and (b) free oscillations with different amplitudes.
Metals 13 01935 g006
Figure 7. Pulse/hold/pause combination based on LDV measurements.
Metals 13 01935 g007
Figure 8. Time-temperature development with different pulse/hold/pause combinations: IR camera, TC1, and TC2.
Metals 13 01935 g008
Figure 9. (a) Energy consumption and (b) change in maximum surface temperature variation over the number of pulses.
Metals 13 01935 g009
Figure 10. LDV measurements in different pulses: (a) 11; (c) 132; (e) 187; and (b,d,f) a detailed section of (a,c,e) at 500 ms.
Metals 13 01935 g010
Figure 11. (a) STFT-spectrum for the Cu counter body, (b) frequency and power curves during the pulse, and (c) appearance of the Cu surface after failure of the Cu counter body.
Metals 13 01935 g011
Table 1. Properties of Cu for the modal analysis.
Young’s ModulusPoisson’s RatioMass Density
1.27 GPa0.348940 kg/m3
Disclaimer/Publisher’s Note: The statements, opinions and data contained in all publications are solely those of the individual author(s) and contributor(s) and not of MDPI and/or the editor(s). MDPI and/or the editor(s) disclaim responsibility for any injury to people or property resulting from any ideas, methods, instructions or products referred to in the content.