Abstract
Reverse engineering methods like 3D scanning are becoming common in engineering practice. These methods enable engineers to reproduce the original shape of a scanned part. If other properties are required, then other reverse engineering methods can follow. Estimation of fatigue is a tricky task even if the material properties of the base material are known. Fatigue is influenced not only by material properties and the part’s shape but also by technological processes. Fast fatigue life estimation of stamped parts using reverse engineering methods is the target of this paper. The forming process, which has a crucial impact on the fatigue of stamped parts, is considered via inverse stamping. Adaptation of inverse stamping method from shell FEM meshes to volumetric meshes is included. The article also discusses the application of two methods, the Material Law for Steel Sheets (MLSS) and the Method of Variable Slopes (MVS). These methods adjust the fatigue curve based on effective plastic strain calculated by inverse stamping. Calculated results were compared with experimental results. In most situations, there is a good agreement between the calculations and the tests of the specimens without surface coatings. Sometimes, the calculated results are more conservative than the experiments. This is acceptable in component design in terms of reliability. When a Zn-Ni surface coating was applied, the fatigue life of the specimen decreased.
1. Introduction
Prediction of the fatigue life is very important task in the design of the machines [1] and their attachment [2]. This paper focuses on fatigue in cold stamped parts [3,4] (p. 16). Cold forming has a significant impact on fatigue [5,6]. Therefore, fatigue tests were performed and the effects affecting the fatigue life were studied. Methods for the prediction of cold formed parts have also been investigated and designed to easily include the effect of forming in high cycle fatigue.
Cold forming leads to plastic deformations, residual stresses initiation and changes in wall thickness. The spring-back effect [7,8] is occurring, when the forming tool is opened. It leads to a change in the shape of the part. All these effects can impacting the fatigue life.
Plastic strain influences the shape of the fatigue curve. This effect is studied in [9] and the Material Law for Steel Sheets (MLSS) method is formulated. A similar method was published by [10] called Method of Variable Slopes (MVS). MLSS and MVS adjust the fatigue curve based on the effective plastic strain originating during forming. MLSS and MVS are included in FEMFAT 2022a fatigue software which was used for the final fatigue evaluation. The same software and same methods were used in [11,12]. To make them easier to use, MLSS and MVS methods do not distinguish what type of pre-strain condition is present. There are also attempts to consider the type of pre-strain, as in [13].
Also, residual stress which appear during forming influence the lifetime of such parts. Residual stress relaxes when a part is exposed to a cyclic load. According to [10], if stress amplitude is higher than yield strength then stress relaxation is nearly complete. Therefore, its impact on fatigue can be weak.
From what has been stated it is obvious that effective plastic strain originating during forming is important for fatigue. It is possible to perform an incremental forming simulation as shown in [14], but the calculation time can be long. Simulation requires knowledge of the forming process in detail, which is not always available, especially not in reverse engineering. Also, other problems which are discussed later could occur if this approach is used.
If incremental simulation cannot be used for some reason, then a simplified calculation method is a welcome alternative. Facchinetti et al. [15] proposed a calculation method based on the local curvature of a part. Its purpose is to calculate the plastic strain and residual stress of stamped parts. This approach has some limitations. An example of such a limitation can be the fact that this method takes into account only the bending deformation [16] and neglects the membrane deformation [17].
Almost no attention has been paid to inverse stamping [18,19,20,21] used in conjunction with fatigue life evaluation. But in fact, this method provides more accurate results than those offered by the methods described above. At the same time, inverse stamping maintains simple use and short calculation time. Inverse stamping is more complex, so it provides more realistic results even for geometrically complicated bodies. It needs the final shape of the product and the material properties as inputs, i.e., no models of forming tools are required. This is a great advantage if the details of the forming process are unknown. Also, calculation time compared to incremental forming simulation is significantly shorter [22]. On the other hand, a longer calculation time than for Facchinetti’s method is expected.
An algorithm of inverse stamping is formulated for shell structures [23,24,25]. If the metal sheet thickness is high compared to the body curvature then it makes more sense to model the calculated body as a volumetric body. Also, if a 3D scan [26] is used as the input for inverse stamping then it is helpful to use a volumetric model in the calculation. This means that the inverse stamping algorithm needs to be adapted from shell structures to volumetric structures. This adaptation is described below.
This article presents a computational method where the effective plastic deformation occurring during cold forming is determined using adapted inverse stamping. Using the MVS and MLSS methods, the effect of plastic deformation on the fatigue curve is determined at each point of the component. Using the modified fatigue curves, the fatigue life of the entire component is then determined.
2. Materials and Methods
2.1. Materials
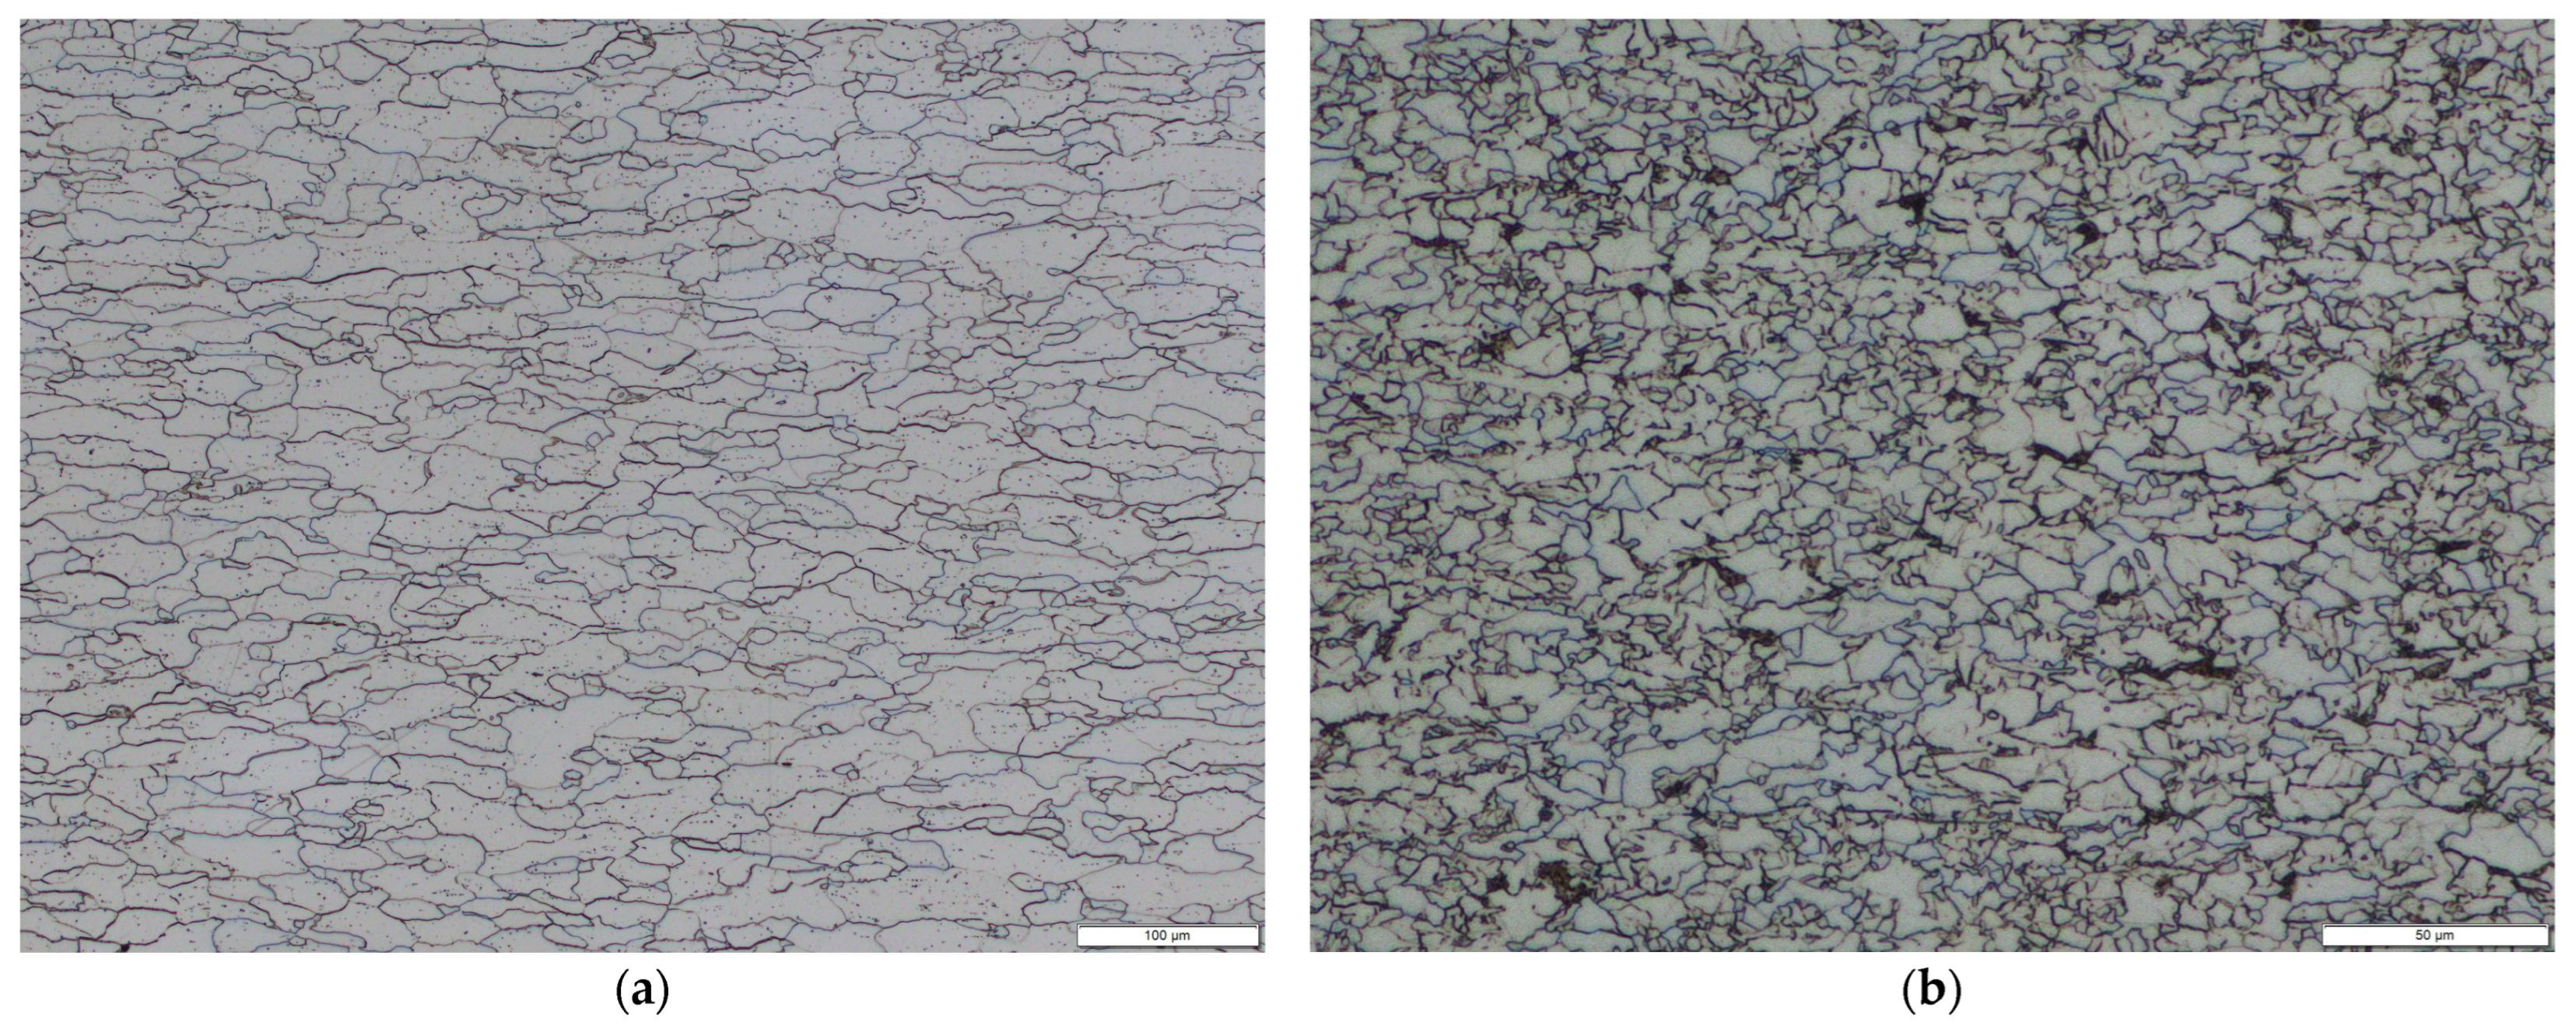
The calculation procedure described in previous section was validated with physical tests. Specimens A–D (described later in Section 3) made from materials DC04 and S420MC were used for this purpose. The microstructure of DC04 (Figure 1a) includes ferrite grains. The grain size is inhomogeneous. Figure 1b shows the microstructure of S420MC where fine grain size can be observed. DC04 is a cold rolled low strength steel, S420MC is a hot rolled low alloy steel.
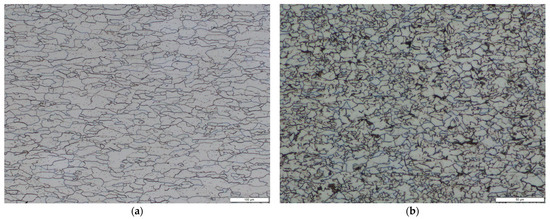
Figure 1.
Microstructure of DC04 (a) and microstructure of S420MC (b).
Chemical composition of material S420MC declared by supplier is in Table 1. Chemical composition of DC04 according to [27] is also in Table 1.

Table 1.
Chemical composition of used materials.
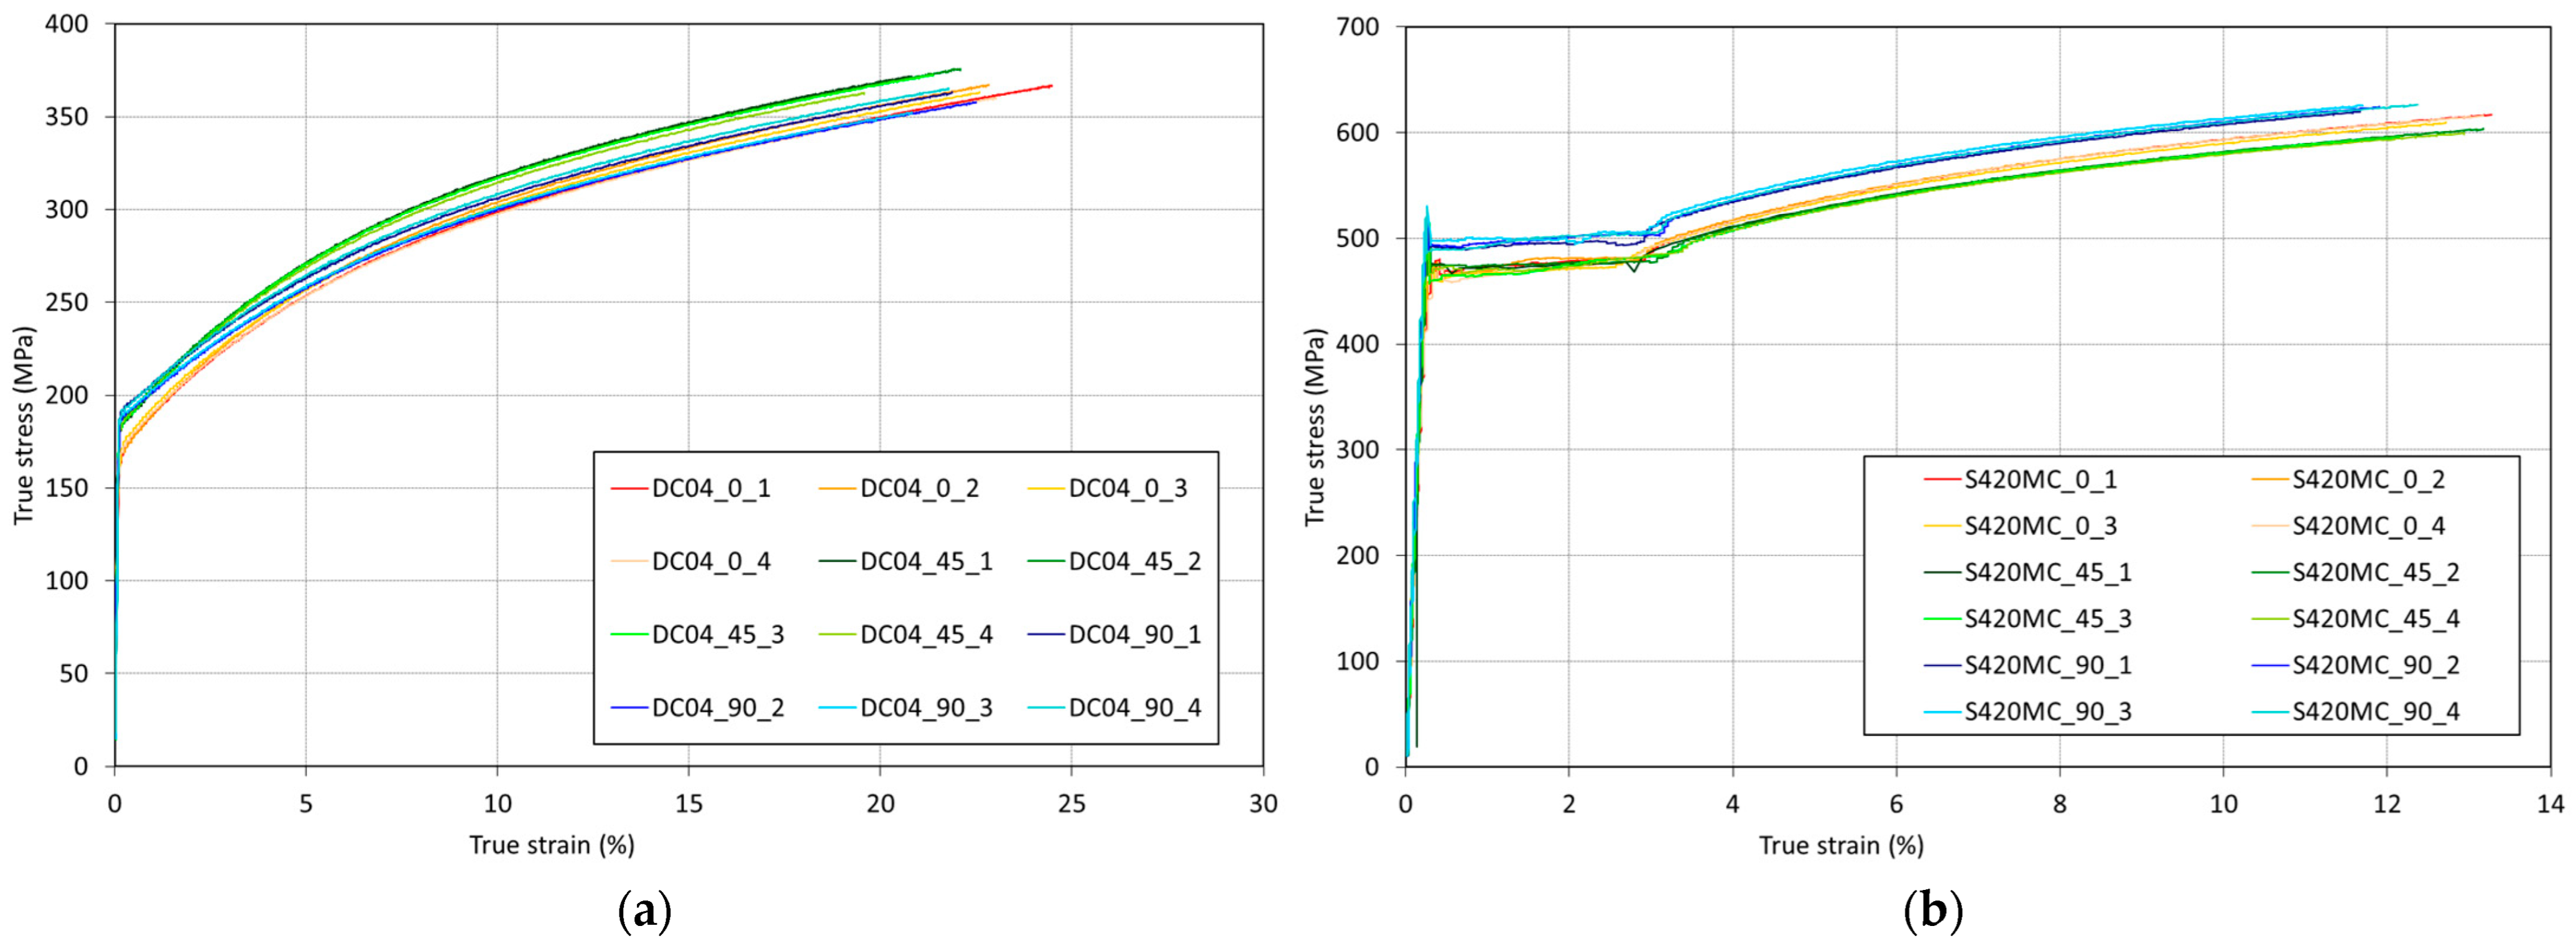
Whether the effect of forming is determined using inverse stamping or incremental forming simulation, it is necessary to determine the mechanical properties of both materials. These properties are then used in a mathematical model, that determines the effect of forming on the properties of the part. The used sheets were produced by rolling, which causes direction-dependent behaviour. Therefore, samples were taken from the sheets in the direction of rolling, in the direction of 45° to the direction of rolling and in the direction perpendicular to the direction of rolling. The samples were subsequently used for tensile tests. Figure 2a shows stress-strain curves of material DC04, Figure 2b shows stress-strain curves of material S420MC. Since the curves are used as input for a mathematical model, they show the dependence of the true stress on the true strain.
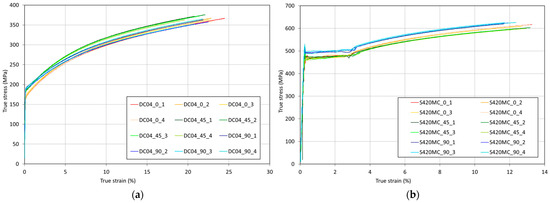
Figure 2.
Stress-strain curves of DC04 (a) and stress-strain curves of S420MC (b).
The tensile curves represent the behaviour of the directionally dependent material. Selected direction-dependent material properties are in Table 2. Rp0.2 denotes yield strength, Rm is ultimate strength, Ag represents uniform elongation and r is Lankford ratio.
Table 2.
Directional dependent material properties.
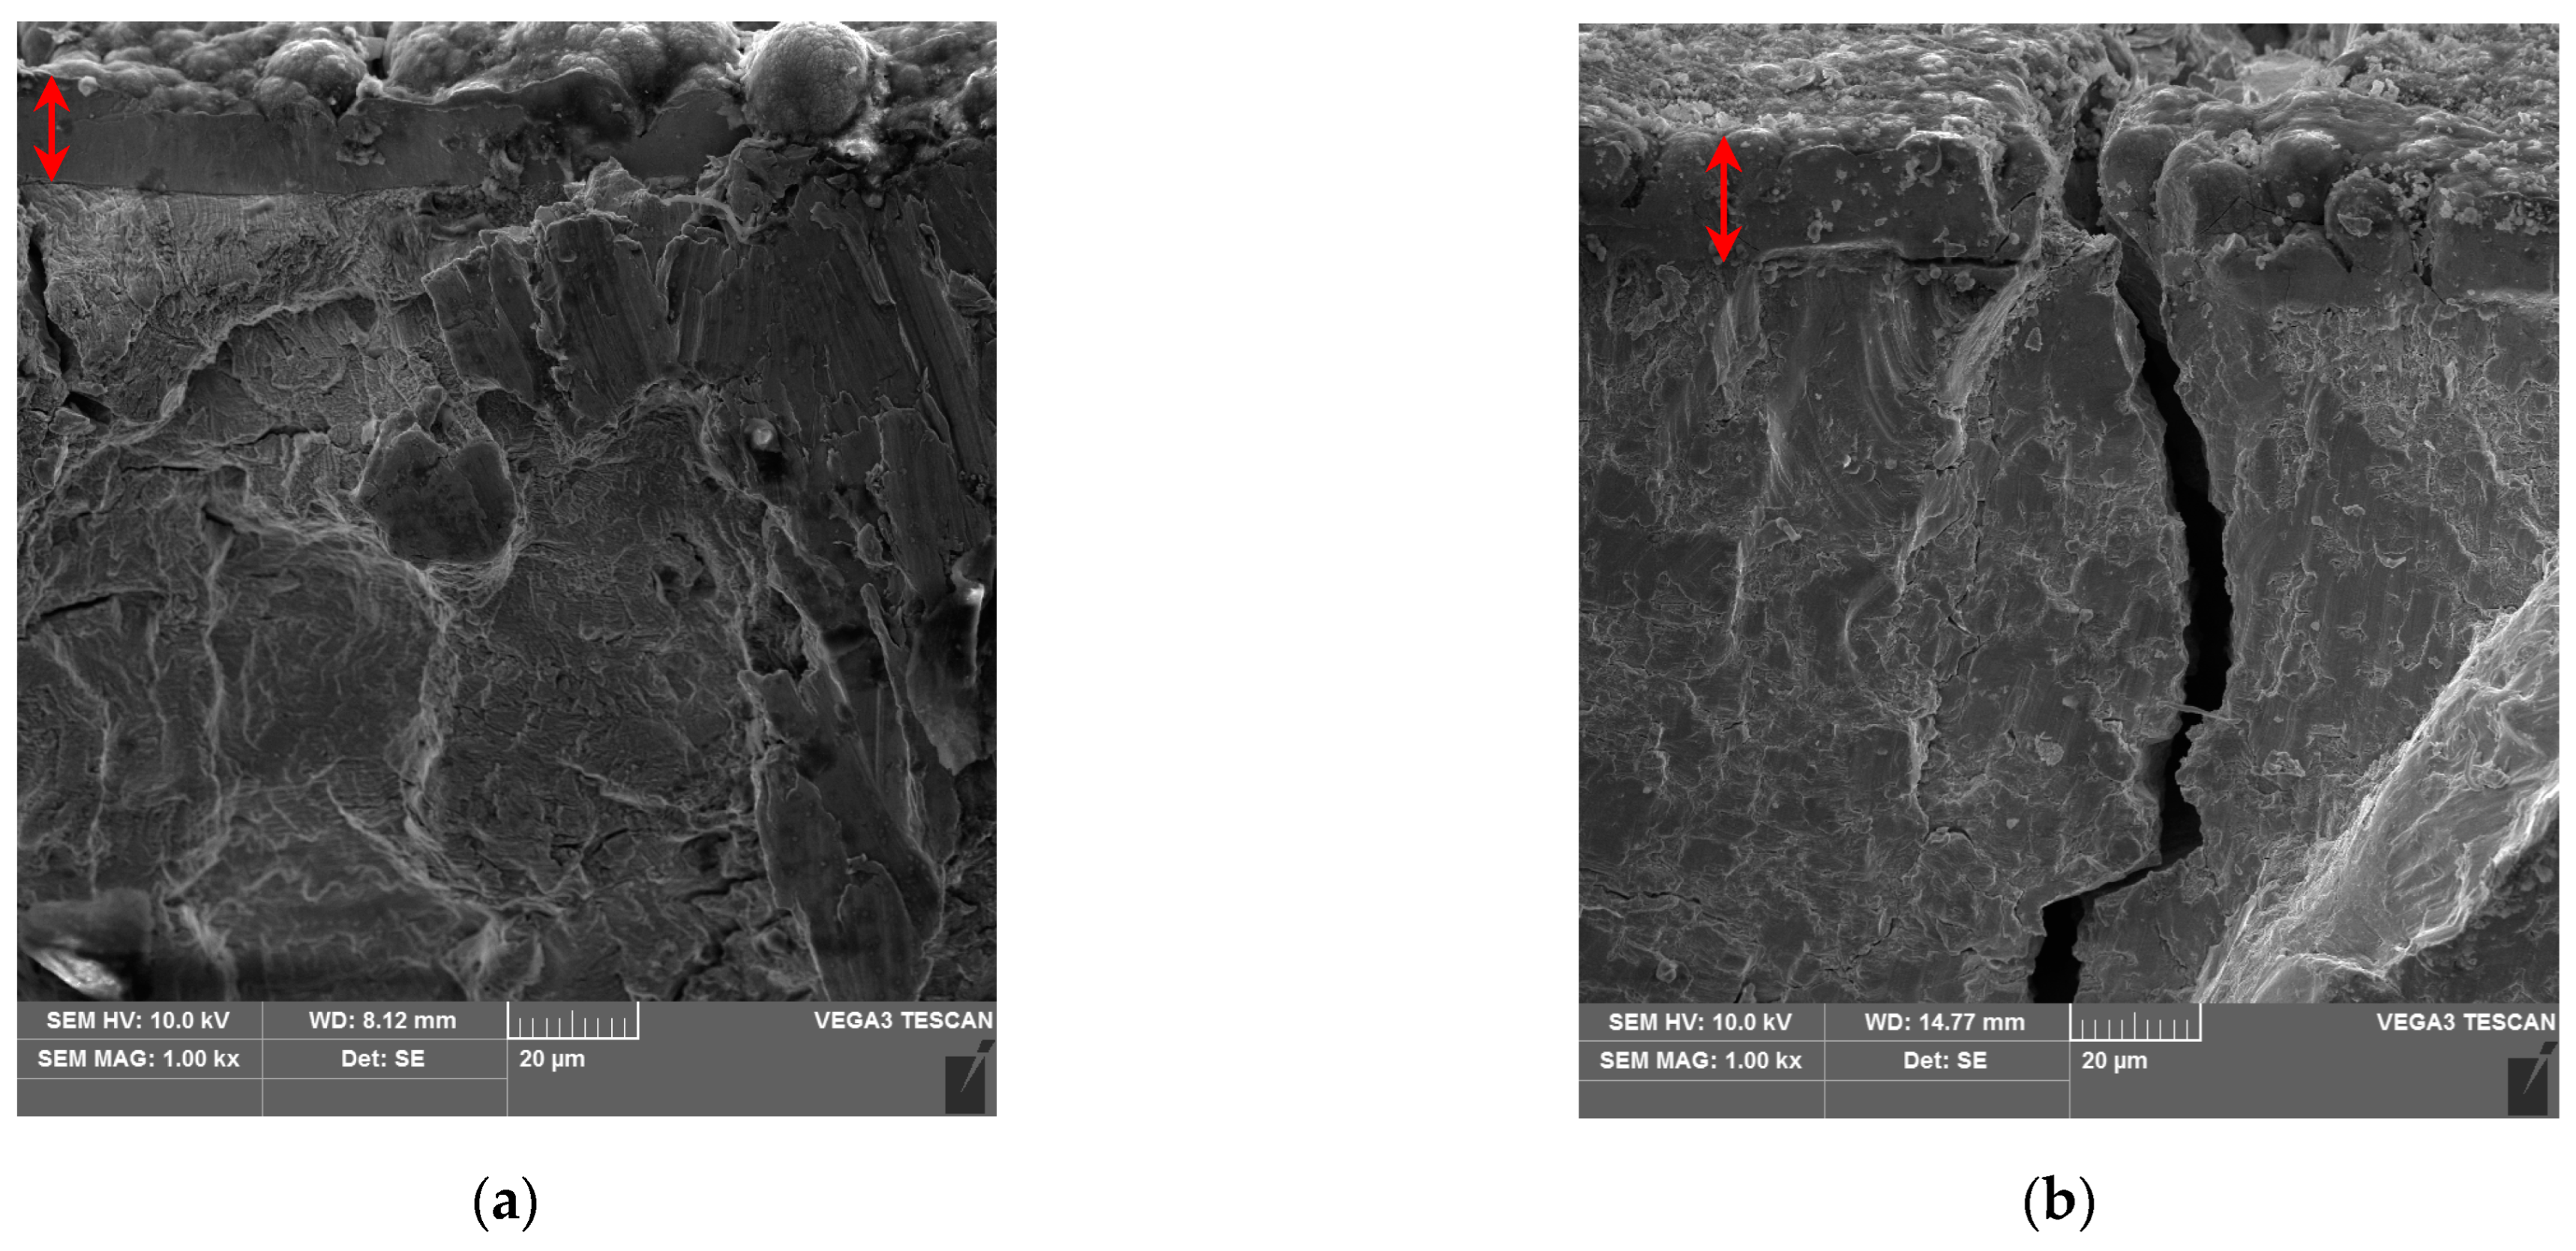
The results of the tensile tests were used to design the production process of the specimen (the description of the specimens is in Section 3). These samples were subsequently used to perform high-cycle tests. Since the purpose of the tests was to imitate real components used in the automotive industry, half of the samples were protected with a galvanic Zn-Ni coating. The coating includes from 12% to 15% of nickel. The purpose of the coating is corrosion protection. The coating thickness is usually from 15 µm to 20 µm. Figure 3a shows the thickness of this layer for specimen A (the specimens are defined in the following section), Figure 3b shows the thickness of the coating of specimen C. The coating thickness was measured close to a spot where a fatigue crack was initiated after specimen breakage, since the thickness at this spot has the greatest importance.
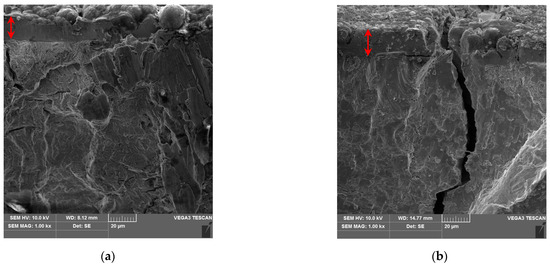
Figure 3.
Thickness of coating on DC04 specimen (a) and S420MC specimen (b).
Drum technology [28] is used for coating application. Galvanic coating of metals using a Zn-Ni layer through drum technology is a common electroplating process. In this method, metal parts are immersed in a rotating drum containing a solution with Zn-Ni electrolytes. The drum technology ensures efficient and uniform coating, contributing to the overall quality and performance of the treated metal components. The temperature during this process does not exceed 90 °C, so it is not expected that there would be significant changes in the properties of the samples due to the temperature.
The coating influences the surface roughness and hardness. Specimens without coating usually have a surface roughness of about Rz = 8 µm, specimens with coating usually have a surface roughness of about Rz = 13 µm. Dependence of Vickers microhardness on depth is shown in Table 3. It can be seen that the coated samples have high hardness near the surface.
Table 3.
Vickers microhardness over depth.
2.2. Inverse Stamping Modification
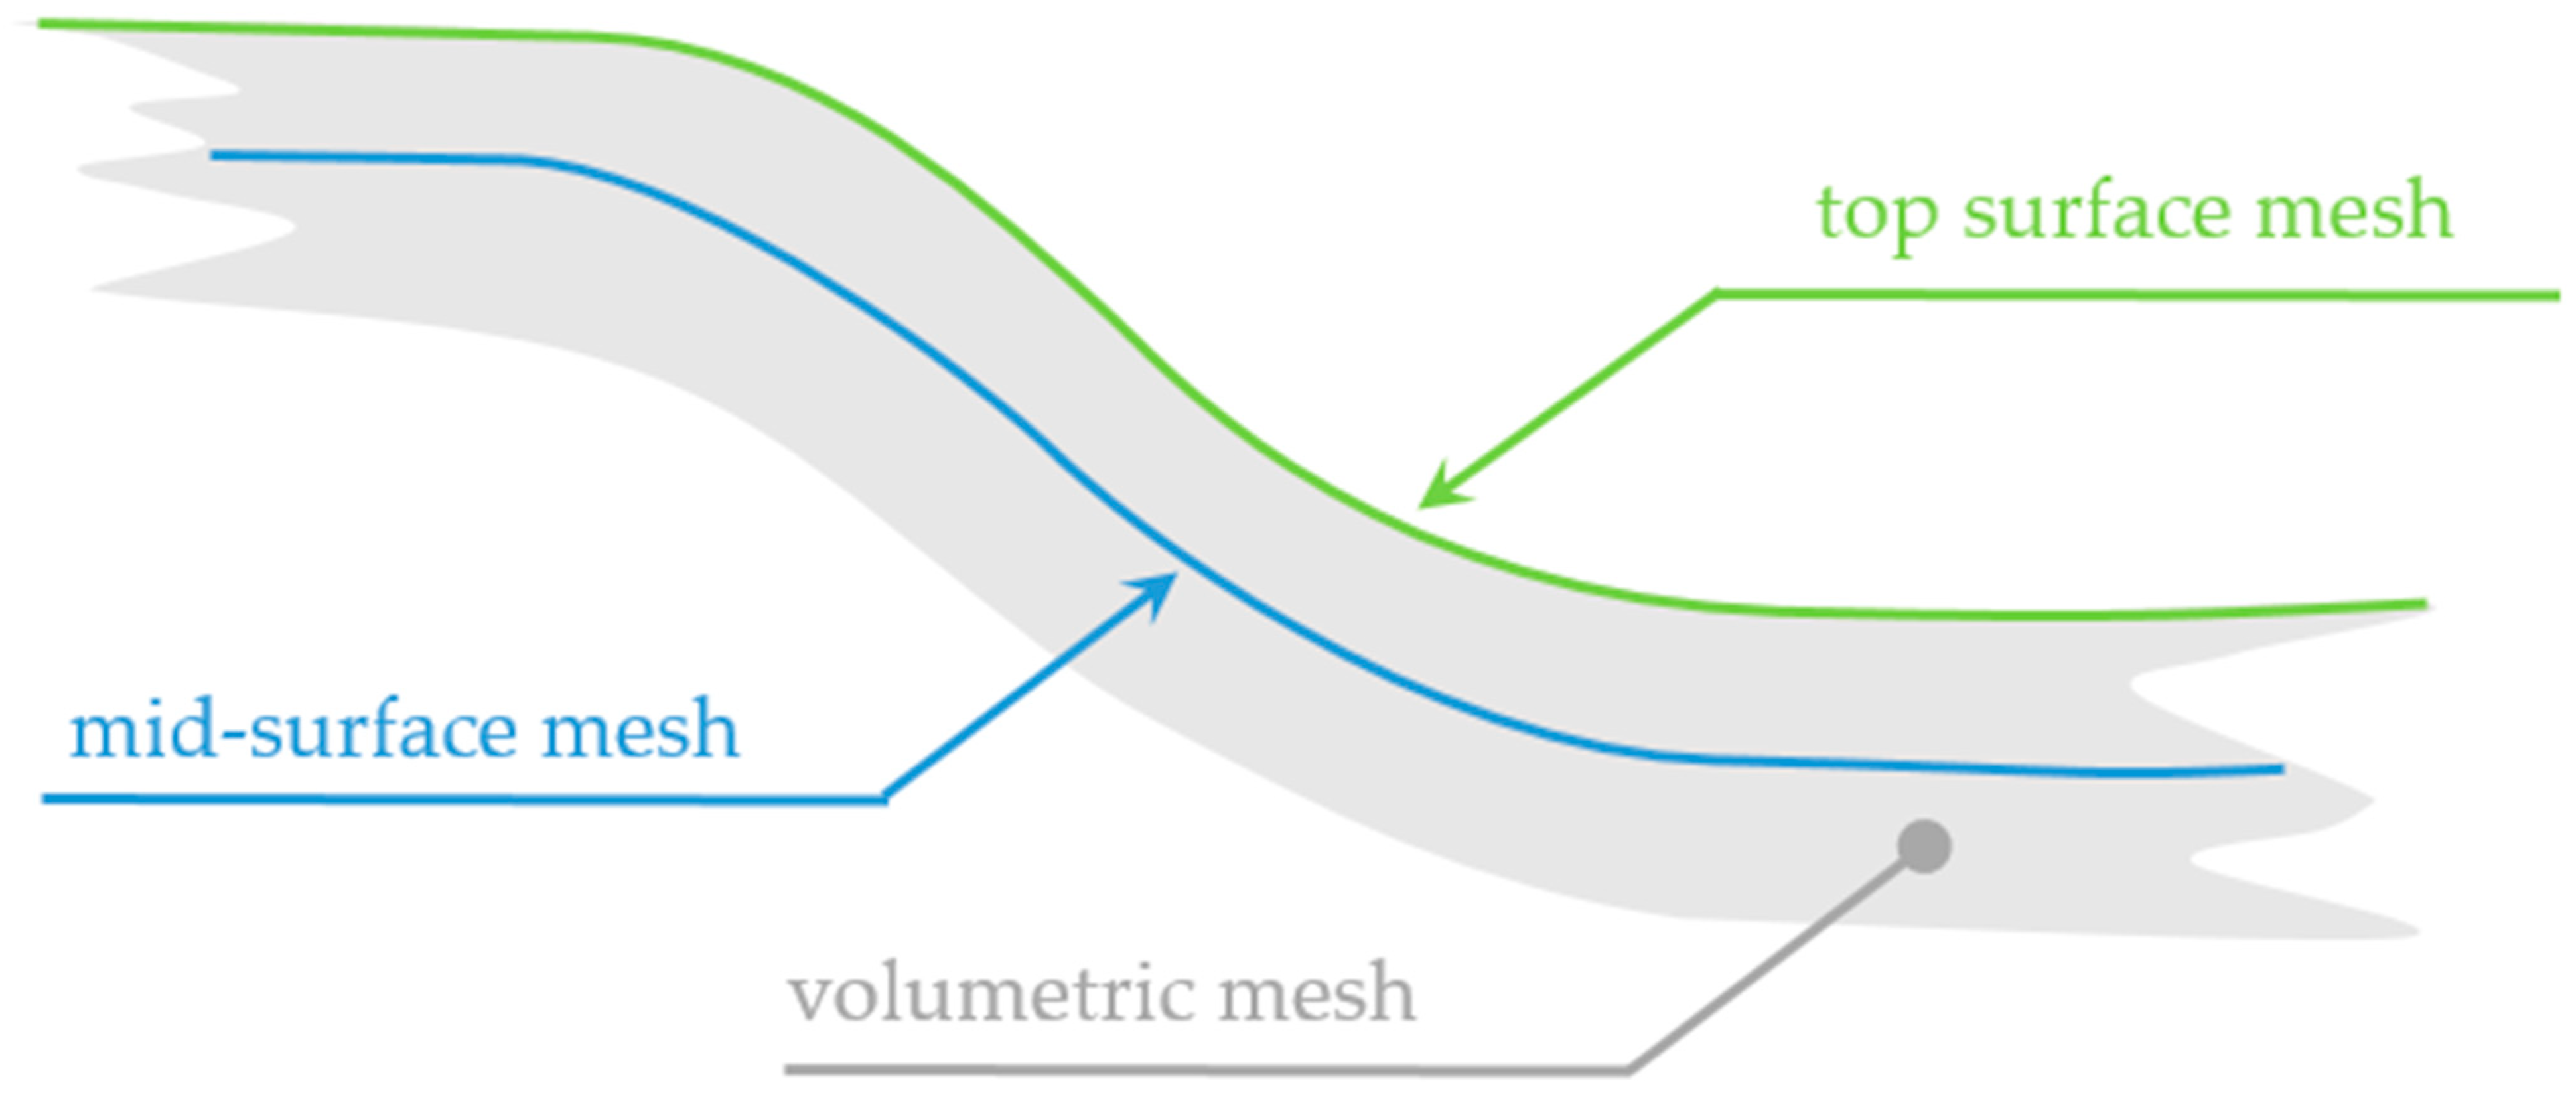
The inverse stamping implementation used here is based on [17,18,19,20,21,22,23,24,25,26,27,28,29,30] and it was integrated into finite element method (FEM) software ANSYS Mechanical 2022 R1. Inverse stamping which is formulated for shell meshes was adapted for a volumetric mesh. The adaptation is based upon an idea published in [31] that a volumetric mesh of a metal sheet includes two shell meshes, the first one on the top surface and the second one on the bottom surface. The algorithm is used twice; in the first run it uses the top surface mesh as an input and in the second run it uses the bottom surface mesh as an input. The results are then located only on the surface of the volumetric mesh. Further, the results are used in high cyclic fatigue analysis. Fatigue cracks are initiated on the surface layer too [32] (pp. 16–17). The absence of results in volume is therefore not a problem. Moreover, a strong influence of the surface coating on the fatigue results was observed during testing (see Section 4). The assumption of crack initiation at the surface therefore seems to be valid.
Figure 4 shows a cross-section through a volumetric mesh. The volumetric mesh includes tetrahedral elements which means that the top surface mesh consists of triangular elements, see Figure 5.
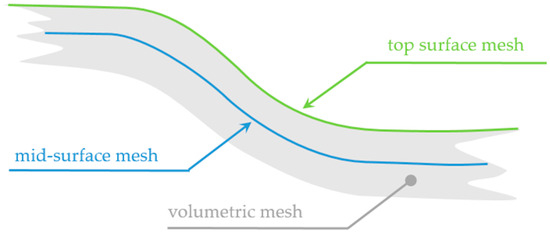
Figure 4.
Cross-section through a volumetric mesh.
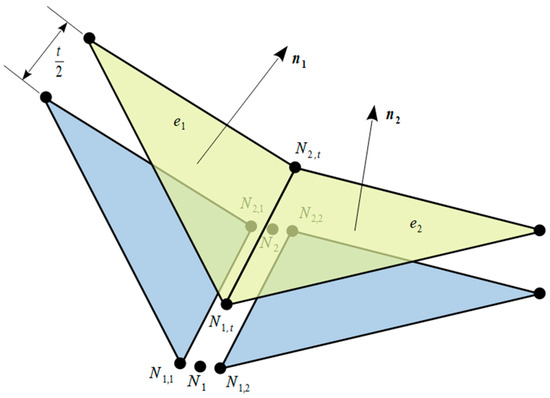
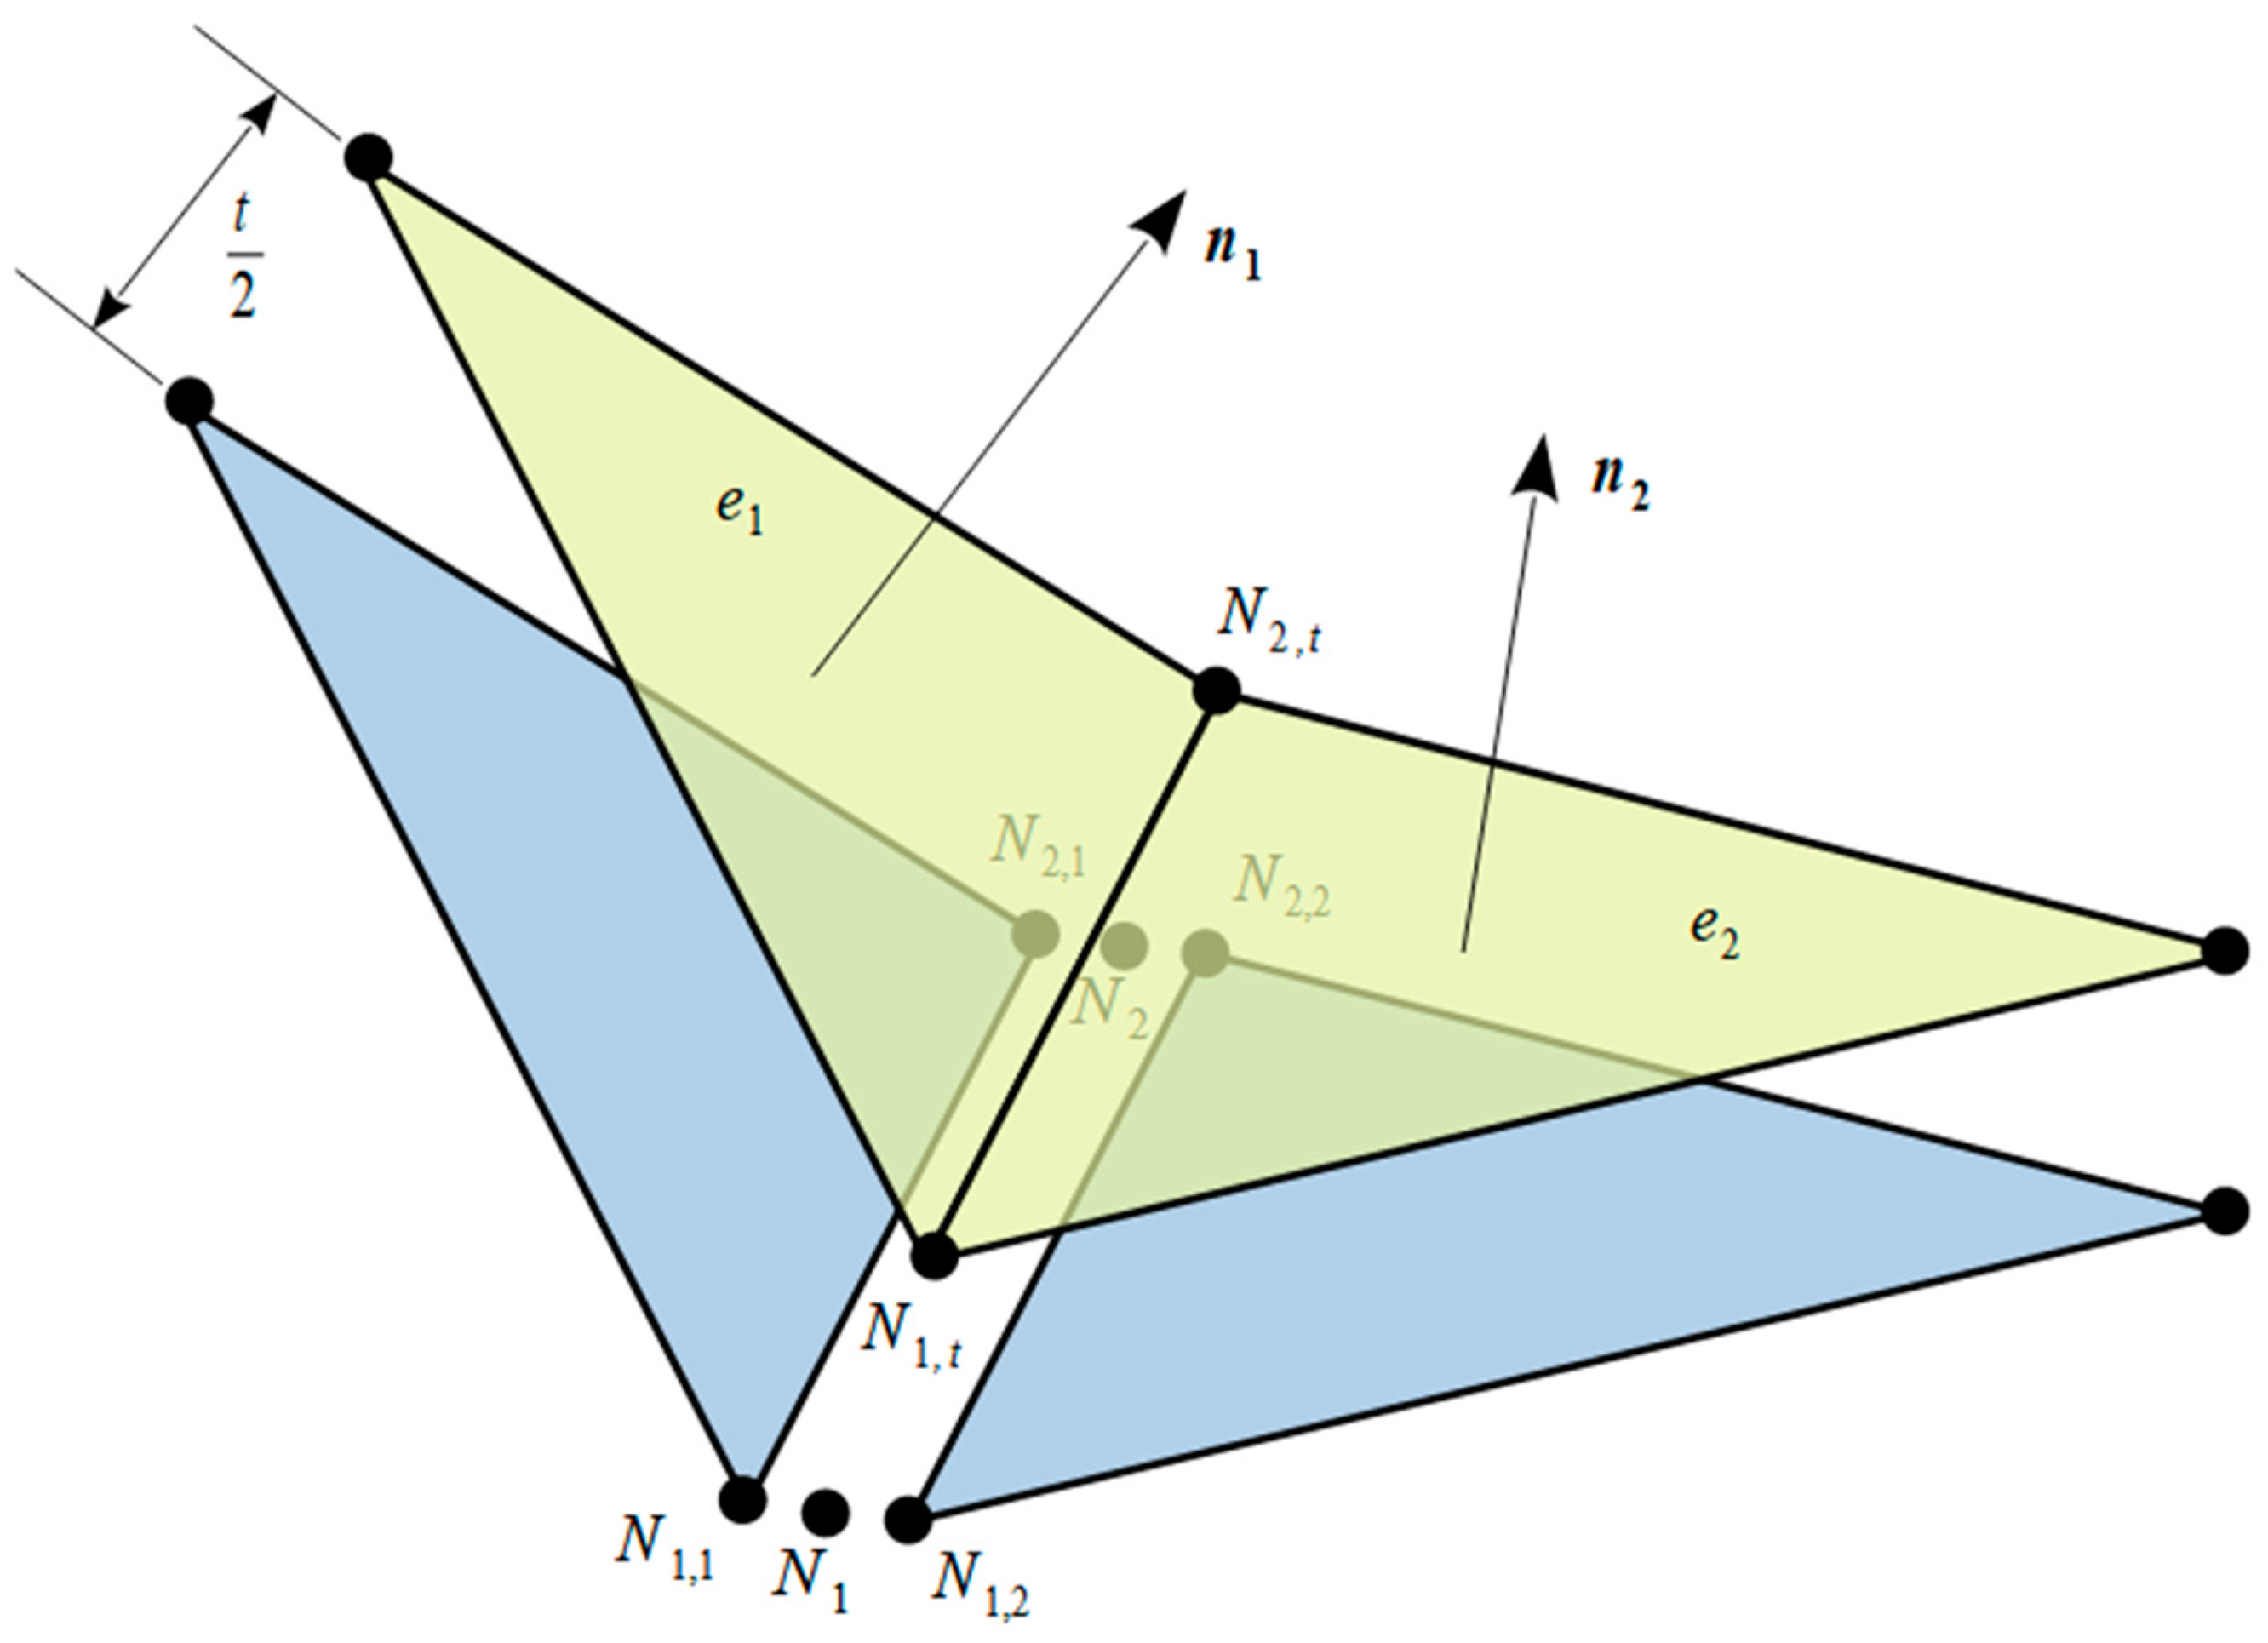
Figure 5.
Surface mesh offset. Taken from [31].
Each top surface mesh element moves against an external normal direction in order to obtain the mid-surface mesh. The offset size is half of the wall thickness. The offset of the element would lead to a discontinuous mesh. Therefore, the averaging of the nodal position of the mid-surface mesh is used. Then, inverse stamping with the mid-surface mesh is performed. The results are then saved into the top surface mesh nodes of the volumetric mesh. Calculation with the bottom surface mesh is performed in the same way.
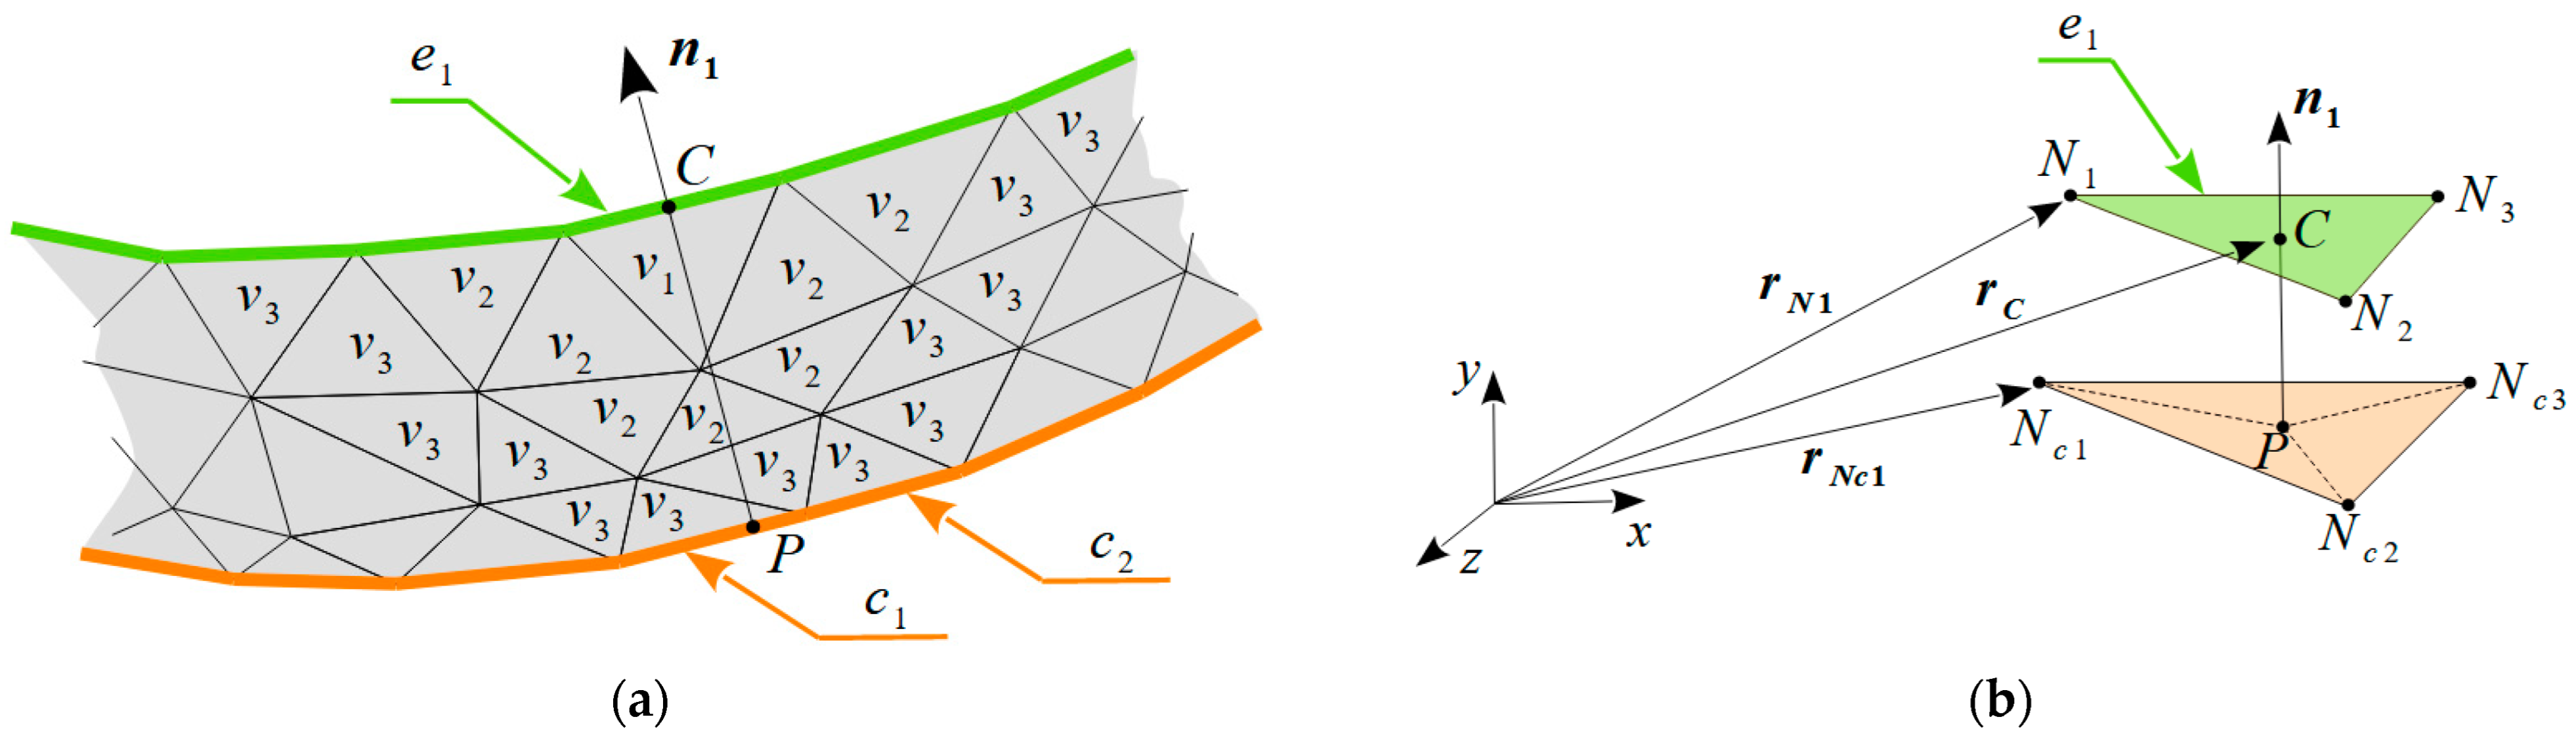
The wall thickness is automatically recognized as the difference between the top surface mesh and bottom surface mesh. Figure 6a shows a cross-section through the volumetric mesh. The top surface mesh element e1 with nodes Ni (i = 1, 2, 3) has external normal n1. The candidate for the opposite element on the bottom surface mesh is found and the intersection point P is calculated. The radius vector rP of point P is given by Equation (1)
where t1 is the solution of Equation (2).
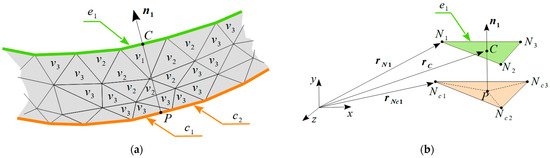
Figure 6.
(a) Cross-section through volumetric mesh (b) Local thickness calculation.
Symbol rNci (i = 1, 2, 3) denotes the radius vector of nodes Nci related to the opposite candidate element, rC is the radius vector of point C and ti are unknown parameters.
Point P has to be located inside the opposite candidate element with nodes Nci (i = 1, 2, 3). This condition is met if the area of triangle Nc1, Nc2, Nc3 is equal to the sum of the areas of the sub-triangles Nc1, Nc2, P and Nc2, Nc3, P and Nc3, Nc1, P. If the condition is not met then another opposite candidate element from the group of the bottom mesh is taken and the procedure is repeated until the condition is satisfied. It is not a good idea to take opposite candidate elements one by one from the bottom mesh group because the calculation time would be too long. A reduced group of candidate elements can be found first. It is possible to use the volumetric mesh for this. Surface element e1 is connected with volumetric element v1, Figure 6a. Then, volumetric elements adjacent to v1 are found—elements v2 in Figure 6a. This procedure is repeated until volumetric elements connected with the bottom surface elements are found. These bottom surface elements (designated as c1 and c2 in Figure 6a) create a group of opposite candidate elements.
The thickness of element e1 is equal to the distance between points C and P, Figure 6b. The algorithm adapted for the volumetric mesh can be easily used for analysis of parts which are made of metal sheets of variable thicknesses. This is also a great advantage of a volumetric mesh over a shell mesh.
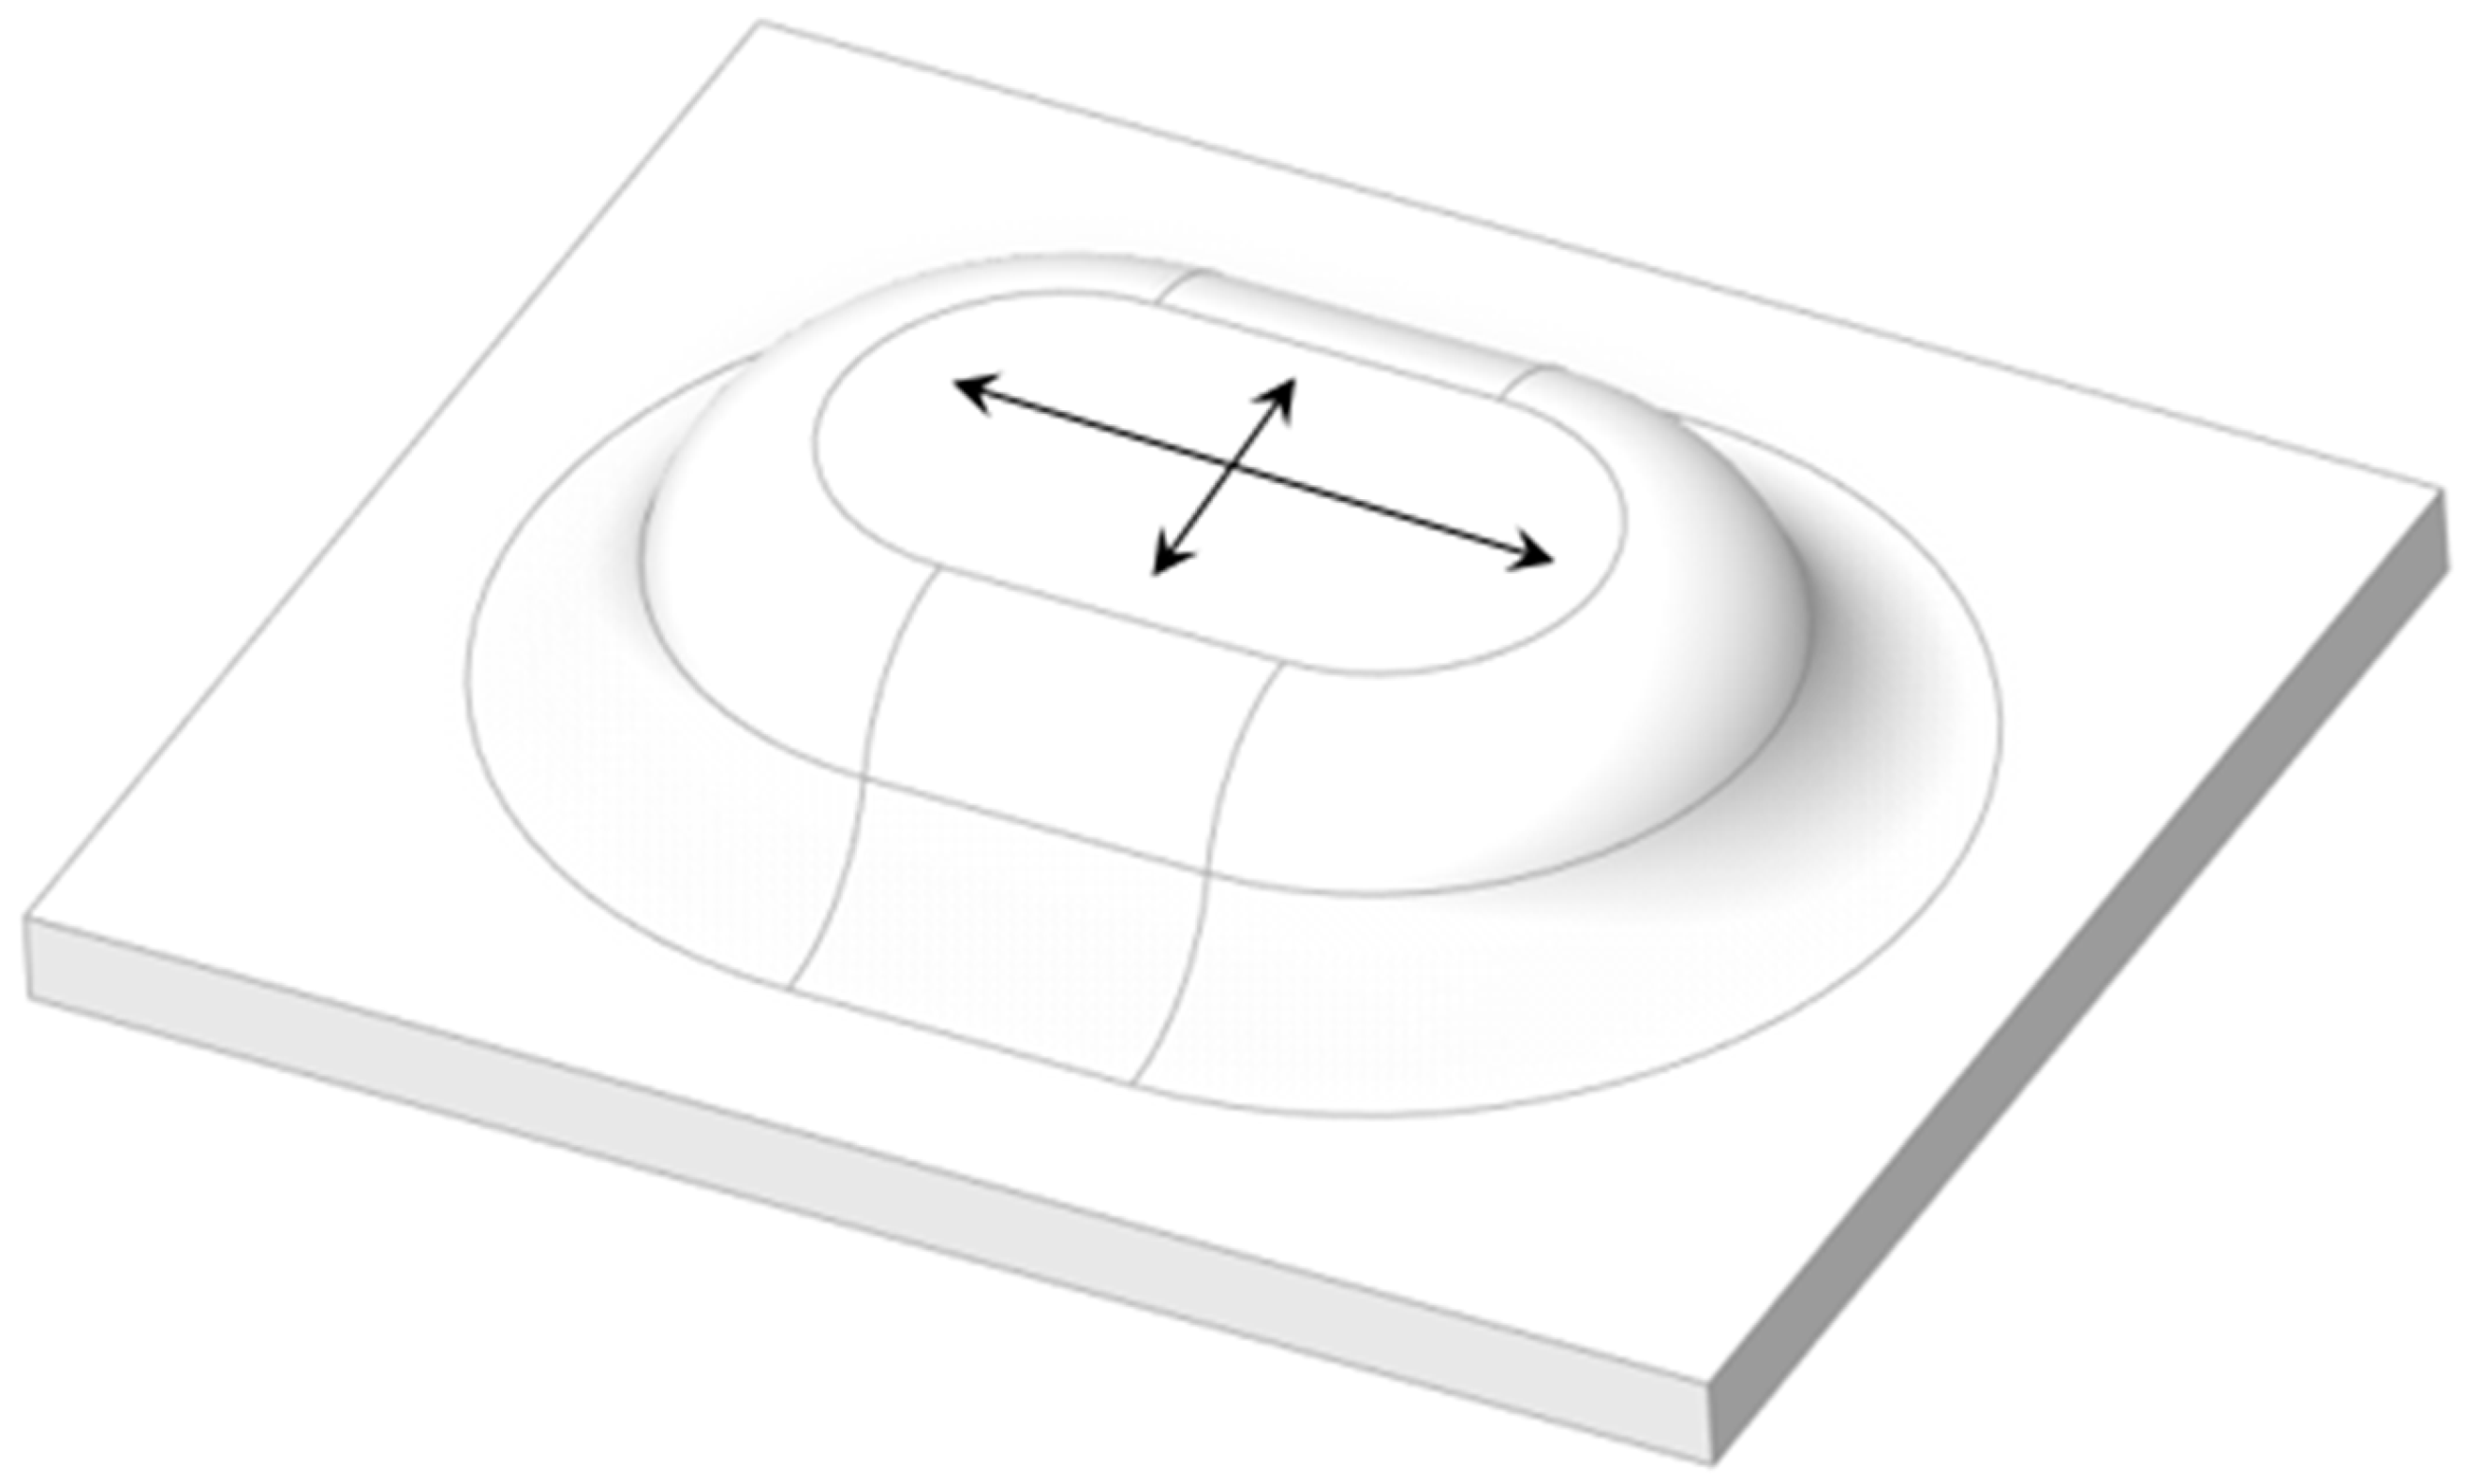
It was mentioned in Section 1 that there are methods based on a part’s local curvature. This approach has some limitations. For example, the protrusion in Figure 7 has theoretically zero curvature on its top, but there is non-zero plastic strain as indicated by the arrows. Inverse stamping is able to calculate plastic strain even in these spots.

Figure 7.
Protrusion showing non-zero plastic strain (arrows).
In inverse stamping, only normal anisotropy a is usually considered. This can be determined from Lankford coefficients based on Equation (3), [33]. Lankford ratios r0, r45, r90 are in Table 2.
In inverse stamping method, stress-strain curve is approximated by power law Equation (3). Coefficient κ and exponent n derived from stress-strain curves shown in Figure 2 are described in Table 4. For comparison, power law approximation of DC04 stress-strain curve can be found in [34].
Table 4.
Material properties used in inverse stamping.
3. Results
Results from the fatigue tests were used for the validation of the calculation procedure. Results of all the fatigue tests are summarized in Appendix A. Four specimen types were used:
- Specimen A: specimen made from material DC04, 2 mm thick, designed for three-point bending test
- Specimen B: specimen made from material S420MC, 4 mm thick, designed for three-point bending test. Fatigue results taken from [35].
- Specimen C: specimen made from material DC04, 2 mm thick, designed for tension-compression test
- Specimen D: specimen made from material S420MC, 4 mm thick, designed for tension-compression test. Fatigue results taken from [35].
Material properties in terms of high cycle fatigue of DC04 can be found in [10]. Klemenc published fatigue data for S420MC in his paper [36].
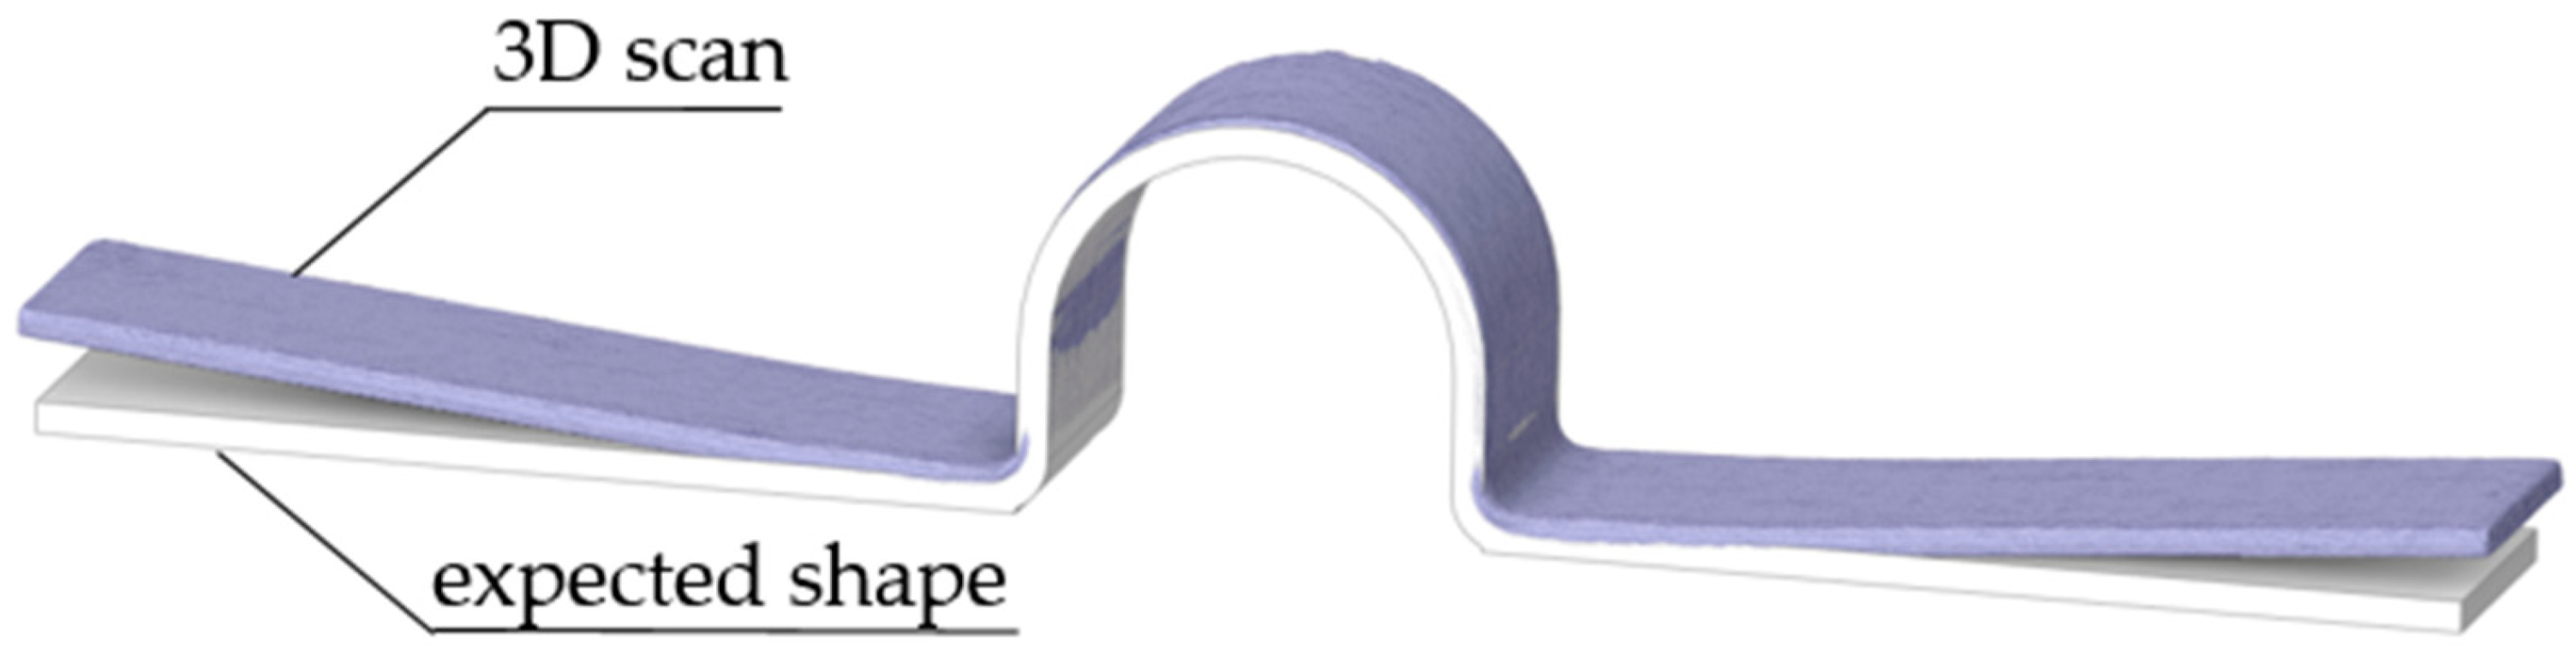
Only one forming operation was done to produce specimens A and B. Two forming operations (pre-bending and final bending) were done during the production of specimens C and D. Enormous spring-back was observed especially in the cases of specimens C and D which led to a big difference between the expected and real part shape, see Figure 5.
Therefore, specimens were scanned (see Figure 8) using a 3D scanner and the resulting geometrical model was used as an input for inverse stamping and also for operational stress analysis.
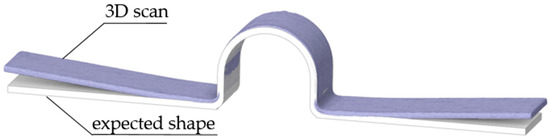
Figure 8.
Expected shape and 3D scan.
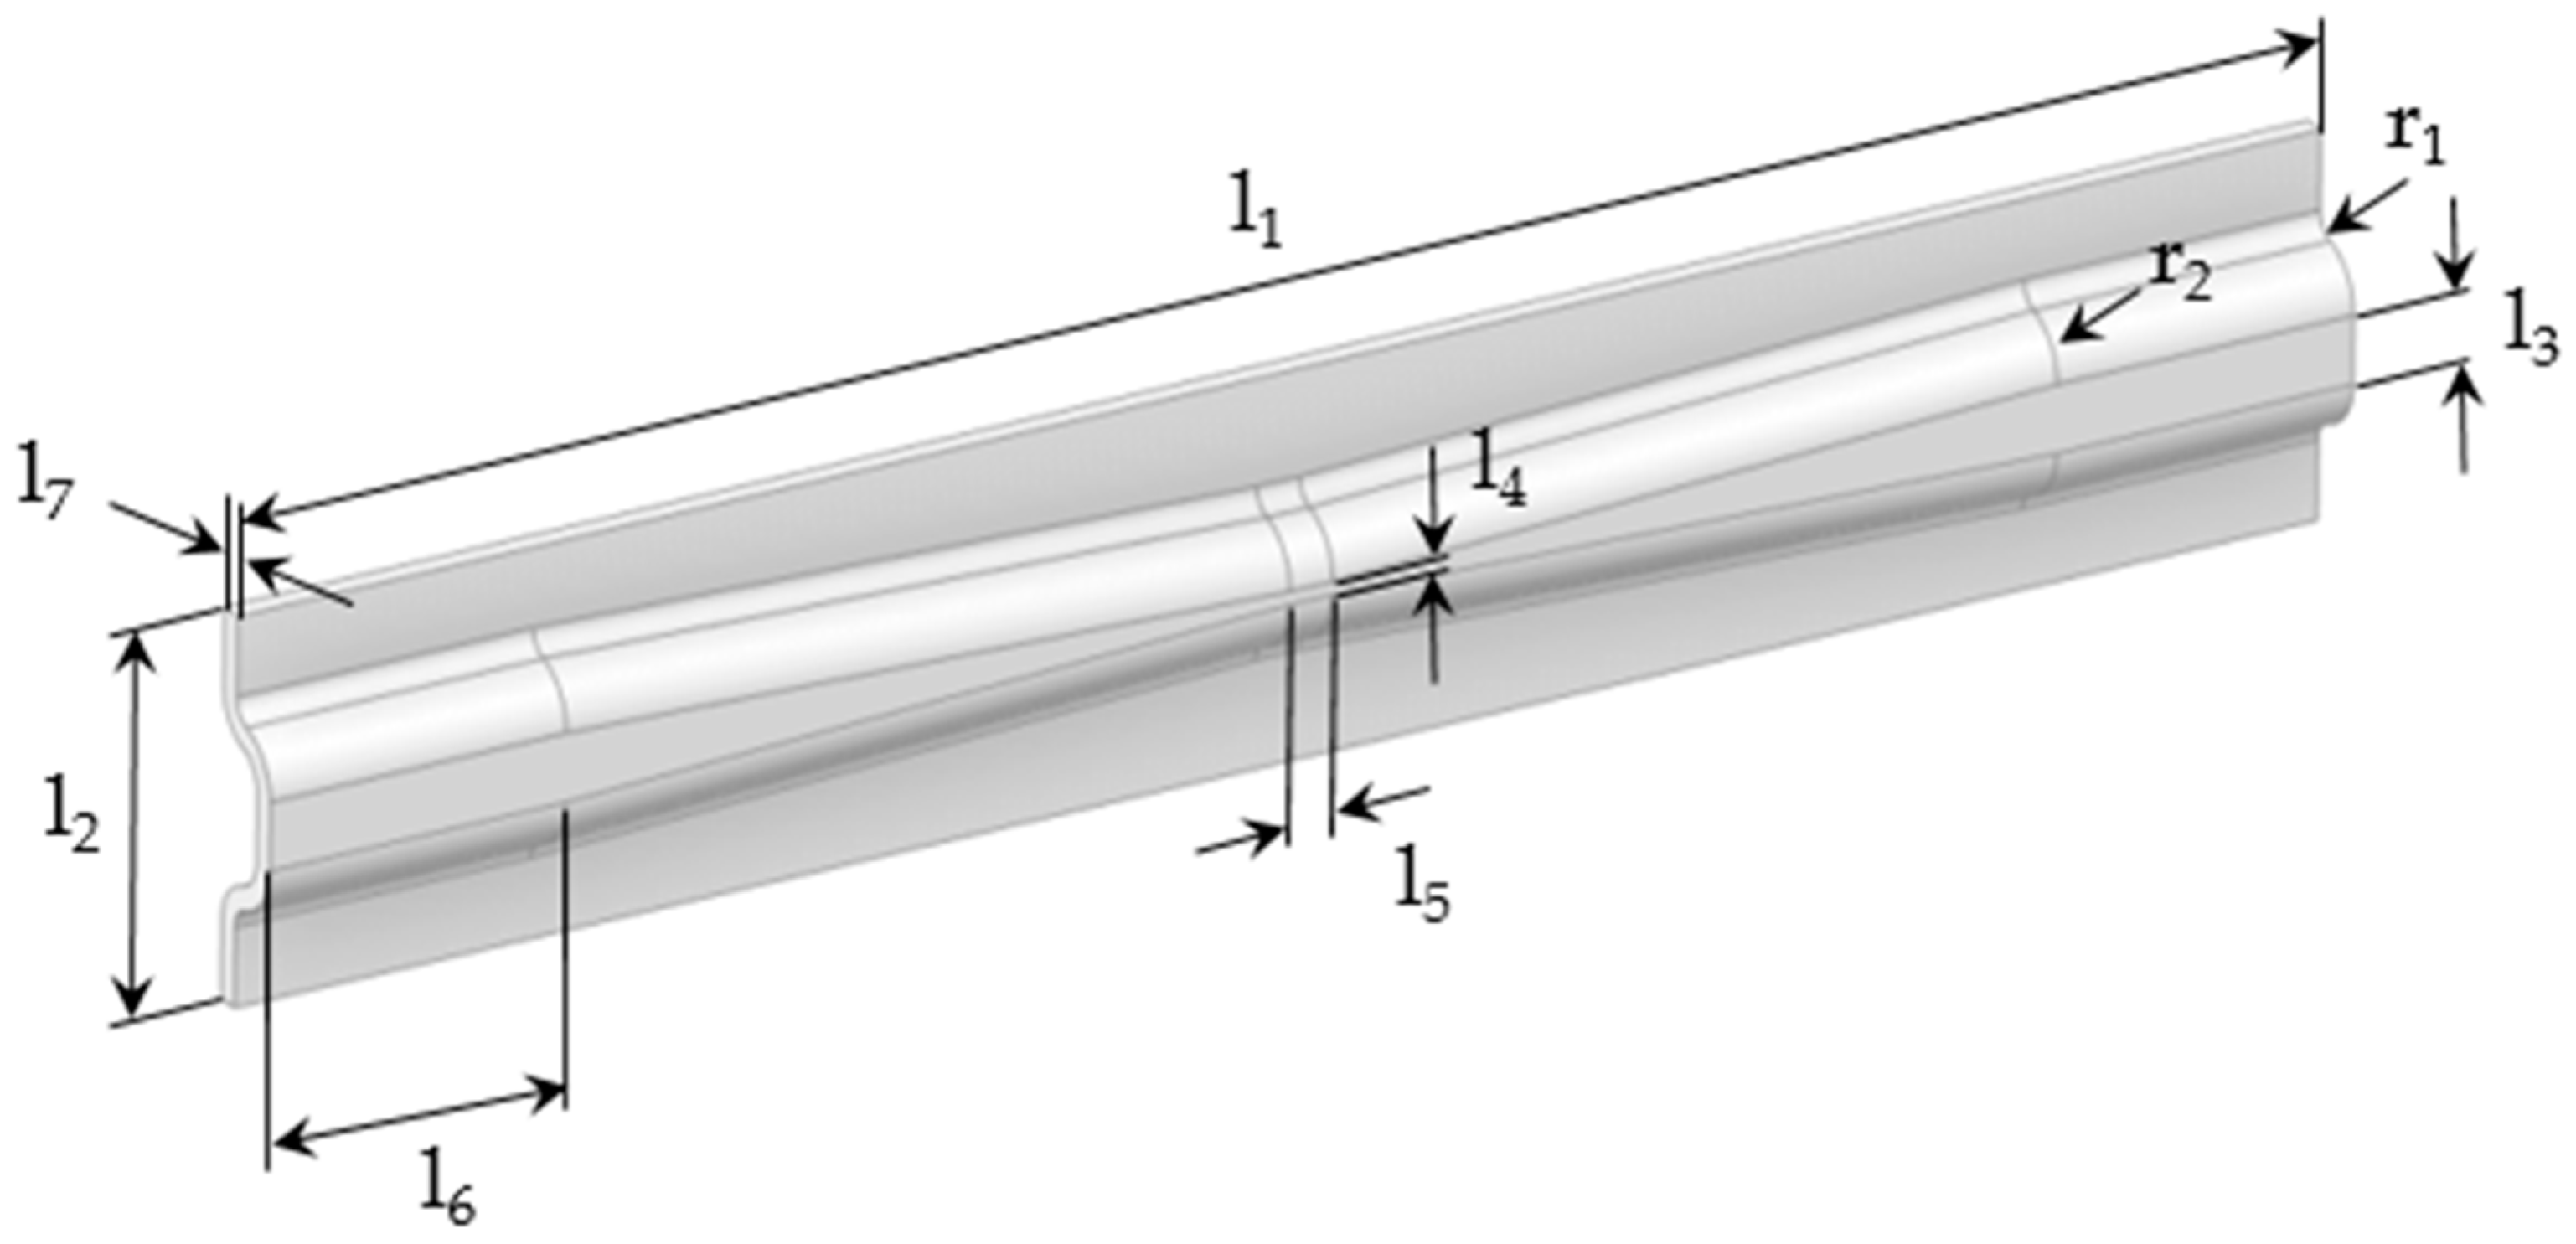
Specimen dimensions are shown in Figure 9 and Figure 10. Their values are given in Table 5 and Table 6. These values are typical values which could differ due to spring-back.
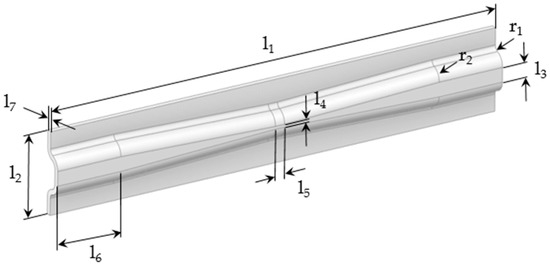
Figure 9.
Dimensions of specimens A and B.
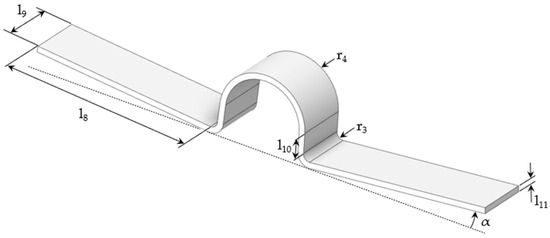
Figure 10.
Dimensions of specimens C and D.
Table 5.
Dimensions of specimens A and B.
Table 6.
Dimensions of specimens C and D.
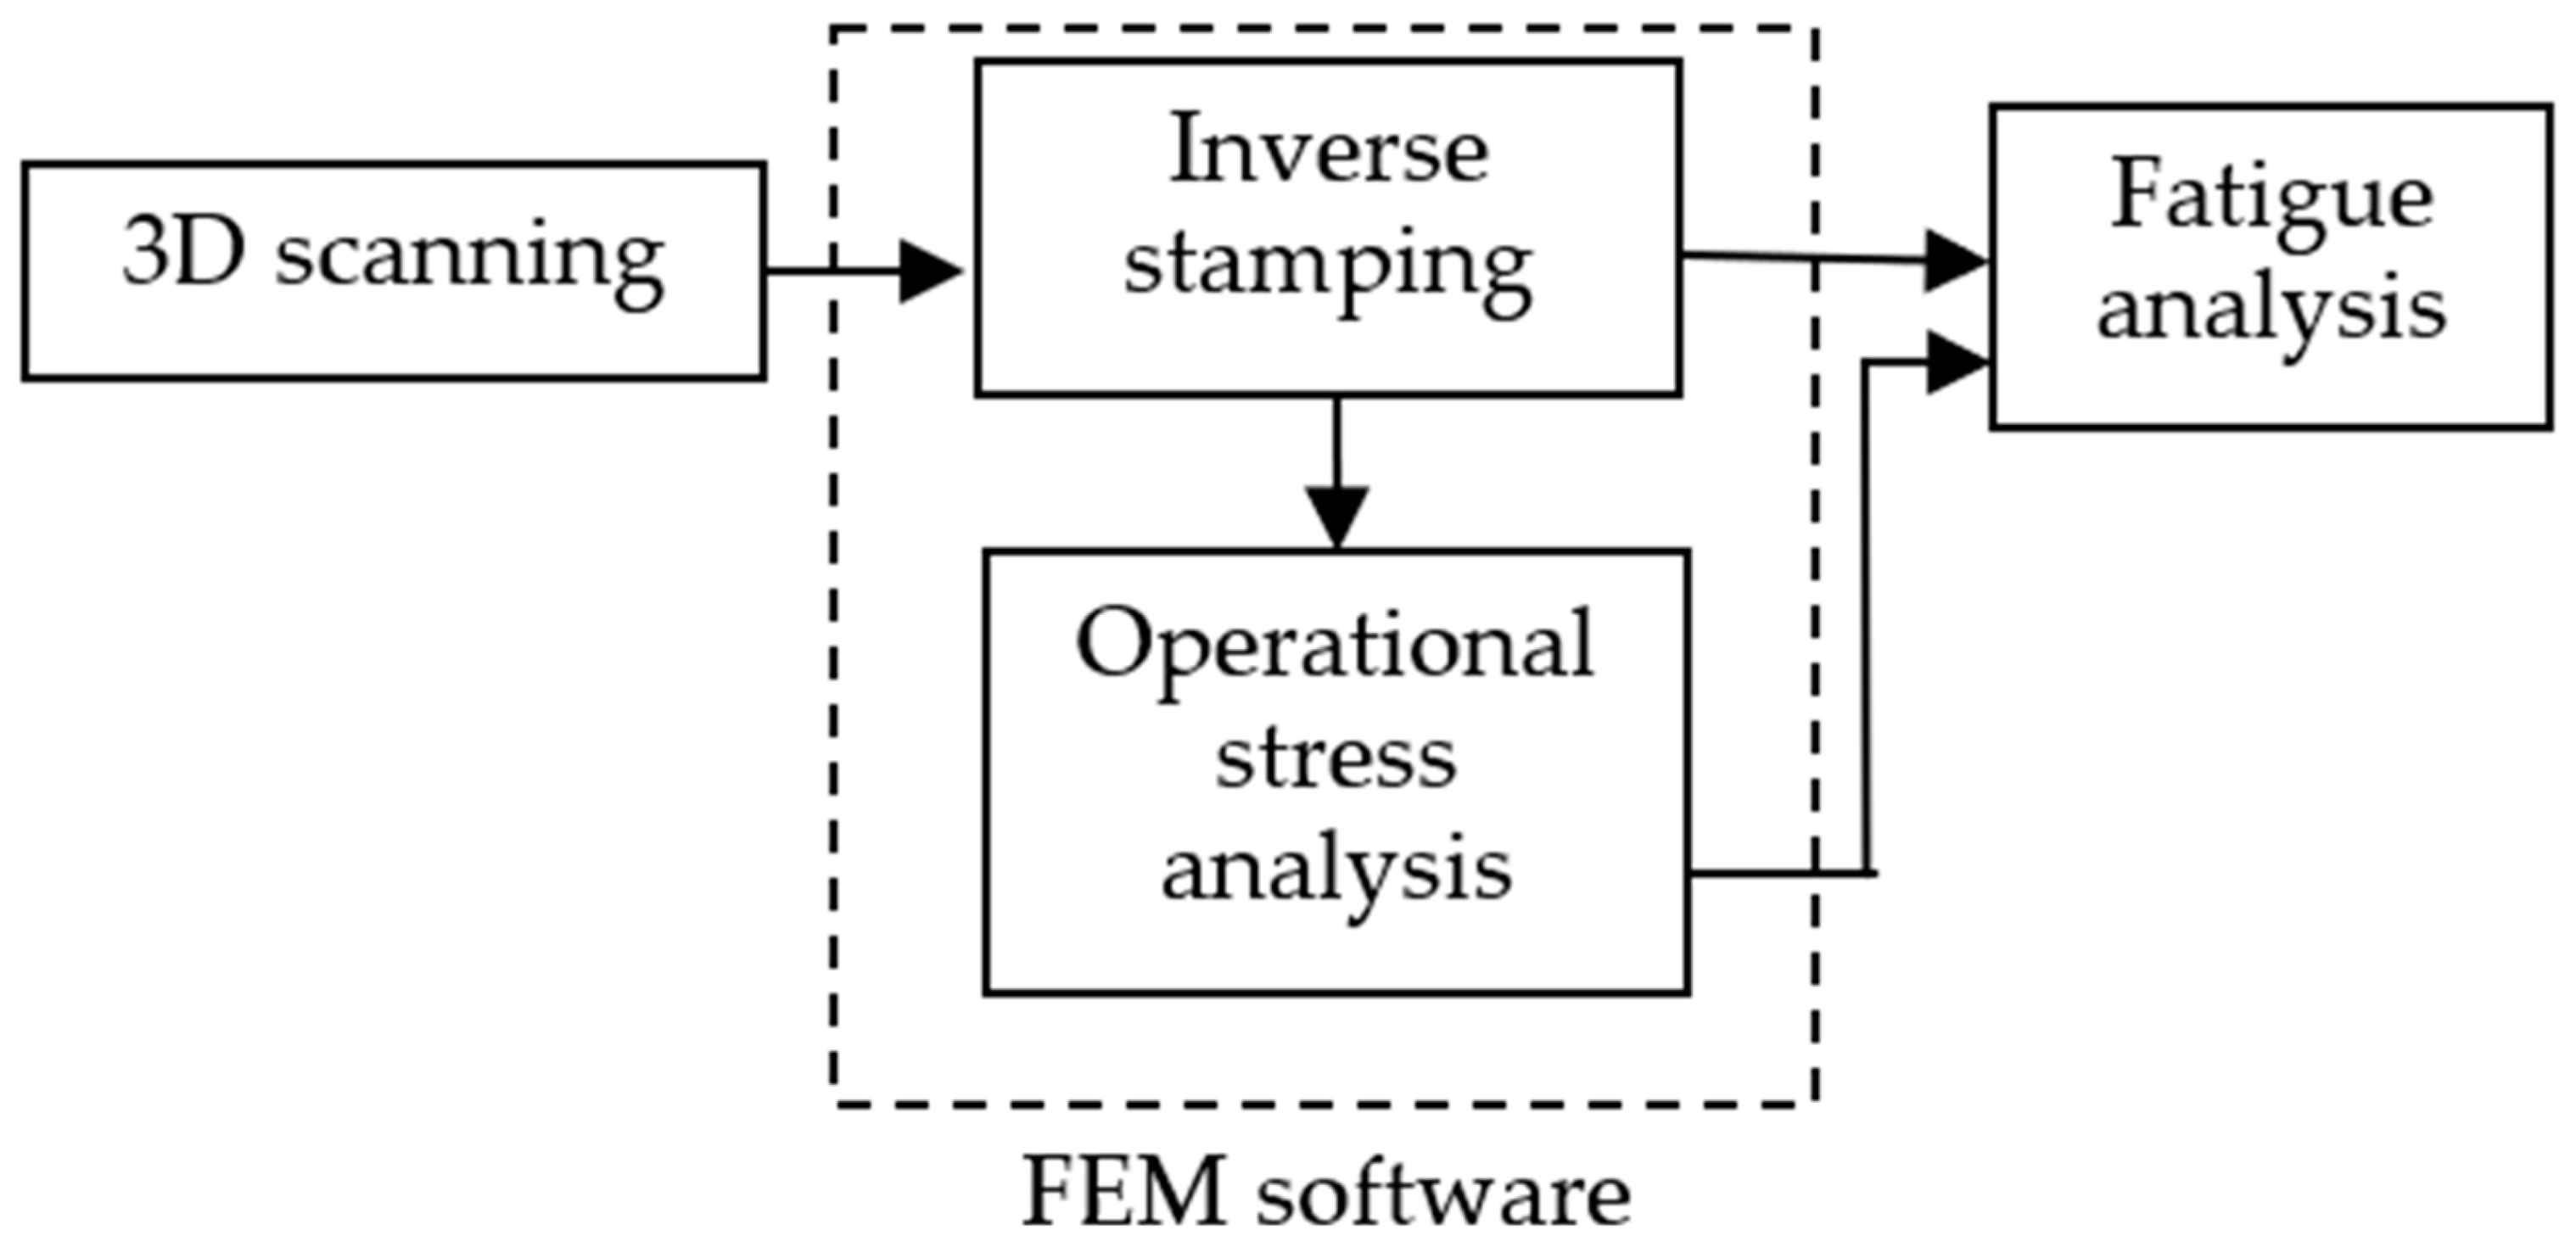
FEM models were compiled and used for operational stress analysis and inverse stamping analysis. The advantage of this approach is that no results mapping is needed because one mesh is used for both calculations. Operational stresses and inverse analysis results were then used to estimate fatigue. The workflow is shown in Figure 11.
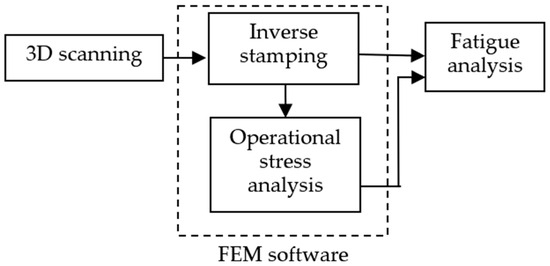
Figure 11.
Workflow diagram.
The FEM model does not account for the effect of the coating, this is done later when these effects are included in the fatigue analysis. The effect of the coating is introduced into the fatigue evaluation using the surface roughness factor and further using the General Surface Treatment Factor (GSTF), which reflects the change in surface hardness caused by the coating.
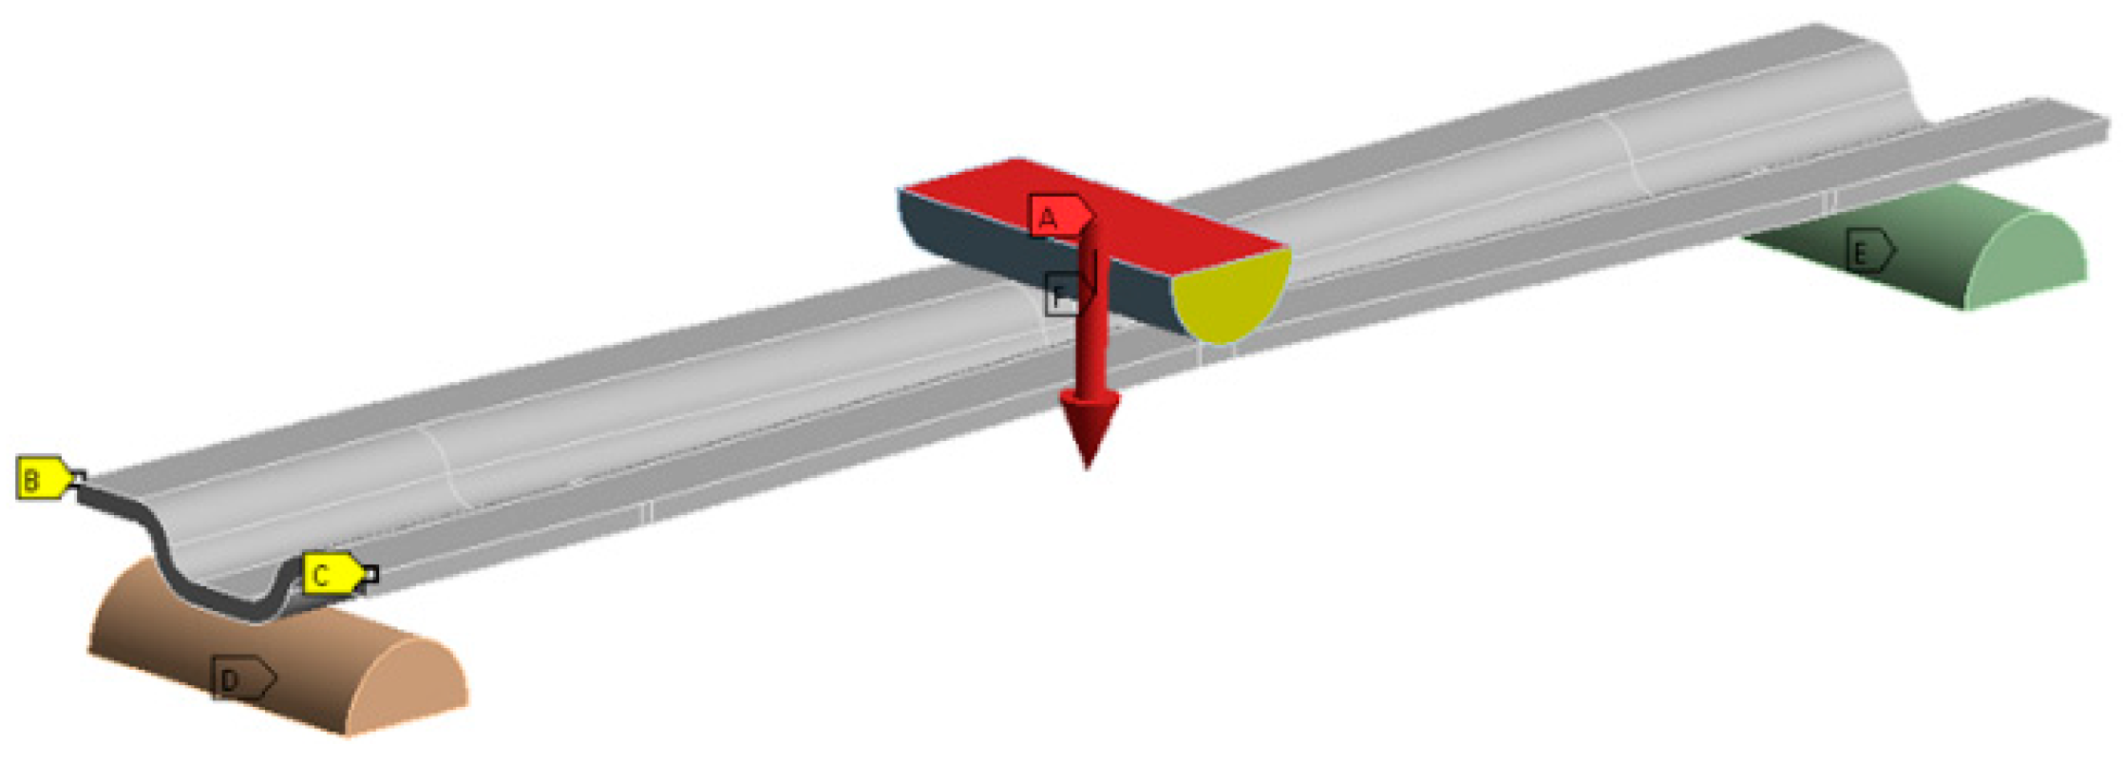
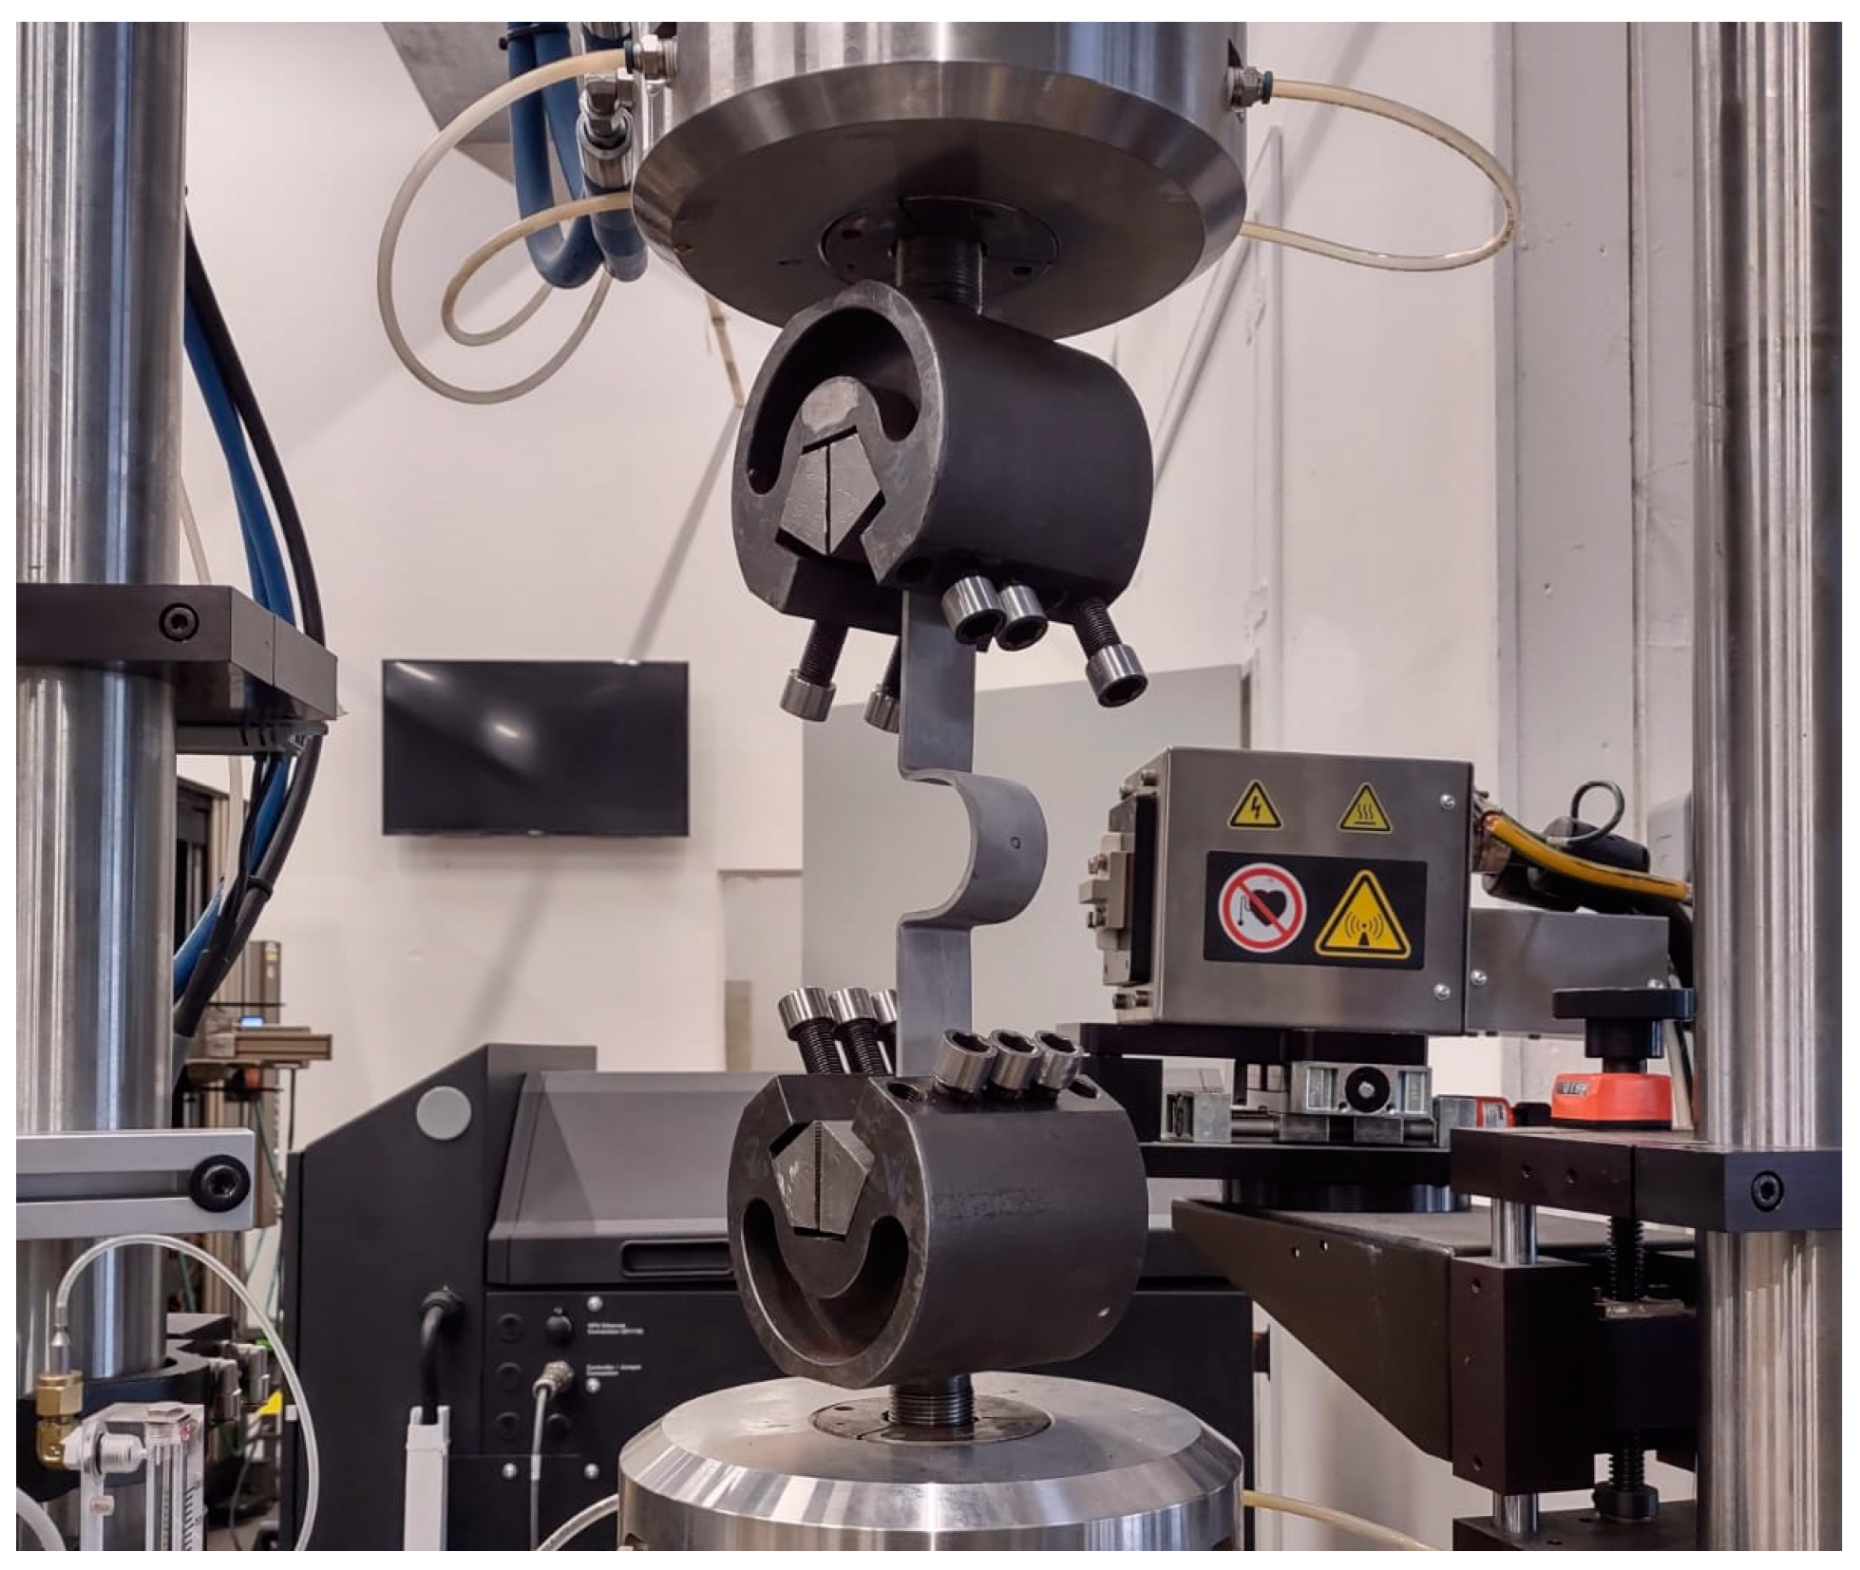
Figure 12 shows the set-up used for operational stress analysis of the A and B sample types. It is a three-point bending test, where the sample is supported at two points and a piston loads the body in the middle. The piston force is represented by the red arrow. The distance between the supports was 150 mm for the A specimens and 350 mm for the B specimens. Figure 13 shows sample D in a testing machine. The jaws of the testing machine moved up and down with a symmetrical loading force.
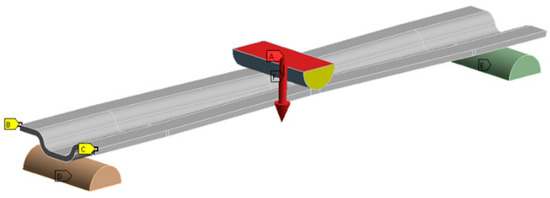
Figure 12.
Three point bending test assembly.
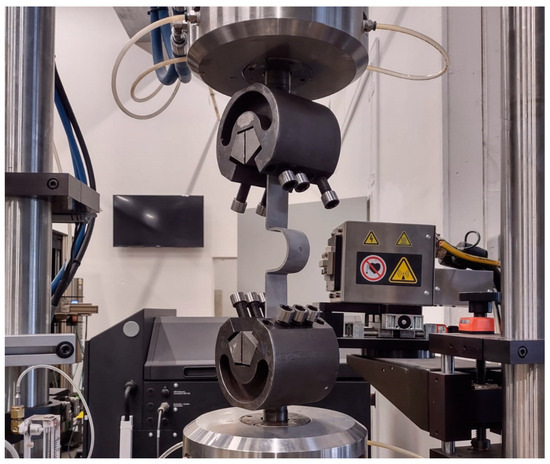
Figure 13.
Specimen D in testing machine. Taken from [31].
Three loading levels were calculated and tested for each specimen type, see Table 7. The number of test pieces that did not have a surface coating varied from three to five at each loading level. The number of tested pieces with Zn-Ni coating varied from four to six. See Appendix A, where the exact numbers of tested pieces are listed.
Table 7.
Loading levels and loading forces.
4. Discussion
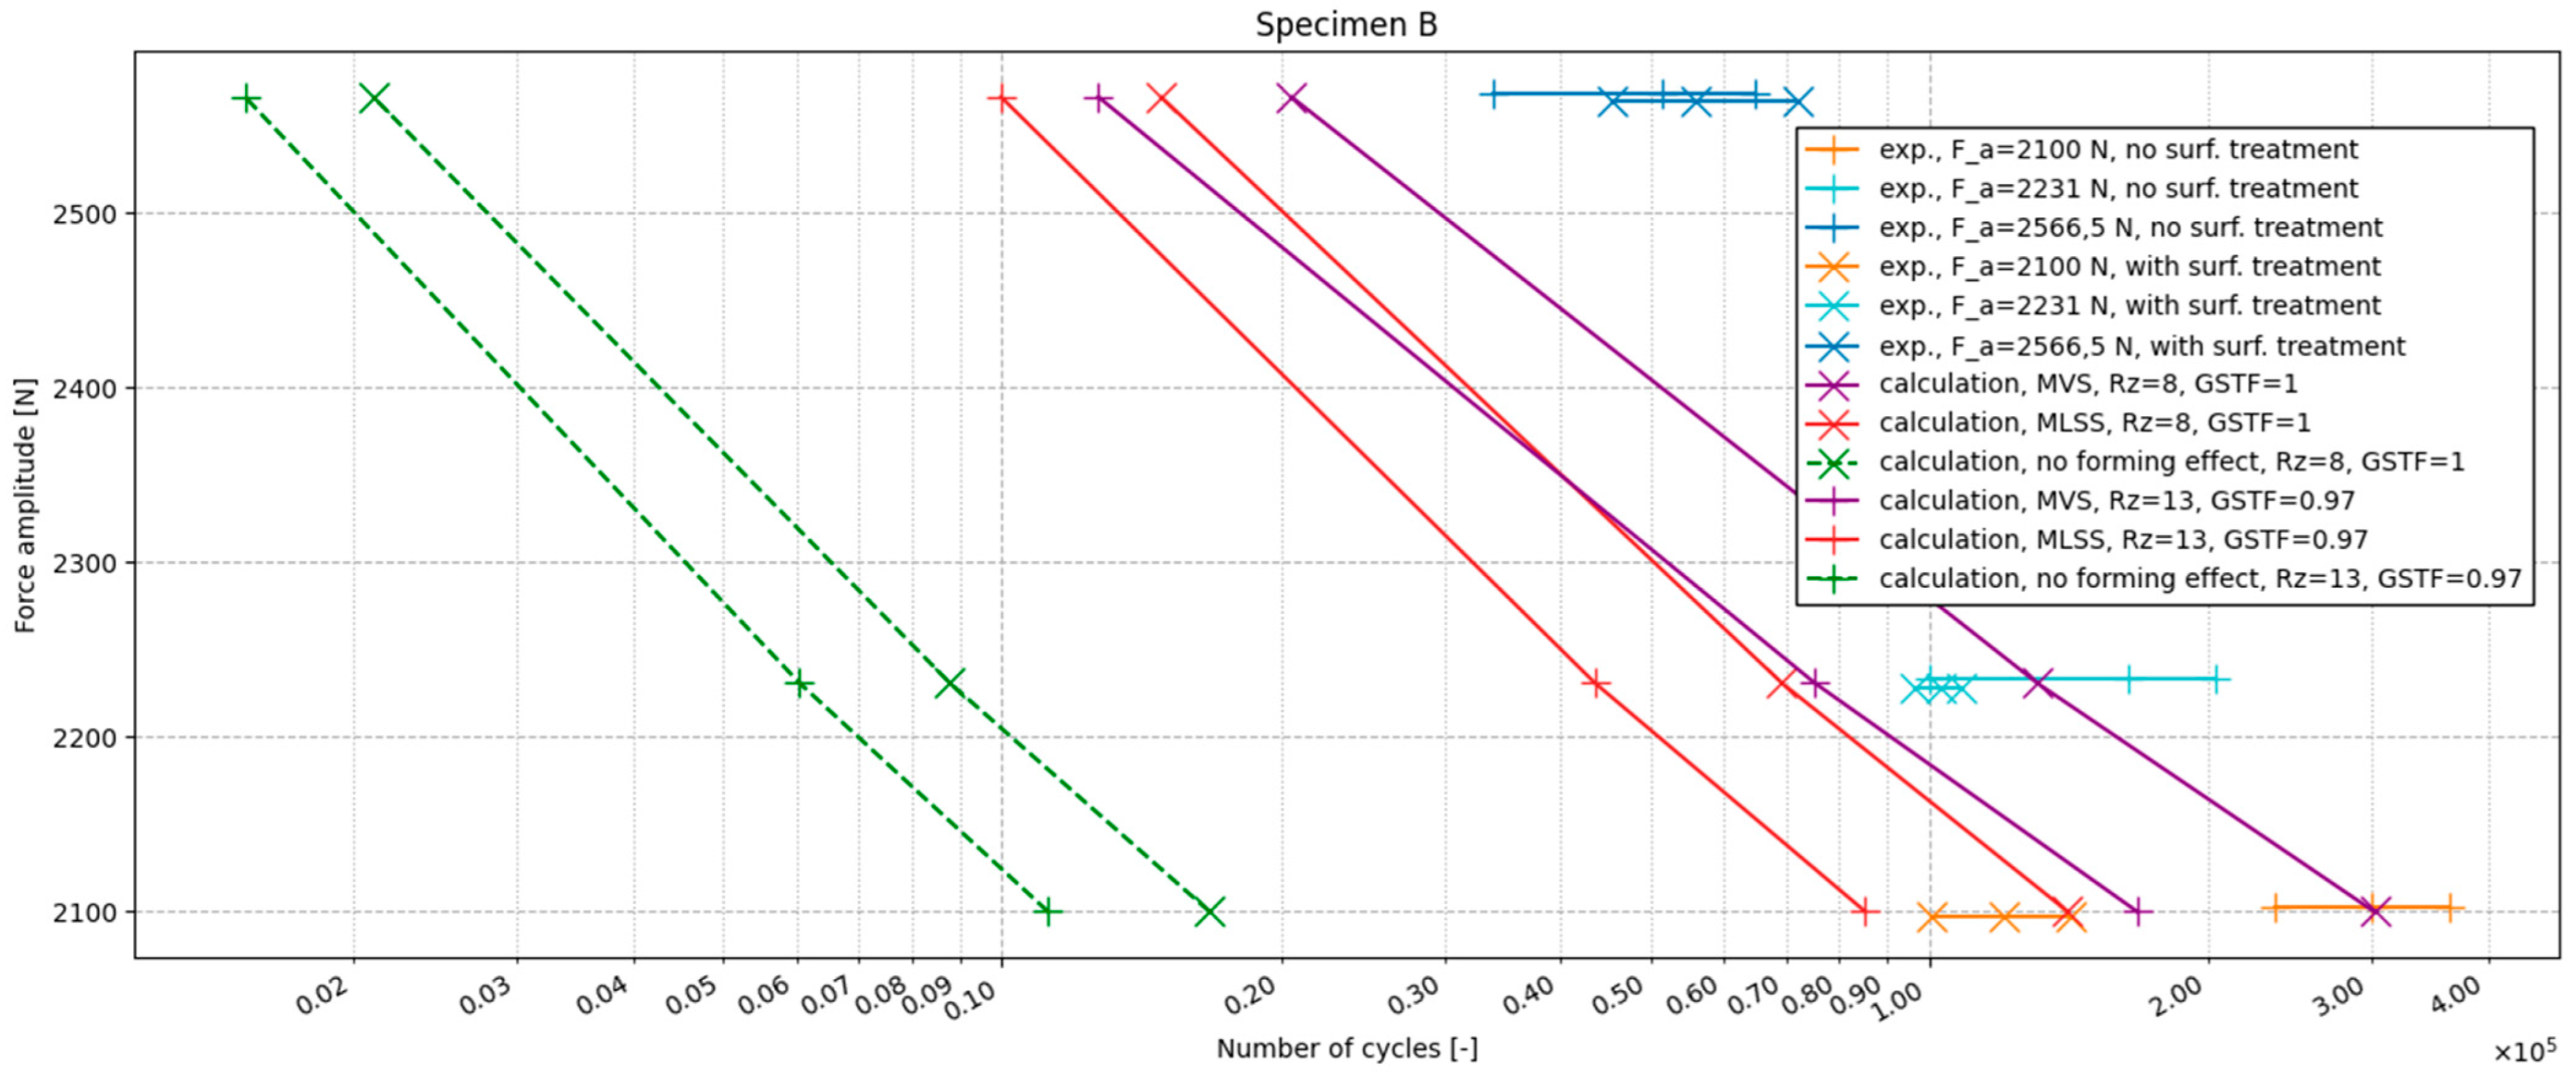
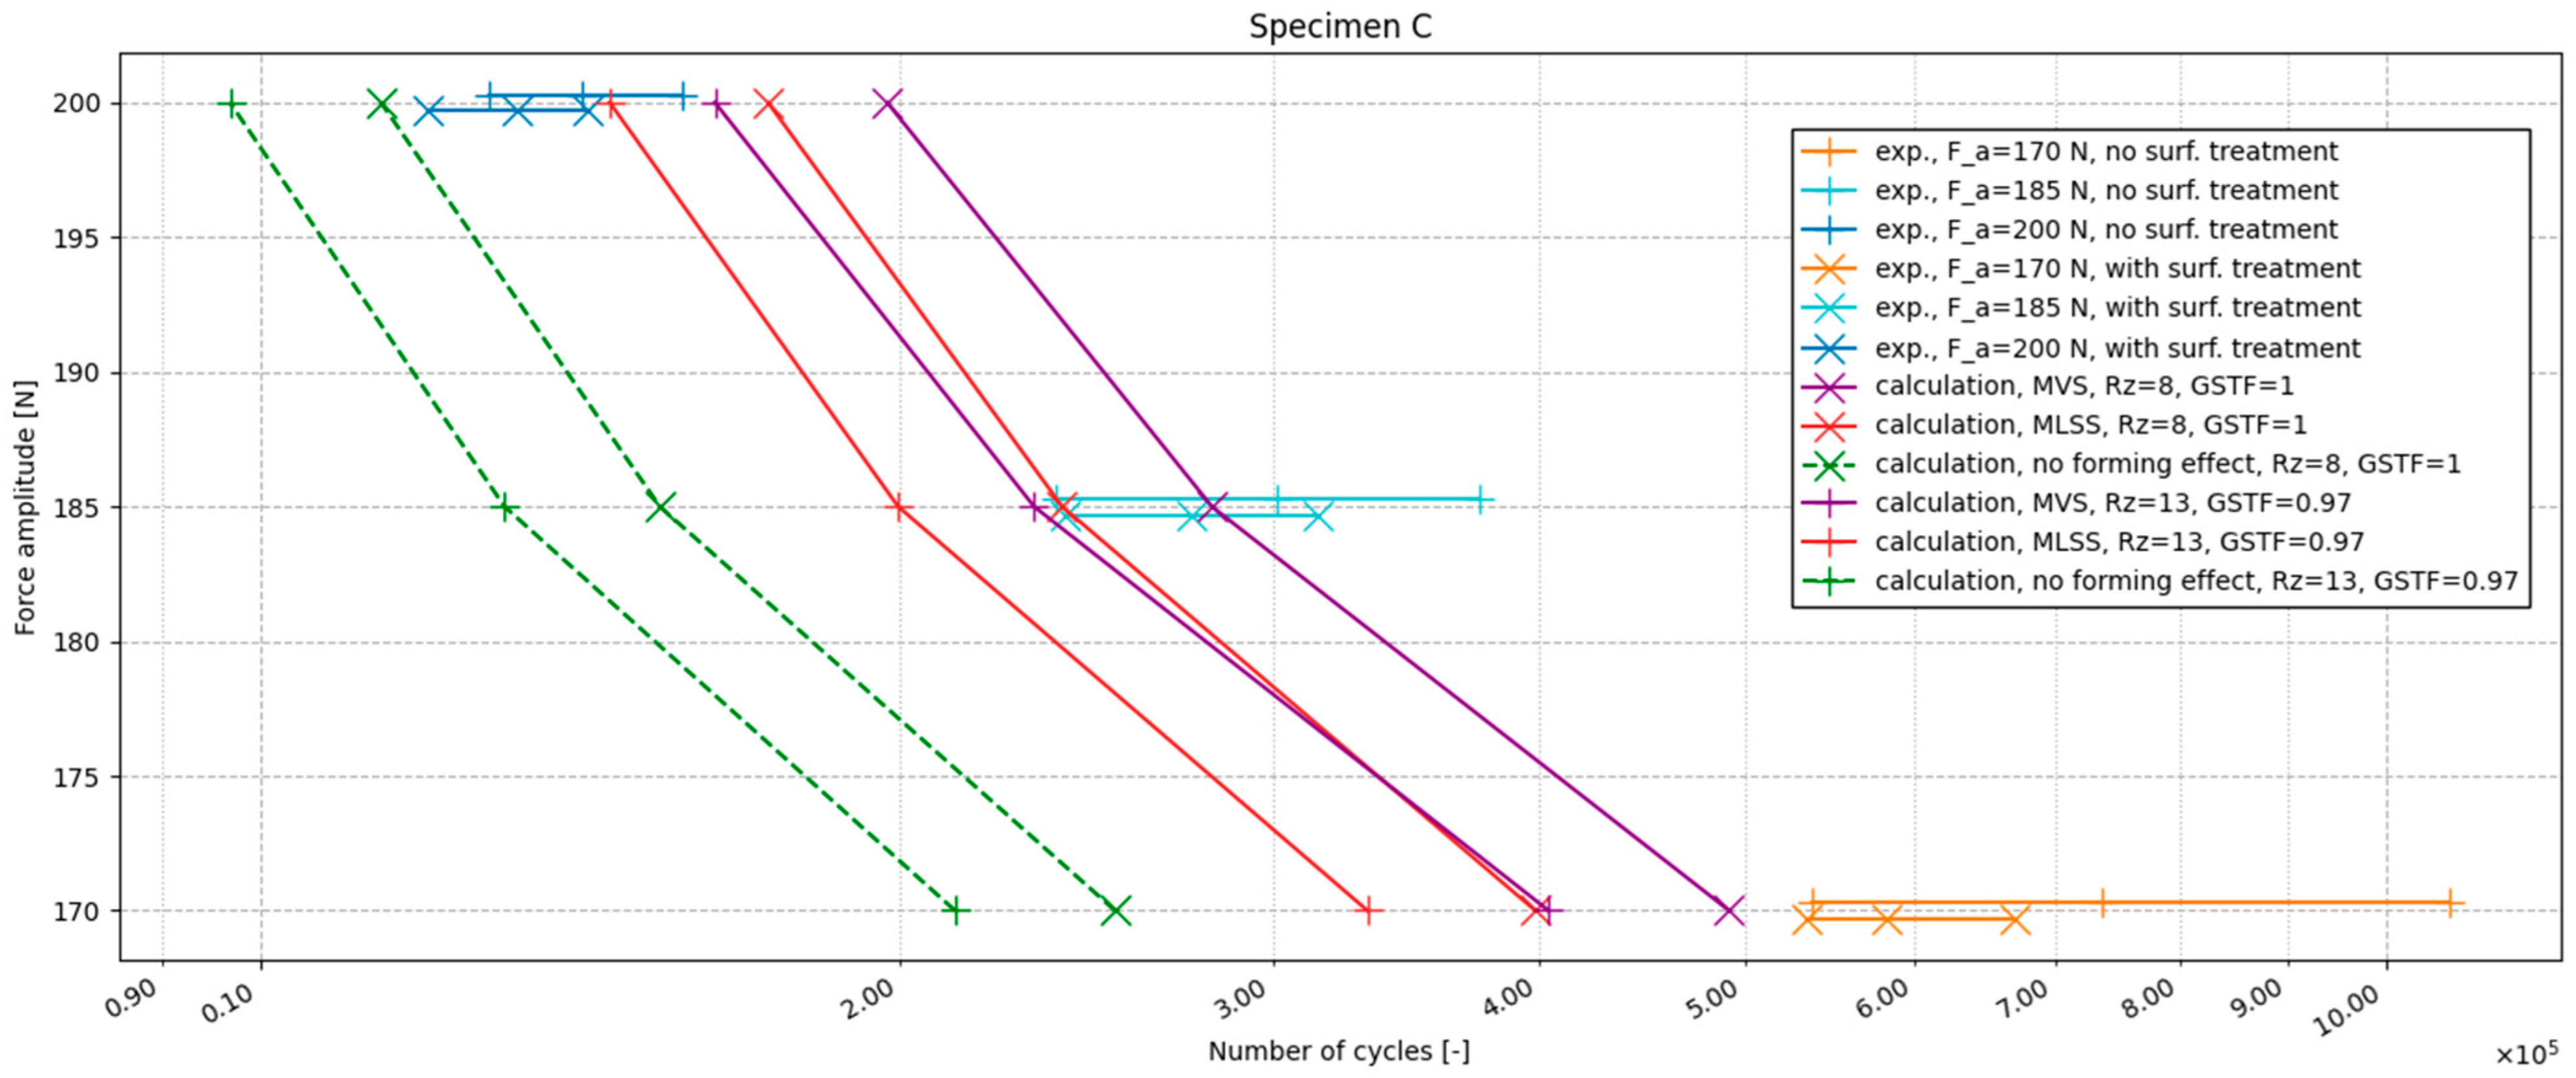
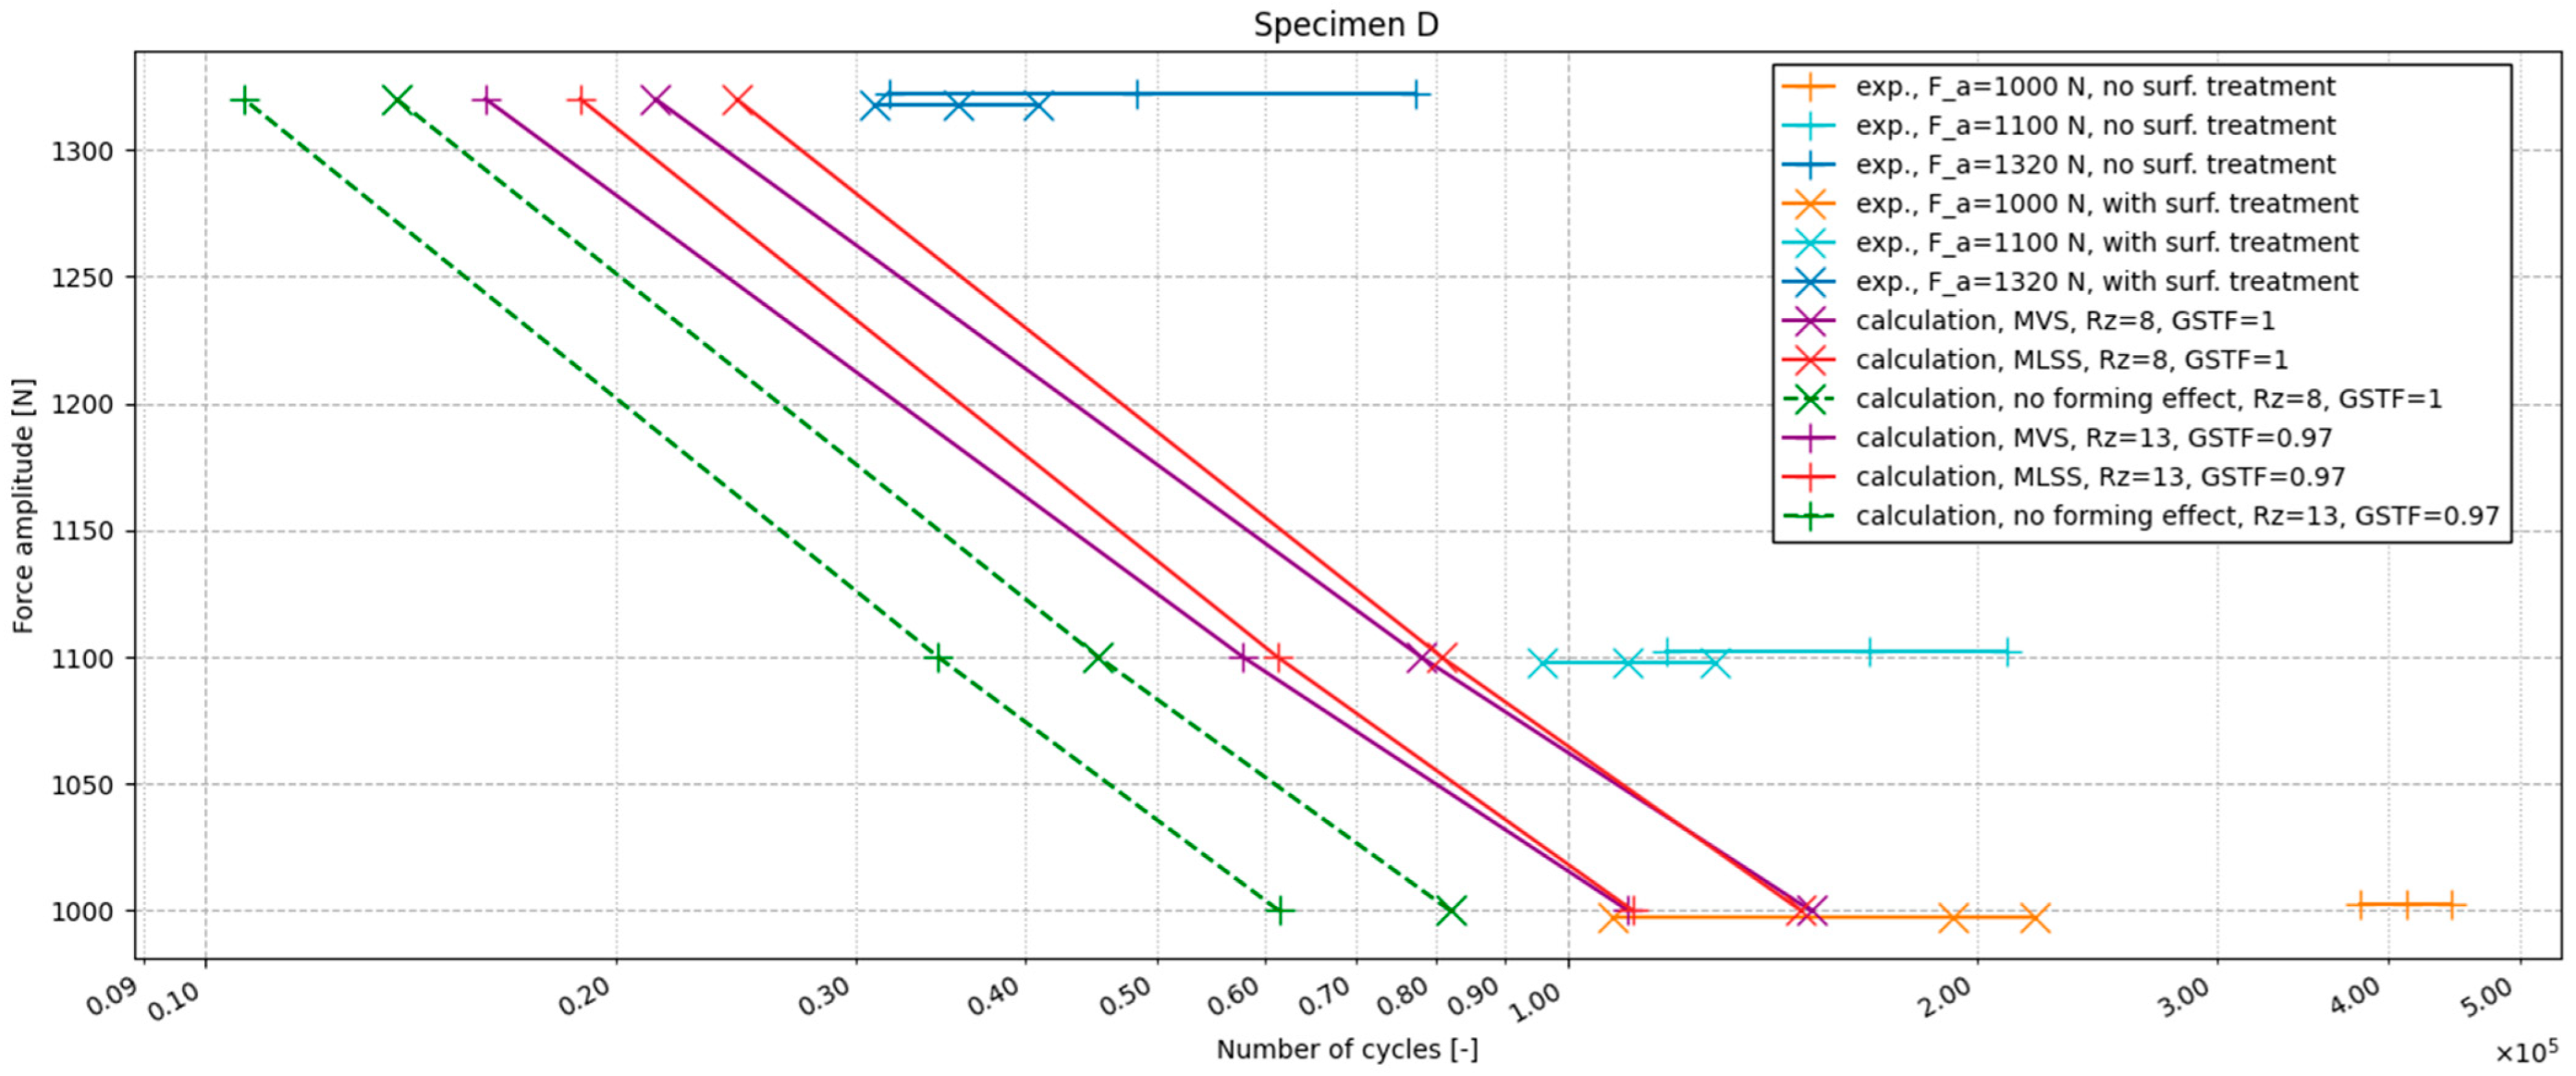
Figure 14, Figure 15, Figure 16 and Figure 17 show the results of the calculations and measurements on a semi-logarithmic graph. The horizontal lines denote the results of the experiments. Each horizontal line includes three markers—the minimum, average and maximum number of cycles which were achieved during the testing of the specimen sets. Markers “x” denote experimental data related to specimens with coating, markers “+” denote experimental data related to specimens without coating.
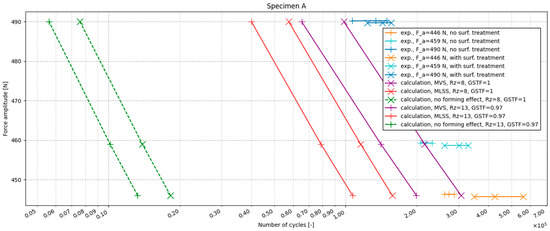
Figure 14.
Comparison of experimental and calculated results, specimen A.
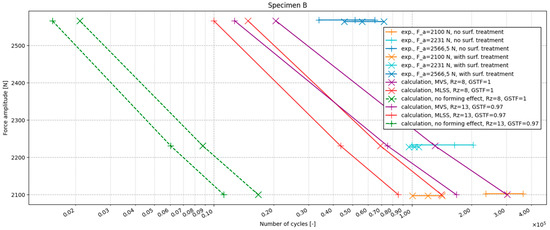
Figure 15.
Comparison of experimental and calculated results, specimen B.
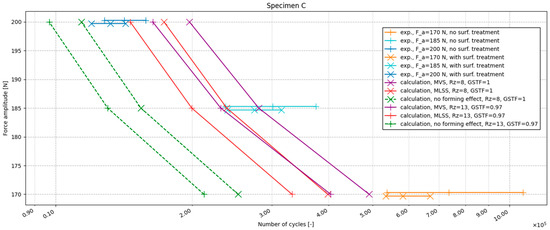
Figure 16.
Comparison of experimental and calculated results, specimen C. Taken from [31].
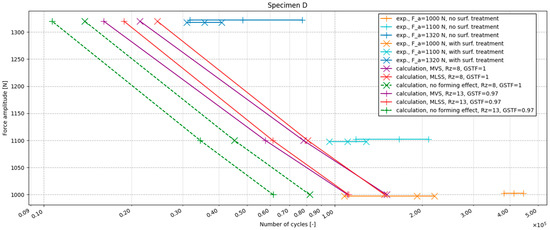
Figure 17.
Comparison of experimental and calculated results, specimen D. Taken from [31].
Especially if loading force amplitude is low, then there is a significant difference in the fatigue results. Voorwald et al. [37] measured the fatigue of steel samples with various surface layers. The test results from specimens with Zn-Ni coatings were highly dependent on the coating thickness. Specimens with coatings thicker than 15 µm had a shorter lifetime than specimens with thinner coatings or specimens without any coating. Our results are in agreement with this. It can be concluded that the thicker the coating, the greater the decrease in the fatigue life of the samples. From our and Voorwald’s results [37], it can be seen that at lower load levels, where more cycles are achieved, this difference is much more noticeable. For higher load levels and thus lower number of cycles, the results of fatigue tests on coated and uncoated samples can be considered identical. [38] describes the ways in which fatigue damage to coated components occurs. The first way of failure is the delamination of the coating and the base material (substrate). The crack formed at the interface between the coating and the substrate gradually spreads until it penetrates the substrate. The second way of failure is the formation of a crack directly in the coating. The crack arises as a result of the lower mechanical resistance of the coating and gradually propagates into the substrate. Our observations show that the second mode of damage dominates the fatigue damage of our samples. This is due to the fact that the mechanical resistance of the coating is lower than the mechanical resistance of the substrate and at the same time the Zn-Ni coating exhibits good adhesion to the substrate, so delamination does not occur. Moreover, coating increases surface roughness, which negatively affects fatigue life too. Coating also increases the surface hardness. A harder surface behaves more brittlely and thus again the fatigue life is reduced.
Results from the calculations are represented by non-horizontal lines. Three calculation methods were compared to find a favourable calculation set-up. The first calculation method (green dashed line) did not consider the effect of plastic strain originating during forming. The second calculation was done using the MLSS method (blue dashed line) and the third one was done using the MVS method (orange dashed line). Markers “x” denote calculations where influence of coating wasn’t considered. Only surface roughness Rz = 8 µm was considered via surface roughness factor according to [39]. Markers “+” denote calculations where surface roughness Rz = 13 µm was considered via surface roughness factor and where a GSTF of 0.97 was used. The purpose of this is to consider the effect of coating. It can be seen from all the graphs that the inclusion of the effect of effective plastic deformation brings the calculation results closer to the experimental results.
Residual stress arises in the part during forming. The residual stress relaxes if the part is exposed to cyclic loading. Hatscher claims [10] that residual stress relaxation is almost total if cyclic stress amplitude exceeds yield strength. This condition was fulfilled for all loading levels and for all critical spots in the specimens. Therefore, residual stress was neglected. The same assumption regarding residual stress was made in [40] where a similar problem was studied.
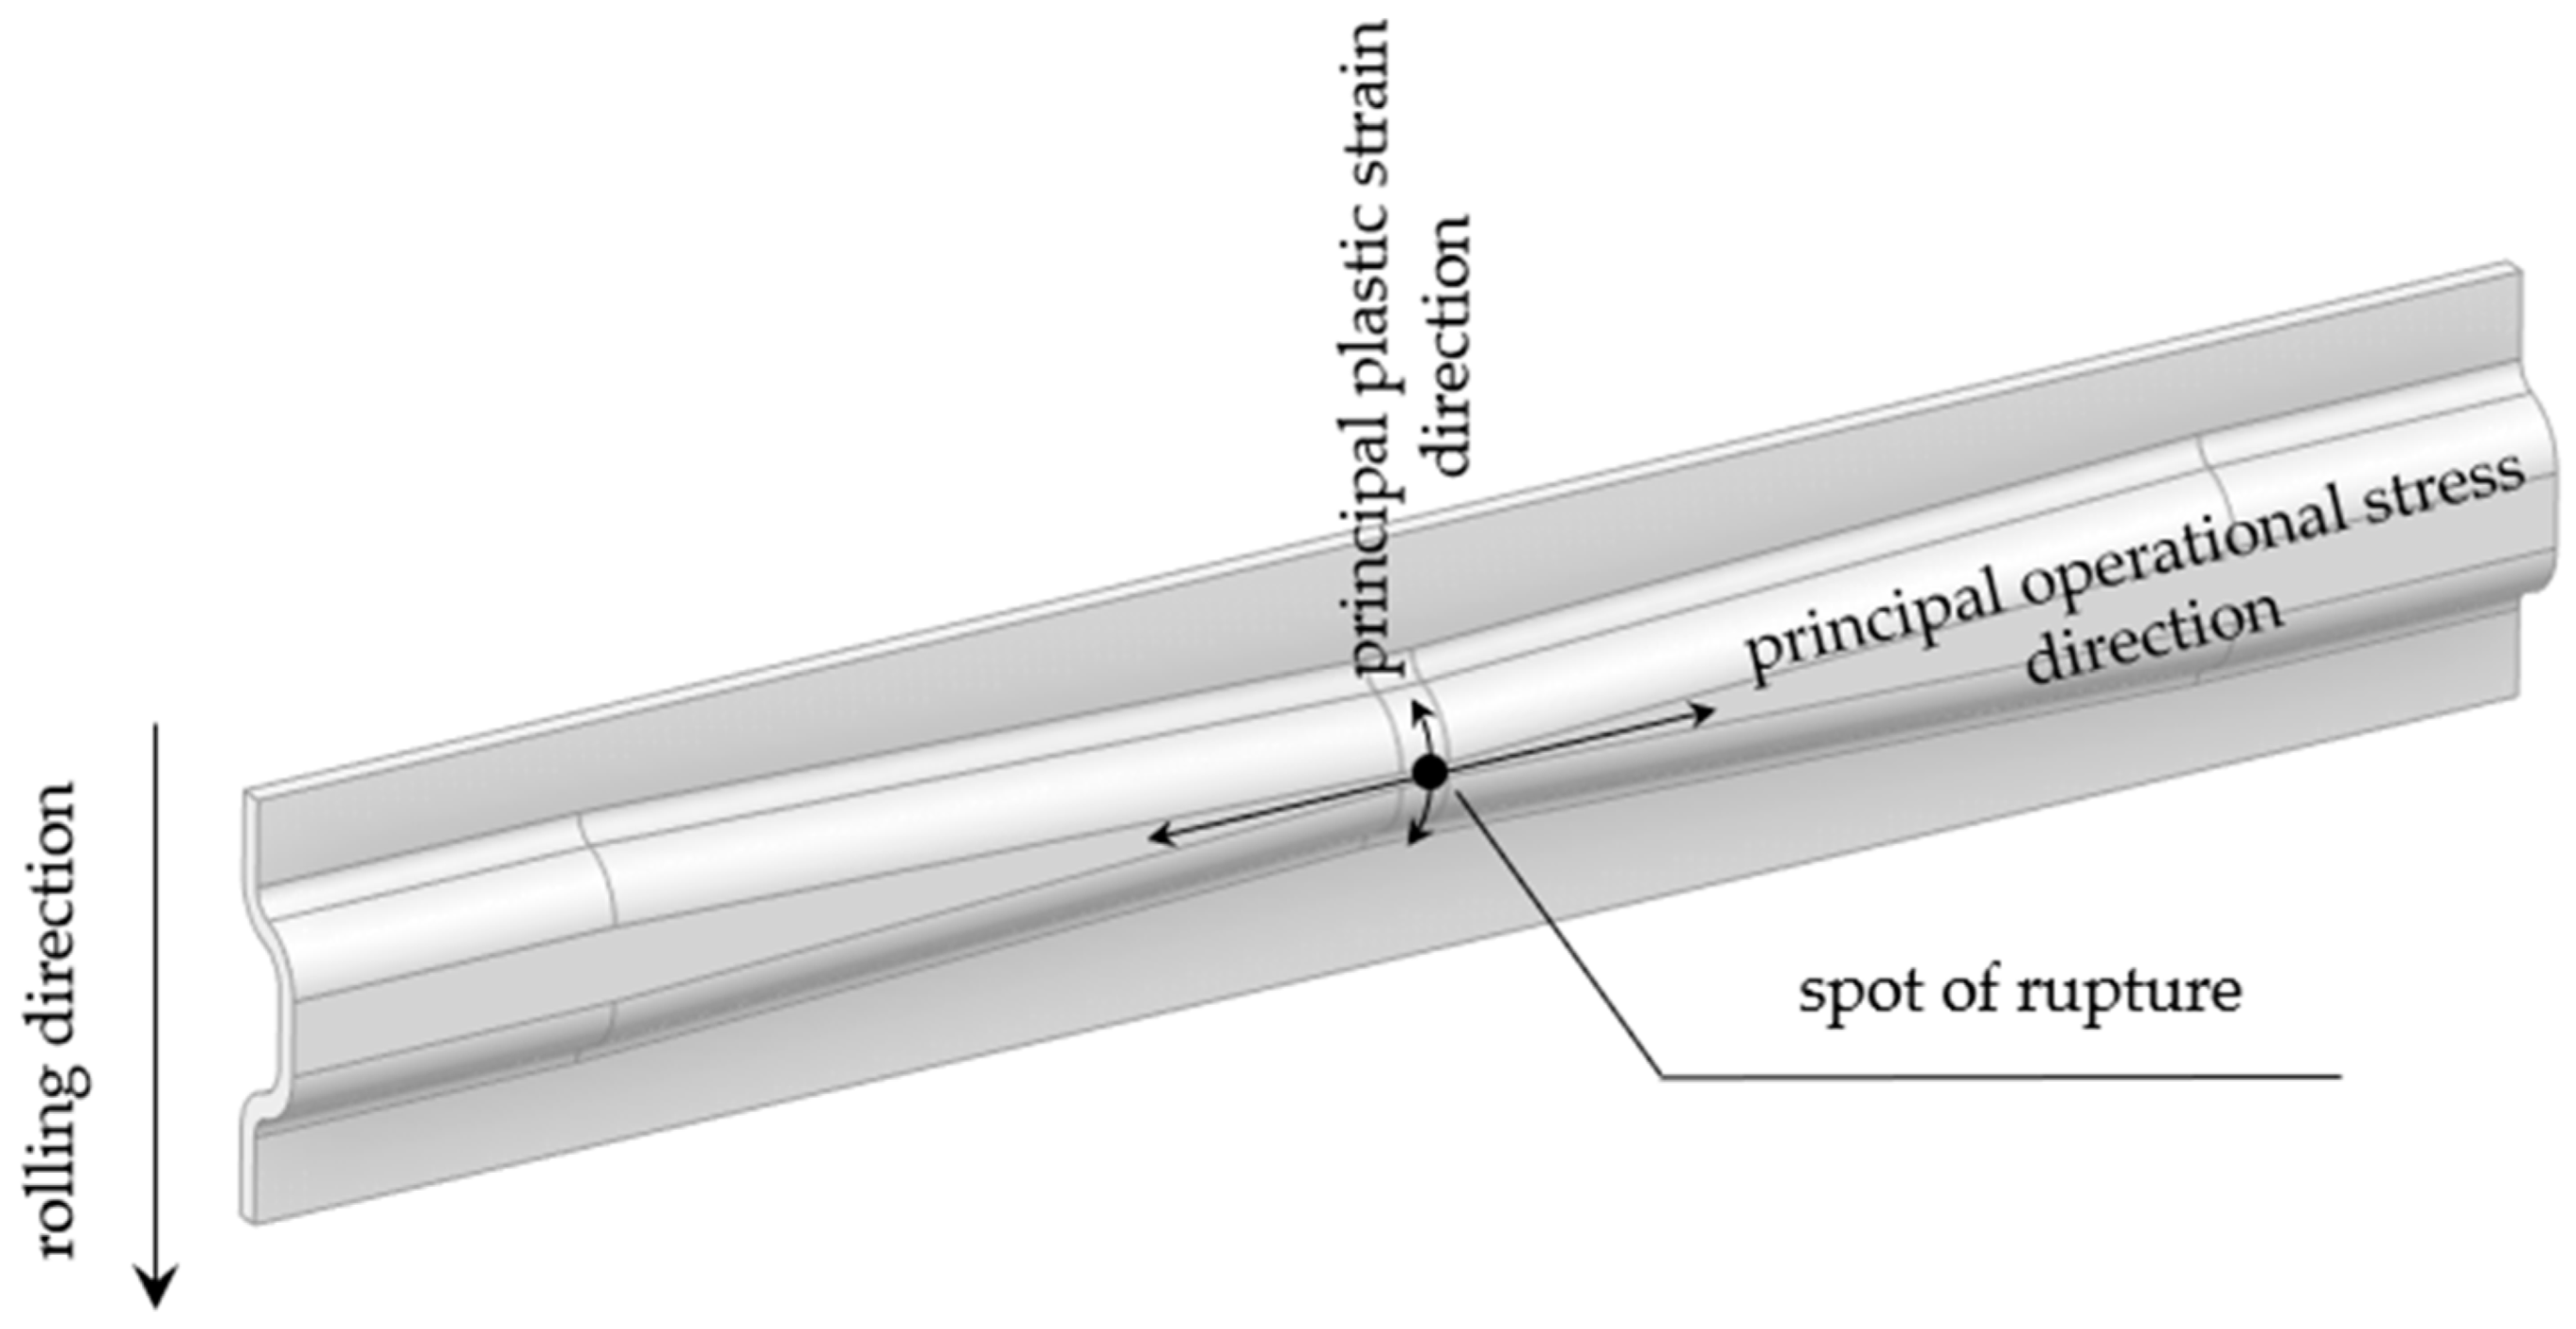
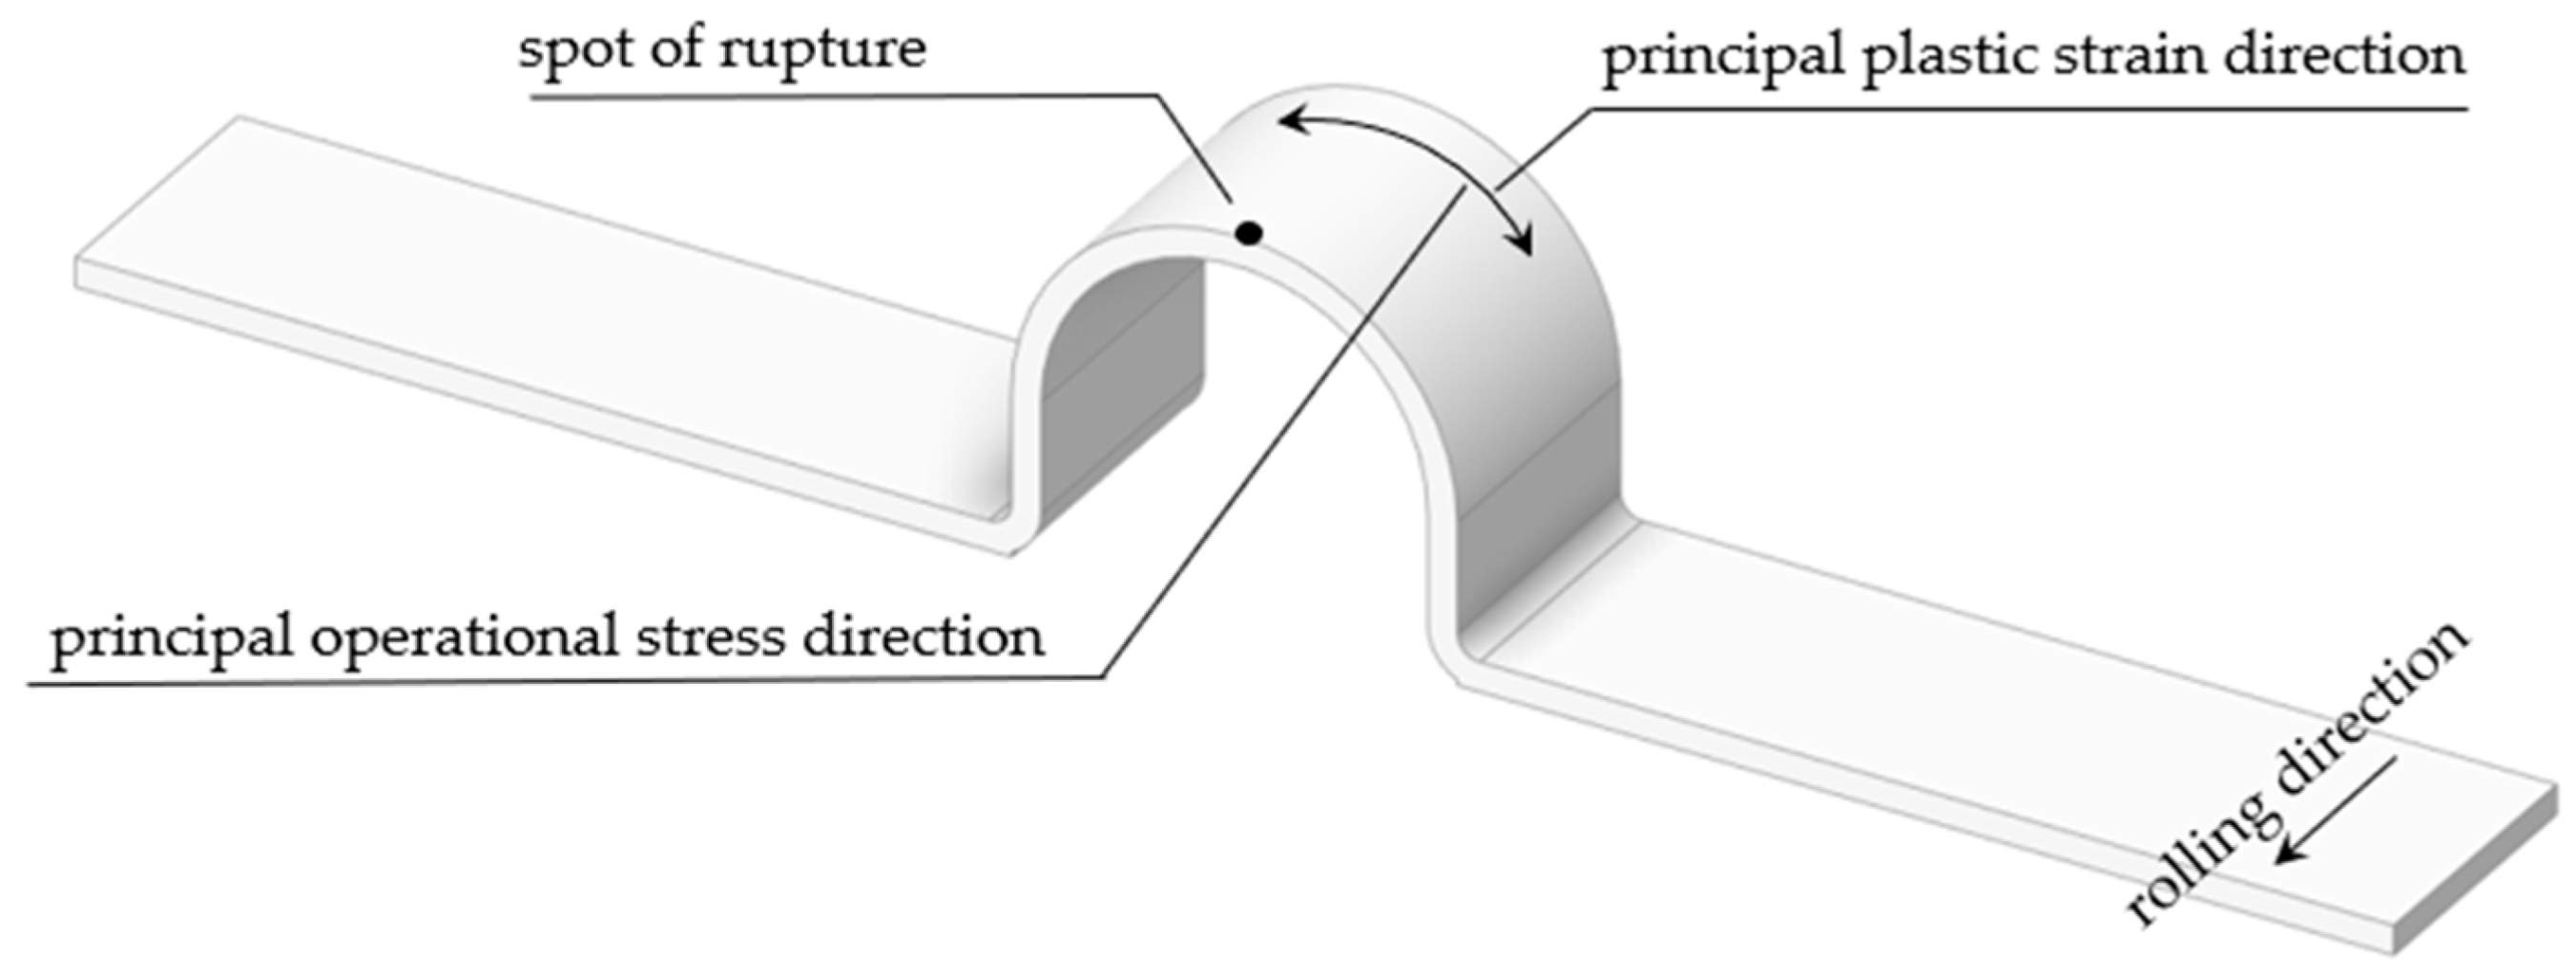
According to [10], plastic strain originating during forming should not be higher than the material’s uniform elongation. The same publication states a uniform elongation value of 23.3% for DC04 material. Results of our measurement shown in Table 2 agree with that. Uniform elongation of the S420MC material is about 13% based on our measurement shown in Table 2. This condition is not fulfilled for whole bodies, but it is satisfied in spots where rupture was expected. In Figure 18 and in Figure 19 these spots are marked ‘spot of rupture’.

Figure 18.
Rolling direction, principal plastic strain direction and operational stress direction of specimens A and B.

Figure 19.
Rolling direction, principal plastic strain direction and operational stress direction of specimens C and D.
Specimens are made from rolled metal sheet. The rolling direction can be seen in Figure 14 and Figure 15. From the fatigue point of view and in accordance with [6], the rolling direction has a low influence and it can be neglected in the fatigue evaluation. From the forming point of view, metal sheet orthotropy has some influence as can be seen in [41]. Nevertheless, the inverse stamping implementation which was used here only enables the user to consider normal anisotropy.
Figure 14 and Figure 15 also show the relative direction of the principal plastic strain originating during forming and the principal operational stress direction which is caused by cyclic loading. These directions are perpendicular in the critical spots of specimens A and B. For specimens C and D, these directions are parallel. The MVS and the MLSS adjust the local fatigue S-N curve based on effective plastic strain which is a direction-independent parameter. Massendorf claims in his publication [6], that the relative direction of principal plastic strain and principal operational stress has a low influence on fatigue-life. At the same time he adds that when the direction of plastic strain and stress is equal, this is more unfavourable from a fatigue point of view. Therefore, his MLSS method is based on this situation in order to obtain more conservative results. Relative direction of principal plastic strain direction and principal operational stress direction was studied in [5]. Its conclusions are somewhat different and the relative direction between strain and stress is quite significant.
The results based on MLSS for Specimens A and B are somewhat conservative due to the relative direction between principal plastic strain and principal operational stress discussed above. MLSS and MVS ignore relative direction influence and take into account plastic strain intensity only. Our results suggest that relative direction inclusion could lead to accuracy increase. However, including this effect will lead to a more demanding computational procedure. A limitation is also that computational procedures taking this effect into account are not currently included in available software. This is a serious limitation for engineering practice.
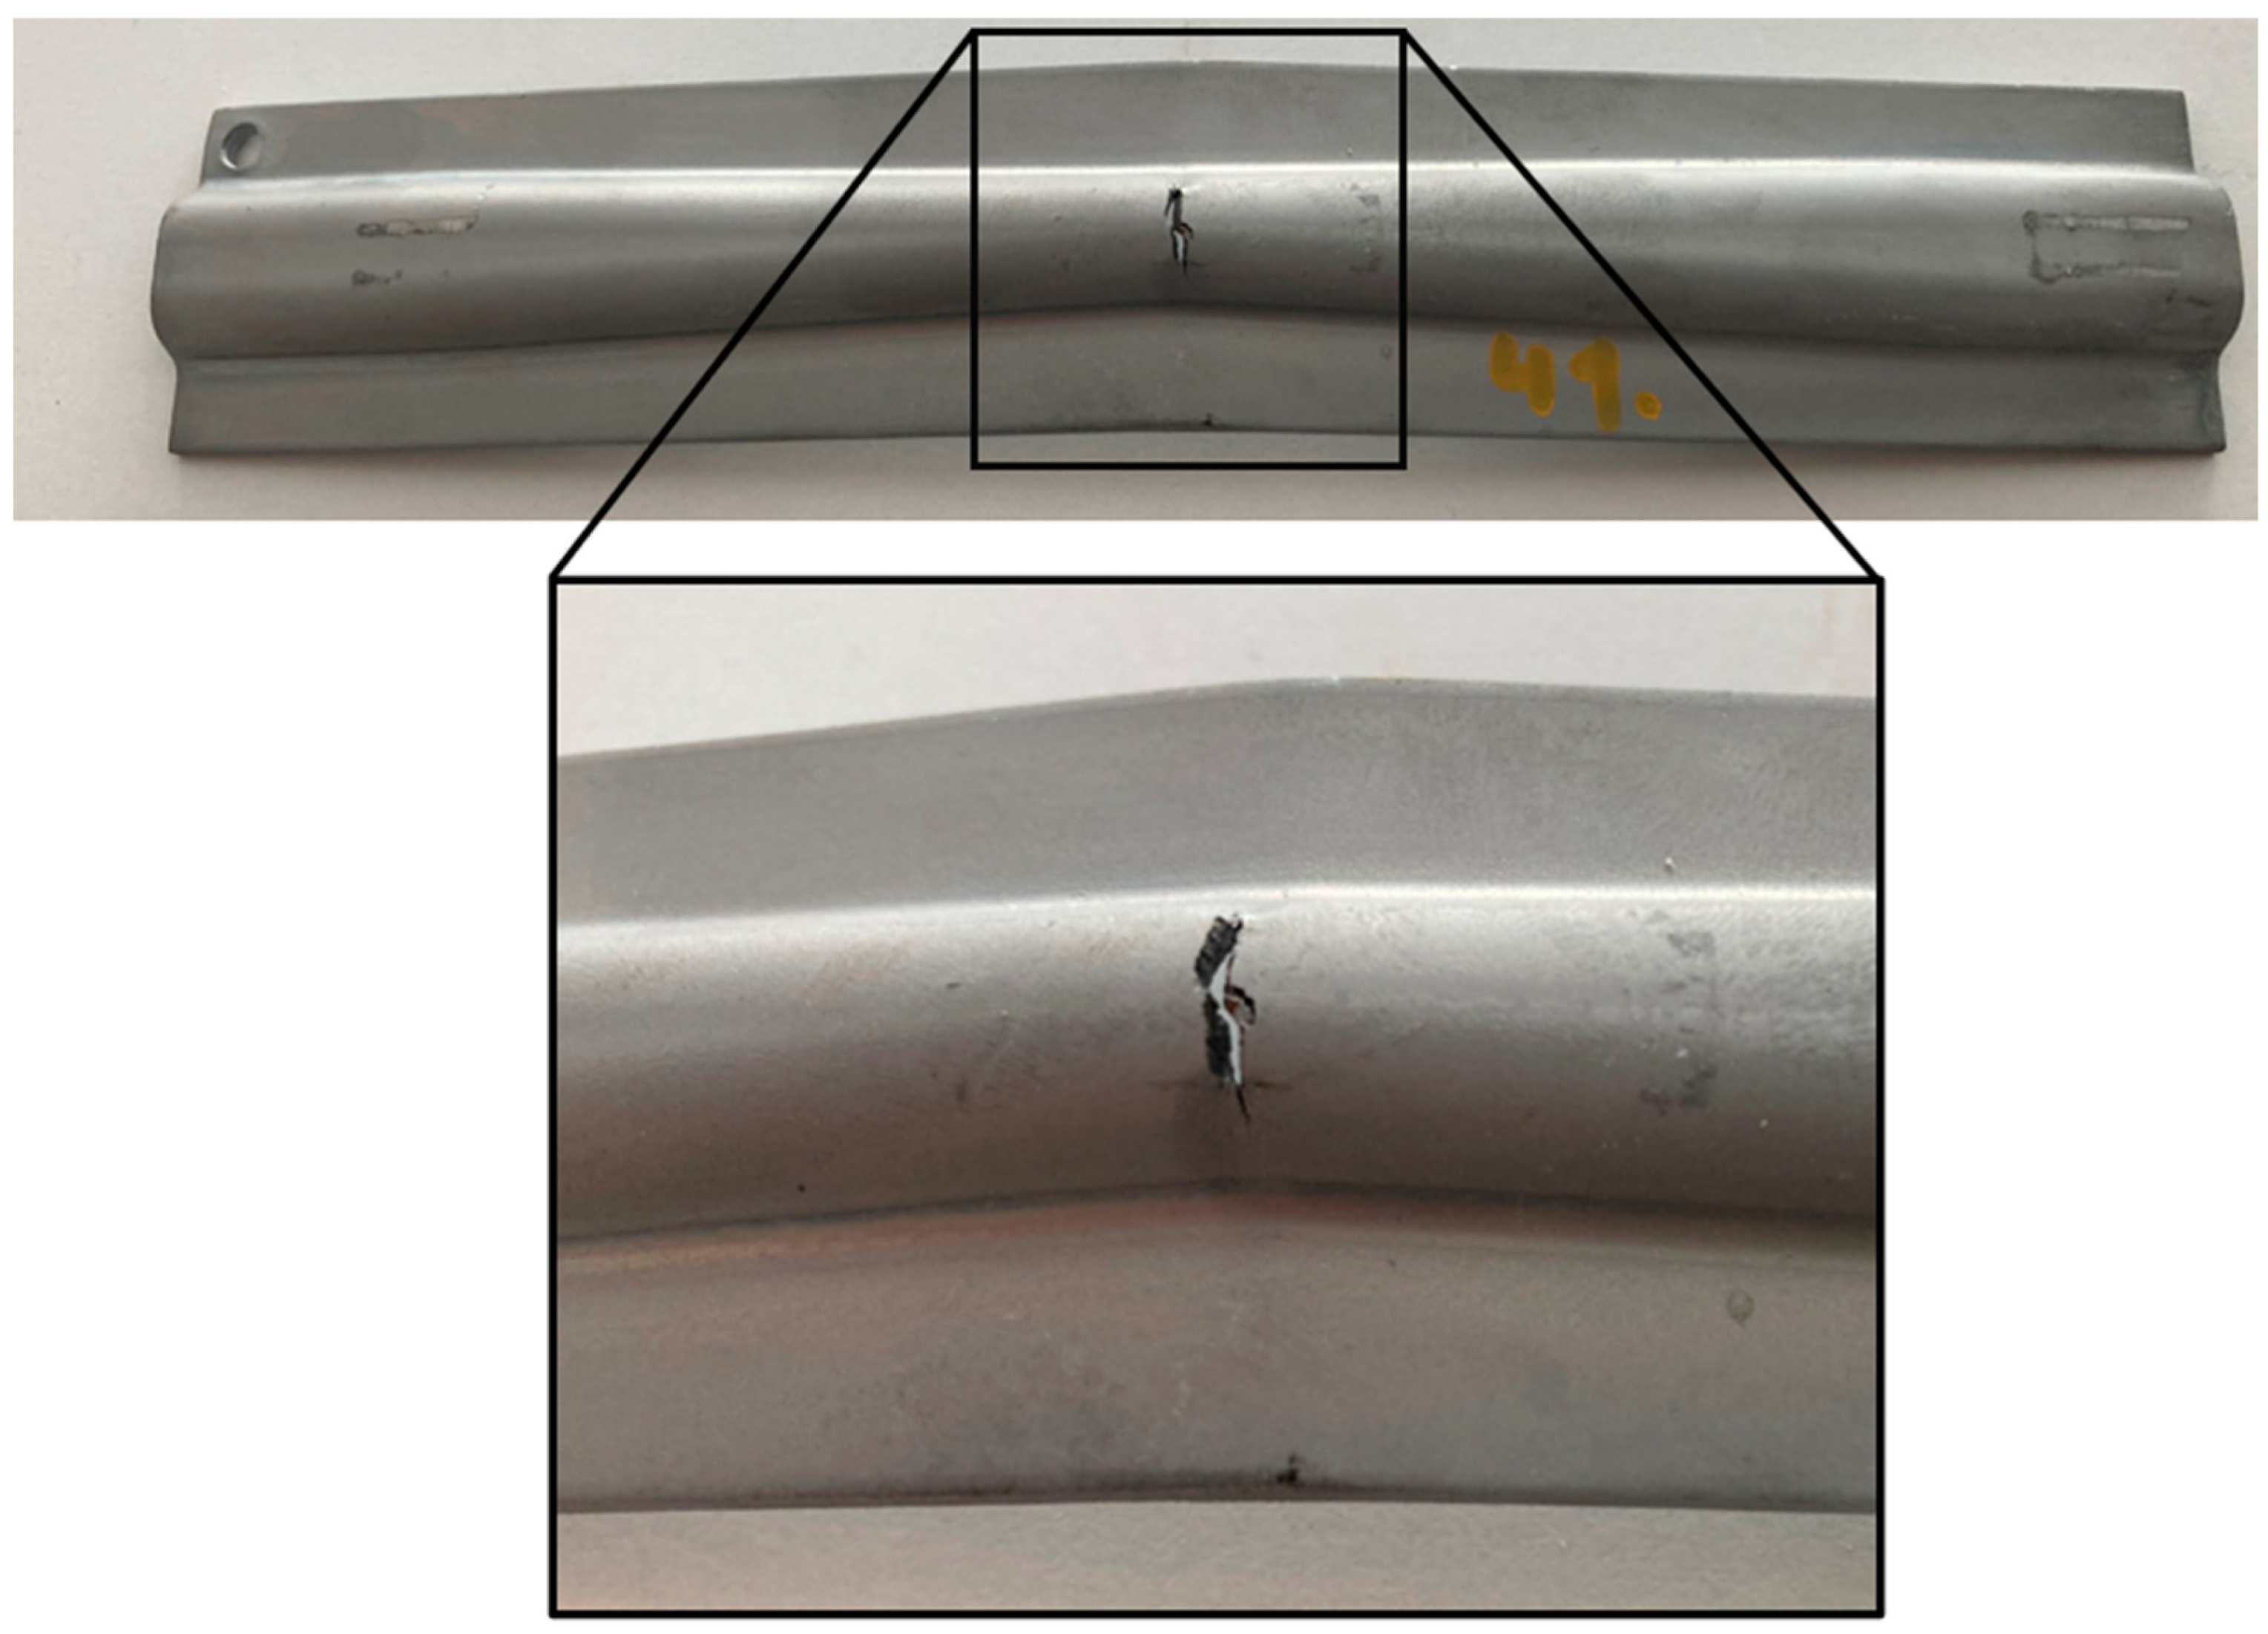
All A and B samples broke at the same spot, which is shown in Figure 20 and in Figure 21. All calculations predicted breakage at the same spot.
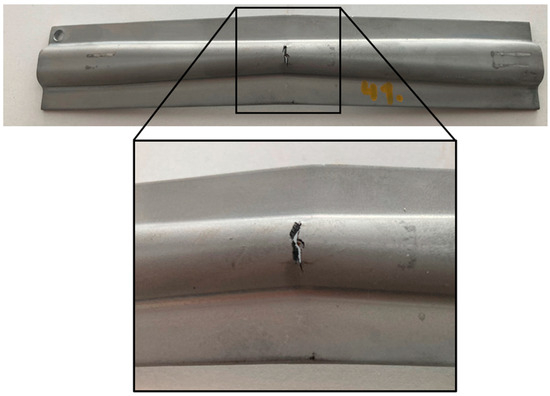
Figure 20.
Fatigue crack of specimen A where coating was applied.
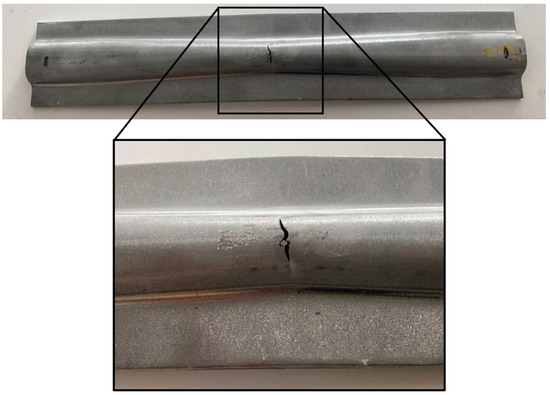
Figure 21.
Fatigue crack of specimen B without coating.
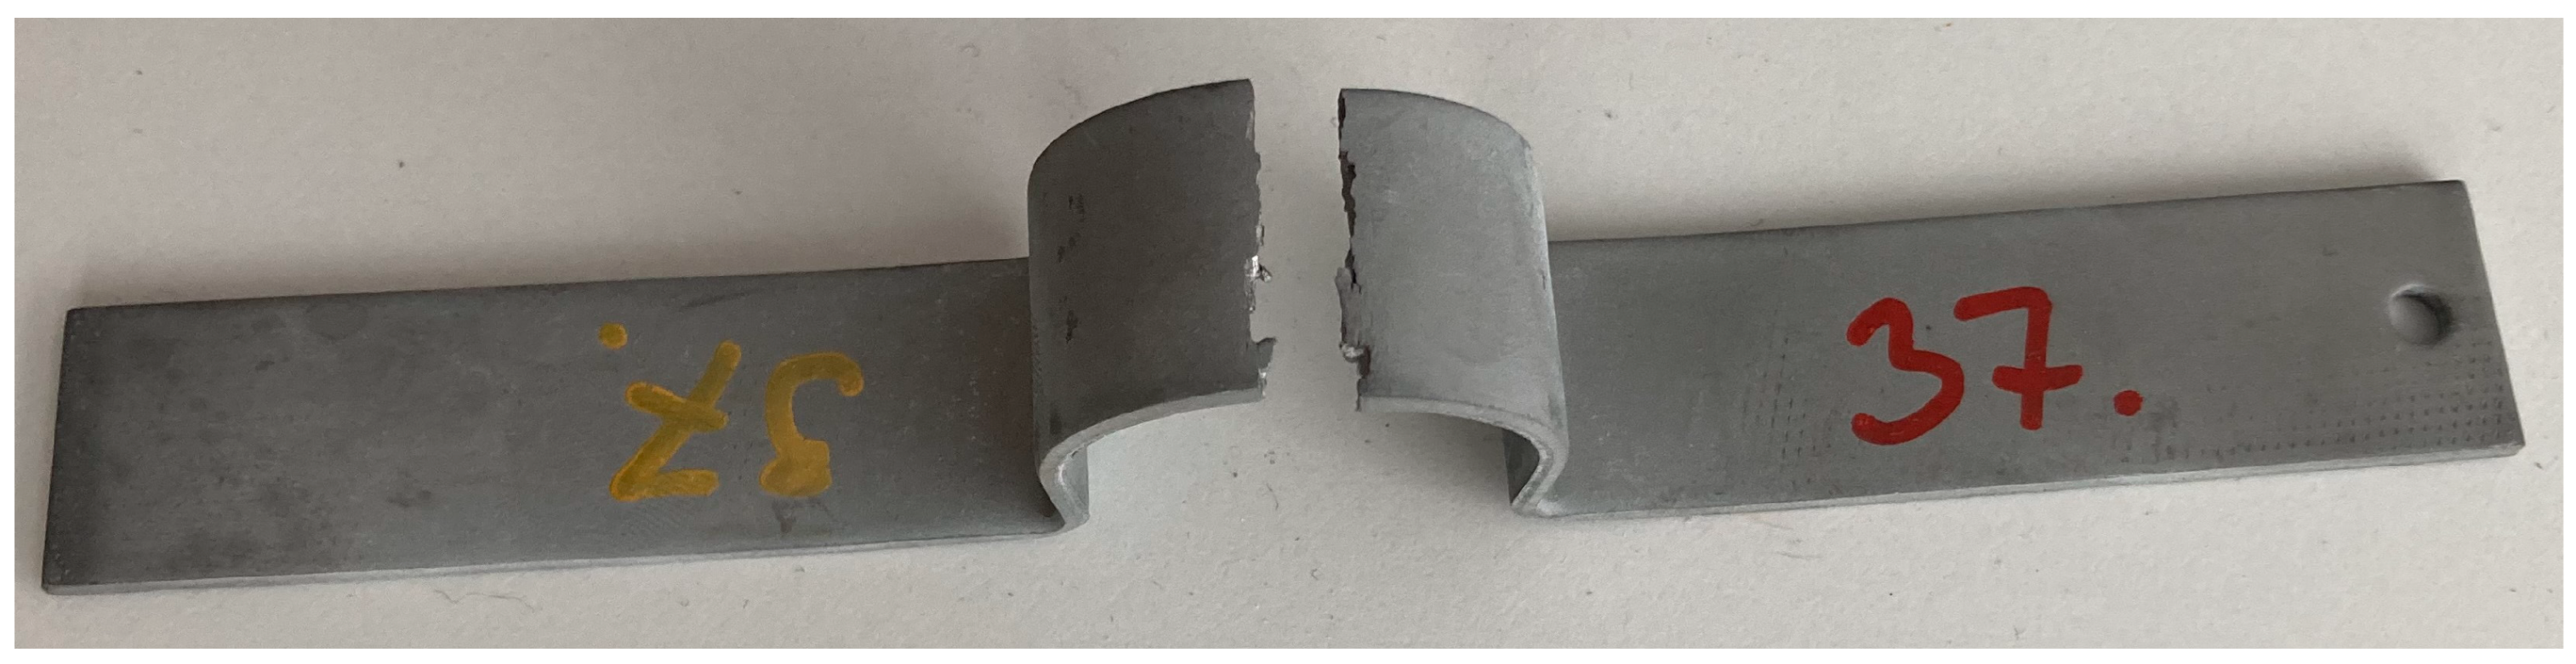
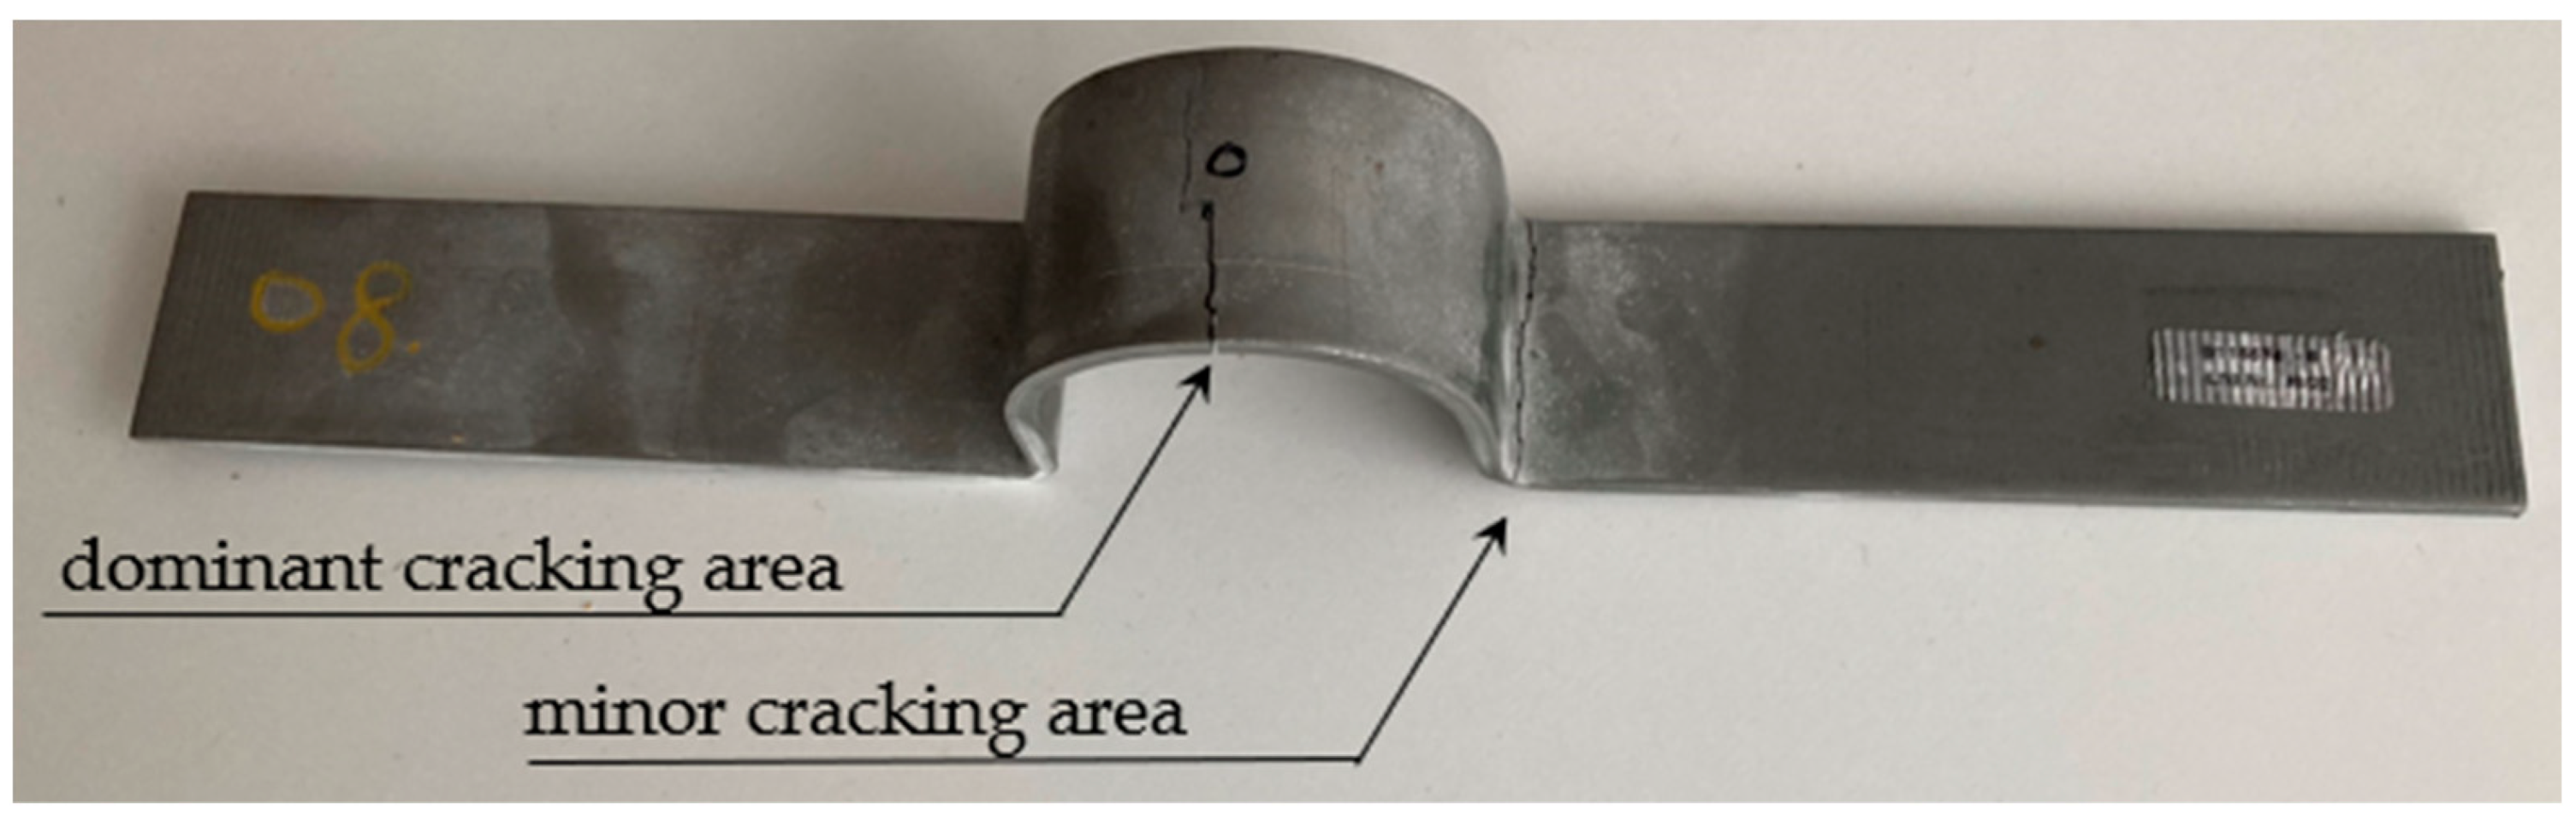
All type C specimens broke in the middle, see Figure 22. Some type D specimens broken in the middle too—this spot is denoted as a dominant cracking area in Figure 23. Nevertheless, some type D specimens broke in the minor cracking area or cracks appeared in both locations at once, Figure 23. Breakage in the minor cracking area occurred only for some specimens without coating and for loading levels D1 and D2. All calculations predicted breakage in the dominant cracking area only. Nevertheless, there is high plastic deformation in the minor cracking area and the theory used is outside the validity range. Samples which broke only in the minor cracking area were removed from the evaluation. Therefore, Figure 17 includes only two specimens without coating at loading level D1. All experimental results are summarized in Table A1, Table A2, Table A3 and Table A4.
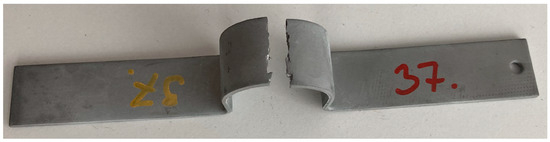
Figure 22.
Fatigue crack of specimen C with coating.
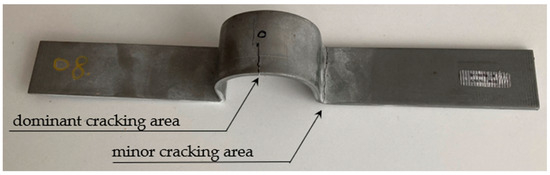
Figure 23.
Fatigue crack of specimen D where coating was not applied.
Experimental data showed some differences between parts with Ni-Zn coating and parts without any coating. The difference is more significant for lower loading force amplitudes. Temperatures reached in electroplating are not high (lower than 90 °C), so an impact on the base material is not expected. Nevertheless, surface roughness and hardness are affected and those effects need to be included in fatigue calculations. A detailed discussion of the effect of the coating was made in Section 4.
The MLSS provided realistic or conservative results, so it seems suitable for similar applications. A significant safety margin was observed in A type samples. The difference could be a result of some simplifications. The influence of rolling direction or the difference between principal plastic strain direction and the principal operational stress direction seem to be more significant than reported in the literature about MLSS and MVS methods.
5. Conclusions
It was demonstrated that reverse engineering of cold formed parts can be a complex problem. It is not enough to just scan the part’s shape, but also the influence of forming has to be taken into account if lifetime is to be estimated. The forming process significantly changes the fatigue properties. In reverse engineering it is not usually possible to reproduce the forming process completely, so simplified calculation methods have to be used. Inverse stamping provides fast and easy calculation of effective plastic strain, which is an important factor in the fatigue of cold formed parts.
Adaptation of inverse stamping to a volumetric mesh was shown. When calculating fatigue with a volumetric mesh, it is fully sufficient to determine the plastic deformation in its surface nodes. High cyclic fatigue cracks are initiated in the surface layer. This makes the whole procedure faster and easier. If a volumetric mesh is used then automatic detection of wall thickness can be implemented. This approach allows the user to analyse metal sheet parts with variable thicknesses.
Three calculation approaches were compared to find the best calculation set-up. The first approach completely neglected the effect of plastic strain. Its results were highly conservative. Another approach was based on the MVS method. Its results were sometimes a bit too optimistic. The last calculation approach was based on the MLSS method. Its results corresponded to the measured data. The MLSS method seems to be the best option for practical use. The MLSS and MVS methods were chosen because their use is simple, as they take into account only the intensity of plastic deformation and not its character or dominant direction. These methods are implemented in commercial software like FEMFAT 2022a, which again makes them easy to use. On the other hand, ease of use may be at the expense of lower accuracy.
Our measurement shows that the effect of the coating on the fatigue life can be significant and cannot be ignored even in reverse engineering. The purpose of the Zn-Ni coating used here is to increase the anti-corrosion resistance, however, its application can lead to a decrease in the fatigue resistance of the component.
The calculation procedure presented here is useful in reverse engineering when it is combined with other reverse engineering techniques like 3D scanning. The procedure can also be easily used in the early stages of a new product design. In this situation the 3D scan of the part which was used as the input in the previous situation is substituted by a geometrical model of the designed part.
Author Contributions
Conceptualization, J.K.; Data curation, J.K.; Formal analysis, J.K.; Investigation, J.K., P.B. and V.L.; Project administration, P.B. and V.L.; Software, J.K.; Supervision, P.B. and V.L.; Validation, J.K.; Visualization, J.K.; Writing—original draft, J.K.; Writing—review & editing, P.B. All authors have read and agreed to the published version of the manuscript.
Funding
This paper was funded by the project “Comprehensive support for designing technical equipment” no. SGS-2022-009.
Data Availability Statement
The data presented in this study are available on request from the corresponding author. The data are not publicly available.
Acknowledgments
This paper is based on the cooperation with MUBEA, spol. s.r.o. using the equipment and material for preparation of all specimens.
Conflicts of Interest
The authors declare no conflict of interest.
Appendix A
Table A1.
Experimental results of A specimens.
Table A1.
Experimental results of A specimens.
| Loading Level | Specimen ID | Surf. Coating | Number of Cycles Until Cracking | Specimen ID | Surf. Coating | Number of Cycles until Cracking |
|---|---|---|---|---|---|---|
| A1 | 11 | False | 561,891 | 41 | True | 282,719 |
| 12 | False | 433,662 | 42 | True | 260,211 | |
| 13 | False | 347,750 | 43 | True | 269,064 | |
| 14 | False | 369,294 | 44 | True | 286,693 | |
| 15 | False | 417,528 | 45 | True | 263,252 | |
| A2 | 6 | False | 323,263 | 36 | True | 214,483 |
| 1 | False | 328,820 | 37 | True | 206,788 | |
| 8 | False | 298,348 | 38 | True | 220,686 | |
| 9 | False | 260,924 | 39 | True | 215,356 | |
| 10 | False | 293,465 | 40 | True | 231,474 | |
| A3 | 7 | False | 155,654 | 31 | True | 129,996 |
| 2 | False | 137,533 | 32 | True | 137,875 | |
| 4 | False | 154,103 | 33 | True | 106,810 | |
| 5 | False | 123,302 | 34 | True | 145,861 | |
| 35 | True | 149,245 |
Table A2.
Experimental results of B specimens.
Table A2.
Experimental results of B specimens.
| Loading Level | Specimen ID | Surf. Coating | Number of Cycles until Cracking | Specimen ID | Surf. Coating | Number of Cycles until Cracking |
|---|---|---|---|---|---|---|
| B1 | 9 | False | 235,329 | 47 | True | 141,858 |
| 10 | False | 363,248 | 48 | True | 133,498 | |
| 49 | True | 106,131 | ||||
| 50 | True | 100,403 | ||||
| B2 | 1 | False | 203,687 | 41 | True | 108,331 |
| 11 | False | 154,799 | 42 | True | 96,586 | |
| 12 | False | 168,937 | 43 | True | 104,357 | |
| 13 | False | 99,850 | 44 | True | 104,258 | |
| 14 | False | 191,868 | 45 | True | 101,882 | |
| B3 | 3 | False | 72,203 | 36 | True | 64,959 |
| 7 | False | 50,235 | 37 | True | 58,777 | |
| 15 | False | 45,412 | 38 | True | 55,739 | |
| 39 | True | 44,171 | ||||
| 40 | True | 33,801 |
Table A3.
Experimental results of C specimens.
Table A3.
Experimental results of C specimens.
| Loading Level | Specimen ID | Surf. Coating | Number of Cycles until Cracking | Specimen ID | Surf. Coating | Number of Cycles until Cracking |
|---|---|---|---|---|---|---|
| C1 | 11 | False | 537,206 | 43 | True | 668,860 |
| 16 | False | 1,072,434 | 35 | True | 543,954 | |
| 13 | False | 761,125 | 36 | True | 575,233 | |
| 14 | False | 637,785 | 37 | True | 593,450 | |
| 17 | False | 668,746 | 44 | True | 533,692 | |
| C2 | 6 | False | 236,718 | 33 | True | 303,332 |
| 18 | False | 287,996 | 38 | True | 251,029 | |
| 21 | False | 299,887 | 39 | True | 239,045 | |
| 20 | False | 375,120 | 40 | True | 263,318 | |
| 19 | False | 303,803 | 41 | True | 314,542 | |
| C3 | 2 | False | 150,834 | 34 | True | 121,267 |
| 23 | False | 128,063 | 42 | True | 133,446 | |
| 7 | False | 129,835 | 45 | True | 135,355 | |
| 8 | False | 158,037 | 46 | True | 128,973 | |
| 47 | True | 120,063 |
Table A4.
Experimental results of D specimens.
Table A4.
Experimental results of D specimens.
| Loading Level | Specimen ID | Surf. Coating | Number of Cycles until Cracking | Specimen ID | Surf. Coating | Number of Cycles until Cracking |
|---|---|---|---|---|---|---|
| D1 | 10 | False | 382,028 | 47 | True | 107,830 |
| 13 | False | 445,273 | 42 | True | 198,051 | |
| 38 | True | 195,448 | ||||
| 39 | True | 209,595 | ||||
| 40 | True | 219,782 | ||||
| 41 | True | 220,167 | ||||
| D2 | 1 | False | 210,171 | 33 | True | 103,459 |
| 8 | False | 171,962 | 34 | True | 95,898 | |
| 22 | False | 118,271 | 35 | True | 119,750 | |
| 36 | True | 106,007 | ||||
| 37 | True | 128,480 | ||||
| D3 | 2 | False | 43 | True | 40,805 | |
| 14 | False | 44 | True | 39,850 | ||
| 15 | False | 45 | True | 30,948 | ||
| 46 | True | 31,001 |
References
- He, L.; Wang, Z.; Akebono, H.; Sugeta, A. Machine learning-based predictions of fatigue life and fatigue limit for steels. J. Mater. Sci. Technol. 2021, 90, 9–19. [Google Scholar] [CrossRef]
- Lašová, V.; Bernardin, P.; Švagr, M.; Kubíček, J. Alternative solution of a milling head housing using the Computer Aided Systems. MM Sci. J. 2021, 2021, 4304–4309. [Google Scholar] [CrossRef]
- Lalvani, H.; Mandal, P. Cold forming of Al-5251 and al-6082 tailored welded blanks manufactured by laser and electron beam welding. J. Manuf. Process. 2021, 68, 1615–1636. [Google Scholar] [CrossRef]
- Hu, P.; Ma, N.; Liu, L.-Z.; Zhu, Y.-G. Theories, Methods and Numerical Technology of Sheet Metal Cold and Hot Forming: Analysis, Simulation and Engineering Applications; Springer Science & Business Media: London, UK, 2012; p. 16. [Google Scholar]
- Bimal, D.; Akhilendra, S.; Kanwer, S.A.; Mahadev, S.; Surajit, K.P. Influence of pre-straining path on high cycle fatigue performance of DP 600 steel. Int. J. Fatigue 2019, 126, 369–380. [Google Scholar] [CrossRef]
- Souto, C.D.S.; Gomes, V.M.G.; Figueiredo, M.; Correia, J.A.F.O.; Lesiuk, G.; Fernandes, A.A.; De Jesus, A.M.P. Fatigue behaviour of thin-walled cold roll-formed steel sections. Int. J. Fatigue 2021, 149, 106299. [Google Scholar] [CrossRef]
- Meng, Q.; Zhai, R.; Zhang, Y.; Fu, P.; Zhao, J. Analysis of springback for multiple bending considering nonlinear unloading-reloading behavior, stress inheritance and Bauschinger effect. J. Mater. Process. Technol. 2022, 307, 117657. [Google Scholar] [CrossRef]
- Solfronk, P.; Sobotka, J.; Koreček, D. Effect of the computational model and mesh strategy on the springback prediction of the sandwich material. Machines 2022, 10, 114. [Google Scholar] [CrossRef]
- Masendorf, R. Einfluss der Umformung auf die zyklischen Werkstoffkennwerte von Feinblech; Papierflieger: Clausthal, Germany, 2000; ISBN 3-89720-413-4. [Google Scholar]
- Hatscher, A. Abschätzung der zyklischen Kennwerte von Stählen; Papierflieger: Clausthal, Germany, 2004; ISBN 3-89720-719-2. [Google Scholar]
- Dannbqauer, H.; Gaier, C. Integrating the Results from Process Simulation into Fatigue Life Prediction; Technical Report; SAE Technical Paper: Warrendale, PE, USA, 2007. [Google Scholar]
- Gaier, C.; Kose, K.; Hebisch, H.; Pramhas, G. Coupling Forming Simulation and Fatigue Life Prediction of Vehicle Components; MAGNASTEYR, Engineering Center Steyr: Valentin, Austria, 2004; pp. 65–68. [Google Scholar]
- Le, Q.; Kang, H.; Kridli, G.; Khosrovaneh, A.; Yan, B. Modified strain-life equation to consider the effect of different prestrain paths for dual phase sheet steel. J. Mater. Process. Technol. 2009, 209, 3525–3531. [Google Scholar] [CrossRef]
- Merten, M.; Liebold, K.; Haufe, A. Robustness analysis with LS-OPT® and LS-DYNA® for sheet metal forming simulations. IOP Conf. Ser. Mater. Sci. Eng. 2021, 1157, 012088. [Google Scholar] [CrossRef]
- Facchinetti, M.L.; Weber, B.; Doudard, C.; Calloch, S. Coupling of forming process and fatigue design computations: A local approach. Adv. Eng. Mater. 2009, 11, 736–741. [Google Scholar] [CrossRef]
- To, C.W.S.; Liu, M.L. Hybrid strain based three-node flat triangular shell elements. Finite Elem. Anal. Des. 1994, 17, 169–203. [Google Scholar] [CrossRef]
- Farahani, M.K.; Shirin, M.B.; Assempour, A. Development of an inverse finite element method with an initial guess of linear unfolding. Finite Elem. Anal. Des. 2014, 79, 1–8. [Google Scholar] [CrossRef]
- Yu, M.; Du, R. Sensitivity Analysis of the Sheet Metal Stamping Processes Based on Inverse Finite Element Modeling and Monte Carlo Simulation. AIP Conf. Proc. 2005, 778, 813–818. [Google Scholar] [CrossRef]
- Guo, Y.Q.; Batoz, J.L.; Naceur, H.; Bouabdallah, S.; Mercier, F.; Barlet, O. Recent developments on the analysis and optimum design of sheet metal forming parts using a simplified inverse approach. Comput. Struct. 2000, 78, 133–148. [Google Scholar] [CrossRef]
- Kašpar, J.; Švagr, M.; Bernardin, P.; Lašová, V.; Šedivý, O. Dimension reduction using the inverse stamping method. MM Sci. J. 2021, 4, 4810–4817. [Google Scholar] [CrossRef]
- Lan, J.; Dong, X.; Li, Z. Inverse finite element approach and its application in sheet metal forming. J. Mater. Process. Technol. 2005, 170, 624–631. [Google Scholar] [CrossRef]
- Muhammad, A.A.; Qattawi, A. numerical simulation of sheet metal forming: A review. Int. J. Adv. Manuf. Technol. 2017, 89, 1235–1250. [Google Scholar] [CrossRef]
- Lee, C.H.; Huh, H. Blank Design and Strain Prediction of Automobile Stamping Parts by an Inverse Finite Element Approach. J. Mater. Process. Technol. 1997, 63, 645–650. [Google Scholar] [CrossRef]
- Shamloofard, M.; Assempour, A. Development of an inverse isogeometric methodology and its application in sheet metal forming process. Appl. Math. Model. 2019, 73, 266–284. [Google Scholar] [CrossRef]
- Shamloofard, M.; Assempour, A. Simulation of sheet metal forming processes by presenting a bending-dependent inverse isogeometric methodology. Int. J. Adv. Manuf. Technol. 2021, 112, 1389–1408. [Google Scholar] [CrossRef]
- Tóth, T.; Živčák, J. A Comparison of the Output of 3D Scanners. Procedia Eng. 2014, 69, 393–401. [Google Scholar] [CrossRef]
- Krawczyk, J.; Bembenek, M.; Frocisz, Ł.; Śleboda, T.; Paćko, M. The Effect of Sandblasting on Properties and Structures of the DC03/1.0347, DC04/1.0338, DC05/1.0312, and DD14/1.0389 Steels for Deep Drawing. Materials 2021, 14, 3540. [Google Scholar] [CrossRef]
- Fratesi, R.; Roventi, G. Corrosion resistance of Zn-Ni alloy coatings in industrial production. Surf. Coat. Technol. 1996, 82, 158–164. [Google Scholar] [CrossRef]
- Azizi, R.; Assempour, A. Applications of linear inverse finite element method in prediction of the optimum blank in sheet metal forming. Mater. Des. 2008, 29, 1965–1972. [Google Scholar] [CrossRef]
- Kašpar, J.; Bernardin, P.; Lašová, V. Increasing the robustness of an inverse stamping algorithm. MM Sci. J. 2022, 5684–5688. [Google Scholar] [CrossRef]
- Kašpar, J. Výzkum Simulačních Technik Určených k Navrhování za Studena Lisovaných Komponentů s Ohledem na Jejich Únavovou Životnost. Ph.D. Theses, University of West Bohemia, Pilsen, Czech Republic, 2023. [Google Scholar]
- Růžička, M.; Hanke, M.; Rost, M. Dynamická pevnost a životnost; Ediční středisko ČVUT: Prague, Czech Republic, 1987; pp. 16–17. [Google Scholar]
- Hu, J.; Marciniak, Z.; Duncan, J. Mechanics of Sheet Metal Forming; Elsevier Science: Boston, MA, USA, 2002; p. 9. [Google Scholar]
- Ghennai, W.; Boussaid, O.; Bendjama, H.; Haddag, B.; Nouari, M. Experimental and numerical study of DC04 sheet metal behaviour—Plastic anisotropy identification and application to deep drawing. Int. J. Adv. Manuf. Technol. 2019, 100, 361–371. [Google Scholar] [CrossRef]
- Kašpar, J.; Bernardin, P.; Lašová, V. The Fague of Highly Formed Bodies. MM Sci. J. 2023, 2023, 6616–6623. [Google Scholar] [CrossRef]
- Klemenc, J. Influence of fatigue–life data modelling on the estimated reliability of a structure subjected to a constant-amplitude loading. Reliab. Eng. Syst. Saf. 2015, 142, 238–247. [Google Scholar] [CrossRef]
- Voorwald, H.J.C.; Miguel, I.M.; Peres, M.P.; Cioffi, M.O.H. Effect of Electroplated Zinc-Nickel Alloy Coatings on the Fatigue Strength of AlSl 4340 High-Strength Steel. J. Mater. Eng. Perform. 2005, 14, 249–257. [Google Scholar] [CrossRef]
- Nguyen, V.P.; Dang, T.N.; Le, C.C.; Wang, D.-A. Effect of Coating Thickness on Fatigue Behavior of AISI 1045 Steel with HVOF Thermal Spray and Hard Chrome Electroplating. J. Therm. Spray Technol. 2020, 29, 1968–1981. [Google Scholar] [CrossRef]
- Forschungskuratorium Maschinenbau (FKM). Rechnerischer Festigkeitsnachweis für Maschinenbauteile, 5th extended ed.; VDMA Verlag: Frankfurt am Main, Germany, 2003; p. 5. [Google Scholar]
- Meng, J.; Zhu, P.; Liu, Z.; Ji, Q. Integration of multi-step stamping effects in the bending fatigue analysis of a steel wheel. Fatigue Fract. Eng. Mater. Struct. 2013, 36, 795–808. [Google Scholar] [CrossRef]
- Jakubec, M. Anisotropy Influence on Sheet Metal Part Fatigue Life. Master’s Theses, Czech Technical University in Prague, Faculty of Mechanical Engineering, Prague, Czech Republic, 2022. [Google Scholar]


Disclaimer/Publisher’s Note: The statements, opinions and data contained in all publications are solely those of the individual author(s) and contributor(s) and not of MDPI and/or the editor(s). MDPI and/or the editor(s) disclaim responsibility for any injury to people or property resulting from any ideas, methods, instructions or products referred to in the content. |
© 2023 by the authors. Licensee MDPI, Basel, Switzerland. This article is an open access article distributed under the terms and conditions of the Creative Commons Attribution (CC BY) license (https://creativecommons.org/licenses/by/4.0/).