

Experimental Study on the Thermal Stability of Aluminum Alloy 7075-T651 Structural Parts after Rolling Correction
 ,
,
Abstract
:1. Introduction
2. Materials and Methods
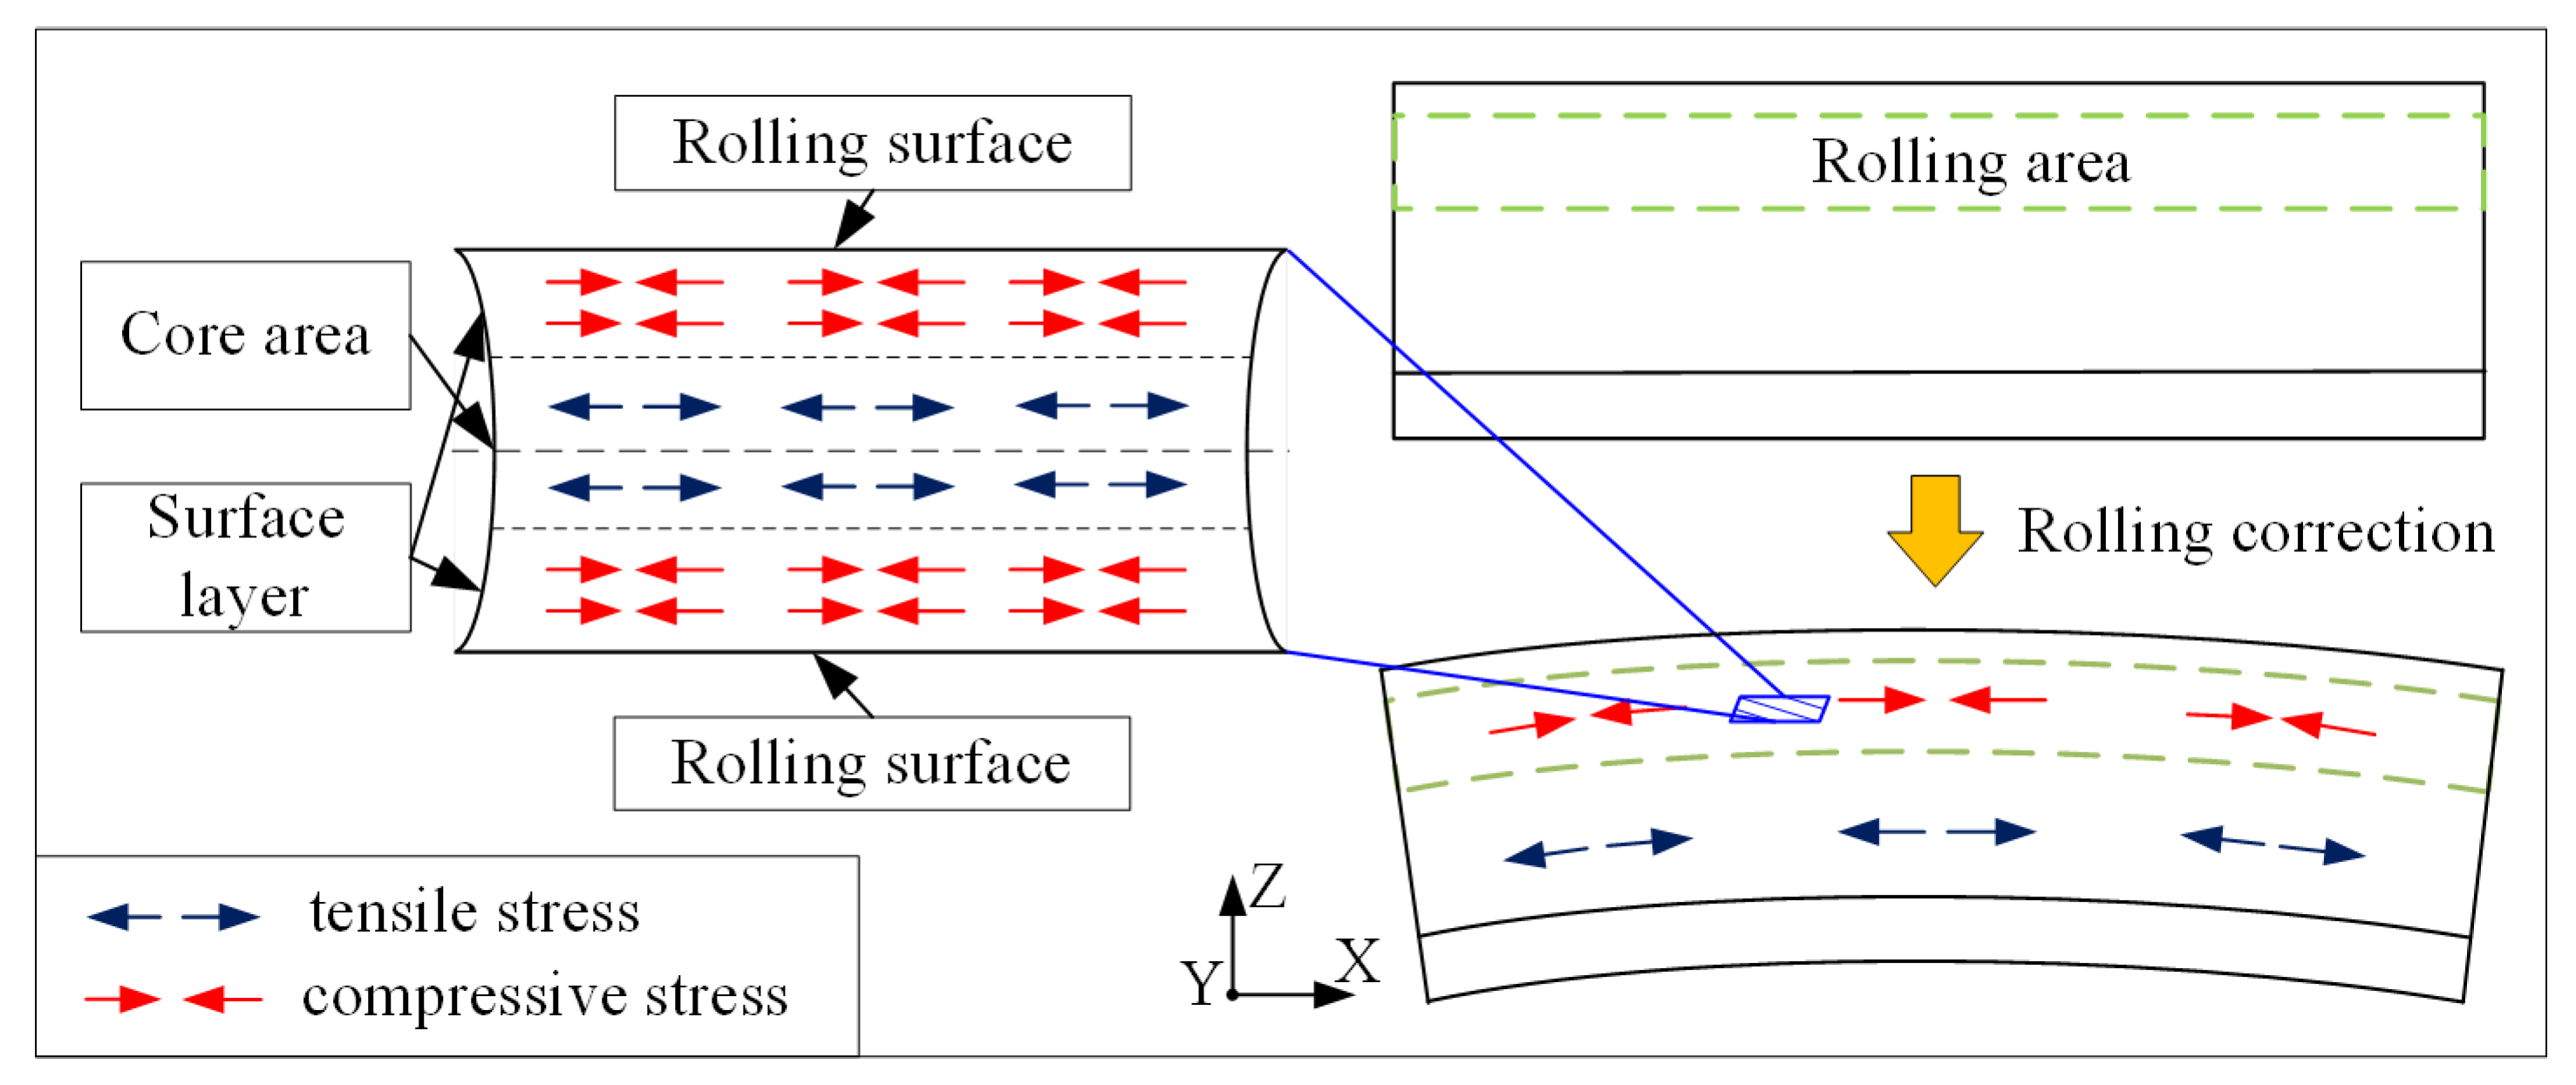
2.1. Materials and Rolling Correction Process
2.2. Thermal Load Treatment
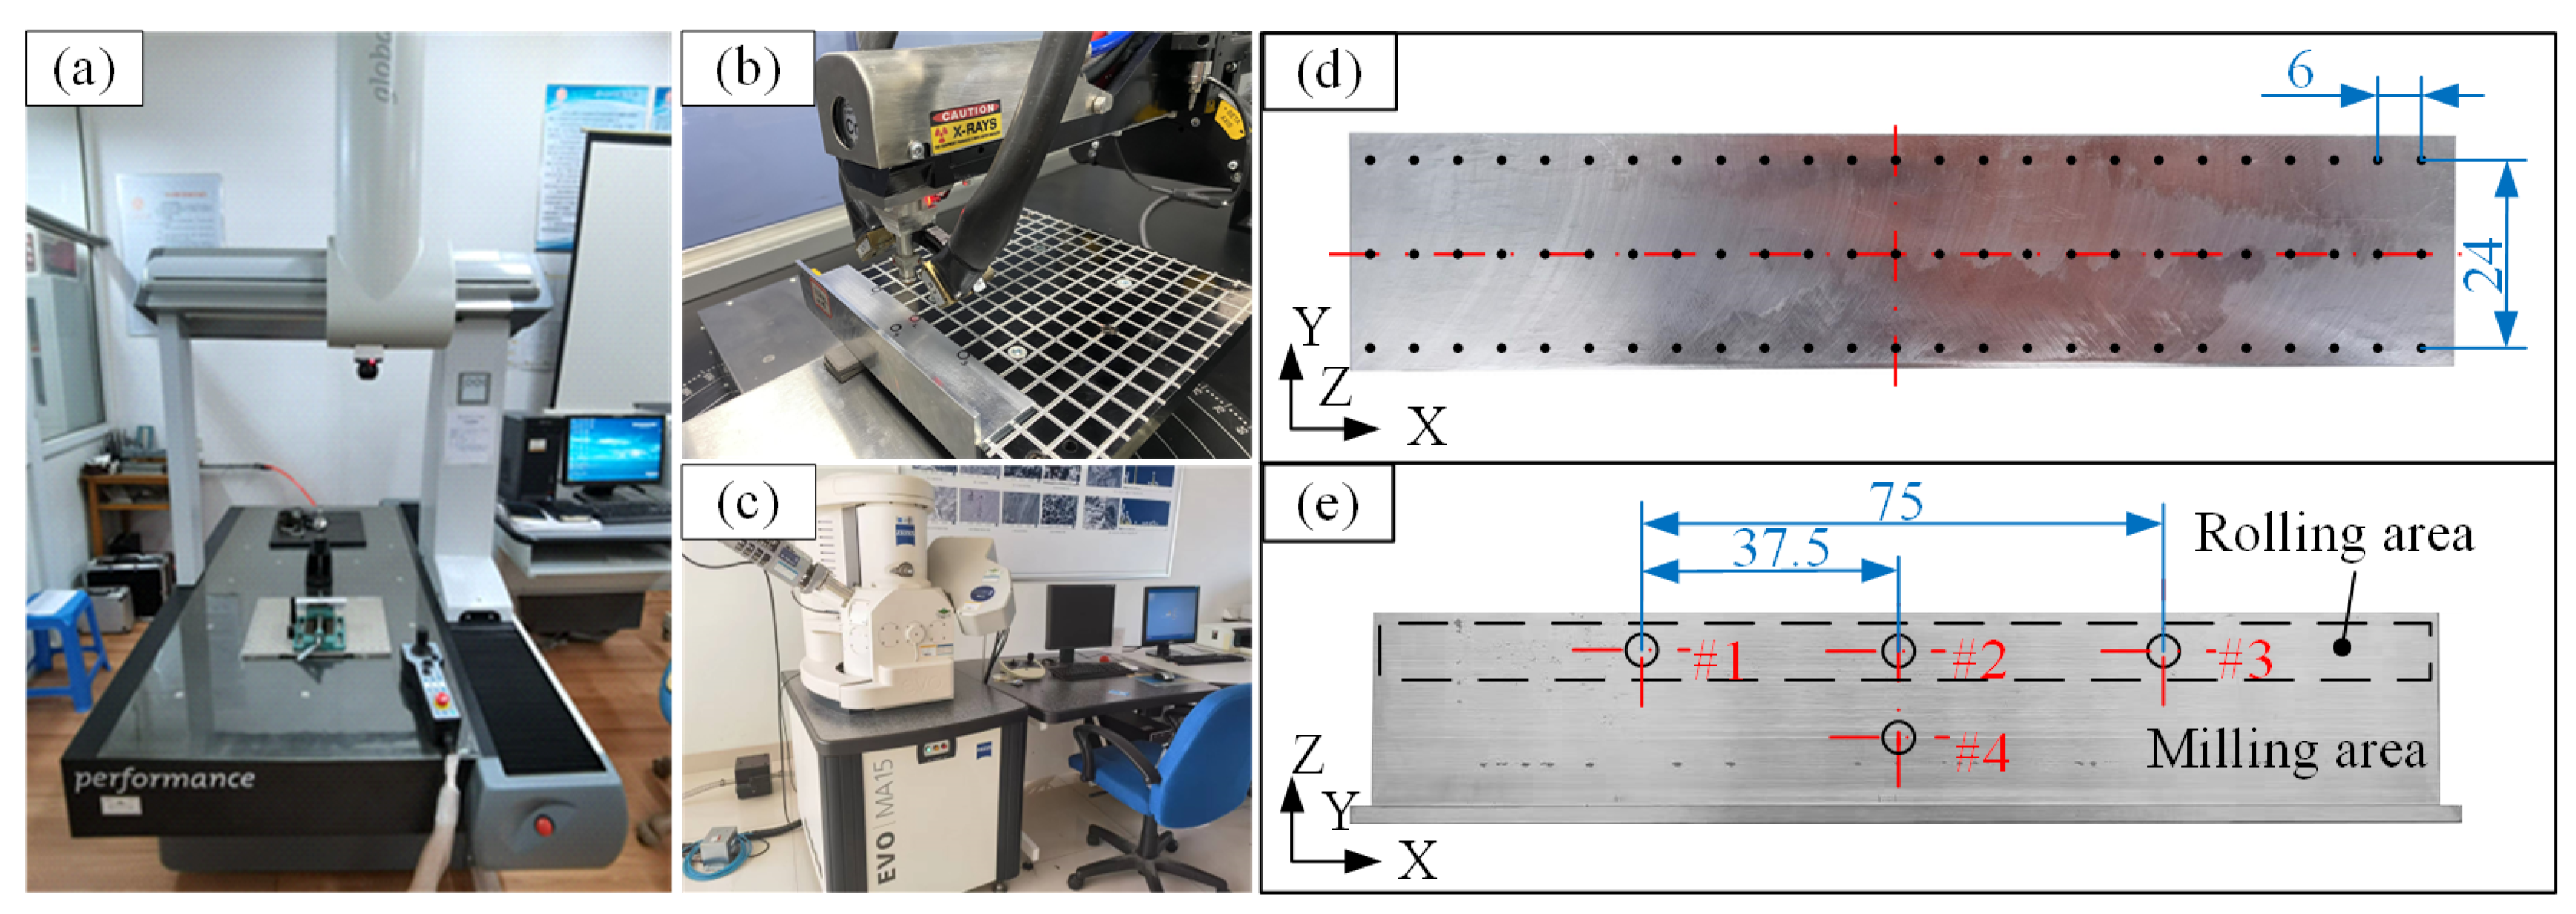
2.3. Sample Test Process
3. Results
3.1. Part Distortion
3.2. Residual Stress
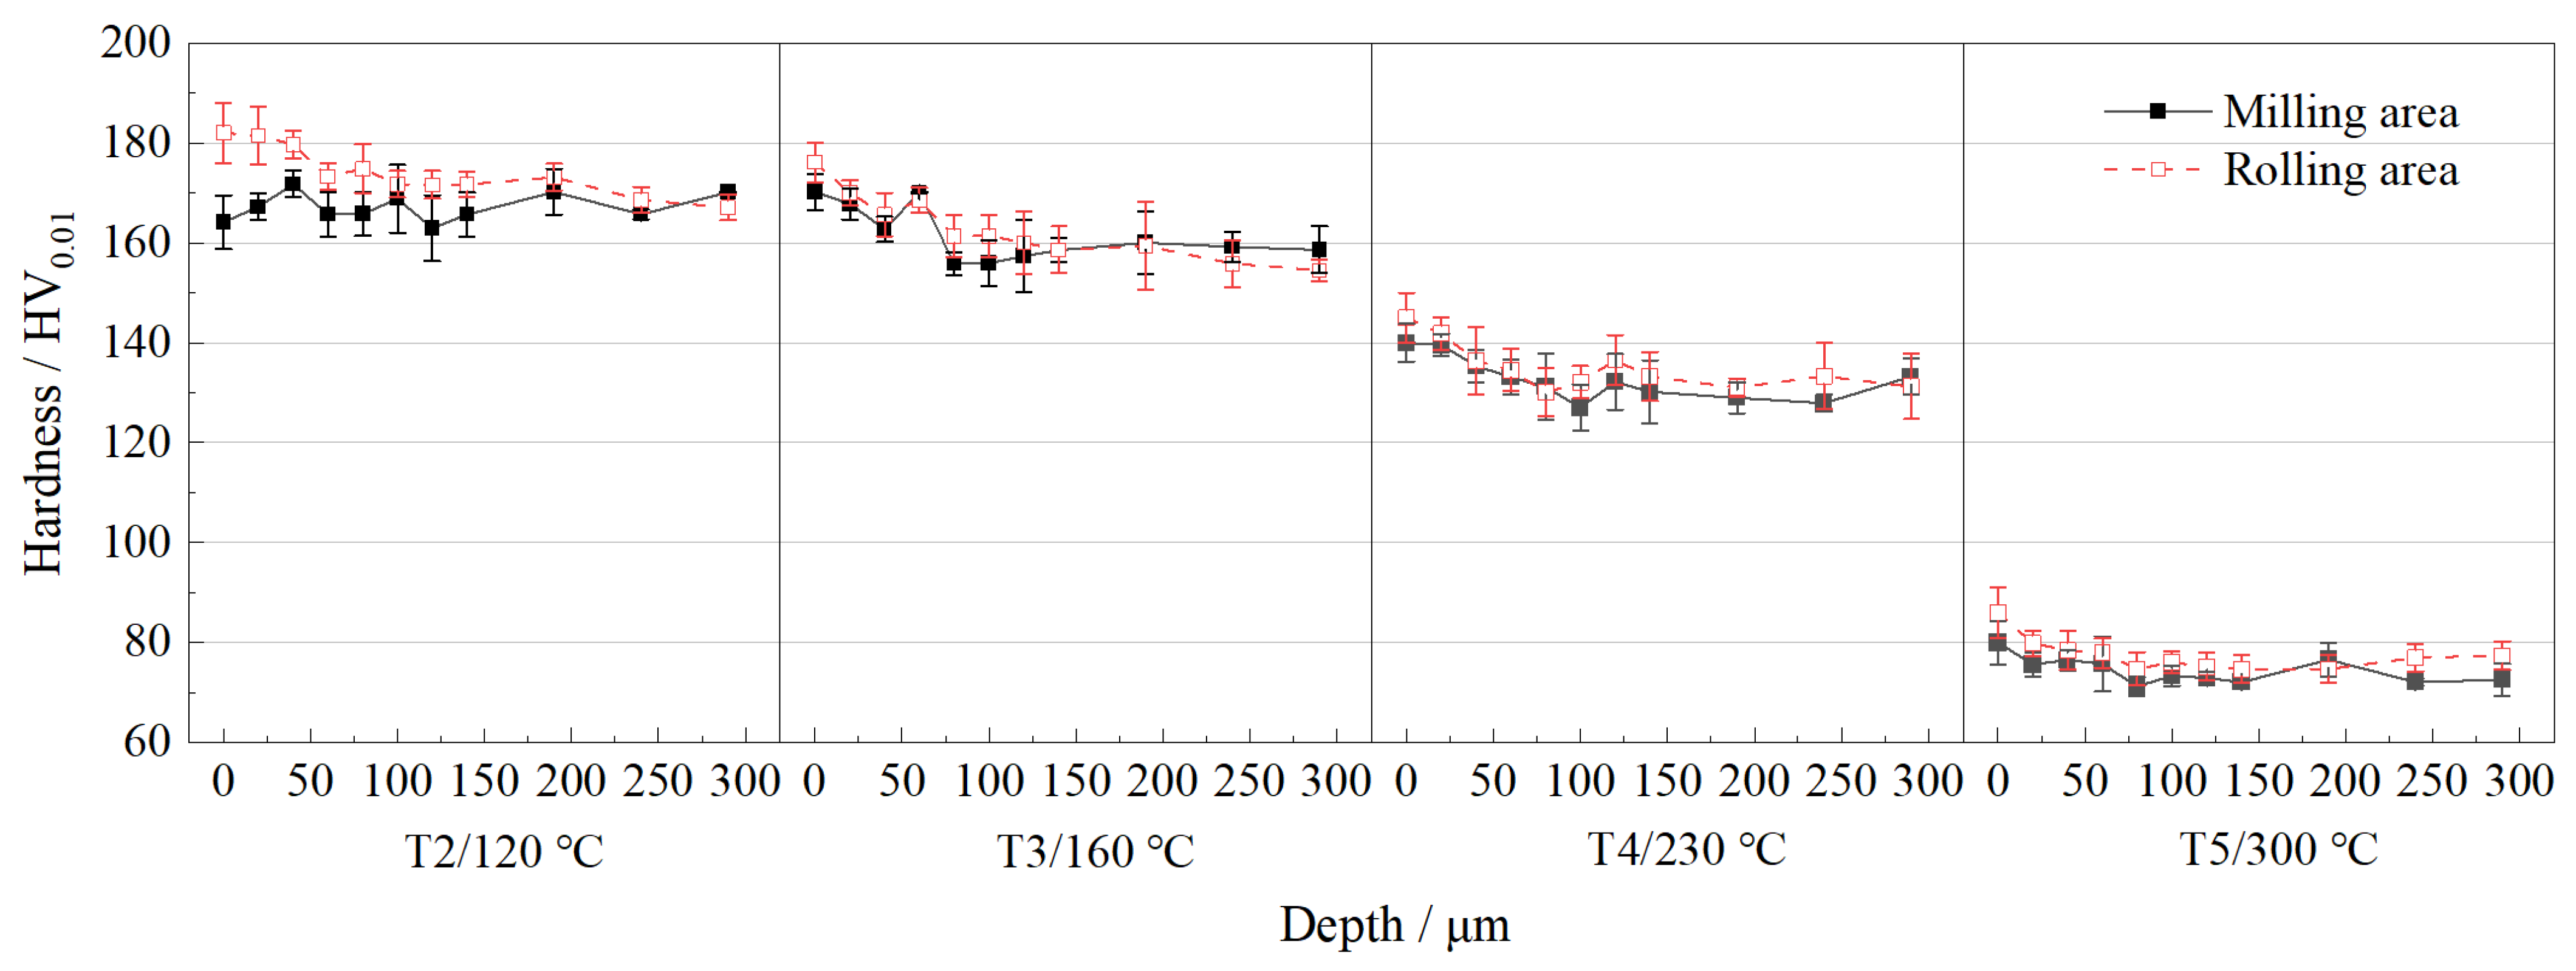
3.3. Microhardness
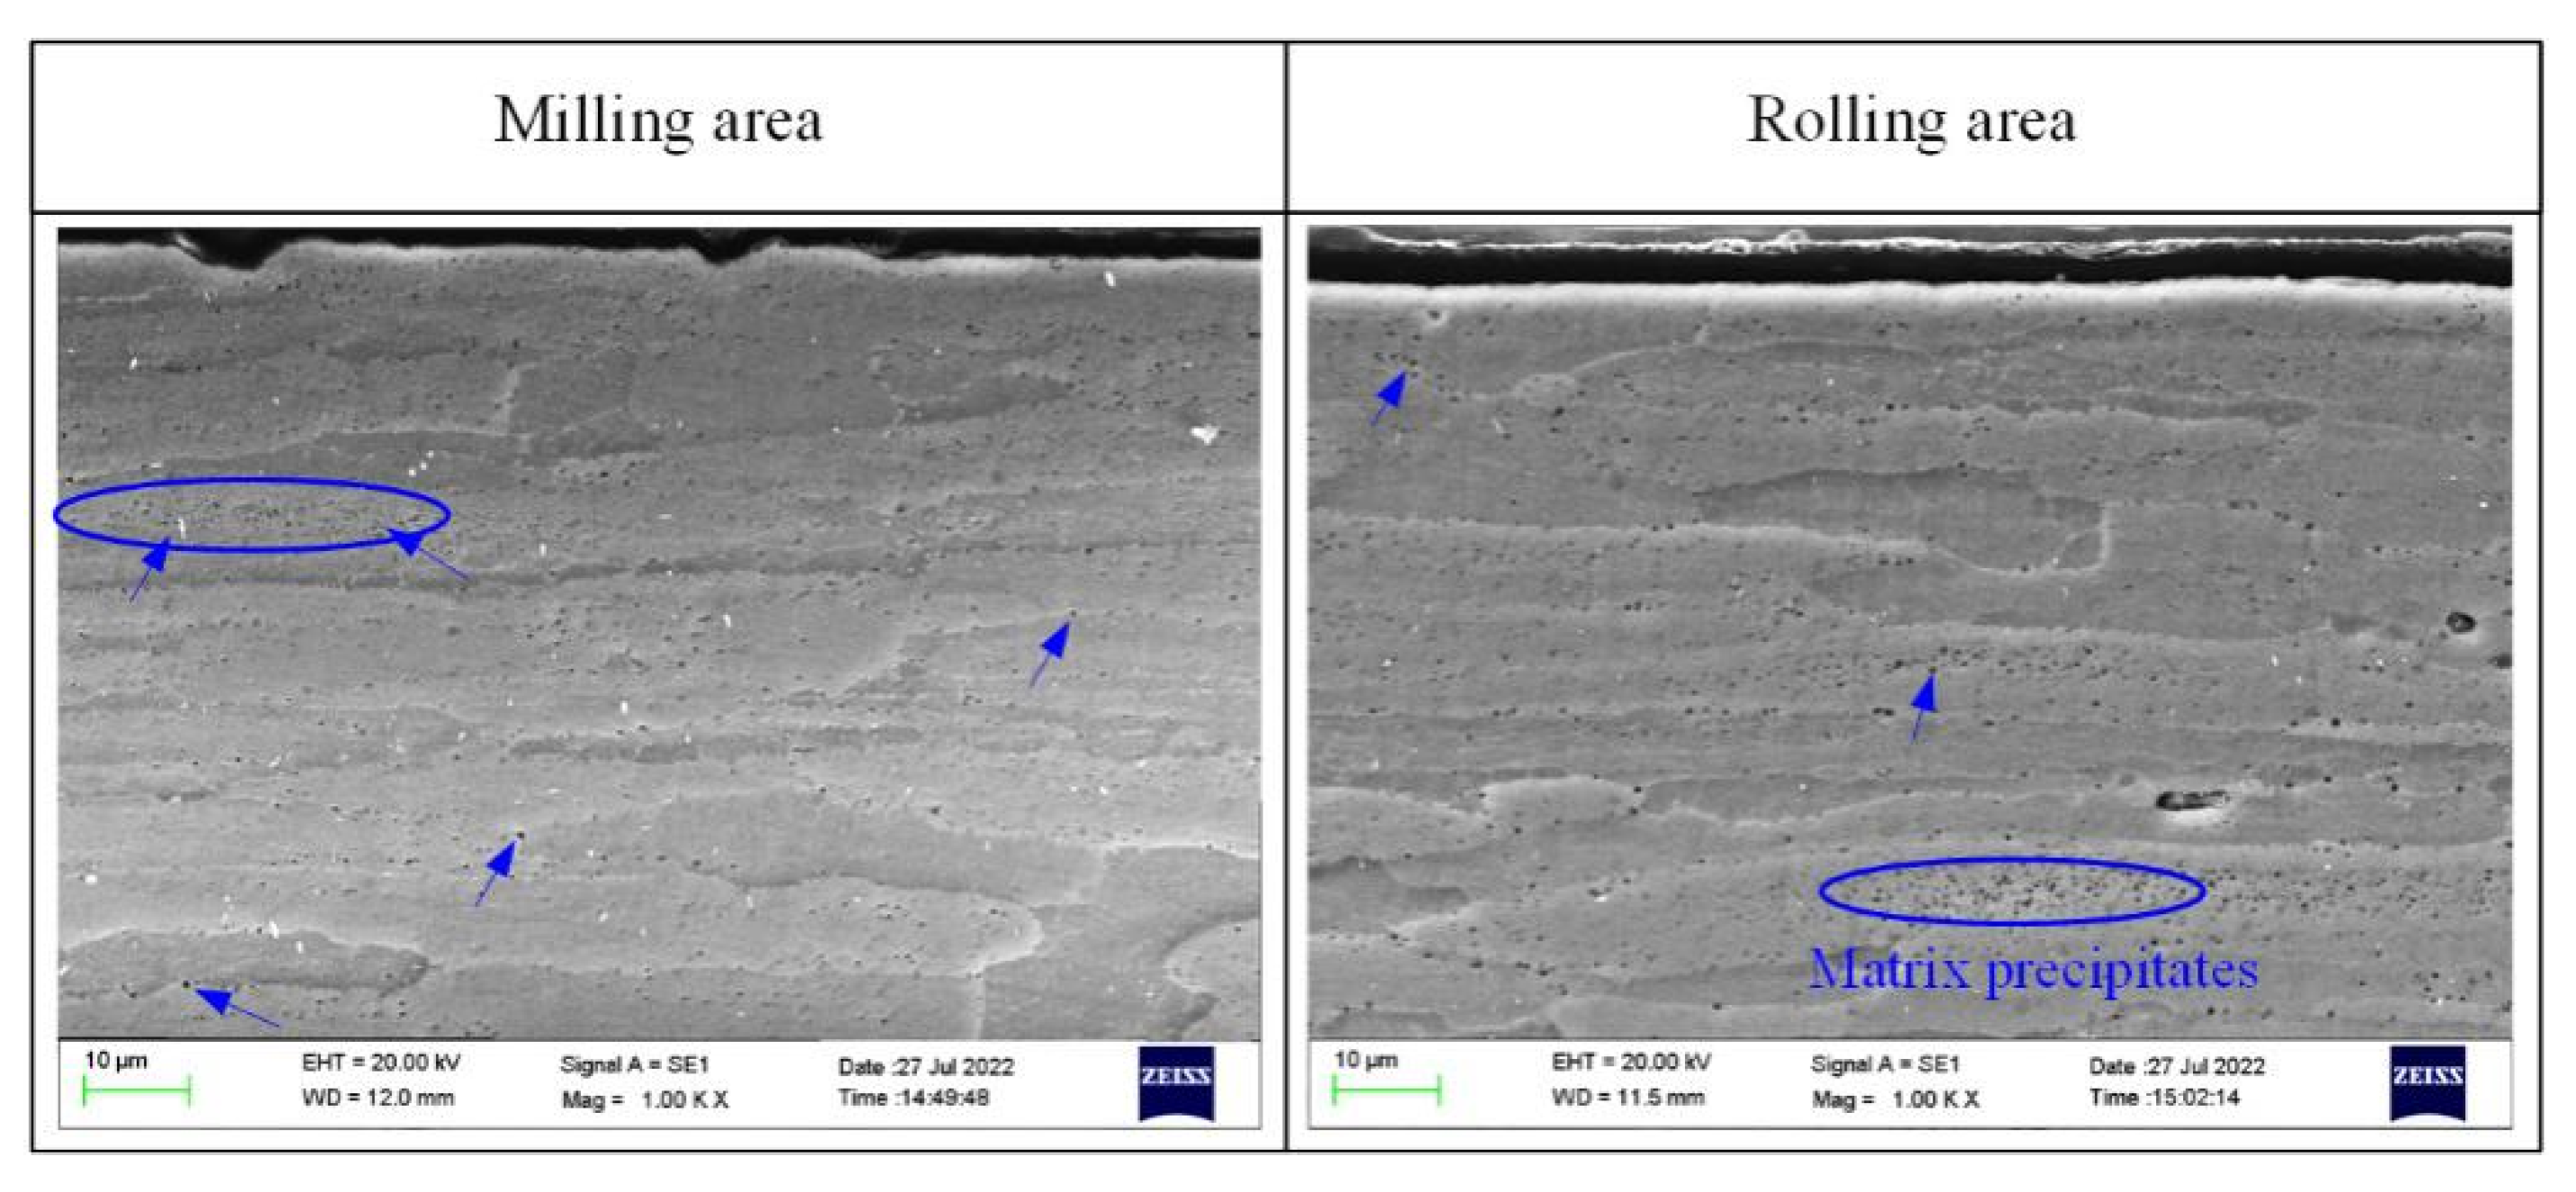
3.4. Microstructure
4. Discussion
5. Conclusions
- (1)
- Compared to after rolling correction, the distortions of the samples were 0.011 mm, 0.002 mm, 0.010 mm and 0.008 mm after 120 °C, 160 °C, 230 °C and 300 °C thermal load treatments, respectively, and the changes were only 10.48%. 2.74%, 8.13%, and 8.70%, which indicated that the macroscopic dimensions of the rolling-corrected structural parts had good thermal stability under different thermal loads.
- (2)
- Compared to after rolling correction, the residual stresses in the rolling area of the samples gradually decreased with increasing thermal load, and the average residual compressive stresses decreased by 35.58%, 26.08%, 75.97%, and 83.13% after 120 °C, 160 °C, 230 °C, and 300 °C treatments, respectively; the microhardness also showed a decreasing trend, with no significant change in hardness after treatment at 120 °C, but the hardness values of samples treated at 160 °C, 230 °C and 300 °C decreased by approximately 5%, 23% and 56%, respectively.
- (3)
- The precipitates appeared in a process of growth, transformation, and resolvate with increasing thermal load. There were many matrix precipitates in the sample after 120 °C treatment. After 160 °C treatment, the matrix precipitates distributed in clusters gradually dissolved and disappeared. After 230 °C treatment, many coarse precipitates were dispersed at the original grain boundary position. After 300 °C treatment, only some undissolved compounds remained in the matrix.
- (4)
- Under low thermal loads of 120 °C and 160 °C, the reduction in residual stress was mainly caused by static recovery. With increasing processing temperature, the reduction in residual stress was mainly affected by static recrystallization. Due to the combined influence of changes in precipitates, dislocation density, grain size, etc., the small local deformation caused by thermal load treatment did not have a significant impact on the macroscopic distortion of the sample.
Author Contributions
Funding
Data Availability Statement
Acknowledgments
Conflicts of Interest
References
- Zhang, R.X.; Chiang, R.; Ren, Z.C.; Zhang, H.; Zhao, W.D.; Wang, G.X.; Vasudevan, V.K.; Dong, Y.L.; Ye, C. Fatigue Performance Improvement of 7075-T651 Aluminum Alloy by Ultrasonic Nanocrystal Surface Modification. J. Mater. Eng. Perform. 2022, 31, 2354–2363. [Google Scholar] [CrossRef]
- Liu, W.M.; He, W.H.; Liu, L.; Li, J.; Pan, H.J.; Zhang, W.; Wang, Z.J. Microstructure and Tribological Properties of 7075-T651 Aluminum Alloy Affected by N-Ion Implantation. J. Mater. Eng. Perform. 2022, 2022, 1–9. [Google Scholar] [CrossRef]
- ZawadaMichałowska, M.; Pieśko, P.; Józwik, J.; Legutko, S.; Kukiełka, L. A Comparison of the Geometrical Accuracy of Thin-Walled Elements Made of Different Aluminum Alloys. Materials 2021, 14, 7242. [Google Scholar] [CrossRef]
- Denkena, B.; Boehnke, D.; de León, L. Machining induced residual stress in structural aluminum parts. Prod. Eng. 2008, 2, 247–253. [Google Scholar] [CrossRef]
- Llanos, I.; Aurrekoetxea, M.; Agirre, A.; Lacalle, L.N.L.D.; Zelaieta, O. On-machine Characterization of Bulk Residual Stresses on Machining Blanks. Procedia CIRP 2019, 82, 406–410. [Google Scholar] [CrossRef]
- Weng, Z.J.; Liu, X.Z.; Gu, K.X.; Guo, J.; Cui, C.; Wang, J.J. Modification of residual stress and microstructure in aluminium alloy by cryogenic treatment. Mater. Sci. Technol. 2020, 36, 1547–1555. [Google Scholar] [CrossRef]
- Li, J.G.; Wang, S.Q. Distortion caused by residual stresses in machining aeronautical aluminum alloy parts: Recent advances. Int. J. Adv. Manuf. Technol. 2017, 89, 997–1012. [Google Scholar] [CrossRef]
- Zhang, Y.; Wang, W.H.; Greer, A.L. Making metallic glasses plastic by control of residual stress. Nat. Mater. 2006, 5, 857–860. [Google Scholar] [CrossRef]
- Lu, L.X.; Sun, J.; Han, X.; Xiong, Q.C. Study on the Surface Integrity of a Thin-Walled Aluminum Alloy Structure after a Bilateral Slid Rolling Process. Metals 2016, 6, 99. [Google Scholar] [CrossRef] [Green Version]
- Fu, L.L.; Wu, G.H.; Zhou, C.; Xiu, Z.Y.; Yang, W.S.; Qiao, J. Effect of Microstructure on the Dimensional Stability of Extruded Pure Aluminum. Materials 2021, 14, 4797. [Google Scholar] [CrossRef]
- Song, Y.F.; Du, W.; Zhao, L.Z.; Zeng, L.J.; Liu, W.H.; Chen, Y.Q.; Zhu, B.W.; Zhang, X.F.; Ding, X.F. The coupling influences and corresponding mechanisms of high efficiency thermal-magnetic treatments on the dimensional stability of Al-Cu-Mg alloy. J. Alloy. Compd. 2022, 928, 167187. [Google Scholar] [CrossRef]
- Song, Y.F.; Ding, X.F.; Xiao, L.R.; Liu, W.H.; Chen, Y.Q.; Zhao, X.J. The Effect of Ni Plating on the Residual Stress and Micro-Yield Strength in an Al-Cu-Mg Alloy Under Different Diffusion Treatments. JOM-US 2019, 71, 4370–4377. [Google Scholar] [CrossRef]
- Qiu, W.T.; Jiang, H.W.; Xiao, Z.; Pang, Y.; Sheng, X.F.; Li, Z. Effect of creep annealing on the dimensional stability of dispersion strengthened copper alloy. J. Alloy. Compd. 2021, 887, 161321. [Google Scholar] [CrossRef]
- Sun, L.; Chen, L.; Guo, Y.Y.; Zhao, G.Q. Experimental Study and Optimization on Solution and Artificial Aging of Cold-Rolled 2024 Al Alloy Sheet. J. Mater. Eng. Perform. 2022, 2022, 1–13. [Google Scholar] [CrossRef]
- Czerwinski, F. Thermal Stability of Aluminum Alloys. Materials 2020, 13, 3441. [Google Scholar] [CrossRef]
- Zhou, L.; Chen, K.H.; Chen, S.Y.; Zhang, X.L.; Fan, S.M.; Huang, L.P. Comparison of hardenability and over-aging precipitation behaviour of three 7xxx aluminium alloys. Mater. Sci. Technol. 2019, 35, 637–644. [Google Scholar] [CrossRef]
- Wen, K.; Xiong, B.Q.; Zhang, Y.A.; Li, X.W.; Li, Z.H.; Yan, L.Z.; Yan, H.W.; Liu, H.W. Aging precipitation characteristics and tensile properties of Al–Zn–Mg–Cu alloys with different additional Zn contents. Rare Met. 2021, 40, 2160–2166. [Google Scholar] [CrossRef]
- Jung, C.Y.; Lee, J.H. Crack closure and flexural tensile capacity with SMA fibers randomlyembedded on tensile side of mortar beams. Nanotechnol. Rev. 2020, 9, 354–366. [Google Scholar] [CrossRef]
- Zaroog, O.S.; Ali, A.; Sahari, B.B.; Zahari, R. Modeling of residual stress relaxation of fatigue in 2024-T351 aluminium alloy. Int. J. Fatigue 2011, 33, 279–285. [Google Scholar] [CrossRef]
- Zheng, J.H.; Lin, J.G.; Lee, J.; Pan, R.; Li, C.; Davies, C.M. A novel constitutive model for multi-step stress relaxation ageing of a pre-strained 7xxx series alloy. Int. J. Plast. 2018, 106, 31–47. [Google Scholar] [CrossRef]
- Petre, M.; Dinu, C.; Drăghici, N.C.; Andrei, V. Prediction of the residual stress after quenching of 6061 aluminium alloy plates by using mathematical modelling. ITM Web Conf. 2020, 34, 02007. [Google Scholar] [CrossRef]
- LI, N.K.; Ling, G.; Nie, B.; Zhou, J.; Li, F.T. Aluminum Alloy Material and Its Heat Treatment Technology; Metallurgical Industry Press: Beijing, China, 2012; pp. 270–291. [Google Scholar]
- Wang, Z.T. Heat Treatment Process of Wrought Aluminum Alloy; Central South University Press: Changsha, China, 2011; pp. 302–313. [Google Scholar]
- Kim, W.; Raman, S. On the selection of flatness measurement points in coordinate measuring machine inspection. Int. J. Mach. Tools Manuf. 2000, 40, 427–443. [Google Scholar] [CrossRef]
- He, Z.R.; Shen, Y.Z.; Tao, J.; Chen, H.F.; Zeng, X.F.; Huang, X.; El-Aty, A.A. Laser shock peening regulating aluminum alloy surface residual stresses for enhancing the mechanical properties: Roles of shock number and energy. Surf. Coat. Technol. 2021, 421, 127481. [Google Scholar] [CrossRef]
- Duncheva, G.V.; Maximov, J.T.; Dunchev, V.P.; Anchev, A.P.; Atanasov, T.P.; Capek, J. Single toroidal roller burnishing of 2024-T3 Al alloy implemented as mixed burnishing process. Int. J. Adv. Manuf. Technol. 2020, 111, 3559–3570. [Google Scholar] [CrossRef]
- Lu, L.X.; Sun, J.; Li, L.; Xiong, Q.C. Study on surface characteristics of 7050-T7451 aluminum alloy by ultrasonic surface rolling process. Int. J. Adv. Manuf. Technol. 2016, 87, 2533–2539. [Google Scholar] [CrossRef]
- Zhao, J.G.; Liu, Z.Y.; Bai, S.; Zeng, D.P.; Luo, L.; Wang, J. Effects of natural aging on the formation and strengthening effect of G.P. zones in a retrogression and re-aged Al–Zn–Mg–Cu alloy. J. Alloy. Compd. 2020, 829, 154469. [Google Scholar] [CrossRef]
- Li, S.; Dong, H.G.; Shi, L.; Wang, X.X.; Liu, Z.Y.; Shang Guan, L.J.; Tian, Y.S. The Effects of Heat Straightening Temperature on the Microstructure and Properties of 7N01 Aluminum Alloy. Materials 2019, 12, 2949. [Google Scholar] [CrossRef] [Green Version]
- Liu, J.Z.; Hu, R.; Zheng, J.L.; Zhang, Y.D.; Ding, Z.G.; Liu, W.; Zhu, Y.T.; Sha, G. Formation of solute nanostructures in an Al–Zn–Mg alloy during long-term natural aging. J. Alloy. Compd. 2020, 821, 153572. [Google Scholar] [CrossRef]
- Gai, P.T.; Huang, X.; Zeng, Y.S.; Wang, M.T. Research on Microstructure and Properties of Aged 7050T451 Aluminum Alloy. Metall. Mater. Trans. 2014, 45, 419–426. [Google Scholar] [CrossRef]
- Wolfstieg, U.; Macherauch, E. 1.1 Zur Definition von Eigenspannungen. HTM J. Heat Treat. Mater. 1976, 31, 2–3. [Google Scholar] [CrossRef]
- Rashed, H.M.M.A. Control of Distortion in Aluminium Heat Treatment. Fundamentals of Aluminium Metallurgy; Lumley, R.N., Ed.; Woodhead Publishing: Dhaka, Bangladesh, 2018; pp. 495–524. [Google Scholar]
- Wei, L.J.; Wang, D.W.; Li, H.S.; Xie, D.; Ye, F.; Song, R.K.; Zheng, G.; Wu, S.J. Effects of Cryogenic Treatment on the Microstructure and Residual Stress of 7075 Aluminum Alloy. Metals 2018, 8, 273. [Google Scholar] [CrossRef] [Green Version]
- Dong, Y.B.; Shao, W.Z.; Jiang, J.T.; Zhang, B.Y.; Zhen, L. Minimization of Residual Stress in an Al-Cu Alloy Forged Plate by Different Heat Treatments. J. Mater. Eng. Perform. 2015, 24, 2256–2265. [Google Scholar] [CrossRef]
- Szpunar, J.A.; Narayanan, R.; Li, H. Computer Model of Recrystallization Texture in Aluminum Alloys. J. Mater. Eng. Perform. 2007, 22, 928–933. [Google Scholar] [CrossRef]
- Chen, J.F.; Jiang, J.T.; Zhen, L.; Shao, W.Z. Stress relaxation behavior of an Al–Zn–Mg–Cu alloy in simulated age-forming process. J. Mater. Process. Technol. 2013, 214, 775–783. [Google Scholar] [CrossRef]
- Sun, Y.S.; Jiang, F.L.; Zhang, H.; Su, J.; Yuan, W.H. Residual stress relief in Al–Zn–Mg–Cu alloy by a new multistage interrupted artificial aging treatment. Mater. Des. 2016, 92, 281–287. [Google Scholar] [CrossRef]
- Cao, Y.F.; Jiang, L.T.; Gong, D.; Chen, G.Q.; Xiu, Z.Y.; Cheng, Y.M.; Wang, X.F.; Wu, G.H. Quantitative study of dimensional stability mechanism and microstructure evolution during precipitation process of 2024Al alloy. J. Mater. Sci. Technol. 2021, 90, 85–94. [Google Scholar] [CrossRef]
- Park, J.K.; Ardell, A.J. Correlation between microstructure and calorimetric behavior of aluminum alloy 7075 and Al-Zn-Mg alloys in various tempers. Mater. Sci. Eng. A 1989, 114, 197–203. [Google Scholar] [CrossRef]
- Soyama, J.; Rios, C.T. Effect of Subcritical Annealing on the Microstructure and Mechanical Properties of a Precipitation-Hardened Al-Zn-Mg-Cu Alloy. J. Mater. Eng. Perform. 2021, 30, 1012–1021. [Google Scholar] [CrossRef]
- Kilic, S.; Kacar, I.; Sahin, M.; Ozturk, F.; Erdem, O. Effects of Aging Temperature, Time, and Pre-Strain on Mechanical Properties of AA7075. Mater. Res. 2019, 22, 1–13. [Google Scholar] [CrossRef]
- Panigrahi, S.K.; Jayaganthan, R. Effect of Annealing on Thermal Stability, Precipitate Evolution, and Mechanical Properties of Cryorolled Al 7075 Alloy. Metall. Mater. Trans. 2011, 42, 3208–3217. [Google Scholar] [CrossRef]
- Tajally, M.; Huda, Z.; Masjuki, H.H. Effect of deformation and recrystallization conditions on tensile behavior of aluminum alloy 7075. Met. Sci. Heat Treat. 2011, 53, 165–168. [Google Scholar] [CrossRef]


| Element | Zn | Mg | Cu | Fe | Si | Ti | Cr | Mn | Al |
|---|---|---|---|---|---|---|---|---|---|
| Wt (%) | 5.7 | 2.4 | 1.5 | 0.35 | 0.32 | 0.11 | 0.2 | 0.16 | Remainder |
| Sample Number | Heating Rate | Maximum Temperature | Soaking Time |
|---|---|---|---|
| T1 | Contrast sample | ||
| T2 | 10 °C/min | 120 °C | 1 h |
| T3 | 10 °C/min | 160 °C | 1 h |
| T4 | 10 °C/min | 230 °C | 1 h |
| T5 | 10 °C/min | 300 °C | 1 h |
Disclaimer/Publisher’s Note: The statements, opinions and data contained in all publications are solely those of the individual author(s) and contributor(s) and not of MDPI and/or the editor(s). MDPI and/or the editor(s) disclaim responsibility for any injury to people or property resulting from any ideas, methods, instructions or products referred to in the content. |
© 2023 by the authors. Licensee MDPI, Basel, Switzerland. This article is an open access article distributed under the terms and conditions of the Creative Commons Attribution (CC BY) license (https://creativecommons.org/licenses/by/4.0/).
Share and Cite
Lu, L.; Qin, M.; Jia, X.; Wang, Z.; Chen, Q.; Sun, J.; Jiao, S. Experimental Study on the Thermal Stability of Aluminum Alloy 7075-T651 Structural Parts after Rolling Correction. Metals 2023, 13, 213. https://doi.org/10.3390/met13020213
Lu L, Qin M, Jia X, Wang Z, Chen Q, Sun J, Jiao S. Experimental Study on the Thermal Stability of Aluminum Alloy 7075-T651 Structural Parts after Rolling Correction. Metals. 2023; 13(2):213. https://doi.org/10.3390/met13020213
Chicago/Turabian StyleLu, Laixiao, Meizhen Qin, Xiaodong Jia, Zhonglei Wang, Qingqiang Chen, Jie Sun, and Shourong Jiao. 2023. "Experimental Study on the Thermal Stability of Aluminum Alloy 7075-T651 Structural Parts after Rolling Correction" Metals 13, no. 2: 213. https://doi.org/10.3390/met13020213