
Influences of Second Phase Particle Precipitation, Coarsening, Growth or Dissolution on the Pinning Effects during Grain Coarsening Processes
Abstract
:1. Introduction
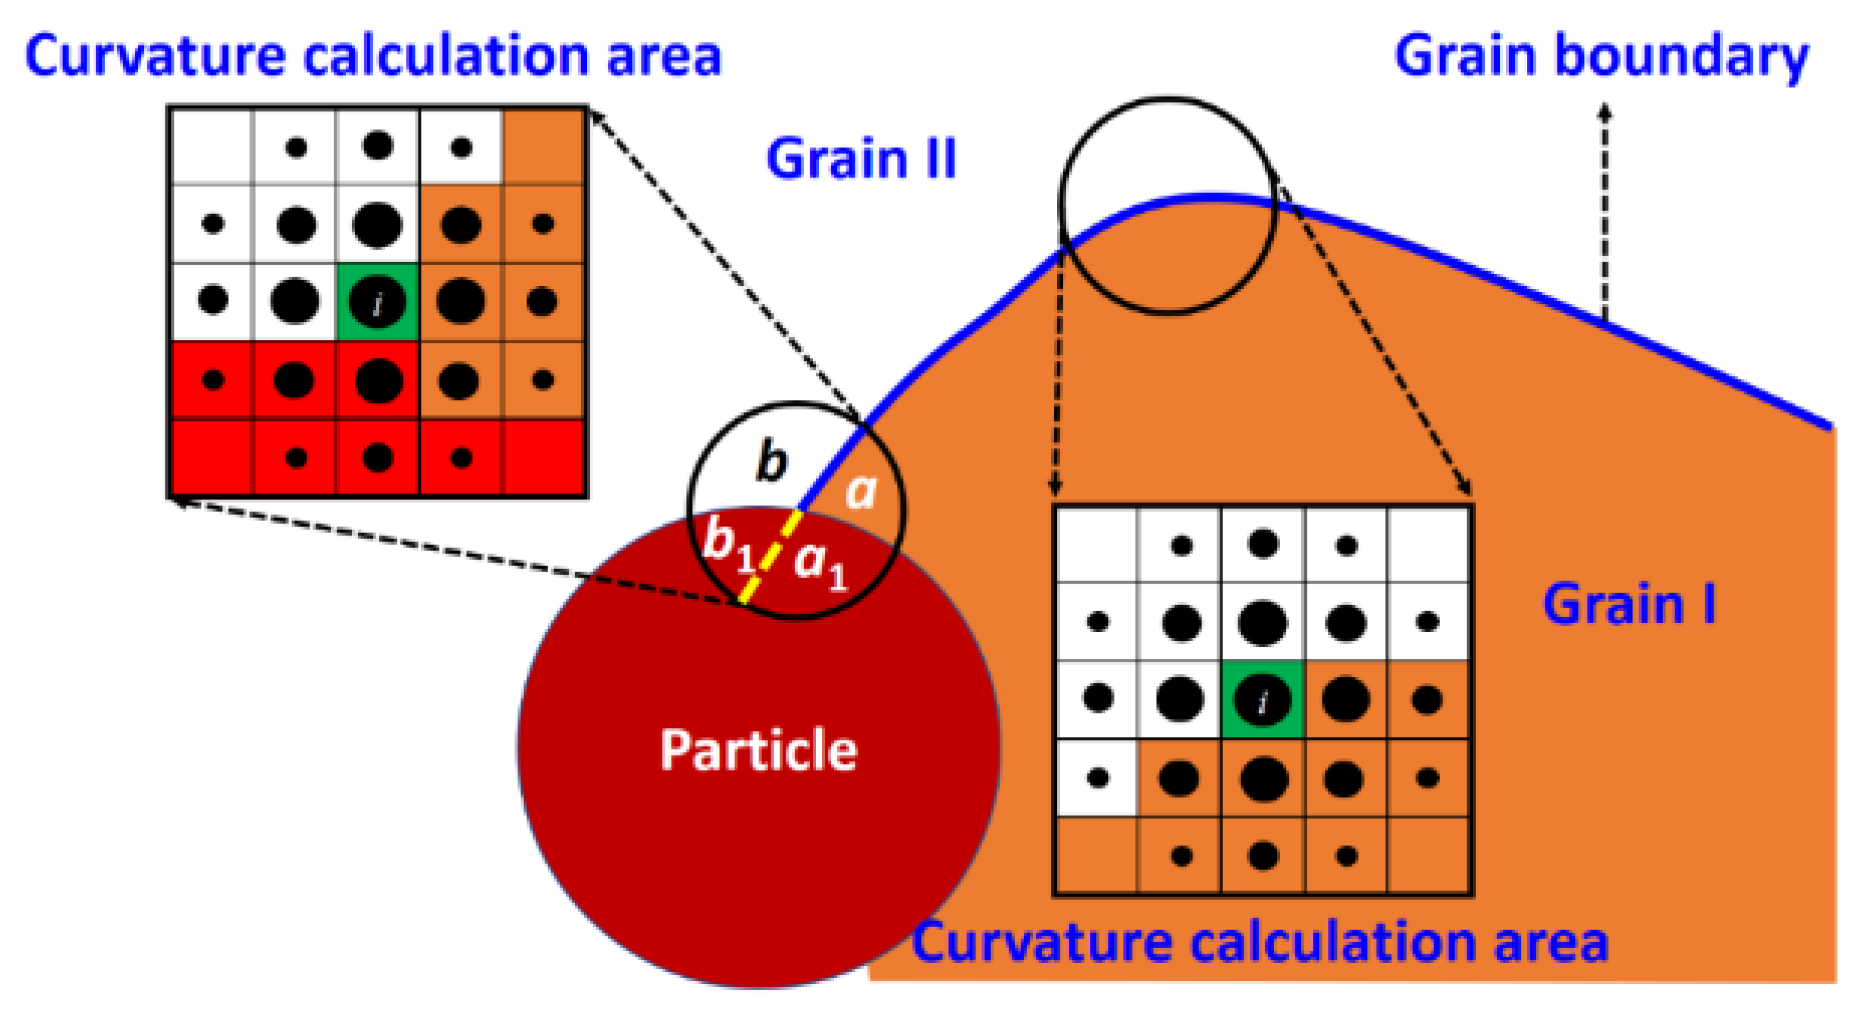
2. Models
3. Model Parameters and Simulation Conditions
4. Results and Discussion
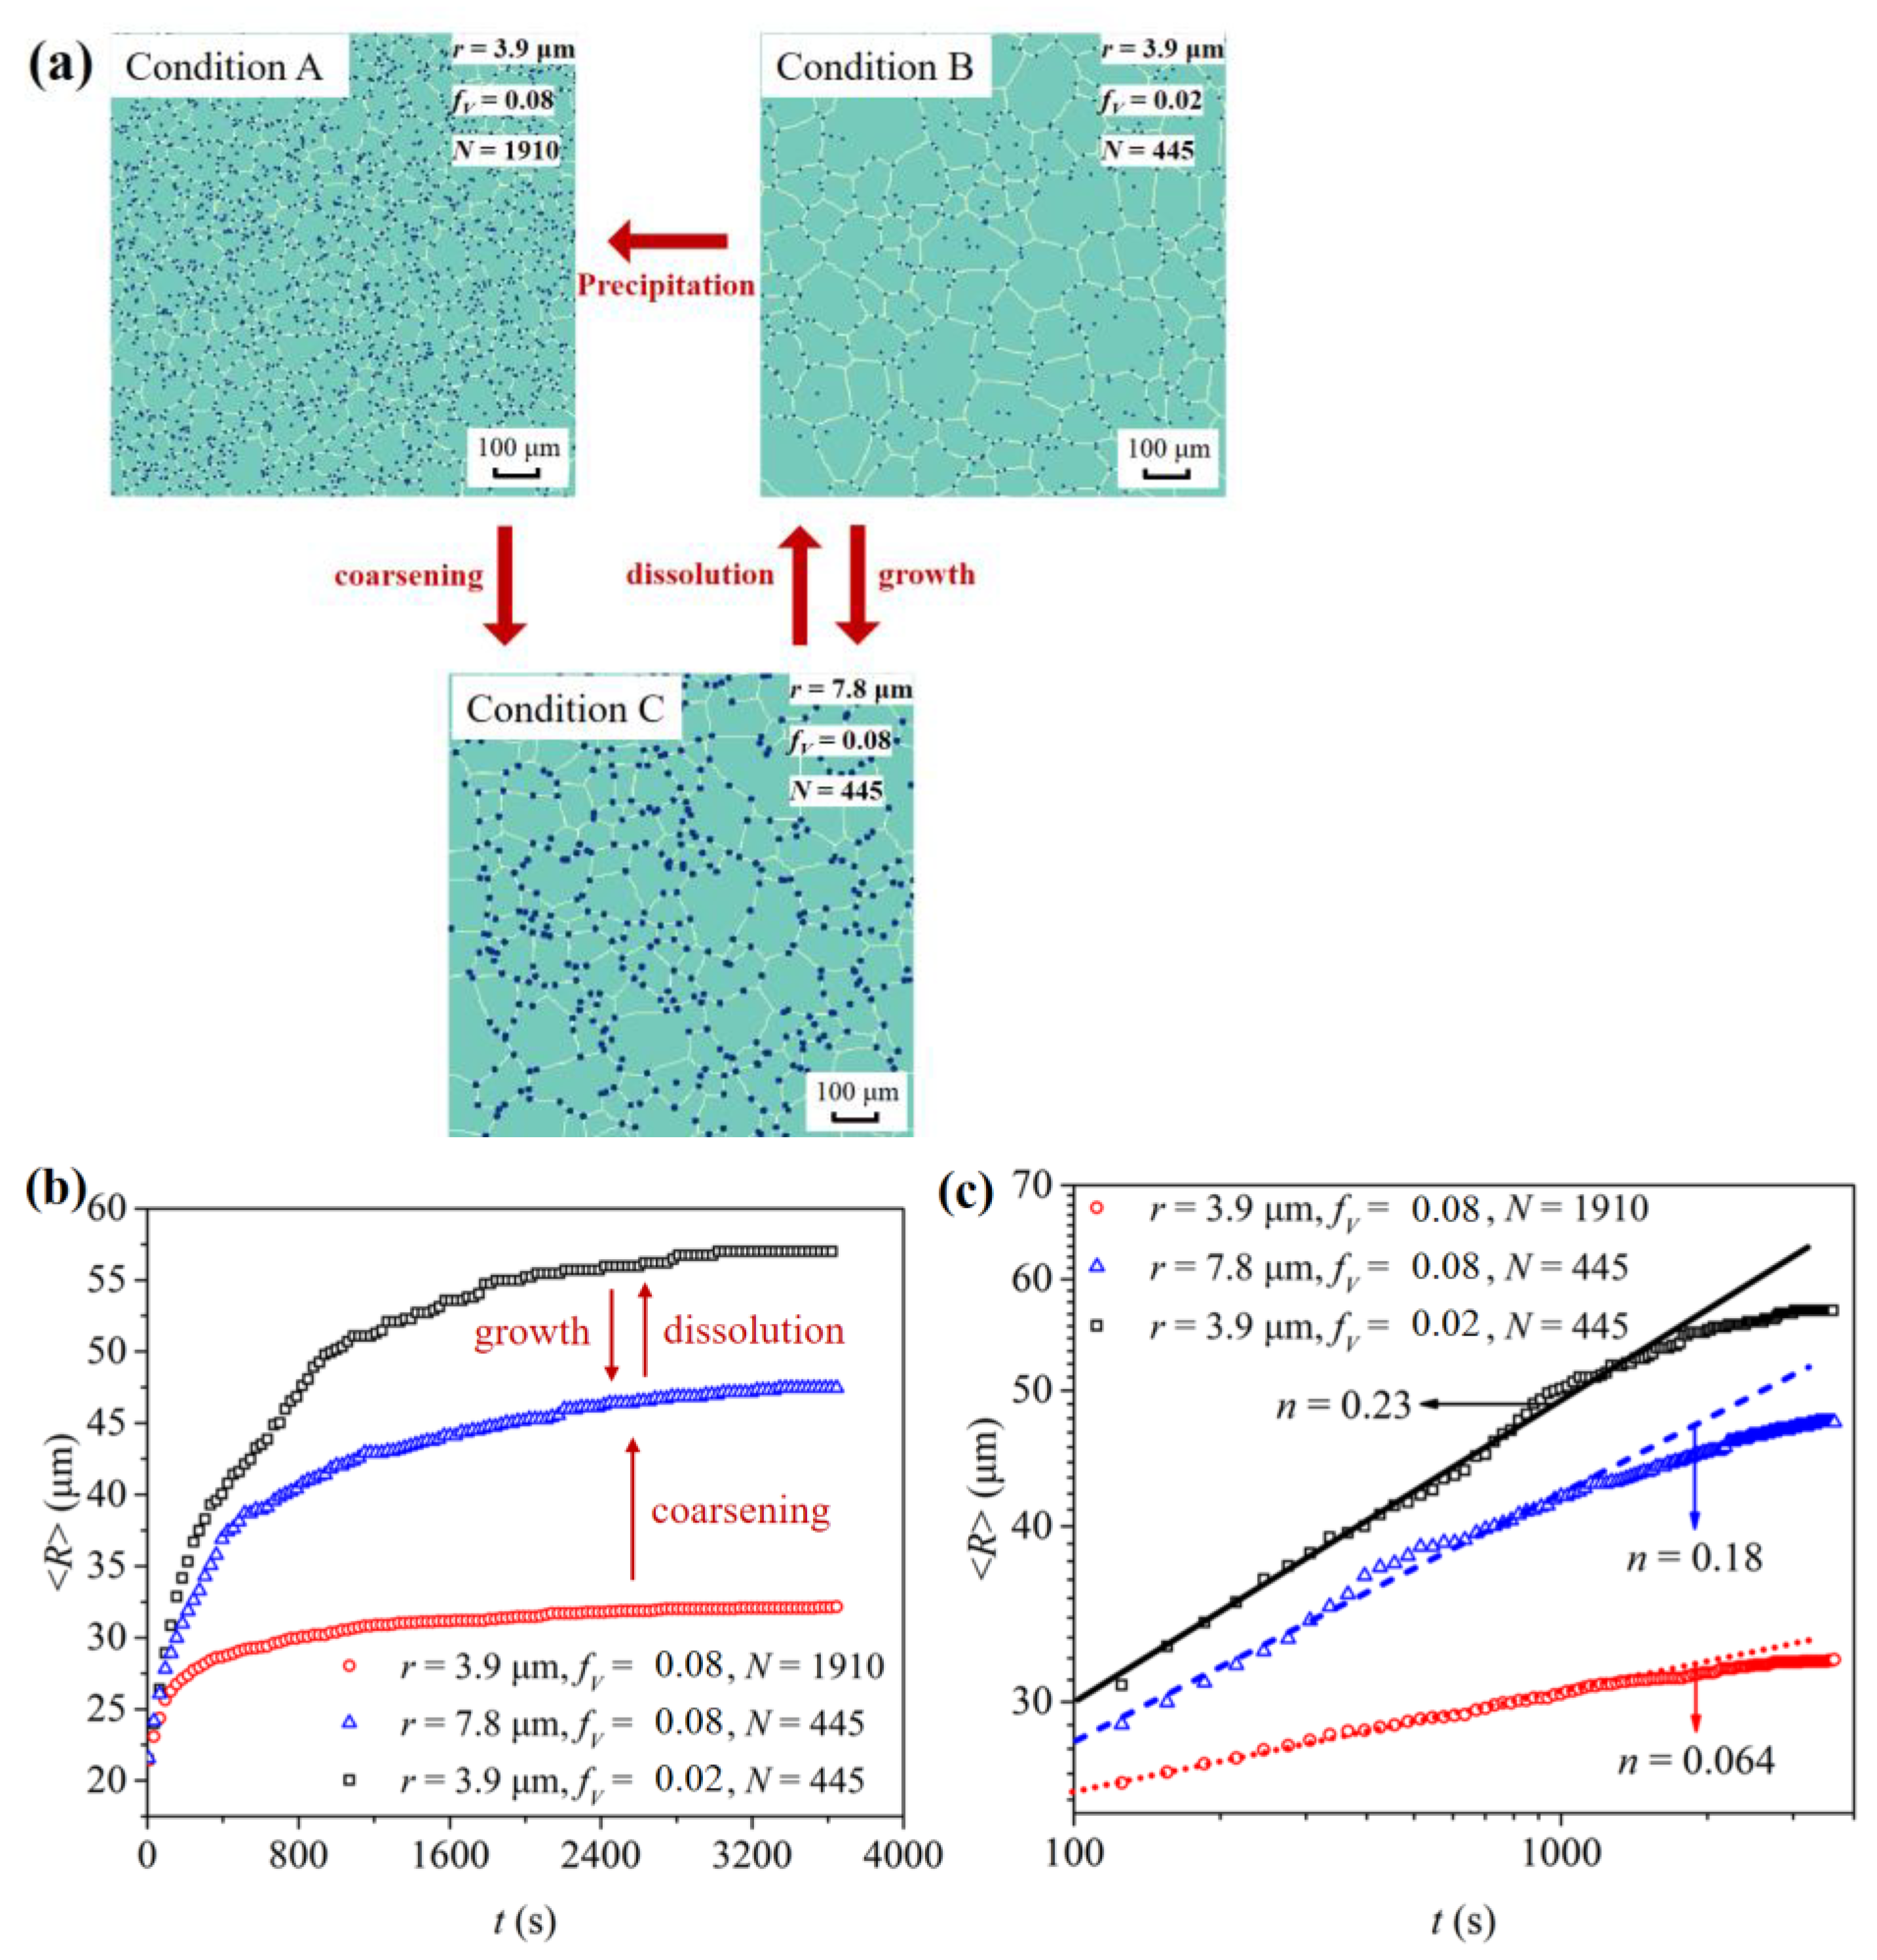
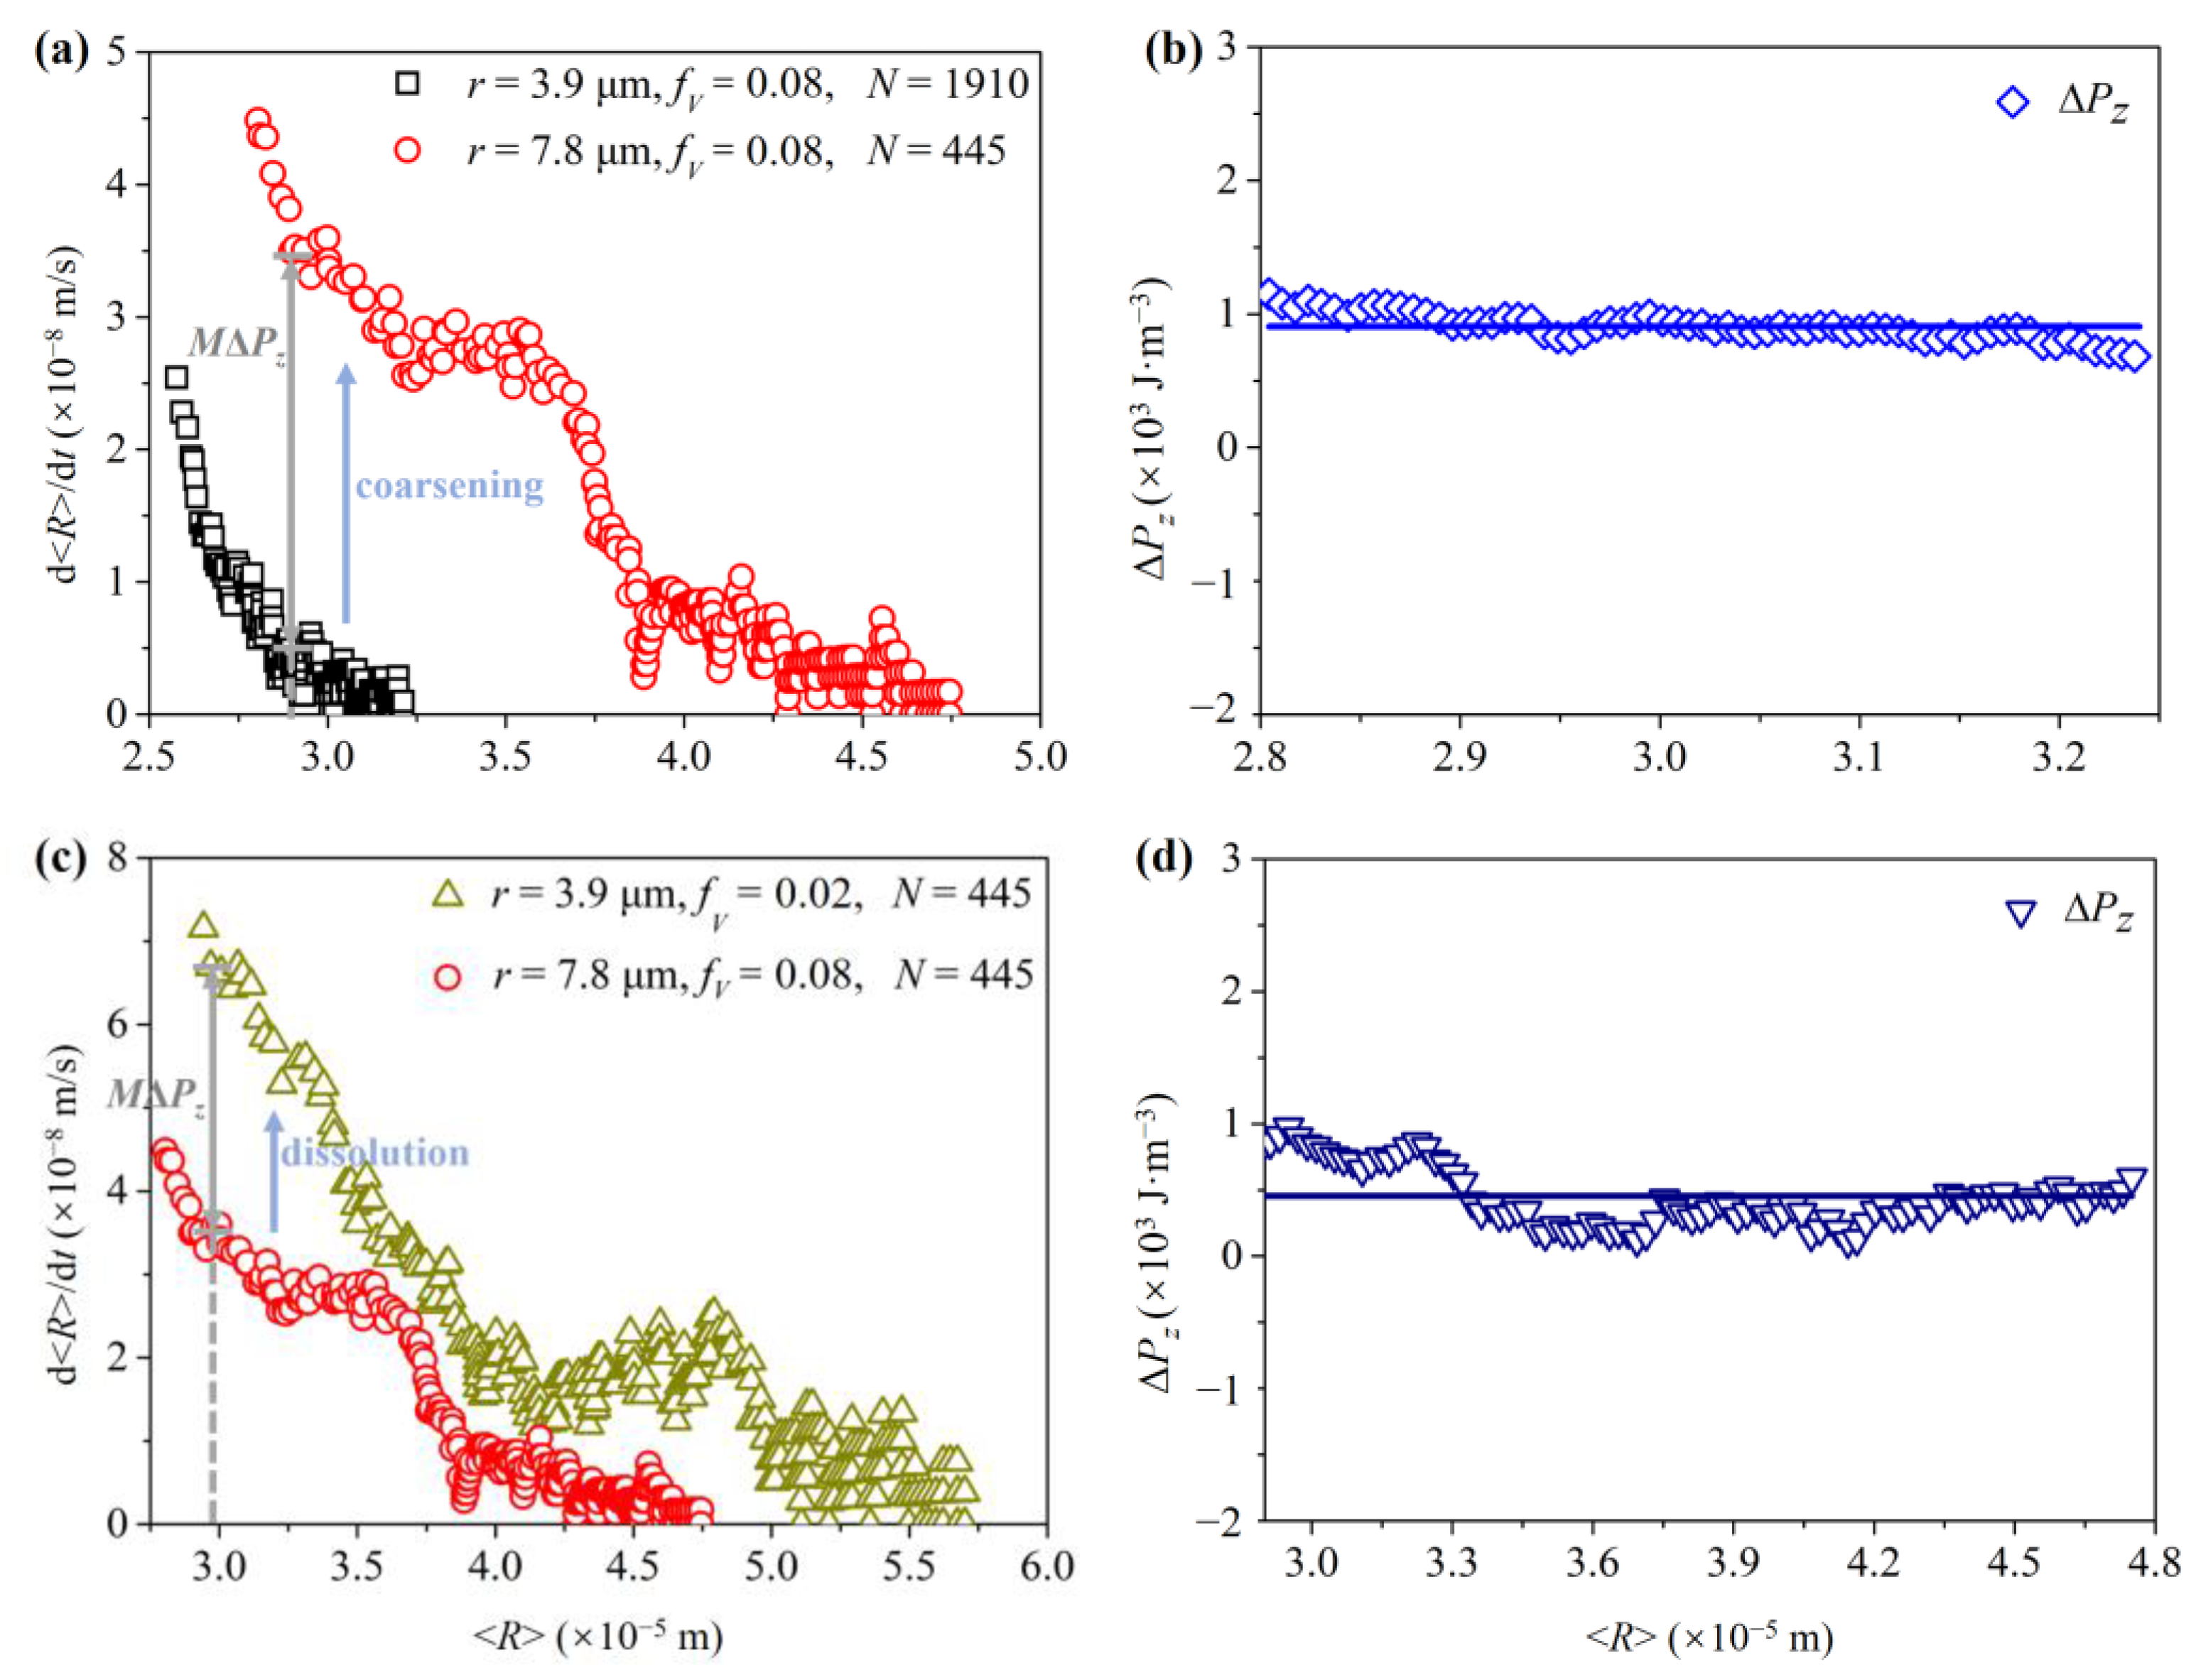
4.1. The Grain Coarsening Kinetics
4.2. The Grain Boundary/Particles Interations
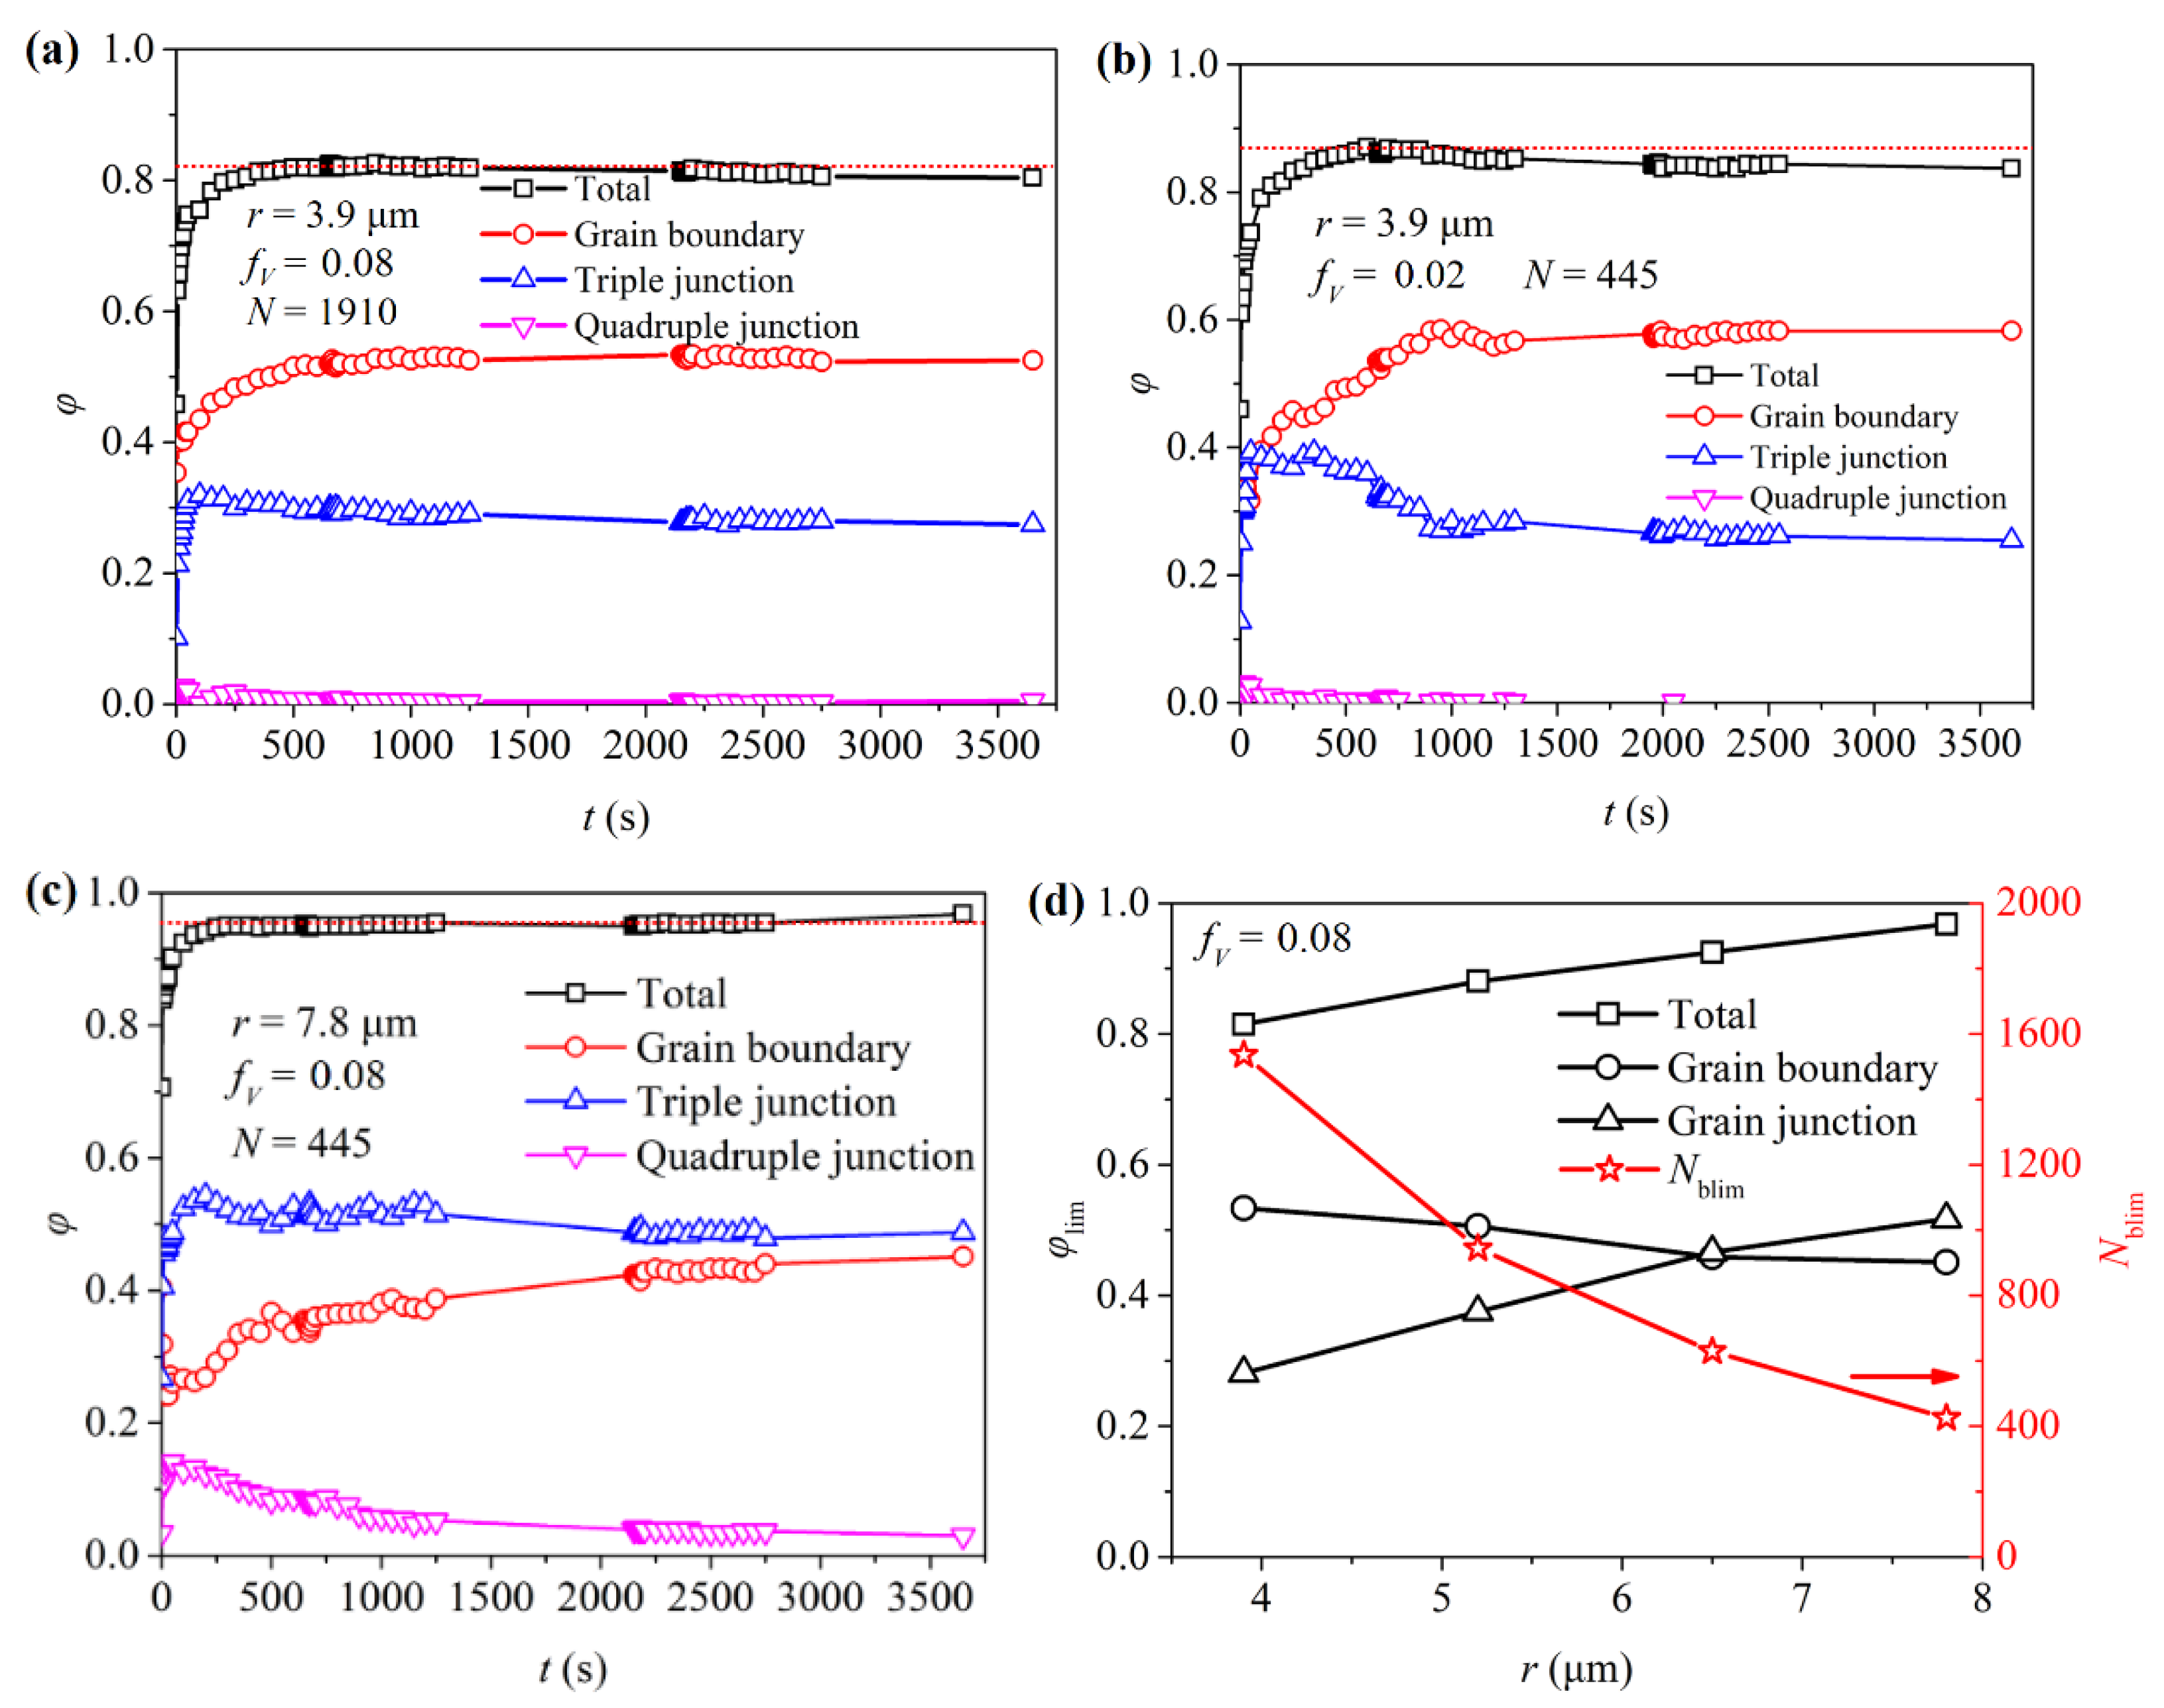
4.3. The Stagnating Average Grain Size
4.4. Comparisons with Other Simulation and Experimental Results
5. Conclusions
- (a)
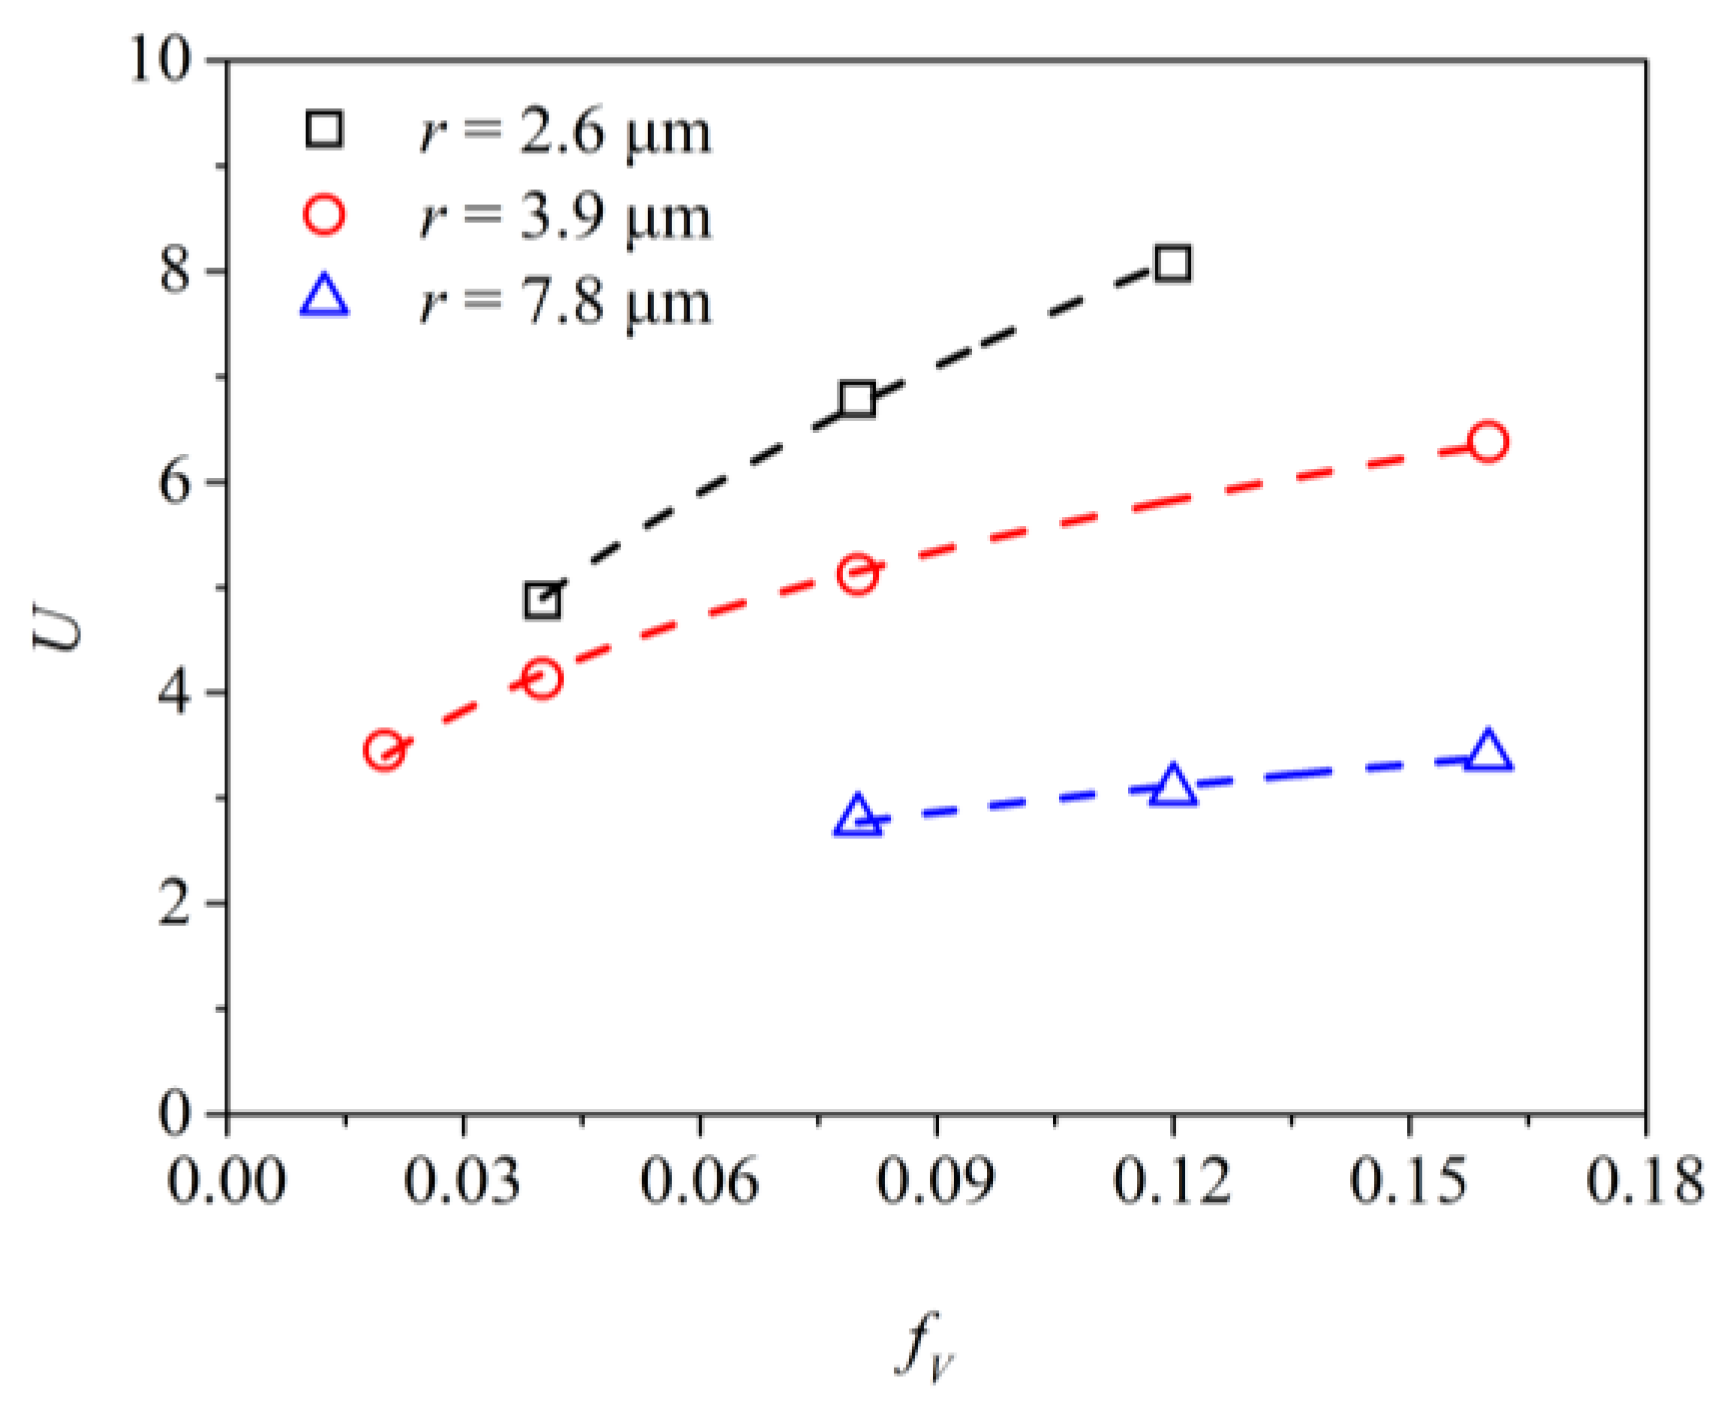
- The average pinning force per particle was mainly decided by the particle size, but little influenced by the particle number density. This conclusion was different to the traditional theory, which showed the pinning force of a particle was independent of the particle size in 2D. Therefore, the decrease of driving force during the particle coarsening process was the results of the competition between the effects of the size growth and number density decrease of the particles.
- (b)
- The increase of average pinning force per particle with particles size was due to the increase of number fraction of particles in contact with the grain junctions.
- (c)
- The average number of particles for a grain to be stagnated was related to both the number density and size of particles. This was different to the original assumption of Srolovitz et al. [4]
- (d)
- The good agreements between simulation results of the present model and the experimental results showed that the present models were efficient in simulating the second-phase particle pinned grain coarsening processes.
Author Contributions
Funding
Institutional Review Board Statement
Informed Consent Statement
Data Availability Statement
Conflicts of Interest
References
- Miura, H.; Tsukawaki, H.; Sakai, T.; Jonas, J. Effect of particle/matrix interfacial character on the high-temperature deformation and recrystallization behavior of Cu with dispersed Fe particles. Acta Mater. 2008, 56, 4944–4952. [Google Scholar] [CrossRef]
- Hutchinson, C.R.; Gouné, M.; Redjaïmia, A. Selecting non-isothermal heat treatment schedules for precipitation hardening systems: An example of coupled process–property optimization. Acta Mater. 2007, 55, 213–223. [Google Scholar] [CrossRef]
- Collins, D.M.; Conduit, B.; Stone, H.; Hardy, M.; Conduit, G.; Mitchell, R. Grain growth behaviour during near-c0 solvus thermal exposures in a polycrystalline nickel-base superalloy. Acta Mater. 2013, 61, 3378–3391. [Google Scholar] [CrossRef]
- Srolovitz, D.J.; Anderson, M.P.; Grest, G.S.; Sahni, P.S. Computer simulation of grain growth-iii. influence of a particle dispersion. Acta Met. 1984, 32, 1429–1438. [Google Scholar] [CrossRef]
- Anderson, M.P.; Grest, G.S.; Doherty, R.D.; Li, K.; Srolovitz, D.J. Inhibition of grain growth by second phase particles: Three dimensional Monte Carlo computer simulations. Scr. Metall. 1989, 23, 753–758. [Google Scholar] [CrossRef] [Green Version]
- Hassold, G.N.; Holm, E.A.; Srolovitz, D.J. Effects of particle size on inhibited grain growth. Scr. Metall. 1990, 24, 101–106. [Google Scholar] [CrossRef] [Green Version]
- Hassold, G.N.; Srolovitz, D.J. Computer simulation of grain growth with mobile particles. Scr. Metall. et Mater. 1995, 32, 1541–1547. [Google Scholar] [CrossRef]
- Gao, J.; Thompson, R.G.; Patterson, B.R. Computer simulation of grain growth with second phase particle pinning. Acta Mater. 1997, 45, 3653–3658. [Google Scholar] [CrossRef]
- Song, X.; Liu, G.; Gu, N. Influence of the second-phase particle size on grain growth based on computer simulation. Mater. Sci. Eng. A 1999, 270, 178–182. [Google Scholar] [CrossRef]
- Miodownik, M.; Holm, E.A.; Hassold, G.N. Highly parallel computer simulations of particle pinning: Zener vindicated. Scr. Mater. 2000, 42, 1173–1177. [Google Scholar] [CrossRef]
- Haghighata, S.M.H.; Taheri, A.K. Investigation of limiting grain size and microstructure homogeneity in the presence of second phase particles using the Monte Carlo method. J. Mater. Process. Technol. 2008, 195, 195–203. [Google Scholar]
- Fjeldberg, E.; Marthinsen, K. A 3D Monte Carlo study of the effect of grain boundary anisotropy and particles on the size distribution of grains after recrystallisation and grain growth. Comput. Mater. Sci. 2010, 48, 267–281. [Google Scholar] [CrossRef]
- Phaneesh, K.; Bhat, A.; Mukherjee, P.; Kashyap, K. On the Zener limit of grain growth through 2D Monte Carlo simulation. Comput. Mater. Sci. 2012, 58, 188–191. [Google Scholar] [CrossRef]
- Riege, S.P.; Thompson, C.V.; Frost, H.J. Simulation of the influence of particles on grain structure evolution in two-dimensional systems and thin films. Acta Mater. 1999, 47, 1879–1887. [Google Scholar] [CrossRef]
- Weygand, D.; Bréchet, Y.; Lépinoux, J. Zener pinning and grain growth: A two-dimensional vertex computer simulation. Acta Mater. 1999, 47, 961–970. [Google Scholar] [CrossRef]
- Weygand, D.; Bréchet, Y.; Lépinoux, J. Inhibition of grain growth by particle distribution: Effect of spatial heterogeneities and of particle strength dispersion. Mater. Sci. Eng. A 2000, 292, 34–39. [Google Scholar] [CrossRef]
- Tamaki, T.; Murakami, K.; Ushioda, K. Proposal of grain growth model based on two-dimensional local curvature multi-vertex model in the presence of pinning particles. ISIJ Int. 2016, 56, 1857–1865. [Google Scholar] [CrossRef] [Green Version]
- Fan, D.; Chen, L.-Q.; Chen, S.-P.P. Numerical simulation of Zener pinning with growing second-phase particles. J. Am. Ceram. Soc. 1998, 81, 526–532. [Google Scholar] [CrossRef]
- Moelans, N.; Blanpain, B.; Wollants, P. A phase field model for the simulation of grain growth in materials containing finely dispersed incoherent second-phase particles. Acta Mater. 2005, 53, 1771–1781. [Google Scholar] [CrossRef]
- Harun, A.; Holm, E.A.; Clode, M.P.; Miodownik, M.A. On computer simulation methods to model Zener pinning. Acta Mater. 2006, 54, 3261–3273. [Google Scholar] [CrossRef]
- Moelans, N.; Blanpain, B.; Wollants, P. Phase field simulations of grain growth in two-dimensional systems containing finely dispersed second-phase particles. Acta Mater. 2006, 54, 1175–1184. [Google Scholar] [CrossRef]
- Chang, K.; Feng, W.; Chen, L.-Q. Effect of second-phase particle morphology on grain growth kinetics. Acta Mater. 2009, 57, 5229–5236. [Google Scholar] [CrossRef]
- Shahandeh, S.; Militzer, M. Grain boundary curvature and grain growth kinetics with particle pinning. Philos. Mag. 2013, 93, 3231–3247. [Google Scholar] [CrossRef]
- Schwarze, C.; Kamachali, R.D.; Steinbach, I. Phase-field study of Zener drag and pinning of cylindrical particles in polycrystalline materials. Acta Mater. 2016, 106, 59–65. [Google Scholar] [CrossRef]
- Chang, K.; Kwon, J.; Rhee, C.-K. Role of second-phase particle morphology on 3D grain growth: A phase-field approach. Comput. Mater. Sci. 2016, 124, 438–443. [Google Scholar] [CrossRef]
- Vedantam, S.; Mallick, A. Phase-field theory of grain growth in the presence of mobile second-phase particles. Acta Mater. 2010, 58, 272–281. [Google Scholar]
- Chang, K.; Chen, L.-Q. Quantitative evaluation of particle pinning force on a grain boundary using the phase-field method, Modelling Simul. Mater. Sci. Eng. 2012, 20, 05500411. [Google Scholar]
- Chang, K.; Kwon, J.; Rhee, C.-K. Effect of particle-matrix coherency on Zener pinning: A phase-field approach. Comput. Mater. Sci. 2018, 142, 297–302. [Google Scholar] [CrossRef]
- Moelans, N.; Blanpain, B.; Wollants, P. Pinning effect of second-phase particles on grain growth in polycrystalline films studied by 3-D phase field simulations. Acta Mater. 2007, 55, 2173–2182. [Google Scholar] [CrossRef]
- Wang, N.; Ji, Y.; Wang, Y.; Wen, Y.; Chen, L.-Q. Two modes of grain boundary pinning by coherent precipitates. Acta Mater. 2017, 135, 226–232. [Google Scholar] [CrossRef]
- Kim, B.N.; Kishi, T. Finite element simulation of Zener pinning behavior. Acta Mater. 1999, 47, 2293–2301. [Google Scholar] [CrossRef]
- Couturier, G.; Maurice, C.; Fortunier, R. Three-dimensional finite-element simulation of Zener pinning dynamics. Philos. Mag. 2003, 83, 3387–3405. [Google Scholar] [CrossRef]
- Li, Z.; Wang, J.; Huang, H. Influences of particle fractions on second-phase particles pinning grain coarsening processes. J. Mater. Sci. 2020, 55, 3434–3449. [Google Scholar] [CrossRef]
- Li, Z.; Wang, J.; Huang, H. Influences of grain/particle interfacial energies on second-phase particle pinning grain coarsening of polycrystalline. J. Alloys Compd. 2020, 818, 152848. [Google Scholar] [CrossRef]
- Turnbull, D. Theory of grain boundary migration rates. Trans. Met. Soc. AIME 1951, 191, 661–665. [Google Scholar] [CrossRef]
- Mason, J.K. Grain boundary energy and curvature in Monte Carlo and cellular automata simulations of grain boundary motion. Acta Mater. 2015, 94, 162–171. [Google Scholar] [CrossRef]
- Li, Z.; Wang, J.; Huang, H. Grain boundary curvature based 2D cellular automata simulation of grain coarsening. J. Alloys Compd. 2019, 791, 411–422. [Google Scholar] [CrossRef]
- Sieradzki, L. Lukasz Made, Comp. Mater. Sci. 2013, 67, 156–173. [Google Scholar]
- Vertyagina, Y.; Mahfouf, M.; Xu, X. 3D modelling of ferrite and austenite grain coarsening using real-valued cellular automata based on transition function. J. Mater. Sci. 2013, 48, 5517–5527. [Google Scholar] [CrossRef]
- Hillert, M. Inhibition of grain growth by second-phase particles. Acta Metall. 1988, 36, 3177–3181. [Google Scholar] [CrossRef]
- Darling, K.; Kapoor, M.; Kotan, H.; Hornbuckle, B.; Walck, S.; Thompson, G.; Tschopp, M.; Kecskes, L. Structure and mechanical properties of Fe-Ni-Zr oxide-dispersion-strengthened ODS alloys. J. Nucl. Mater. 2015, 467, 205–213. [Google Scholar] [CrossRef] [Green Version]
- Barton, D.J.; Kale, C.; Hornbuckle, B.C.; Darling, K.A.; Solanki, K.N.; Thompson, G.B. Microstructure and dynamic strain aging behavior in oxide dispersion strengthened 91Fe-8Ni-1Zr at.% alloy. Mater. Sci. Eng. A 2018, 725, 503–509. [Google Scholar] [CrossRef]
- Kotan, H.; Darling, K.A.; Luckenbaugh, T. High temperature mechanical properties and microstructures of thermally stabilized Fe-based alloys synthesized by mechanical alloying followed by hot extrusion. Met. Mater. Int. 2021, 27, 1790–1797. [Google Scholar] [CrossRef]
- Najafkhani, F.; Kheiri, S.; Pourbahari, B.; Mirzadeh, H. Recent advances in the kinetics of normal/abnormal grain growth: A review. Arch. Civ. Mech. Eng. 2021, 21, 29. [Google Scholar] [CrossRef]
- Smith, C. Zener pinning. Met. Technol. Trans. Metall. Soc. 1948, 1, 15–51. [Google Scholar]
- Longworth, H.P.; Thompson, C.V. Abnormal grain growth in aluminum alloy thin films. J. Appl. Phys. 1991, 69, 3929–3940. [Google Scholar] [CrossRef]


| Simulation Condition | A | B | C | |
|---|---|---|---|---|
| Limiting Number Fraction | ||||
| Boundary | 0.53 | 0.58 | 0.43 | |
| Triple junction | 0.28 | 0.26 | 0.49 | |
| Quadruple junction | 0.0033 | 0.0022 | 0.037 | |
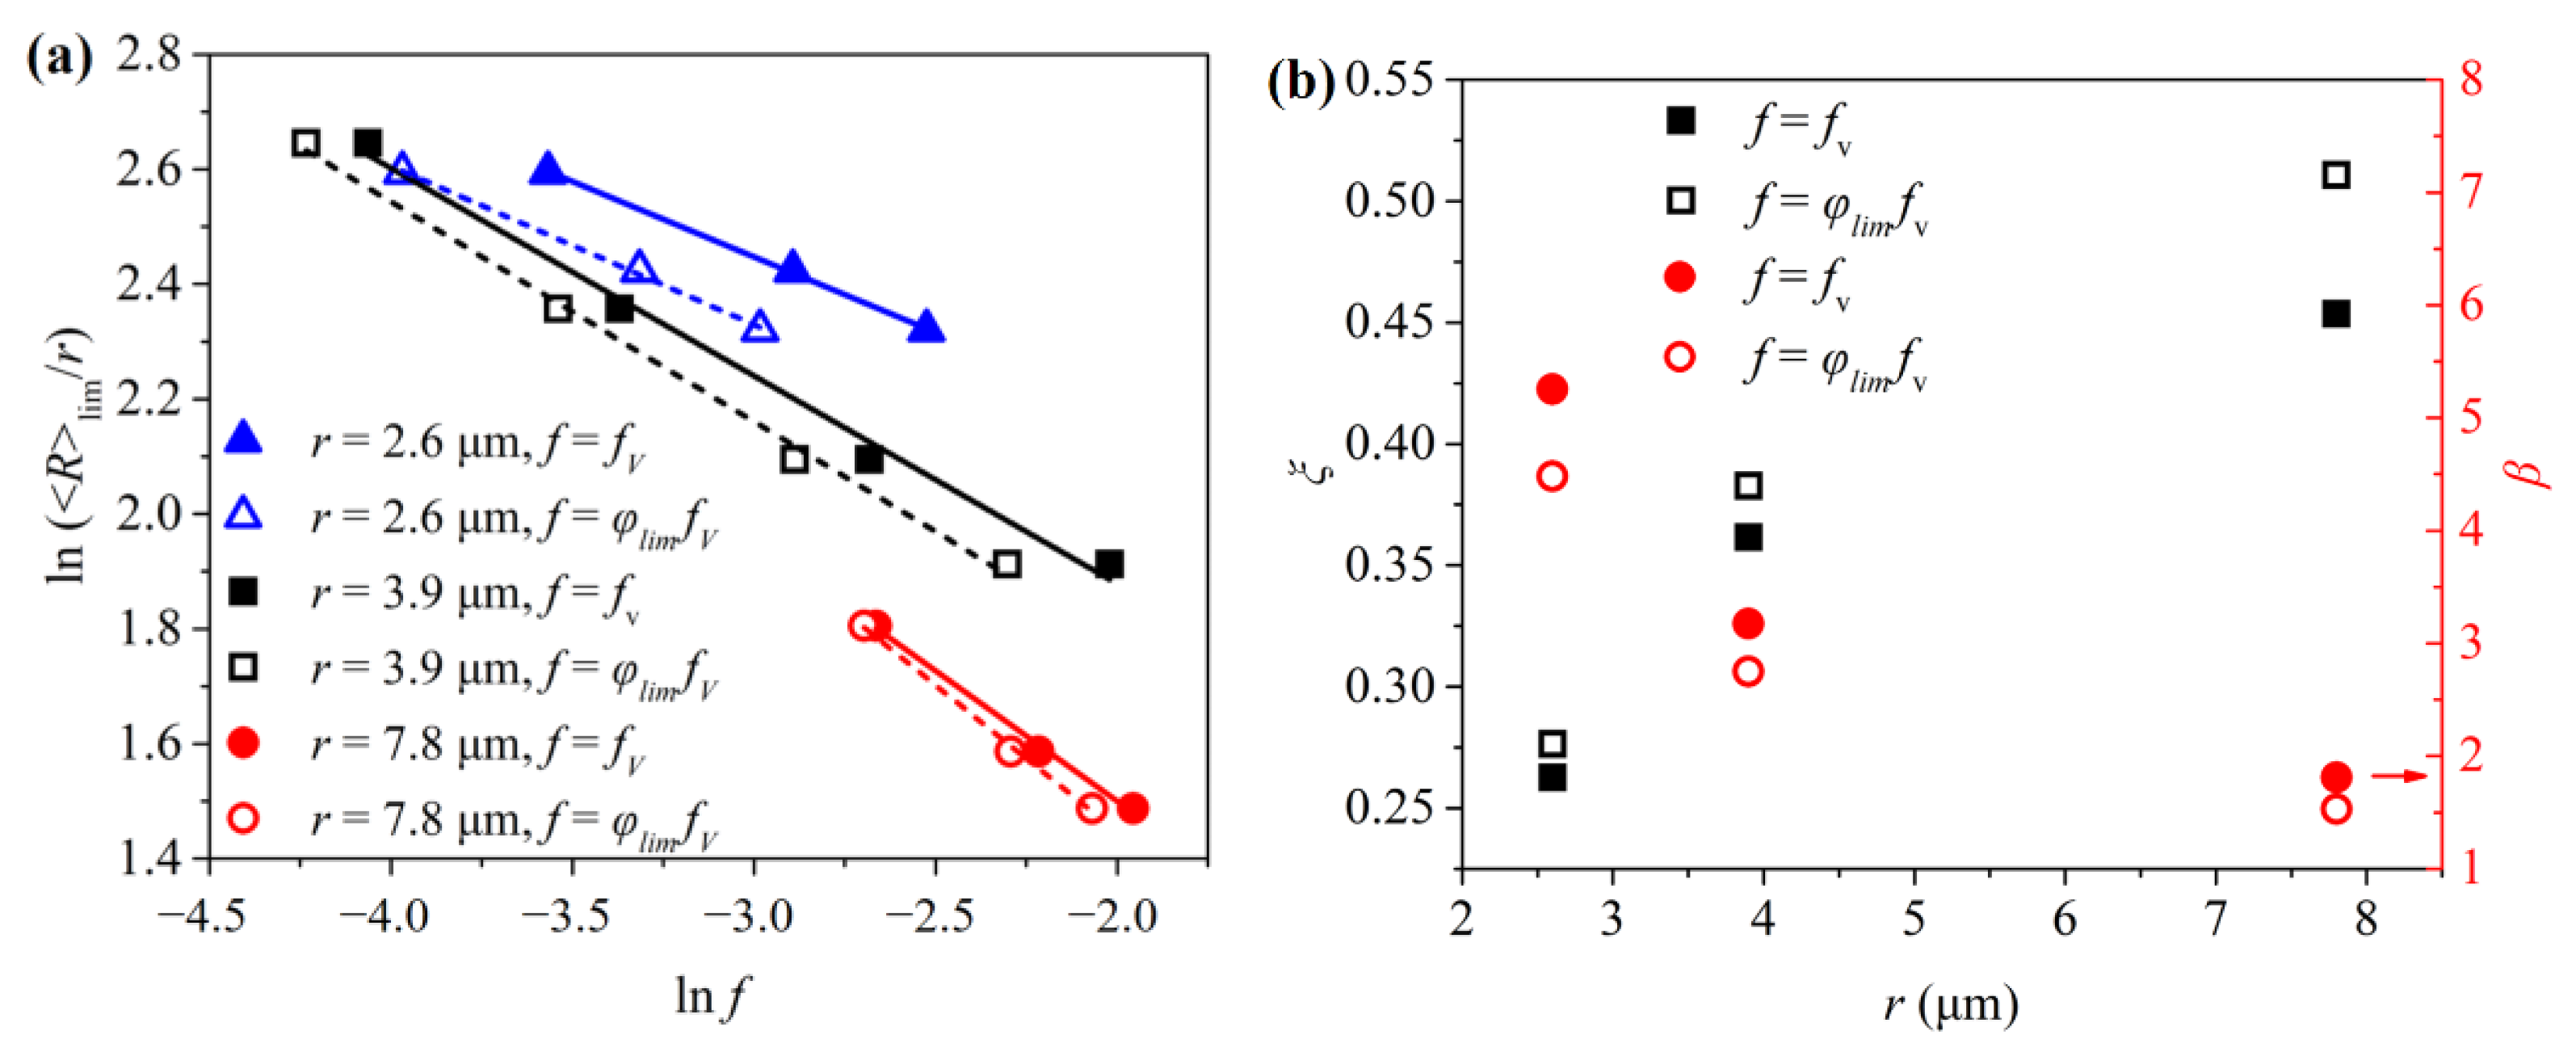
| r (μm) | ξ | ξ1 | β | β1 |
|---|---|---|---|---|
| 2.6 | 0.26 | 0.26 | 5.3 | 5.2 |
| 3.9 | 0.36 | 0.34 | 3.2 | 3.4 |
| 7.8 | 0.45 | 0.36 | 1.8 | 2.4 |
Disclaimer/Publisher’s Note: The statements, opinions and data contained in all publications are solely those of the individual author(s) and contributor(s) and not of MDPI and/or the editor(s). MDPI and/or the editor(s) disclaim responsibility for any injury to people or property resulting from any ideas, methods, instructions or products referred to in the content. |
© 2023 by the authors. Licensee MDPI, Basel, Switzerland. This article is an open access article distributed under the terms and conditions of the Creative Commons Attribution (CC BY) license (https://creativecommons.org/licenses/by/4.0/).
Share and Cite
Li, Z.; Zhang, S.; He, Y.; Peng, F.; Liu, Y. Influences of Second Phase Particle Precipitation, Coarsening, Growth or Dissolution on the Pinning Effects during Grain Coarsening Processes. Metals 2023, 13, 281. https://doi.org/10.3390/met13020281
Li Z, Zhang S, He Y, Peng F, Liu Y. Influences of Second Phase Particle Precipitation, Coarsening, Growth or Dissolution on the Pinning Effects during Grain Coarsening Processes. Metals. 2023; 13(2):281. https://doi.org/10.3390/met13020281
Chicago/Turabian StyleLi, Zhiqiang, Shengyang Zhang, Yang He, Fei Peng, and Yude Liu. 2023. "Influences of Second Phase Particle Precipitation, Coarsening, Growth or Dissolution on the Pinning Effects during Grain Coarsening Processes" Metals 13, no. 2: 281. https://doi.org/10.3390/met13020281