Abstract
Porous metals are a new ultra-light material with high specific stiffness, specific strength, and good energy absorption properties. The elastic modulus and plateau stress of porous metals are essential parameters. There have been many studies on the effects of the matrix material, porosity, and pore size on the elastic modulus and plateau stress of porous metals, but few studies can be found on the impact of pore arrangement. The pore arrangement of porous metals cannot be quantitatively described, and the design space of a porous metal structure under the same porosity is vast. With the powerful learning and prediction ability of neural networks, the influence of pore arrangement can be better understood. In this paper, a convolutional neural network was used to explore the impact of pore arrangement on both the elastic modulus and plateau stress of a porous aluminum alloy. Firstly, a finite element method was used to simulate the compression of a porous aluminum alloy to obtain a training sample library. Secondly, a convolutional neural network was built to positively predict the elastic modulus and plateau stress of the porous aluminum alloy. Partial samples were used to select the best training model from five convolutional neural network candidates. Dropout, Batch Normalization, and L2 regularization methods were used to alleviate the over-fitting phenomenon in training. All data in the database were then trained and predicted, and the predicted goodness of fit of the elastic modulus and plateau stress were 0.8785 and 0.5922, respectively. A search method based on the convolutional neural network was then used to iteratively search the database. Under the condition of using a small amount of data, the pore structure with the best elastic modulus and plateau stress in the database could be determined, and the inverse design of a structure with high elastic modulus and plateau stress could be realized.
1. Introduction
Porous metals are a kind of lightweight material with many excellent properties, such as ultra-lightness, high specific stiffness, high specific strength, impact resistance, sound energy absorption, large specific surface area, low thermal conductivity (closed-cell body), excellent permeability (through-pore body), heat and fire resistance, good thermal shock resistance, etc. [1]. Due to these excellent properties, porous metals are widely used in different engineering fields, most prominently for their energy absorption.
The compression experiment is the primary experimental method to study the mechanical properties of porous metals. For instance, Wang et al. [2] conducted quasi-static compression experiments on porous aluminum with different porosities. The results showed that the lower the porosity, the better the elastic modulus and energy absorption performance of porous aluminum. Wang et al. [3] found that the mechanical properties of porous metal matrix materials determine their elastic modulus and energy absorption properties. Hou et al. [4] demonstrated that the elastic modulus and plateau stress of porous aluminum increase with the increase in pore size by quasi-static compression experiments of spherical porous aluminum with three pore sizes. A combination of experimental methods and numerical simulation is often used. Among them, the models of porous metals mainly include the random filling model [5,6], the Voronoi model [7,8], etc. After a model is established, the finite element method is used to simulate the compression of the porous metal model. The structure and density distribution of a porous metal cannot be accurately controlled in the manufacturing process, and its structure presents evident inhomogeneity and randomness. Therefore, the impact of the pore arrangement in porous metal on its elastic modulus and plateau stress needs to be further studied.
Machine learning is a method that can “learn” certain rules from a large amount of data and make judgments. Deep learning is an essential branch of machine learning, which can achieve complex function approximation through deep nonlinear network structure [9]. A convolutional neural network (CNN) is a supervised deep learning method. There have been many works using deep learning methods to study the properties of porous media and composites, such as using CNN to predict physical properties of porous materials, including porosity [10], elastic modulus [11], effective diffusion coefficient [12], thermal conductivity [13], etc. References [14,15,16,17,18] used CNN to predict the permeability of 2D and 3D porous media. Recently, deep learning methods have been used to study the mechanical properties of porous metals. Raj [19] established a feedforward neural network to study the relative density, average pore size, and cell anisotropy ratio of foamed aluminum. Liu [20] studied the impact of microsphere radius, sphere shell thickness, porosity and wall opening pore size on the thermal conductivity of hollow microsphere foam gold. However, to the authors’ best knowledge, there is no research on the dependence of the elastic modulus and plateau stress of porous metal on pore arrangement using deep learning methods.
In this paper, the 2D porous aluminum alloy was taken as the research object to study the impact of pore arrangement on its elastic modulus and plateau stress. A random 2D porous aluminum alloy finite element model with the same porosity but different pore arrangement was established by Abaqus, and a quasi-static compression simulation was then performed. The porous aluminum alloy structure image obtained by finite element simulation and its corresponding elastic modulus value and plateau stress value were used as the data set of the neural network, and the relationship between the structure image and its plateau stress and elastic modulus was established by CNN. A CNN-based search method was then used to perform a reverse search to achieve the screening of the best mechanical properties of porous metal structures in the database under the condition of using a small amount of data.
2. Materials and Methods
2.1. Dataset
Finite Element Model
A porous aluminum alloy model was established by Abaqus based on Python. Figure 1 shows the structure diagram and the processed effect diagram of the porous aluminum alloy with a size of 60 mm × 60 mm × 1 mm. It can be seen that the pores have a circle shape, the centers of the circles are randomly distributed in the thin plate, and the radius follows a quasi-Gaussian distribution with a mean of 3 and a variance of 0.5. The flowchart of the generated structure is shown in Figure 2. Due to the randomness of the center and radius distribution, there are theoretically infinite kinds of pore structures. The porosity of the porous metal was controlled by controlling the size of all circle areas, and the final porosity was determined to be 45%.
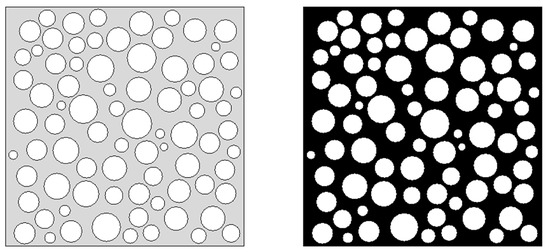
Figure 1.
Structure diagram of porous aluminum alloy and image after binarization process.
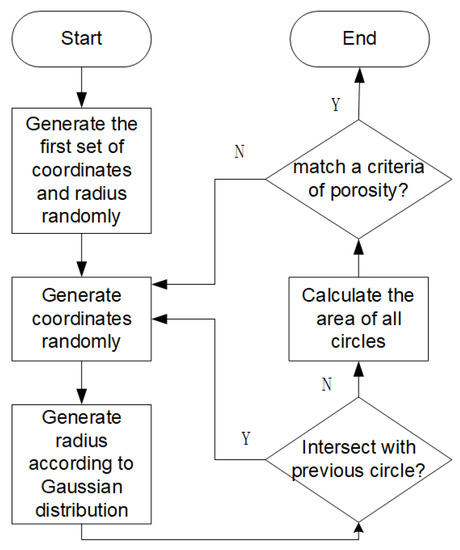
Figure 2.
Flowchart of generating round pores.
The porous metal matrix material studied in this paper was a copper–aluminum alloy, which was assumed to be an ideal plastic, and its related properties are shown in Table 1. Quasi-static compression of porous metals was simulated using Abaqus/Explicit software (version 2021, Dassault Systemes, Paris, France). For the calculation, the model was sandwiched between the left and right rigid planes; the right rigid plane was stationary and the left rigid plane moved to 24mm to compress the porous metal. We established a reference point on the rigid plates and calculated the nominal stress-strain curve of the model with the normal reaction of the rigid plate. Universal contact was adopted for the contact and constraint settings, the contact attribute was set to the tangent direction using the penalty function, the friction coefficient was set to 0.02, and the normal direction used “hard” contact and allowed separation after contact. The mesh element of the porous metal model was a triangular element with a size of about 0.7. To accurately account for the actual mass of the model and the effects of inertial effects, no mass scaling was used in the calculations. The compression process is shown in Figure 3.

Table 1.
Copper–aluminum alloy substrate material properties.
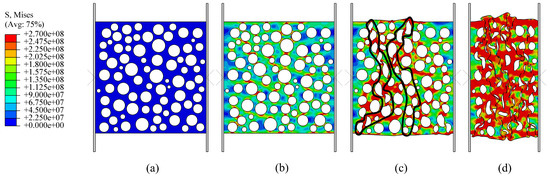
Figure 3.
Porous copper–aluminum alloy compression process diagram, where (a) is the initial state, (b) is entering the plateau region, (c) is the plateau region, and (d) is the densification region.
The calculated nominal stress-strain curve of the porous aluminum alloy is shown in Figure 4. The strain rate effect of the material is not considered in the calculation. It can be seen from Figure 4 that the stress-strain curve of porous metal shows three regions: the elastic region, plateau region, and densification region when it is compressed.
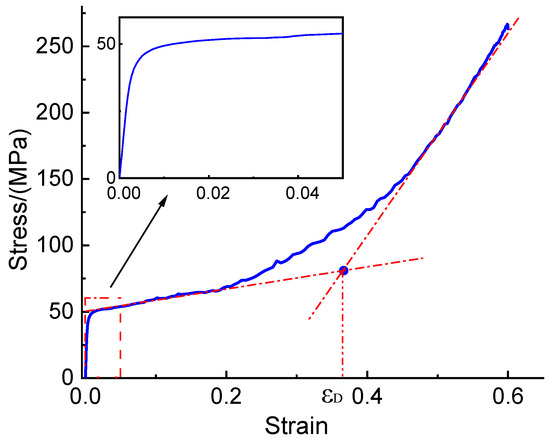
Figure 4.
Compressive stress-strain curve of porous aluminum alloy.
The strain is slight for the elastic region, and the elastic modulus can be calculated from the straight line, as shown in Equation (1). The plateau region is the primary energy absorption stage, which starts with the yielding of the weakest pore wall and then spreads and produces a yield band (the yield band is shown in the black box in Figure 3c) until it is compacted into the densification region. According to the theory of the literature [21], the end of the plateau region of the porous metal compression curve is also the beginning of the densification section taken as the ultimate strain , which can be approximated by Equation (2):
where is the relative density, and α is a coefficient generally set between 1.4 and 2. = 0.23 when α is set at 1.4, and = −0.1 when α is set at 2. The results of different values differ significantly. Considering that the porosity of this model is low, α is consistent with the shape of the plateau region of the stress-strain curve when a small value is taken, so α = 1.4 is chosen. In the literature [22], the location of the ultimate strain can be determined with the help of the intersection of the tangent line of the plateau region and the densification region, which can be referred to as the “graphing method,” and the ultimate strain calculated using the graphing method takes the value = 0.37.
The average stress during the plateau region is called the plateau stress, as shown in Equation (3). The energy C absorbed by a porous metal compressed to a certain strain value is equivalent to the area of the part of its compressive stress-strain curve below that strain, and the energy absorbed during the plateau region is calculated using Equation (4). Since the stress-strain curve is made up of discrete data points joined together, and the spacing between the scattered points is minimal, the trapezoidal Equation (5) is used to replace Equation (4):
where C is the energy absorption in Equation (3) and is yield strain. Due to the elastic region being too short, can be taken directly as zero. The values of the plateau stress calculated by the empirical and graphical methods are 61.04 MPa and 73.57 MPa, respectively. The prediction accuracy obtained by using the empirical method was higher in the subsequent prediction of this paper, so the empirical method was used.
The Abaqus was used to generate 10,000 porous aluminum alloy structures in bulk and perform compression finite element simulations. The porous aluminum alloy structure diagram and its corresponding stress-strain curve were obtained, and its elastic modulus and plateau stress were calculated and distributed, as shown in Figure 5.
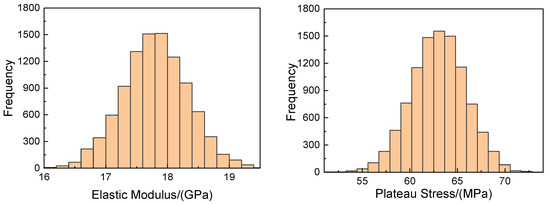
Figure 5.
Elastic modulus and plateau stress distribution for 10,000 copies of porous aluminum alloy.
2.2. CNN
CNN is a supervised deep learning method consisting of an input layer, convolutional layer, pooling layer, fully-connected layer, and output layer. CNN finally discriminates the target by multiple convolutional operations on the input target and combining it with a specific output.
The convolutional layer often contains multiple convolutional kernels. The convolution kernels slide over the image in certain steps and perform discrete convolution operations with the image’s pixel points to extract the image’s features. Multiple convolutional kernels in a convolutional layer work together to extract different features. The convolution operation is shown in Equation (6).
The pooling layer, also known as the subsampling layer, is often connected to the output of the convolution layer. The pooling layer performs secondary feature extraction on the input data, reducing the amount of data while retaining useful information about the image. Pooling operations are divided into average pooling and maximum pooling.
After the image is flattened, it is pulled into a one-dimensional vector, which is then connected to the fully connected layer. A suitable loss function is selected according to the purpose of the task and connected to the fully connected layer for classification or regression.
Based on the Visual Geometry Group (VGG) network structure [23], a new VGG-like network structure is built in this paper. The Adam optimizer is chosen as the parameter optimizer, and the activation function of the network uses the Rectified Linear Unit activation (Relu). As a regression problem, we choose R2 as the evaluation index of the performance of the regression model to assess the degree of fit of the prediction, as shown in Equation (7), and choose the mean square error (MSE) as the loss function as shown in Equation (8):
where is the number of training data, is the true value, and is the network prediction. To facilitate the observation of the network structure, we denote ‘c’ as the number of kernels in the convolutional layer and ‘f’ as the number of neurons in the fully-connected layer. For example, c16c32c64c128f128f64 represents four convolutional layers and two fully-connected layers. The convolutional kernels in the convolutional layers are 16, 32, 64, and 128, and the number of neurons in the fully connected layers are 128 and 64, respectively. The basic structure of the CNN is shown in Figure 6.
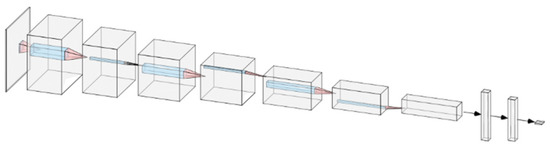
Figure 6.
Basic CNN structure diagram.
3. CNN-Based Forward Prediction
Since the time required for training using all the data is too long, we divide the forward prediction into two stages. The first stage determines the parameters of the best network structure, and the second stage uses the network selected in the first stage for training and prediction. The library includes 10,000 gray images of 512 × 512 and the corresponding elastic modulus (and platform stress). The data needed to be pre-processed before the network training, which included binarization of the input images and normalization of the labels of the elastic modulus and the plateau stress.
3.1. First Stage
In the first stage, 2000 samples were selected. Among them, 1800 samples were used as the training set, 100 samples as the validation set, and 100 samples as the test set. To ensure the same conditions when comparing different models, a fixed training set, validation set, and test set were selected for training. The initial learning rate was 0.0001, the epoch was 300, and the batch size was 32.
3.1.1. Convolution Kernel Size
The core of a CNN is the convolutional layer. In a CNN, the receptive field determines the size of the area of the input layer corresponding to an element in the output of a layer. The receptive field is the size of the area on the input layer corresponding to a cell in the output feature map. The formula for calculating the receptive field is shown in Equation (9):
where is the ith layer receptive field, is the step size, and is the size of the convolution kernel or pooling kernel. In this paper, four types of convolutional kernels were used, namely, 3 × 3, 5 × 5, 7 × 7, and 9 × 9. The step of a 3 × 3 convolutional kernel was taken as 1 × 1, and the step of the other sizes of convolutional kernels was taken as 2 × 2. A total of five basic CNN models were created according to the size of convolutional kernels, which were Model1: c16c32c32c64c128c256f128f64 (convolutional kernel size 3 × 3); Model2: c32c64c128c256f128f64 (convolutional kernel size 5 × 5); Model3: c32c64c128c256f128f64 (convolutional kernel size 7 × 7); Model4: c32c64c128c256f128f64 (convolutional kernel size 9 × 9); and Model5: c32c64c128c256f128f64 (convolution kernel size 9, 7, 5, 3 in order).
Taking the elastic modulus as an example, Table 2 shows the MSE and the R2 of different models on the test set.
Table 2.
Prediction results of different models on the test set.
3.1.2. Overfitting
During the CNN training process, the R2 of the training set is above 0.9, while the R2 of both the validation and test sets is much lower than the training set. This phenomenon is called overfitting. In this paper, Dropout, weight regularization, and Batch Normalization (BN) were used to alleviate overfitting.
The principle of the Dropout method is to randomly deactivate a certain percentage of neurons to reduce the interdependence between neurons, thus reducing overfitting in the CNN [24]. BN is a method that minimizes the problem of gradient explosion and disappearance in deep neural network training by calculating the mean and variance of examples in small batches to normalize the input [25]. Weight regularization is a method to reduce overfitting by adding a penalty term to the loss function proportional to some function of the model weights. The weight regularization method includes L1 regularization and L2 regularization. L2 regularization was chosen with a factor of λ = 0.01. Table 3 shows the prediction results after adding all regularizations.
Table 3.
Prediction results of regularization methods for different models.
3.2. Second Stage
In the second stage, Model5 was selected. All 10,000 samples were used, of which 9000 samples were used as the training set, 600 samples as the validation set, and 400 samples as the test set. The MSE and R2 of elastic modulus and plateau stress during the training process are shown in Figure 7 and Figure 8.
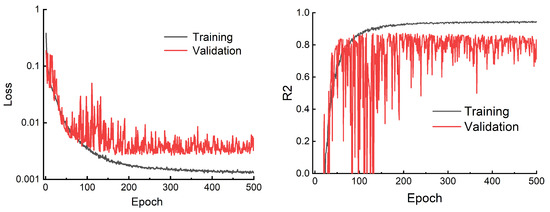
Figure 7.
MSE and R2 of the training and validation sets with elastic modulus as the label.
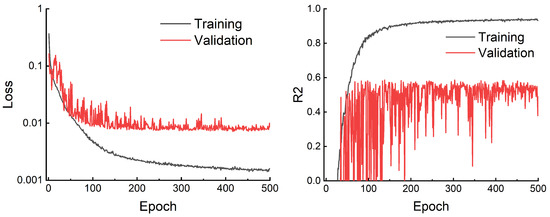
Figure 8.
MSE and R2 of the training and validation sets with plateau stress as the label.
The prediction R2 of the CNN was significantly improved by using data expansion and regularization methods. After training the CNN model with the elastic modulus as the label, the test R2 was 0.8785. The test R2 of the platform stress was 0.5922. The prediction results (after normalization) are shown in Figure 9.
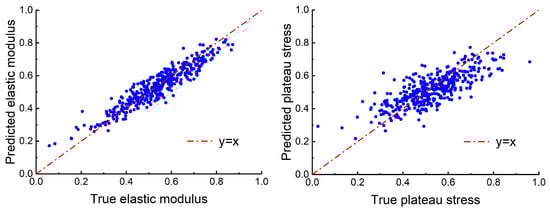
Figure 9.
Fitness of prediction and true values of elastic modulus and plateau stress on the test sets.
4. CNN-Based Inverse Design
In the previous section, we used CNN to predict the elastic modulus and plateau stress of a porous aluminum alloy. In this section, the CNN-based search method was used to perform an inverse search for structures with high elastic modulus and plateau stress. The CNN-based search method is often used to reverse search for structures with the best performance in a vast design space using a small subset of the design space. Wan et al. [26] used the CNN model to predict the thermal conductivity of porous graphene and then used a CNN search method for porous graphene structures with low thermal conductivity in a vast design space. Hanakata [27] built a CNN model to predict the yield stress and yield strain of graphene kirigami and reverse design the graphene structure with maximum elastic stretchability.
Firstly, we randomly selected 50 samples from the library (10,000 in total) and calculated their corresponding elastic modulus and plateau stress using FEM simulations. The 50 samples were used as the training set for the first-generation CNN model. The first-generation CNN model was then used to predict the elastic modulus and plateau stress of the remaining samples in the library (9500 in total). We selected the 50 samples with the highest prediction values in the CNN model and calculated their elastic modulus and plateau stress using FEM simulations. These 50 new structures were added to the training set of the first generation as the training set of the second generation (100 in total). The flow chart is shown in Figure 10. It is obvious that the size of the training set of the CNN model increases gradually with the number of iterations.
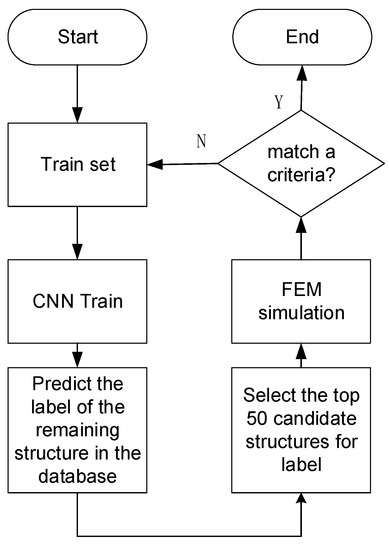
Figure 10.
Flowchart of CNN-based search method.
To observe the effectiveness of the CNN-based search method, we applied the random search method for comparison. We selected 50 samples randomly from each generation in the database without repetition. The means of the top 50 elastic modulus and plateau stress values were calculated for all generations, as shown in Figure 11.
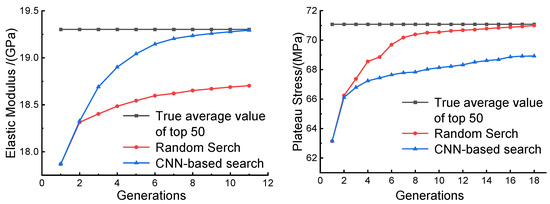
Figure 11.
The means of the top 50 elastic modulus and plateau stress values selected based on the CNN search method and random search method.
As shown in Figure 11, the CNN-based search method converges more rapidly than the random search method. The mean of the top 50 elastic modulus values obtained by the CNN-based search method at the 11th generation is close to the mean of the top 50 elastic modulus values in the database. Moreover, the structure of the top three elastic moduli in the database can be searched at the 11th generation using the CNN-based search method, as shown in Figure 12. Although the R2 of the plateau stress predicted by the CNN in the previous section was lower than the R2 of the elastic modulus, we could still search for the top three structures of the platform stress in the database at the 18th generation, as shown in Figure 13.
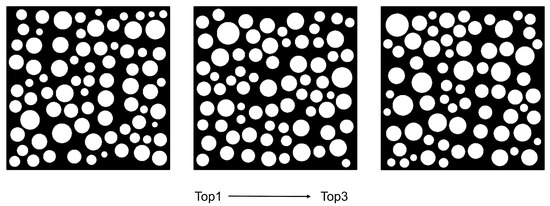
Figure 12.
Structure diagram of the top three elastic moduli in the database.
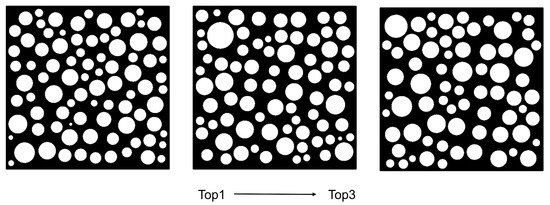
Figure 13.
Structure diagram of the top three plateau stress in the database.
The results show that the CNN-based search method can screen the structure with the best performance in a vast design space using a small number of samples in the database in the inverse direction.
5. Discussion
In order to further investigate the impact of hole arrangement on the elastic modulus and plateau stress of porous aluminum alloy, we conducted comparative experiments. The stress clouds of structures with high elastic modulus were selected in the elastic region for comparison with those with low elastic modulus. The comparison results are as follows.
When porous aluminum alloys are compressed in the elastic region, bands of stress concentration appear in the weakest areas of the structure. At this time, the weak band (the red-lined strip in Figure 14) has a relatively significant impact on the elastic modulus of the porous aluminum alloy. Most of the pore walls of the weak band of the structure with higher elastic modulus are in the direction of compression, and the average pore wall is thicker. In contrast, most of the pore walls in the weak band of the structure with lower elastic modulus are oriented with a large inclination in the direction of compression. When the structure is compressed, the pore walls on the weak band have difficulty providing support for the direction of compression, and the pore walls are relatively thin and prone to yield.
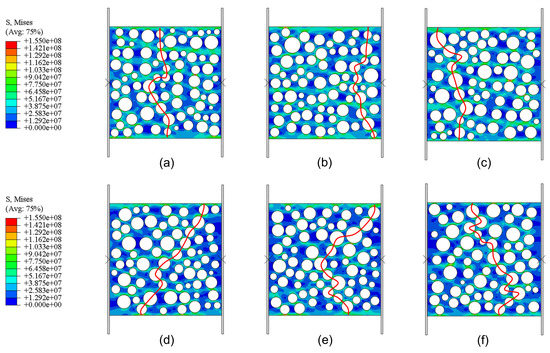
Figure 14.
Stress clouds in the elastic region, (a–c) the structures with the highest elastic modulus, (d–f) the structures with the lowest elastic modulus.
The plateau region is the primary energy absorption interval when the porous aluminum alloy is compressed. We compare the deformation diagram of the structure with the highest plateau stress in the database with that of the structure with the lowest plateau stress, as shown in Figure 15. When the strain reached 0.1, the pore walls that yielded in the structure with high plateau stress were more evenly distributed overall, but the pore walls that yielded in the structure with low plateau stress were concentrated in two weak bands. When the strain reached 0.2, the pore walls that yielded in the structure with high plateau stress were still more evenly distributed. However, the pore walls yielded in the structure with low platform stress were still concentrated in several weak bands, and some pore walls were almost not deformed. The comparison shows that in the structure with a relatively uniform distribution of pores (relatively uniform thickness of the pore wall), the overall pore wall yielding when being compressed, and the energy absorption during the plateau period are relatively uniform and better.
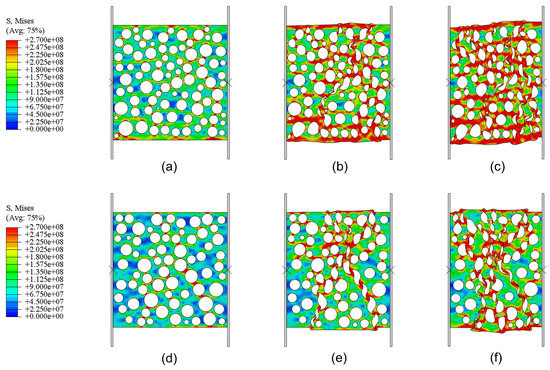
Figure 15.
Deformation diagram of the structure with the highest plateau stress (a–c) and the lowest plateau stress (d–f) for compressive strain values of 0.03 (a,d), 0.1 (b,e), and 0.2 (c,f).
6. Conclusions
In this paper, we used the finite element method to simulate the compression of a porous aluminum alloy to obtain a training sample library. A CNN model was built to predict the elastic modulus and platform stress of the porous aluminum alloy. We then used a CNN-based search method to screen the database for porous aluminum alloy structures with the highest elastic modulus and plateau stresses using a small amount of data.
The structures with the highest elastic modulus and plateau stress in the database were compared with the structures with the lowest elastic modulus and plateau stress in compression. The results show that the pore wall of the porous aluminum alloy structure has the most significant impact on its elastic modulus, and the thicker the pore wall of the weak band, the higher the elastic modulus when it is nearly perpendicular to the loading direction. The more uniform the porous aluminum alloy pore arrangement, the better its energy absorption impact in the plateau region and the higher the plateau stress.
In this paper, we only used the deep learning method to predict the properties of a 2D porous metal and reverse design the structure. In fact, we believe this method is also applicable to 3D structures. In a 3D structure, the input data changes from a 2D image to a 3D image stacked by multiple 2D images with a certain thickness. In practical application, the CNN-based inverse design method can be applied to a large design space to find the structure with the best performance. Compared with the simulation of all samples, the time required by this method is greatly reduced and facilitates more rapid design.
Author Contributions
Conceptualization, J.S. and L.W.; methodology, J.S., Y.X and L.W.; validation, J.S.; writing—original draft preparation, J.S. and L.W.; writing—review and editing, J.S., Y.X. and L.W.; All authors have read and agreed to the published version of the manuscript.
Funding
This research was funded by National Natural Science Foundation of China (No.12072105).
Data Availability Statement
Not applicable.
Acknowledgments
We acknowledge the support received from the National Natural Science Foundation of China (No.12072105).
Conflicts of Interest
The authors declare no conflict of interest.
References
- Liu, P.S. Introduction to Porous Materials; Tsinghua University Press: Beijing, China, 2004. [Google Scholar]
- Wang, J.; Qi, M.S.; Zhang, W.; Zhang, J.P.; Hou, X.L.; Wang, Z.J. Influence of Relative Density on Compression Properties and Energy Absorption of Spherical Open Cell Aluminum Foam. Packag. Eng. 2019, 40, 105–110. [Google Scholar] [CrossRef]
- Wang, Z.G.; Xu, Y.P.; He, D.P. Quasi-static compressive property of spherical pores Al foam. Ordnance Mater. Sci. Eng. 2008, 31, 15–19. [Google Scholar] [CrossRef]
- Hou, X.L.; QI, M.S.; Zhang, W.; Wang, J.; Zhang, J.P. Effect of Pore Size on on Compression and Energy Absorption Properties of Open-cell Aluminum Foam with Spherical Pores. Packag. Eng. 2019, 40, 86–91. [Google Scholar] [CrossRef]
- Qu, X.S.; Wang, L.H.; Ju, Y.; Liu, D.W.; Zhang, H.L.; Zhu, Z.J.; Hu, Y.B. 3D Modeling Method and Simulation for Mechanical Properties of Foam Metal Sandwich Panel. Mater. Mech. Eng. 2020, 44, 91–96. [Google Scholar] [CrossRef]
- Cheng, F.F. Simulation of Aluminum Foam Mechanical Properties Based on Finite Element Method. Master’s Thesis, Taiyuan University of Science And Technology, Taiyuan, China, 2015. [Google Scholar]
- Jiang, K. Study on Mechanical Properties of Aluminum Foams with Gradient Porosity based on Voronoi Model. Fly Ash Compr. Util. 2021, 35, 64–71. [Google Scholar] [CrossRef]
- Liu, Y.D.; Yu, J.L.; Zheng, Z.J. Effect of Inertia on the Dynamic Behavior of Cellular Metal. Chin. J. High Press. Phys. 2008, 22, 118–124. [Google Scholar] [CrossRef]
- Guo, L.L.; Ding, S.F. Research Progrss on Deep Learning. Comput. Sci. 2015, 42, 28–33. [Google Scholar] [CrossRef]
- Alqahtani, N.; Alzubaidi, F.; Armstrong, R.T.; Swietojanski, P.; Mostaghimi, P. Machine learning for predicting properties of porous media from 2d X-ray images. J. Pet. Sci. Eng. 2020, 184, 106514. [Google Scholar] [CrossRef]
- Liu, X.H.; Yan, Z.L.; Zhong, Z. Predicting elastic modulus of porous La0.6Sr0.4Co0.2Fe0.8O3-δ cathodes from microstructures via FEM and deep learning. Int. J. Hydrogen Energy 2021, 46, 22079–22091. [Google Scholar] [CrossRef]
- Song, X.K.; Ye, G.H.; Zhou, J.H.; Zhou, X.G. Prediction of Effective Diffusivity of Porous Material Based on Convolutional Neural Network. Chem. React. Eng. Technol. 2018, 34, 97–103. [Google Scholar] [CrossRef]
- Wei, H.; Zhao, S.S.; Rong, Q.Y.; Bao, H. Predicting the effective thermal conductivities of composite materials and porous media by machine learning methods. Int. J. Heat Mass Transf. 2018, 127, 908–916. [Google Scholar] [CrossRef]
- Li, J. A Machine Learning-based Approach for Permeability Prediction of Porous Media. Ph.D. Thesis, Zhejiang University, Hangzhou, China, 2019. [Google Scholar]
- Tang, P.F.; Zhang, D.X.; Li, H. Predicting permeability from 3D rock images based on CNN with physical information. J. Hydrol. 2022, 606, 127473. [Google Scholar] [CrossRef]
- Tian, J.W.; Qi, C.C.; Sun, Y.F.; Yaseen, Z.M. Surrogate permeability modelling of low-permeable rocks using convolutional neural networks. Comput. Methods Appl. Mech. Eng. 2020, 366, 113103. [Google Scholar] [CrossRef]
- Sui, W.B.; Cheng, S. Calculation methods for absolute permeability of sandstone digital cores based on convolutional neural networks. Pet. Geol. Recovery Effic. 2021, 29, 128–136. [Google Scholar] [CrossRef]
- Wu, J.L.; Yin, X.L.; Xiao, H. Seeing permeability from images: Fast prediction with convolutional neural networks. Sci. Bull. 2018, 63, 1215–1222. [Google Scholar] [CrossRef]
- Raj, R.E.; Daniel, B.S.S. Prediction of compressive properties of closed-cell aluminum foam using artificial neural network. Comput. Mater. Sci. 2008, 43, 767–773. [Google Scholar] [CrossRef]
- Liu, N. Simulation and Modeling of Low Temperature Effective Thermal Conductivity of Hollow Microsphere-Type Foam Gold. Ph.D. Thesis, China Academy of Engineering Physics, Mianyang, China, 2018. [Google Scholar]
- Lu, T.J.; Ong, J.H.M. Characterization of close-celled cellular aluminum alloys. J. Mater. Sci. 2001, 36, 2773–2786. [Google Scholar] [CrossRef]
- Paul, A.K.R.; Ramamurty, U. Strain rate sensitivity of a closed-cell aluminum foam. Mater. Sci. Eng. A Struct. Mater. Prop. Microstruct. Process. 2000, 281, 1–7. [Google Scholar] [CrossRef]
- Simonyan, K.; Zisserman, A. Very Deep Convolutional Networks for Large-Scale Image Recognition. arXiv 2015, arXiv:1409.1556. [Google Scholar]
- Srivastava, N.; Hinton, G.E.; Krizhevsky, A.; Sutskever, I.; Salakhutdinov, R. Dropout: A simple way to prevent neural networks from overfitting. J. Mach. Learn. Res. 2014, 15, 1929–1958. [Google Scholar] [CrossRef]
- Ioffe, S.; Szegedy, C. Batch Normalization: Accelerating Deep Network Training by Reducing Internal Covariate Shift. arXiv 2015, arXiv:1502.03167. [Google Scholar]
- Wan, J.; Jiang, J.-W.; Park, H.S. Machine learning-based design of porous graphene with low thermal conductivity. Carbon 2020, 157, 262–269. [Google Scholar] [CrossRef]
- Hanakata, P.Z.; Cubuk, E.D.; Campbell, D.K.; Park, H.S. Accelerated Search and Design of Stretchable Graphene Kirigami Using Machine Learning. Phys. Rev. Lett. 2018, 121, 255304. [Google Scholar] [CrossRef] [PubMed]


Disclaimer/Publisher’s Note: The statements, opinions and data contained in all publications are solely those of the individual author(s) and contributor(s) and not of MDPI and/or the editor(s). MDPI and/or the editor(s) disclaim responsibility for any injury to people or property resulting from any ideas, methods, instructions or products referred to in the content. |
© 2023 by the authors. Licensee MDPI, Basel, Switzerland. This article is an open access article distributed under the terms and conditions of the Creative Commons Attribution (CC BY) license (https://creativecommons.org/licenses/by/4.0/).