Abstract
The continuous tube-rolling method has been widely used to manufacture high-quality seamless pipes and tubes. However, the analytical model for determining the roll pitch diameter in three-roll continuous retained mandrel rolling from first principles has not yet been presented, which has, thus, hindered the development of rolling control technology in tube manufacturing. In this work, a new analytical model has been established from the force–equilibrium principles. The modelling has taken the tube-roll contact geometry, roll pressure, mandrel pull forces, inter-stand tensions, and friction coefficients into account for its formulations. Seen from the experimental results of the rolling at the plant, the maximum deviation of the predicted projected contact area is less than 6% and the maximum deviation of the calculated roll speed from the satisfactory data in field operation is less than 3.9%. The proposed model has enabled the influence of the friction coefficients on the roll pitch diameter to be quantified in theoretical analysis, and it was found that the changing amplitude of the theoretical roll pitch diameter corresponding to the commonly used data range of the friction coefficients can be above 9%. Having overcome the shortcomings of the empirical model, this model has the required prediction accuracy and flexibility for being applied to flexible tube rolling. By building the key algorithms around physical models, this modelling has advanced not only the rolling control at the plant, but also our scientific understanding of the mechanics of the continuous tube-rolling process.
1. Introduction
The continuous retained mandrel rolling method has been one of the most important hot forming processes to manufacture high quality seamless tubes which are widely used in industries, such as oil and gas, automotive, nuclear, and the transportation of high-pressure fluids. In a continuous retained mandrel mill, the tube is worked between a mandrel on the inside and two or three rolls on the outside while passing through the 5~7 consecutive stands, with the mandrel speed being retained at a constant speed during the rolling process. Due to the complexity of the three-dimensional characteristics of the deformation, the rolling process control parameters are calculated by using a rolling model. Along with the increasing competition in product markets, flexible tube rolling has been increasingly applied, aiming to maximizing the productivity of a given mill. In flexible rolling, maintaining the product consistency and quality is a widespread concern. The increasing demands for higher adaptability and flexibility in the tube rolling process have led to great efforts to improve the rolling model. However, in continuous retained mandrel rolling, the analytical model for determining the roll pitch diameter (i.e., the roll diameter where the tube speed is equal to the roll peripheral speed) has not yet been established, which has hindered the development of high efficiency rolling control technology.
To model certain physical phenomena occurring in the rolling, there are three commonly used methods, namely the finite element method (i.e., FEM), the analytical method, and the empirical method. Although the finite element models are not suitable for uses as rolling models for online rolling control because they require too much computational time to run the programs [1], their application in research work has indeed advanced our understanding of the complex nature of the continuous tube rolling process [2,3,4]. Sola et al. developed a three-dimensional FEM code to investigate the rolling process on a multi-stand pipe mill [5]. Li et al. investigated the influence of roll speed schedule on the transverse wall thickness evenness of the shell tube [6]. Yamamoto et al. investigated the effect of the roll-groove profile on the tube deformation in mandrel rolling by using rigid-plastic FEM [7]. The tube surface defect formation during the continuous mandrel rolling can be analyzed by using the FEM model [8,9]. Jiang et al. analyzed the forming parameter distributions and the kinematics of the hot rolled tubes through large deformation dynamic simulation using FEM [10]. Knapinski et al. improved the geometrical parameters of the roll groove to reduce the wear of the mill rolls through FEM simulation [11]. The FEM method has demonstrated its versality in quite a few previous investigations into continuous mandrel rolling. Although the FEM is not suitable for resolving the problem of the theoretical calculation of the roll pitch diameter in the initial roll speed setting, since it normally requires a series of the initial roll setting data beforehand to start its simulation, the previous research findings using FEM have verified the necessity of taking into account both physical and geometrical factors in the analytical modelling for the roll pitch diameter.
There have already been some reports on the analytical modelling of the tube stress distribution in the mandrel rolling process. Okamoto and Hayashi proposed an analytical model to assess the overfilling or underfilling of a given roll pass during the mandrel rolling process [12]. Some fundamental equations for the relationship of the stresses and strains have been presented in their theory, and application of their model has been reported. Frugen and Hayashi reported the application of Okamoto and Hayashi’s theory to the cold pilgering of tubes [13]. In these analytical models of tube rolling process, the tube outer profiles were assumed to be in full contact with the roll in the circumferential direction, so these models are not suitable for calculating the tube-roll contact geometry data for use in calculations of roll pitch diameter. Wei and Wu proposed an analytical model to determine the tube profile and stress distribution in three-roll continuous retained mandrel rolling [14]. Their model combined the tube profile prediction with the tube stress distribution prediction in the analytical modelling, making it convenient to further calculate the tube-roll contact geometry and contact pressure.
There are still few reports on the theoretical approach of calculating the tube-roll contact data in the mandrel rolling. Baines simulated the continuous mandrel rolling of hot steel tubes by rolling lead tubes under laboratory conditions [15]. In applying the energy method to estimate the roll separating force and torque, he concluded that the tube-roll contact data can only be estimated from experimental data as a result of substantial ‘piling-up’ of the outer tube surface prior to roll groove contact. This conclusion has demonstrated the complexity in calculating the tube-roll contact data. Firstly, this conclusion can also be understood from another perspective; when obtaining the tube-roll contact data by calculating it theoretically, the ‘piling-up’ of the outer tube surface (i.e., the distortion of the tube outer surface) should be taken into account during the calculations. Secondly, on further examination, it is found that his conclusion was drawn from the results of the close pass rolling (i.e., there is no gap between the tube inner diameter and the mandrel before rolling). However, in the normal rolling at the plant, there is always a gap between the tube inner profile and the mandrel before rolling at each pass. The distortion of the tube outer surface in the rolling at the plant might be far slighter than that in the close pass rolling. On the distortion of the tube outer surface during the rolling, a totally different conclusion was also found in the report of experimental investigation on the metal deformation in continuous tube-rolling process. Sobkowiak concluded that there is no circumferential metal flow during the continuous tube-rolling process based on the results of his experiments [16]. Thus, one thing is certain here, namely that due to the complexity of the tube deformation, in applying any model for calculating the tube-roll contact data, the reliability in the calculated results can only be assured under given conditions.
For determining the roll pitch diameter in three-roll continuous mandrel rolling, there has been no analytical model reported hitherto which takes into account the tube profile, roll pressure, inter-stand tensions, mandrel pull forces, frictional conditions, and tube-roll contact geometry in its formulation. With the problem of modelling the roll pitch diameter from first principles unsolved, the most commonly applied model to determine the roll pitch diameter in tube rolling at the plant is the empirical model. The SMS INNSE company provided a conventional empirical model for determining the roll pitch diameter in the rolling model for the premium quality finishing (i.e., PQF, a kind of three-roll continuous retained mandrel rolling mill) [17], in which the roll pitch diameter is obtained as follows:
where Drpd is the roll pitch diameter; erpd is an experimental coefficient which is specific for each stand and mandrel; Dn is the roll nominal diameter; d is the actual size of the roll pass.
From the equation of the empirical model, it can be found that none of the physical influential factors have been taken into account in its formulation. In the practical application, after the experimental coefficients erpd are assigned to each stand, calculation of the roll pitch diameter is only related to the geometry data of the rolling tools. These treatments cannot satisfy the new requirements in the developments of rolling control technology. In flexible rolling, it is necessary to assign the inter-stand tension states in the roll passes to control the rolled defects. Determining the roll pitch diameter without assessing any inter-stand tensions in the rolling can obviously increase the difficulties of adjusting the roll setting data in field operation. In multi-length rolling, the shell tubes with significantly greater wall thickness can be used to produce the longer finished tubes, meaning that a given set of rolling tools can be used in the rolling with various rolling schedules in field operation. In this case, the roll pitch diameters calculated by using the empirical model may lead to obvious deviation of the roll setting. To overcome the shortcomings of the empirical models in flexible rolling and multi-length rolling, a new analytical model for determining the roll pitch diameter in mandrel rolling is greatly required.
This paper deals with the analytical modelling of the roll pitch diameter in three-roll continuous retained mandrel rolling. In this modelling, the formulation of the fundamental equations for roll pitch diameter has taken into account the tube-roll contact geometry, roll pressure, inter-stand tensions, mandrel pull forces, and frictional conditions. The prediction accuracy of the model was examined by using the model to supply the roll setting data for rolling schedules at the plant. Furthermore, the influence of frictional conditions between tube and rolling tools on the roll pitch diameter was theoretically investigated, and the comparison between the proposed model and the conventional empirical model was performed.
2. Modelling Work
2.1. Tube Profile and Tube Stress Data Needed for Further Calculations
The tube profile and tube radial stress data in the rolling process are needed here for use in further calculations of the roll pitch diameter. Since Wei and Wu have proposed an effective analytical model for predicting the tube profile and tube stress distribution in three-roll continuous retained mandrel rolling [14], their model is used as a sub-model here to supply the needed tube profile and tube radial stress data. Theoretically, so long as the provided data has the required accuracy, the data provided by any mathematical model can work in the calculations of roll pitch diameter.
2.2. Modelling for Tube-Roll Contact Geometry
Once the tube profile of incoming tube and outgoing tube at each pass is determined, the modelling of tube-roll contact geometry can be taken as more of a space analytic geometry problem than a complicated plastic deformation problem. This is because the starting point of tube-roll contact and the point where the tube detached from the roll at the outlet plane have located the tube-roll contact boundary in some degree. Although the tube-roll contact occurs non-simultaneously and non-planarly in the roll-bite, its formation can be simplified into two deformation stages. The first stage is that the oval-like profile of the incoming tube is squashed to a circular-like profile under the roll pressure. The second stage is that the circular-like profile of the tube is further worked into the oval-like profile of the outgoing tube. The tube-roll contact at the first pass can be taken as only having undergone the second stage.
Corresponding to these two deformation stages, the tube-roll contact boundary formed at the first stage can be assumed to be the space intersection curve of the tube flange surface and the roll surface, and the tube-roll contact boundary formed at the second stage can be assumed to be the space intersection curve of the roll surface and the cylinder which has an outer circumference equal to that of the incoming tube (see Figure 1).
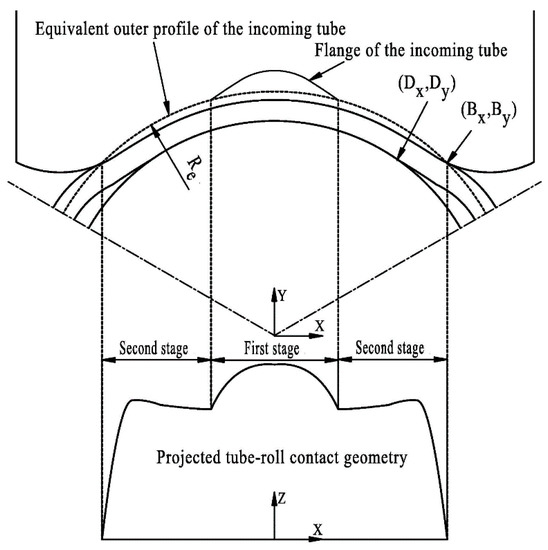
Figure 1.
The two assumed formation stages of the tube-roll contact boundary.
Since the tube profile and the roll groove profile are composed of circular arcs, the solution for the tube-roll contact geometry can be transformed into a space analytic geometry problem. For the contact boundary formed corresponding to the first stage (see Figure 2), the projected contact length L at a given x-coordinate can be calculated as follows:
where Rx is the roll radius at the given x-coordinate; Rn is the roll nominal radius (i.e., the distance from the roll axis to the rolling centerline); Rt is the radius of the tube flange profile; Xt is the x-coordinate of the center point of the tube profile; Yt is the y-coordinate of the center point of the tube profile.
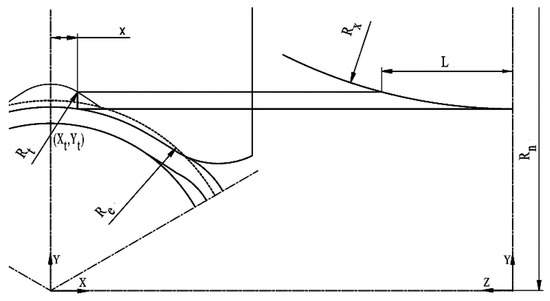
Figure 2.
Geometrical relationship on the contact length corresponding to the first formation stage.
For the contact boundary formed corresponding to the second stage (see Figure 3), the projected contact length L can be calculated as follows:
where Re is the radius of the equivalent cylinder.
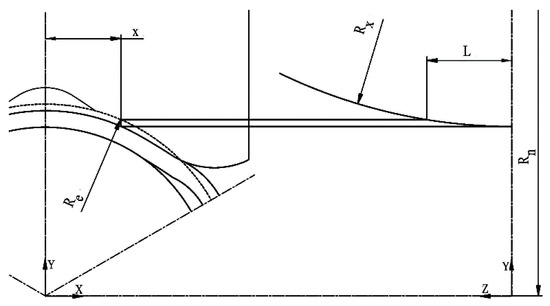
Figure 3.
Geometrical relationship for the contact length corresponding to the second formation stage.
Prediction of the projected contact area is an essential part of the calculation of roll separating force. Corresponding to the direct deformation zone deformed under the pressure of the roll and the mandrel, the projected contact area can be calculated as follows:
Corresponding to the intermediate deformation zone deformed under the pressure of the roll but with no contact with the mandrel, the projected contact area can be calculated as follows:
2.3. Equation for Roll Separating Force
The roll separating force F at a given roll can be calculated as follows:
where is the mean outer radial stress in direct deformation zone; is the mean outer radial stress in intermediate deformation zone.
The calculated roll separating force can be used to estimate the elastic deformation of roll housing during the rolling for setting roll gap compensations. It can also be used as the checking data for an assigned rolling schedule.
2.4. Fundamental Equations for the Roll Pitch Diameter
In continuous retained mandrel rolling, the roll pitch diameter is the roll diameter where the tube speed is equal to the roll peripheral speed. Obviously, the distribution of tube-roll relative speed on the roll surface determines the roll pitch diameter. For any given distribution of tube-roll relative speed, there is a corresponding distribution of the frictional force on the roll surface and, thus, a corresponding total resultant force acting by the roll in the rolling direction. Therefore, the fundamental equations for the roll pitch diameter can be formulated from the mechanical relationship equations for the external forces on the tube in the rolling direction.
In the calculations, with a supposed value of the roll pitch diameter at the stand outlet plane, the roll rotational speed can be obtained as follows:
where Vrpm is the roll rotational speed; Drpd is the roll pitch diameter; Vi is the tube speed at the i-th stand outlet; Ai is the tube cross-sectional area at the i-th stand outlet.
The tension at a given stand outlet corresponding to the given roll rotational speed can be calculated theoretically and then compared with the assigned tension value for rolling control.
2.4.1. Mechanical Relationship on One Unit Width of the Contact Arc
For each deformation zone, assuming that the radial stress on the tube outer surface σrb is uniform on the projected contact arc, the equation for the relationship between the roll pressure Pz and the average radial stress σrb (see Figure 4) can be obtained as follows:
where αz is the nip angle at a given point on the contact arc; μ is the tube-roll frictional coefficient.
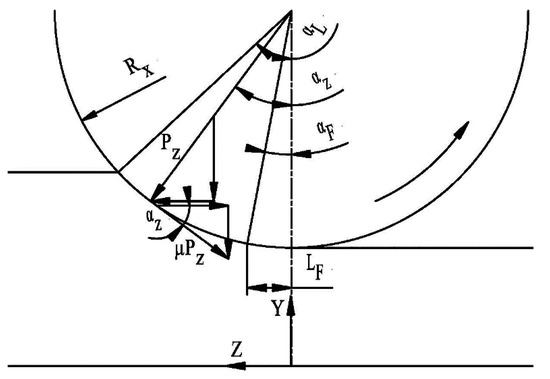
Figure 4.
The forces acting on one unit width of the contact arc.
Considering the value of (μ sin αz) is quite small, to simplify the calculation, the roll pressure Pz can be approximately obtained as follows:
On one unit width of the contact arc, the resultant force on the contact arc in the rolling direction can be obtained as follows:
where αL is the nip angle of the total contact arc; αF is the nip angle of the contact arc where the metal forward slip exists; δ is the arc length of the tube profile corresponding to one unit width in the x-axis direction.
Substituting Equation (9) to Equation (10), after the integral operation, the equation can be obtained as follows:
where
2.4.2. Determination of the Neutral Angle on A Given Contact Arc
To determine the neutral angle (i.e., αF shown in Figure 5), the tube cross-sectional area AF corresponding to an assumed neutral point should be first calculated. At the i-th pass, the tube cross-sectional area AF can be approximately calculated as follows:
where Ai is the tube cross-sectional area at the i-th stand outlet, AF is the tube cross-sectional area corresponding to the assumed neutral point position.
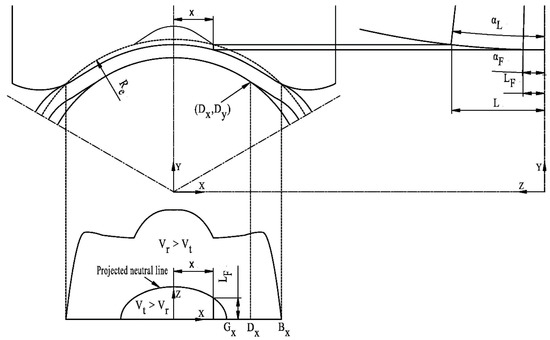
Figure 5.
Geometrical relationship on the contact arc where both the metal forward slip and the metal backward slip exist.
At the position of the neutral point on a given contact arc, the equation for the tube speed Vt in the rolling direction can be obtained as follows:
Corresponding to the same position of the neutral point, the equation for the separating speed in the rolling direction of the roll peripheral speed can be obtained as follows:
Combining Equations (13) and (14), the neutral angle on a given contact arc αF can be determined by satisfying the speed condition equation as follows:
2.4.3. Equations for the Force–Equilibrium in the Rolling Direction
At each given pass, the total resultant force acting by three rolls in the rolling direction can be obtained as follows:
where
where Ftotal is the total resultant force acting by three rolls in the rolling direction; F1 is half of the resultant force acting by the roll in the direct deformation zone where Vt > Vr; F2 is half of the resultant force acting by the roll in the direct deformation zone where Vt < Vr; F3 is half of the resultant force acting by the roll in the intermediate deformation zone where Vt < Vr; Gx is the x-coordinate of the neural point at the outlet plane.
Then in the rolling direction, the equation for the force–equilibrium of the external forces acting on the tube at the given pass can be expressed as follows:
where Fmpi is the mandrel pull force in the roll-bite, Fmpo is the mandrel pull force at stand outlet, Fti is the tension at stand inlet, and Fto is the tension at stand outlet.
It is worth mentioning that the mandrel pull forces Fmpi and Fmpo can be obtained by using Wei and Wu’s equations [14]; for the first roll pass, the tension at stand inlet Fti is equal to zero, and the tension at stand outlet Fto is assigned beforehand as the rolling control data; for the subsequent roll passes, the tension at stand inlet Fti is equal to the value of Fto at the previous roll pass, and the tension at stand outlet Fto is assigned beforehand as the rolling control data.
2.5. Implementation of the Model
The proposed model has been implemented into a computer application to supply the setting data and checking data for an assigned rolling schedule. To determine the roll pitch diameter in the model, the end condition of the iterative calculations is that the calculated tension at the stand outlet is equal to the assigned value. The related calculations are conducted by following the flowchart as shown in Figure 6.
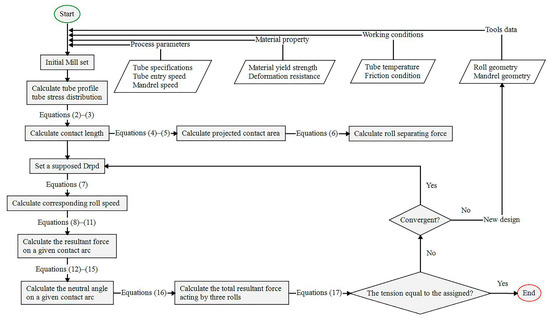
Figure 6.
Flowchart of the related calculations in the implementation of the model.
For the convenience of checking the results, the calculated tube-roll contact boundary and metal slip distribution can be visualized by a computer application developed by using a free IDE named Lazarus 2.0.10 (see Figure 7) [18].
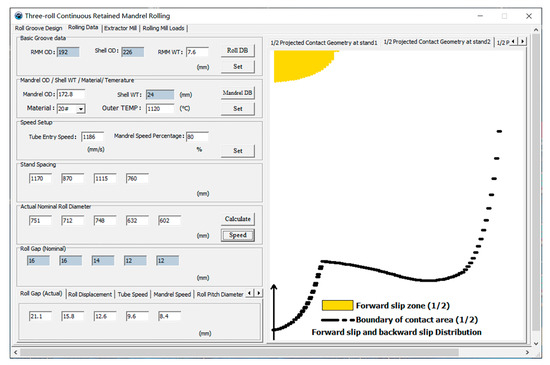
Figure 7.
The visualized tube-roll contact boundary and metal slip distribution.
3. Validation and Discussion
3.1. Validation of the Tube-Roll Contact Geometry Model
The tube specimen for measurements of the tube-roll contact geometry was obtained by a deliberate emergency stop of a five-stand three-roll mandrel mill, when the rolling was at the steady normal rolling state with no obvious inter-stand traction being observed from the roll force curves in field operation. The primary processing parameters in the experimental rolling schedule is shown in Figure 7, and the geometry of the grooved roll used in experimental rolling is shown in Figure 8.
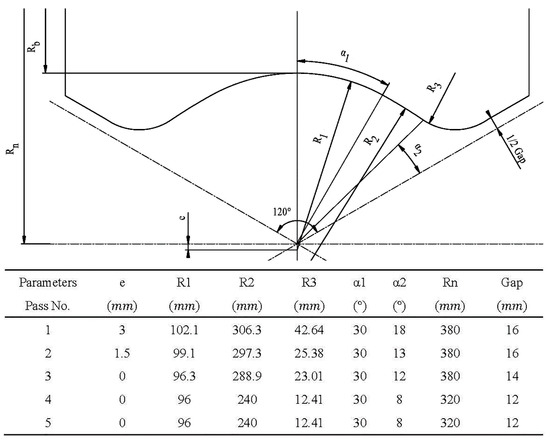
Figure 8.
Geometry of grooved roll used in experimental rolling.
The tube-roll contact geometries were located by the positions of the outlet plane which can be calibrated according to the stand spacing values of the mill (see Figure 9).
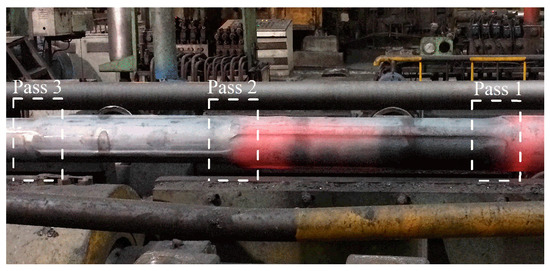
Figure 9.
Shape of the tube-roll contact boundary on the specimen tube corresponding to the mill stand positions of pass 1–pass 3.
The contact lengths were manually measured three times, and mean values were taken to determine the projected contact geometry. A comparison of the measured and predicted projected tube-roll contact boundary is shown in Figure 10.
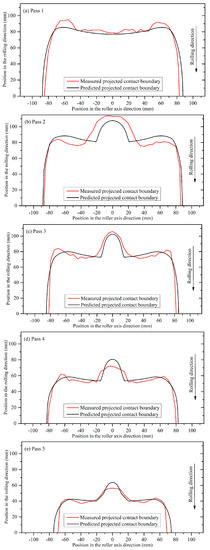
Figure 10.
Comparison of the measured and predicted projected tube-roll contact boundary. (a) Pass 1, (b) Pass 2, (c) Pass 3, (d) Pass 4, and (e) Pass 5.
From the comparison, it can be found that the basic characteristic of the contact boundary at the first pass is different from those of the subsequent passes. The starting point of tube-roll contact is on the roll flange at the first pass, and the starting points of tube-roll contact in the subsequent passes are at the roll groove bottom.
For the first pass, as shown in Figure 10a, the predicted contact boundary is quite similar to the measured one. This means that, in the case of the tube outer profile at the stand inlet being like a standard circle, the deviation in the calculated data from the measured is not obvious. For the subsequent rough rolling passes, as shown in Figure 10b,c, the actual contact lengths around the roll groove bottom are longer than the calculated ones, while those around the roll flanges are basically shorter than the calculated ones. This means that although the incoming tube was firstly compressed under the pressure of the roll groove bottom (i.e., the long shaft of the oval-like profile of the incoming tube was firstly shortened), the short shaft of the oval-like tube profile has not been elongated as much as calculated. For the finishing passes, as shown in Figure 10d,e, the deviations in the calculated data from the measured are quite limited. In general, the maximum deviation of the calculated projected tube-roll contact area from the measured is less than 6%, as shown in Table 1. The accuracy of the calculated results indicated that the calculated contact data using the tube-roll geometry model are suitable for use in further calculations.

Table 1.
Comparison of the predicted projected contact area and the measured values.
3.2. Validation of the Roll Pitch Diameter Model in Field Operation
The validity of the modelling for the roll pitch diameter was examined by applying the calculated roll setting data in the actual rolling at a three-roll continuous retained mandrel mill which has six consecutive stands. With the roll gaps assigned beforehand corresponding to the assigned rolling reduction, the roll pitch diameters for the assigned rolling schedules were calculated by using the proposed model. The roll rotational speeds corresponding to the calculated roll pitch diameters were calculated and applied to the rolling as the roll setting data. In this case, the validity of the model can be examined by comparing the calculated roll rotational speed with the satisfactory actual roll rotational speed in field operation (see Figure 11).
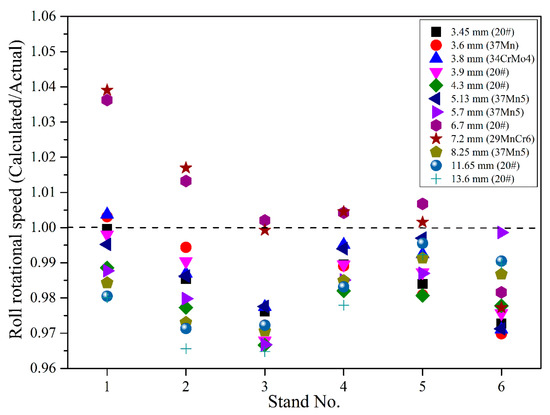
Figure 11.
Comparison of the calculated and the actual roll rotational speed in field operation.
As can be seen from the comparison, the calculated results agreed well with the satisfactory actual roll rotational speed in field operation. In the involved experimental rolling cases, the maximum additional adjustment of the roll rotational speed in field operation was 3.9%, i.e., the maximum ratio of the calculated Vrpm to the actual satisfactory Vrpm in field operation is 1.039, which is at the roll pass 1 corresponding to the rolling schedule, with the finished tube wall thickness being 7.92 mm and the steel grade being 29MnCr6 (see Figure 11).
To examine the calculated data in more detail, a calculation example is given here, where the primary input data and calculated results of the calculation are presented in Table 2.
Table 2.
Primary data of a calculation example.
Corresponding to the steel grade of tube material assigned in the rolling schedule, the deformation resistance necessary for the calculations is obtained by using the deformation resistance model of 37Mn5 steel [19]. Comparisons of the calculated results of the roll force and roll speed in the calculation example with the actual satisfactory rolling data in field operation are presented in Table 3.
Table 3.
Comparisons of the calculated roll force and roll speed with the actual data.
From the comparison shown in Table 3, it can be found that the roll rotational speed calculated by using the proposed model agreed very well with the actual satisfactory roll setting data. Meanwhile, the maximum data error of the calculated roll separating forces corresponding to pass 1–pass 5 was only 10.2%, i.e., the roll force data error at pass 4 as shown in Table 3. The roll force at pass 6 can be left out of discussion here, because the traction on the tube acting by the extractor mill at the mill outlet has significant influence on the actual roll force value.
This result indicated that the inter-stand tensions in the rolling were basically consistent with the assigned values. From all the above results, it can be concluded that the validity of the modelling for the roll pitch diameter has been experimentally verified.
Furthermore, it is found that the maximum deviation of the calculated roll speed from the satisfactory setting data in field operation is obviously lower than the maximum deviation of the calculated total projected contact area from the measured. The cause of this phenomenon can be explained based on the calculated data shown in Table 2. According to the calculated data in Table 2, the ratio of to is in the range of 56.7 to 1062, while the ratio of to is in the range of 4.7 to 7.6. These calculated ratios indicate that it is the contact pressure and contact geometry corresponding to the direct deformation zone that mostly determines the total resultant force acting by the roll in the rolling direction and, thus, the calculated results of roll pitch diameter, rather than the average roll pressure and the total contact area in the roll-bite. Thus, in applying the tube-roll contact geometry model to the calculations of roll pitch diameter, so long as the calculated contact data corresponding to the direct deformation zone has required accuracy, deviations in the calculated contact data corresponding to the intermediate deformation zones will not significantly reduce the prediction accuracy of the roll pitch diameter.
3.3. Influence of Various Friction Coefficients on the Calculated Results of the Roll Pitch Diameter
Considering that the actual friction coefficients vary with different contact conditions of the tube and rolling tools, it is necessary to examine the influence of frictional coefficients on the calculated results of the roll pitch diameter.
By substituting different tube-roll frictional coefficients which are in a commonly used data range into the equations, the corresponding calculated results of the roll pitch radius (i.e., half of the roll pitch diameter) can be obtained (see Figure 12).
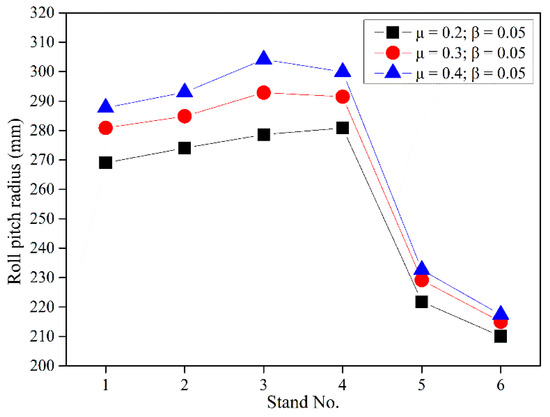
Figure 12.
Calculated roll pitch radius with various tube-roll frictional coefficients.
Through further calculations based on the results shown in Figure 12, it can be found that the maximum changing amplitude of the theoretical roll pitch diameter corresponding to the commonly used data range of the tube-roll friction coefficients is at pass 3. To be precise, the maximum ratio of the maximum roll pitch diameter to the minimum roll pitch diameter at pass 3 is 1.092. This result indicates that the tube-roll frictional coefficients have a significant effect on the calculated results of the roll pitch diameter. Thus, to decrease the additional adjustments of roll setting in field operation, the tube-roll coefficients used in the equations should be assigned properly. By substituting different tube-mandrel frictional coefficients which are in the commonly used data range into the equations, the corresponding calculated results of the roll pitch radius can also be obtained (see Figure 13).
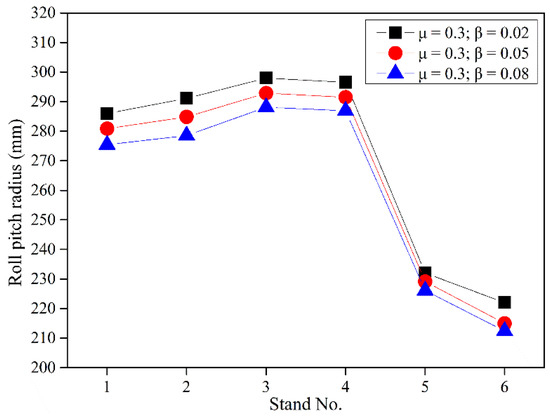
Figure 13.
Calculated roll pitch radius with various tube-mandrel frictional coefficients.
By comparing the data shown in Figure 13 with those shown in Figure 12, it can be found that, within the commonly used data range, the tube-mandrel friction coefficients have relatively smaller effect on the calculated results of the roll pitch diameter than the tube-roll frictional coefficients. The maximum changing amplitude of the theoretical roll pitch diameter corresponding to the enumerated tube-mandrel friction coefficients can be above 4.5%.
In general, the proposed modelling has enabled the influence of various frictional conditions on the roll pitch diameter to be quantified in the theoretical analysis. In applying the proposed model to the actual hot steel tube rolling, the appropriate values of the friction coefficient should be substituted in the calculations. The maximum changing amplitude of the theoretical roll pitch diameter corresponding to the commonly used data range of the friction coefficients can be above 9%.
3.4. Comparison of the Proposed Model and the Conventional Empirical Model
Because of the complexity in the analysis of the physical system of continuous retained mandrel rolling, the empirical model has been widely used in tube manufacturing rather than the analytical model for determining the roll pitch diameter. The most commonly used empirical model was formulated as Equation (1), in which the experimental coefficient was assigned specifically for each stand and mandrel. Corresponding to the experimental pitch coefficients, to compare the proposed analytical model with the conventional empirical model conveniently, the so-called theoretical pitch coefficients can be conversely calculated by using the analytically calculated data of the roll pitch diameter and Equation (1).
For rolling the finished tube with the same outer diameter at the same rolling mill, the initially used experimental pitch coefficients at the plant and some calculated theoretical pitch coefficients are shown in Figure 14.
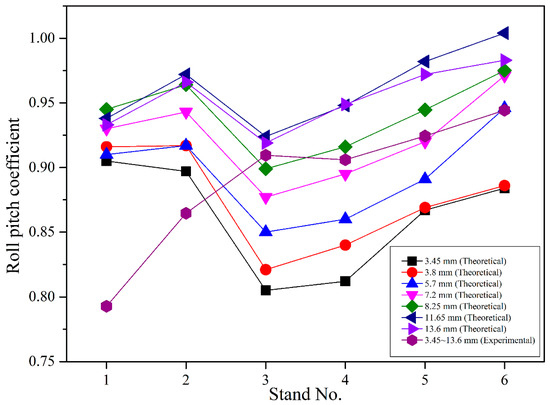
Figure 14.
Comparison of theoretical and initially used experimental pitch coefficients.
From the comparison of different sets of theoretical pitch coefficients shown in Figure 14, it is found that the distributions of theoretical pitch coefficients are with a certain regularity, i.e., the theoretical pitch coefficients basically vary with the wall thickness of the finished tube. From the comparison of the theoretical pitch coefficients at different passes in a given set, it can be found that the pitch coefficients vary with the stand numbers. These two results indicate that there is certain rationality in assigning the pitch coefficients corresponding to each stand and mandrel in the empirical modelling. However, from the comparison of theoretical and initially used experimental pitch coefficients, it is found that the initially used experimental pitch coefficients have obvious deviations from the theoretical pitch coefficients. This means that the initially used experimental pitch coefficients have to be modified through quite a few of hot rolling experiments to make the rolling reach the satisfactory state. This case is certainly unsatisfactory.
Obviously, shortcomings of the conventional empirical model can be overcome by using the proposed analytical model. In flexible rolling, when the inter-stand tensions are required to be assigned beforehand to minimize the rolled defects, the corresponding roll pitch diameters for the assigned rolling schedule can be calculated theoretically by using the proposed model. In multi-length rolling, when the shell tubes with a significantly greater wall thickness are used to produce a longer finished tube, the roll pitch diameters can also be calculated theoretically. For the development of new technology in process control, the proposed model has provided a sound theoretical basis which the empirical model has not.
4. Conclusions
- The tube-roll contact geometry in three-roll continuous retained mandrel rolling has been modelled from 3D analytic geometry principles. The model can be used to calculate the contact data necessary for the further analytical calculations of roll pitch diameter under limited conditions. According to the experimental results, the maximum deviation of the calculated total projected contact area is less than 6%;
- The analytical model for determining the roll pitch diameter has been established from force–equilibrium principles. The formulation of the fundamental equations has taken into account the tube-roll contact geometry, roll pressure, inter-stand tensions, mandrel pull forces, and frictional conditions. The roll setting data calculated by using the model have been examined through actual rolling at the plant. With the maximum deviation of the calculated data from the satisfactory data in field operation being less than 3.9%, it can be concluded that the validity of the proposed model has been experimentally verified;
- In applying the proposed model to the actual hot steel tube rolling, the appropriate values of the friction coefficient should be substituted in the calculations. The maximum changing amplitude of the theoretical roll pitch diameter corresponding to the commonly used data range of the friction coefficients can be above 9%;
- Having overcome the shortcomings of the conventional empirical model, the proposed model has the required prediction accuracy and flexibility to be used in flexible tube rolling;
- By building the key algorithms around physical models, this modelling has not only provided a sound theoretical basis for developments in rolling control technology but has also advanced our scientific understanding of the mechanics of continuous retained mandrel rolling process.
Author Contributions
Conceptualization, methodology, software, validation, formal analysis, investigation, writing—original draft preparation, Z.W.; writing—review and editing, C.W. All authors have read and agreed to the published version of the manuscript.
Funding
This research received no external funding.
Data Availability Statement
Not applicable.
Acknowledgments
The authors would like to thank the Shandong Molong Petroleum Machinery Co., Ltd. (Shouguang, China) and Heilongjiang Jianlong Iron and Steel Co., Ltd. (Shuangyashan, China) for their support in the investigation.
Conflicts of Interest
The authors declare no conflict of interest.
Nomenclature
| Ai | tube cross-sectional area at the i-th stand outlet; |
| projected contact area corresponding to direct deformation zone; | |
| projected contact area corresponding to intermediate deformation zone; | |
| Bx | x-coordinate of the detaching point on the roll; |
| d | actual size of roll pass; |
| Dn | roll nominal diameter; |
| Drpd | roll pitch diameter; |
| Dx | x-coordinate of the detaching point on the mandrel; |
| erpd | pitch coefficient of roll pitch diameter; |
| f | resultant force on a given contact arc in the rolling direction; |
| F | roll separating force; |
| F1 | half of the resultant force acting by the roll in the direct deformation zone where Vt > Vr; |
| F2 | half of the resultant force acting by the roll in the direct deformation zone where Vt < Vr; |
| F3 | half of the resultant force acting by the roll in the intermediate deformation zone where Vt > Vr; |
| Fmpi | mandrel pull force in the roll-bite; |
| Fmpo | mandrel pull force at the stand outlet; |
| Fti | tension force at the stand inlet; |
| Fto | tension force at the stand outlet; |
| Ftotal | total resultant force acting by three rolls in rolling direction; |
| Gx | x-coordinate of the point where Vt = Vr at the outlet plane; |
| i | number of roll pass; |
| L | projected contact length; |
| Pz | roll pressure on the contact arc; |
| Re | equivalent cylinder radius of incoming tube; |
| Rm | mandrel radius; |
| Rn | roll nominal radius; |
| Rr | roll groove arc radius; |
| Rt | tube flange profile radius; |
| Rx | roll radius at the given x-coordinate; |
| Xr | x-coordinate of groove arc center; |
| Yr | y-coordinate of groove arc center; |
| Xt | x-coordinate of tube profile center; |
| Yt | y-coordinate of tube profile center; |
| Vi | outgoing tube speed at the i-th pass; |
| Vr | separating speed of roll peripheral speed; |
| Vt | tube speed in the rolling direction; |
| Vrpm | roll rotational speed. |
| Greek letters | |
| αF | nip angle of the contact arc where the metal forward slip exists; |
| αL | nip angle of the total contact arc; |
| αz | nip angle at a given point on the contact arc; |
| δ | arc length of the tube profile corresponding to one unit width in the x-axis direction; |
| mean outer radial stress in direct deformation zone; | |
| mean outer radial stress in intermediate deformation zone. | |
References
- Lee, Y.; Kim, Y.H. Approximate analysis of roll force in a round-oval-round pass rolling sequence. J. Mater. Process. Technol. 2001, 113, 124–130. [Google Scholar] [CrossRef]
- Vacance, M.; Massoni, E.; Chenot, J.L.; Rovelli; Cumino; Lubrano. Multi stand pipe mill finite element model. J. Mater. Process. Technol. 1990, 24, 421–430. [Google Scholar] [CrossRef]
- Yamada, K.; Ogawa, S.; Hamauzu, S.; Kikuma, T. Three-dimensional analysis of mandrel rolling by rigid-plastic finite element method. Sanjigen Gososei Yugen Yosoho Ni Yoru Mandrel Atsuen No Kaiseki. Shinnettetsu Giho 1991, 342, 9–13. [Google Scholar]
- Cavaliere, M.A.; Goldschmit, M.B.; Dvorkin, E.N. Finite element analysis of steel rolling processes. Comput. Struct. 2001, 79, 2075–2089. [Google Scholar] [CrossRef]
- Sola, G.; Vacance, M.; Massoni, E.; Chenot, J.L. Thermomechanical simulation of seamless tube rolling using a 3D finite element method. J. Mater. Process. Technol. 1994, 45, 187–192. [Google Scholar] [CrossRef]
- Li, S.Z.; Zhang, Z.C.; Bao, H.Y.; Zhou, Z.Y. Influence of roll speed schedule on transverse wall thickness evenness of shell elongated by mandrel mill. Mater. Sci. Forum 2010, 654, 1311–1314. [Google Scholar] [CrossRef]
- Yamamoto, S.; Yamada, K.; Hamauzu, S.; Masuda, I.; Ozak, T. Effect of roll-groove profile on tube deformation in single-stand mandrel rolling. J. Jpn. Soc. Technol. Plast. 1999, 40, 1076–1080. [Google Scholar]
- Li, S.Z.; Jie, X.; Yin, Y.D.; Xue, J.G.; Yuan, F. Mechanism of internal surface crack formation of seamless modified 9Cr-1Mo steel tube rolled by mandrel mill and its application. J. Iron Steel Res. Int. 2007, 14, 273–276. [Google Scholar] [CrossRef]
- Toporov, V.A.; Ibragimov, P.A.; Panasenko, O.A.; Nukhov, D.S.; Khalezov, A.O. Mathematical model for continuous tube rolling and the effect of technological factors on surface defect formation. Russ. Metall. 2020, 2020, 1632–1636. [Google Scholar] [CrossRef]
- Jiang, Y.; Tang, H.; Zhang, X.P. Rotation mechanics and numerical simulation of hot rolling process under asymmetric rolls. Int. J. Mech. Sci. 2019, 151, 785–796. [Google Scholar] [CrossRef]
- Knapinski, M.; Bobarikin, Y.L.; Radkin, Y.I. The rolling tool development in order to improve the geometry of a tube profile and to reduce the wear of mill rolls. New Trends Produc. Eng. 2019, 2, 321–330. [Google Scholar] [CrossRef]
- Okamoto, T.; Hayashi, C. Theory of plasticity on mandrel rolling. In Proceedings of the International Conference on the Science and Technology of Iron and Steel; Iron and Steel Institute of Japan: Tokyo, Japan, 1971; pp. 655–658. [Google Scholar]
- Furugen, M.; Hayashi, C. Application of the theory of plasticity of the cold pilgering of tubes. J. Mater. Process. Technol. 1984, 10, 273–286. [Google Scholar] [CrossRef]
- Wei, Z.H.; Wu, C.J. A new analytical model to predict the profile and stress distribution of tube in three-roll continuous retained mandrel rolling. J. Mater. Process. Technol. 2022, 302, 117491. [Google Scholar] [CrossRef]
- Baines, K. Lead as a model material to simulate mandrel rolling of hot steel tube. J. Mater. Process. Technol. 2001, 118, 422–428. [Google Scholar] [CrossRef]
- Sobkowiak, P. Experimental investigation on the states of strain and stress occurring in the metal during the continuous tube-rolling process. J. Mater. Process. Technol. 1996, 61, 347–353. [Google Scholar] [CrossRef]
- Yan, Z.S. Modern Continuous Hot-rolling Production of Seamless Steel Tubes and Pipes, 1st ed.; Metallurgical Industry Press: Beijing, China, 2009; pp. 117–118. [Google Scholar]
- Lazarus Home Page. Available online: https://www.lazarus-ide.org/index.php (accessed on 23 December 2020).
- Wang, X.M.; Hong, H.P.; Wang, M.; Ma, C.Q.; Cheng, Z.; Liang, P.X. High temperature deformation resistance model and dynamic recrystallization kinetics model of 37Mn5 steel. J. Wuhan Univ. Sci. Technol. 2010, 5, 497–500. [Google Scholar]
Disclaimer/Publisher’s Note: The statements, opinions and data contained in all publications are solely those of the individual author(s) and contributor(s) and not of MDPI and/or the editor(s). MDPI and/or the editor(s) disclaim responsibility for any injury to people or property resulting from any ideas, methods, instructions or products referred to in the content. |
© 2023 by the authors. Licensee MDPI, Basel, Switzerland. This article is an open access article distributed under the terms and conditions of the Creative Commons Attribution (CC BY) license (https://creativecommons.org/licenses/by/4.0/).