Article

Numerical Simulation of Microstructure Evolution of Directionally Annealed Pure Iron by Cellular Automata

1
Institute of Metal Research, Chinese Academy of Sciences, Shenyang 110016, China
2
School of Materials Science and Engineering, University of Science and Technology of China, Shenyang 110016, China
*
Authors to whom correspondence should be addressed.
Metals 2023, 13(2), 368; https://doi.org/10.3390/met13020368
Submission received: 13 January 2023 / Revised: 9 February 2023 / Accepted: 9 February 2023 / Published: 11 February 2023

Abstract

:
In order to understand the effects of drawing velocity, initial grain size and texture on the microstructure evolution during directional annealing, a cellular automata model based on grain boundary (GB) curvature, GB energy and GB mobility was established with a modified calculation model of the GB curvature. The simulation results show that there is a lower limit and an upper limit to the drawing velocity for the formation of columnar grains, and the columnar grains can only be formed between the upper limit and the lower limit. The simulation results are consistent with the experimental results. When the drawing velocity is lower than the lower limit, the equiaxed grains grow at the front of the hot zone, which hinders the formation of the columnar grains. With the increase of initial grain size, the driving force of GB migration decreases, and the grain boundaries are difficult to move with the hot zone, which is not conducive to the formation of columnar grains. There is an upper limit of initial grain size for the formation of columnar grains. The abnormal growth induced by texture prevents the growth of columnar grains during directional annealing. The weaker the texture strength, the more conducive to the growth of columnar grains.

1. Introduction

Directional annealing, also known as directional recrystallisation, is a heat-treatment process in which a moving hot zone with sharp temperature gradient traverses a specimen. It has been used to produce columnar grain structures or single crystals for superalloys, especially the oxide dispersion strengthened iron-based and nickel superalloys in the aerospace industry [1,2]. The evolution of columnar grain structures during directional annealing has drawn attention in recent decades because columnar grain structures can enhance creep properties, improve low-cycle fatigue resistance and exhibit crack-stopping behaviors [3]. Several advanced characterization techniques such as high-energy X-ray diffraction microscopy have been applied to the direct observation of grain structure [4]. However, it is difficult to experimentally track the evolution of the columnar grain structure and analyze the impacts of various factors on the migration of grain boundaries.
The microstructure evolution during directional annealing is determined by two different types of parameters [1]. One is the processing parameters such as drawing velocity, annealing temperature and temperature gradient ahead of the hot zone. Zhang et al. [5] pointed that the withdrawing velocity had a significant effect on the formation of columnar grains in pure iron, and that there is an optimum drawing velocity that produces columnar grains with the highest grain aspect ratio at a fixed annealing temperature. The optimum drawing velocity also exists in Fe-Mn-Al-Ni and high-purity nickel [6,7]. For the temperature gradient and annealing temperature, a sharp temperature gradient is needed to avoid grain growth ahead of the hot zone. There is a lower temperature limit for columnar grains formation in most research on directional annealing [1]. The other is the microstructural parameters, which include the initial grain size, texture, insoluble particles and soluble particles. Zhang et al. [8] found that texture hinders the columnar grain growth, because there are many low angle or twin boundaries between the columnar grains and equiaxed grains with recrystallized textures at the front of the columnar grains. There are few studies on the effect of initial grain size on columnar grain growth during directional annealing. Hotzler et al. [9] found that there was an upper limit of initial grain size for formation of columnar grains in oxide dispersion strengthened superalloy MA 6000E due to the reduction in the driving force of GB migration from GB energy at larger grain sizes. The microstructure of materials containing insoluble particles after directional annealing is closely related to the distribution of insoluble particles. For hot-extruded ODS MA 754 with oxide particles aligned along the hot extrusion direction, the growing direction of columnar grains is consistent with the arrangement of particles and is not affected by the direction of directional annealing [10]. For soluble particles, Yang et al. [11] found that particle dissolution is a prerequisite for columnar formation in Ni-Al alloys.
With the development of computer technology, numerical methods have been widely used to simulate the microstructure evolution during material processing [12,13]. For directional annealing, there are several numerical models to simulate its microstructure evolution, such as Monte Carlo models, front-tracking models and phase field models. Holm et al. [14] confirmed that columnar grains can form from textured material during directional annealing using the Monte Carlo model with Gaussian temperature gradient. The main problem with Monte Carlo models is that it is difficult to establish an accurate relationship between real time and simulation time. Badmos et al. [15] systematically researched the grain structure evolution under different drawing velocities and hot zone widths using the front-tracking model. They found that there was an upper limit of drawing velocity for columnar grains formation and increasing the hot zone width was benefited to columnar grain growth. Wei et al. [16] simulated the grain growth with a moving temperature gradient using the phase field model, columnar grains can be formed when drawing velocity is between the minimum and maximum grain growth rates. Both phase field model and front-tracking model require significant computational resources for microstructure evolution simulation.
The cellular automata (CA) model is a sharp interface model. It can be used to simulate the influence of GB structure, GB energy, GB mobility and temperature field on the GB velocity with a higher computational efficiency [17]. The CA model has been widely used in the simulation of solidification, phase transformation, recrystallization and grain growth behavior in recent years [18,19]. In the simulation of grain growth, most papers focus on the improvement of the GB structure model and curvature model, and analyze the grain growth kinetics, grain size distribution and topological aspects. Regarding the GB structure model, Johnson et al. used Euler angles to represent different grain orientations rather than integers, and accurately described GB structure by the misorientation between the adjacent grains and GB plane. The GB curvature also plays a significant role in grain growth [20,21]. Mason et al. [22] proposed a complex curvature model based on rigorous mathematical derivation for two-dimensional and three-dimensional CA simulations. Li et al. [23] researched the grain growth kinetics, grain size distribution, topological aspects with two different GB curvature models. The most popularly used two-dimensional curvature model was proposed by Kremeyer [24] in order to simulate the process of binary solidification. Su et al. [25] extended Kremeyer’s curvature model to three-dimensional grain growth simulation. However, there are few investigations on the relationship between the calculated curvature and the factors such as shape factor and the relative position of the GB and the curvature calculation region.
In this work, we modified Kremeyer’s curvature model using a new shape factor to improve the calculation accuracy. The shape factor closely relates to the relative position between the GB and the curvature calculation region. A CA model was then developed to simulate microstructure evolution during directional annealing with GB mobility of a movable Gaussian distribution. Based on the CA model, the influence of drawing velocity, initial grain size and texture on the microstructure evolution during directional annealing were numerically studied in detail.

2. Description of Model

2.1. Grain Boundary Velocity

It is generally assumed that the GB velocity is directly proportional to the driving force and can be expressed as follows [26]:
V = M P
where P is the driving pressure and M is the GB mobility. GB migration is driven by the reduction of the GB area and move towards their centers of curvature. The driving pressure can be generally expressed via the following equation:
P = κ γ
where κ is the GB curvature and γ is the GB energy. The low angle GB energy can be calculated by classical Read-Shockley relation which is based on dislocation model [27]. We use the modified Read-Shockley relation for a large angle GB, also employed by, e.g., [28], which can be expressed as:
γ = γ m sin ( 2 Δ θ ) { 1 r γ ln [ sin ( 2 Δ θ ) ] }
where γm is the maximum of the GB energy, rγ is a constant, and Δθ is the misorientation between adjacent grains. For the microstructure evolution of directional annealing, it is common to assume that the GB mobility follows a Gaussian distribution [14,16]. In this study, we assume that the GB mobility (M(x, t)) in the direction of the heat zone movement follows the following Gaussian distribution:
M ( x , t ) = M min + ( M max M min ) exp ( ( x v t ) 2 2 σ 2 )
where x is traveled distance of the heat zone, v is the velocity of the heat zone. T is the time of the hot zone’s movement, and vt represents the distance traveled by the hot zone. 2σ is the width of the heat zone, with 2σ = 0.02L [14], where L is the length of sample. Mmax and Mmin are the GB mobility of pure iron at 1073 K and 823 K, respectively, which can be calculated by the following formula [29]:
M = D 0 b 2 k T exp ( Q b R T )
where D0 is the self-diffusion coefficient, b is the magnitude of the Burgers vector, k is the Boltzmann constant, T is the thermodynamic temperature, R is the gas constant and Qb is the activation energy for GB motion. The material parameters used for grain growth during directional annealing are listed in Table 1.

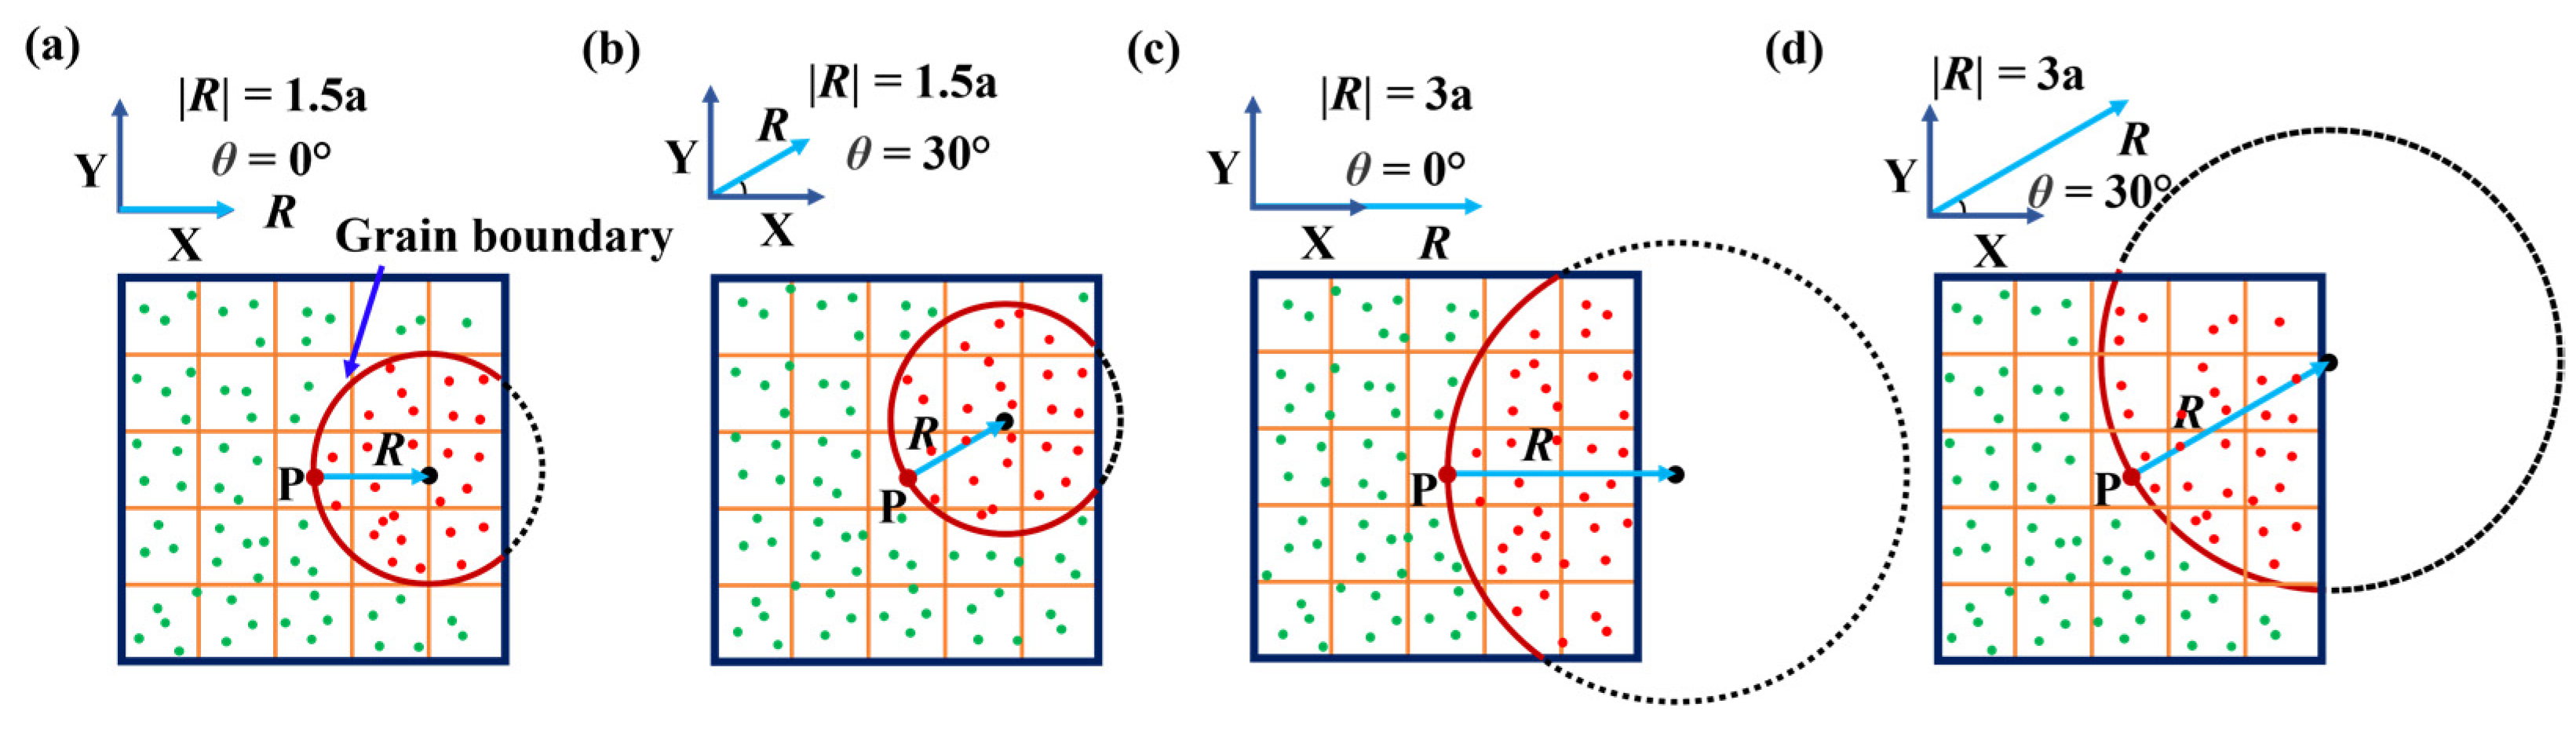
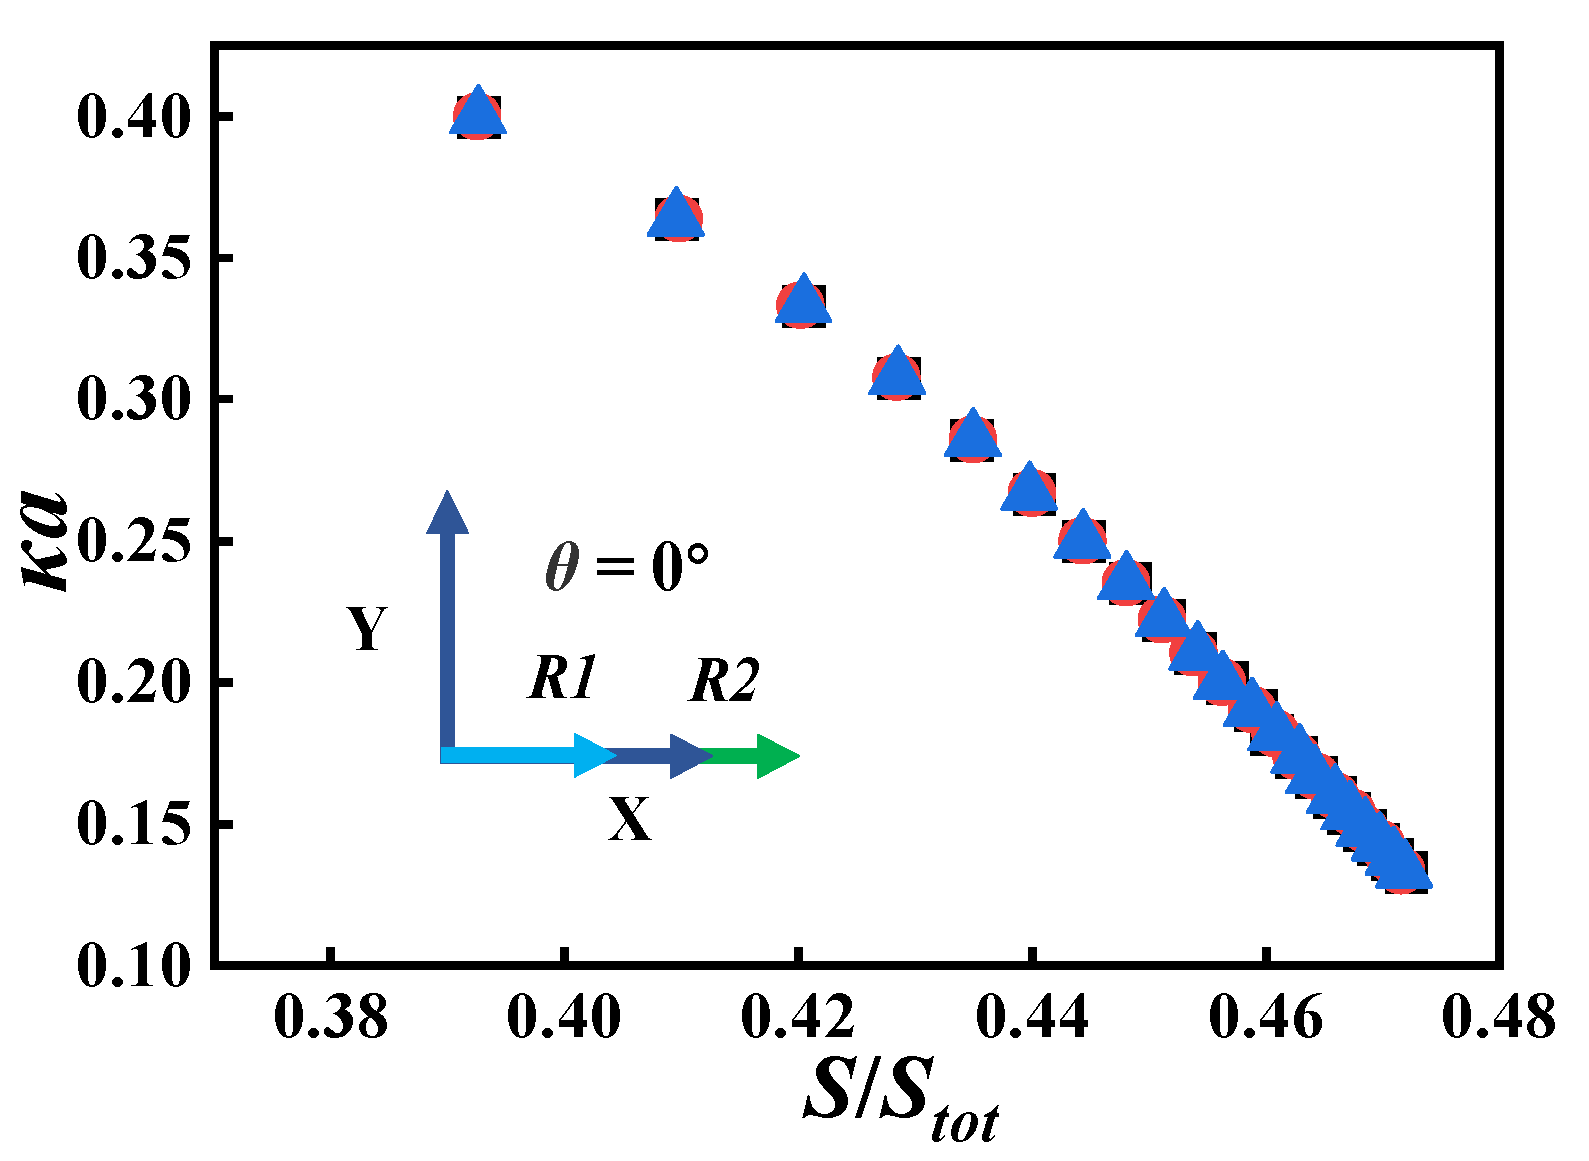
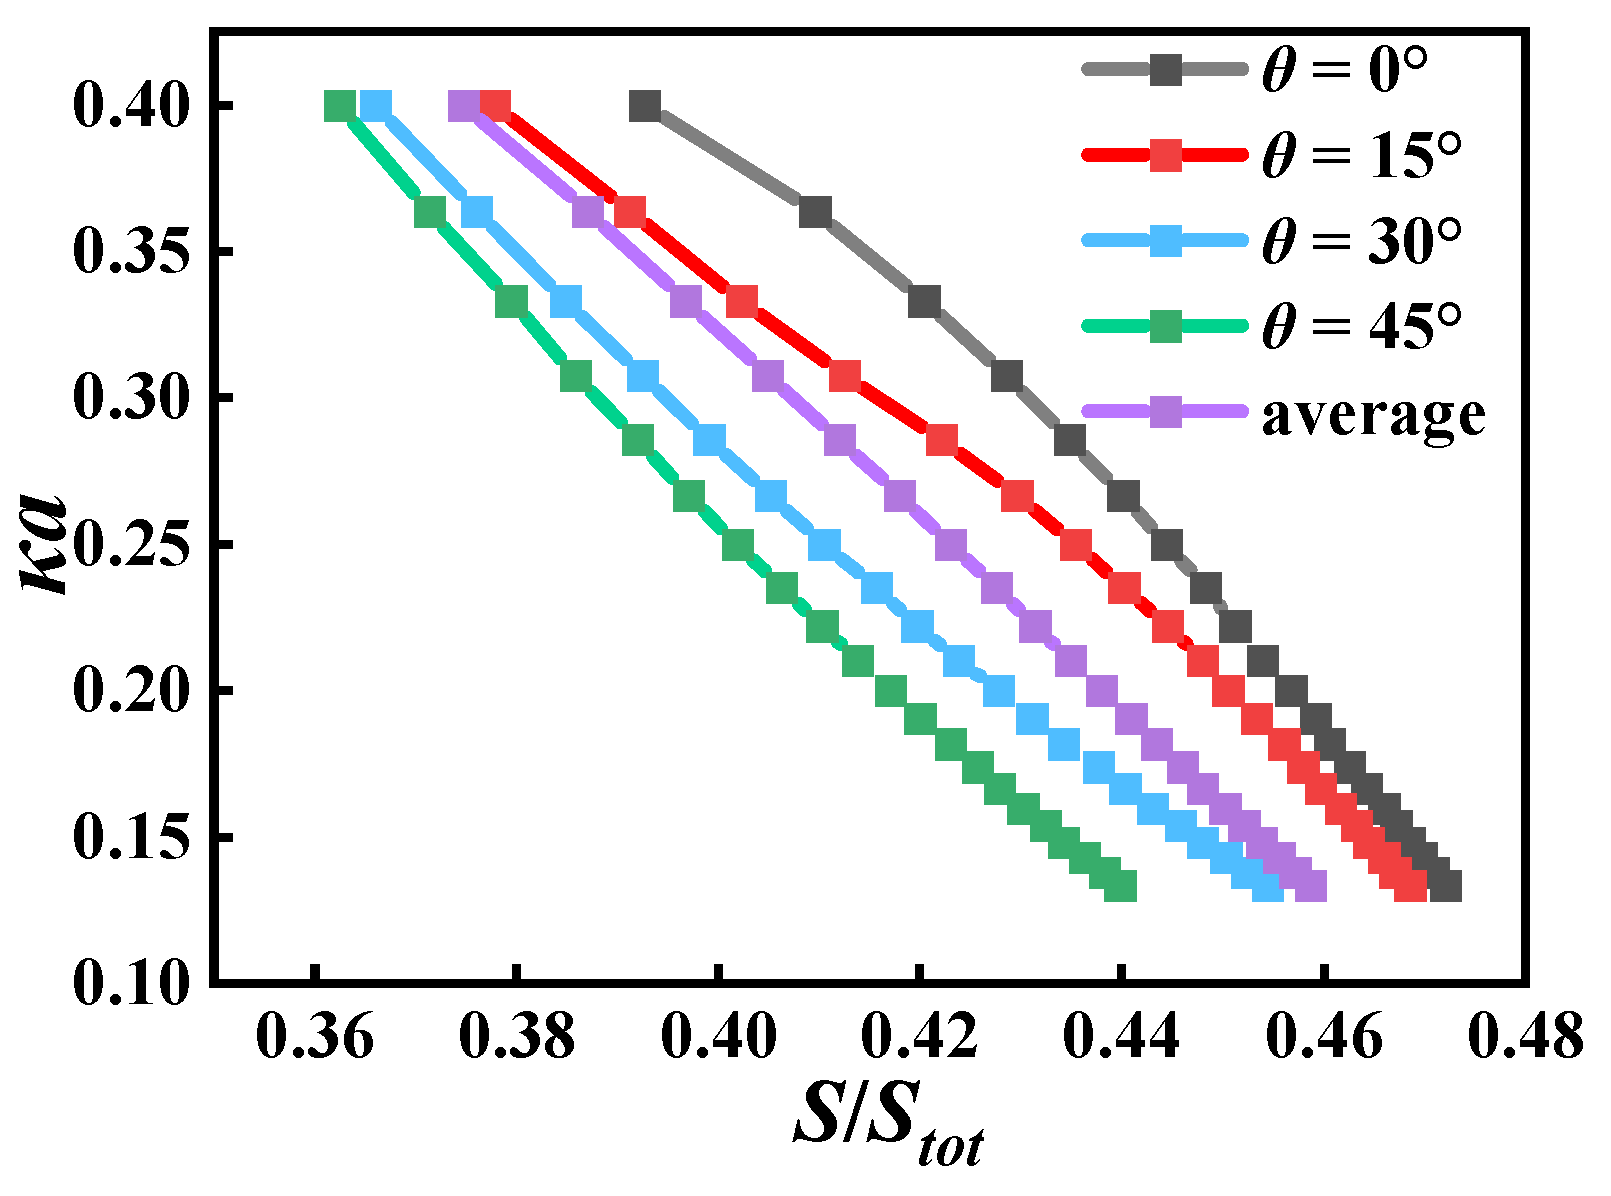
2.2. Grain Boundary Curvature

In mathematics, curvature refers to the rate of change of direction of a curve with respect to the distance along the curve. Continuity is a necessary condition for the existence of the curvature of a curve, but GB curvature is usually calculated by a GB represented by discrete state lattices in a CA simulation. One of the most widely used models for local GB curvature calculation was proposed by Kremeyer [24]. As is shown in Figure 1, the curvature calculation region of cell i includes the first- and second-nearest neighbors, and the area of red grain in the curvature calculation region is proportional to the local GB curvature. The local GB curvature can be described as follows:
κ = A a K i n k N i N + 1 A a ( S 0 S S t o t )
where a is the cell size of the square cell, A is a shape factor, N = 24 is the number of the first- and second-nearest neighbors, Kink = 15 is the number of cells within the neighborhood that belong to grain i for a flat interface, Ni is the number of cells within the neighborhood belonging to the grain i and Ni = 8 in Figure 1. S0 is the area ratio of grain i for a flat grain boundary when the curvature calculation region has infinite cells, S is the area of grain i in the curvature calculation region and Stot is the area of the curvature calculation region.
The curvature calculation value of Kremeyer’s curvature model is closely related to the ratio of the area of grain i to the area of the curvature calculation region; moreover, it is necessary to further consider the influence of the shape factor A, the relative position of GB and the curvature calculation region. Previous studies often roughly assumed that the shape factor A was 1.28 for both square cells [29] and hexagonal cells [30]. Recently, Li et al. [23] compared the calculation values of the CA model with the von Neumann’s topological relation and obtained a value of A = 2.4. In this paper, we obtained the shape factor A through the Monte Carlo method and studied the influence of different relative positions of GB and the curvature calculation region on curvature calculation value. As is shown in Figure 2, there are four types of relative positions of GB and the curvature calculation region. The magnitude of the curvature radius |R| and angle θ between the curvature radius and horizontal X-axis are used to describe the relative position between the GB and the curvature calculation region. Firstly, we assign Nall = 10,000,000 random points in the curvature calculation region and determined whether the random points are in grain i by Equation (7). Then, the number of all random points in grain i is calculated by Equation (8) and the proportion of grain i’s area is calculated with Equation (9). Finally, the dimensionless curvature was calculated by κa = a/|R|.
P j = { 0 , ( x j | R | ) 2 + ( y j | R | ) > | R | 1 , ( x j | R | ) 2 + ( y j | R | ) | R |
N i n = j = 1 N a l l P j
S S t o t = N i n N a l l
where xj and yj are the coordinates of random points and |R| is the curvature radius at the GB. Pj = 1 means that the jth random points is within grain i, and Pj = 0 means that the jth random point is not within grain i. Nin is the number of all random points in the grain i, and Nall is total number of random points.
To analyze the stability of the area ratio calculated by the Monte Carlo method, the relationship between the area ratio and dimensionless curvature at θ = 0° was calculated three times, as shown in Figure 3. The maximum deviation of the three calculation results was less than 0.11%, and the calculation results were stable. In order to further analyze the accuracy of the calculation results, the theoretical values of θ = 0°, |R| = 1 and θ = 0°, |R| = 20.5 were compared with the Monte Carlo calculated values, and the deviations in both cases were less than 0.03%. Therefore, the calculated values of the area ratio are stable and accurate with the Monte Carlo method.
In order to consider the symmetry of the square curvature calculation region with the GB, θ = 0° to 45° can describe all possible relative positions. Therefore, θ = 0°, 15°, 30°, 45° were selected, and the GB passed through the center of the curvature calculation region. As shown in Figure 4, the dimensionless curvature for different relative positions and different area ratios was calculated. The area ratio was proportional to the dimensionless curvature. The fitting parameters of the area ratio and the dimensionless curvature at different angles θ are summarized in Table 2. As θ increased, the shape factor A of the square cell first decreased and then increased, changing between 2.94 and 3.58. The fitting parameter S0 changes between 0.48~0.52, with a small fluctuation. On average, the shape factor of the square cell is 3.22, so A = 3.22 is selected as the shape factor of the square cell in this paper. The area ratio of the square curvature calculation region and the curvature can be described as:
κ = 3.22 a ( 0.50 S S t o t )

2.3. CA Model

In the CA model, GB migration is controlled by the continuous transition of cells at the grain boundaries. The transition of cell states is closely related to the type of neighbors and transition rules. The common von Neumann neighbors were used in this model, which included four neighbor cells in contact with the central cell. The transition rules for GB migration consist of two main parts: one part was the sign of curvature that controlled the direction of GB migration, and the other part was the transition probability that controlled the GB velocities. If the curvature of cell i at the GB is less than or equal to 0, the cell at the GB cannot transform into its neighboring cells. If the curvature of cell i at the GB is greater than 0, the cell i at the GB has a probability to transform into the neighbor cell. The transformation probability is given by pi = Vi/Vmax, where Vi is the GB velocity of cell i at the GB, and Vmax is the maximum GB velocity.
The time step Δt and the size of the square cell were determined by comparing the simulated microstructure with the experimental microstructure. Firstly, the experimental microstructure [5] was divided into 600 × 800, and the size of square cell, a = 3.36 μm, was obtained. Then, when the GB mobility distribution or temperature distribution moved a grid per 50 time steps along the length of the sample, the simulated microstructure was consistent with the experimental microstructure at 30 μm/s [5]. Through a 50 Δ t = 30 μ m / s , the time step, Δt, was calculated to be 2.24 × 10⁻³ s.
The initial grain structure for the CA simulation was generated by a recrystallization CA model. The symmetry boundary condition was applied to all boundaries, the cell state was symmetrical about the boundary. Each cell was assigned an orientation value between 0° and 90° for fcc materials, and the grains were composed of a number of cells with the same orientation value. For simulation research on the effects of drawing velocities and texture, the initial grain structure is shown in Figure 5, with an initial grain size of approximately 30 μm.

3. Results and Discussion

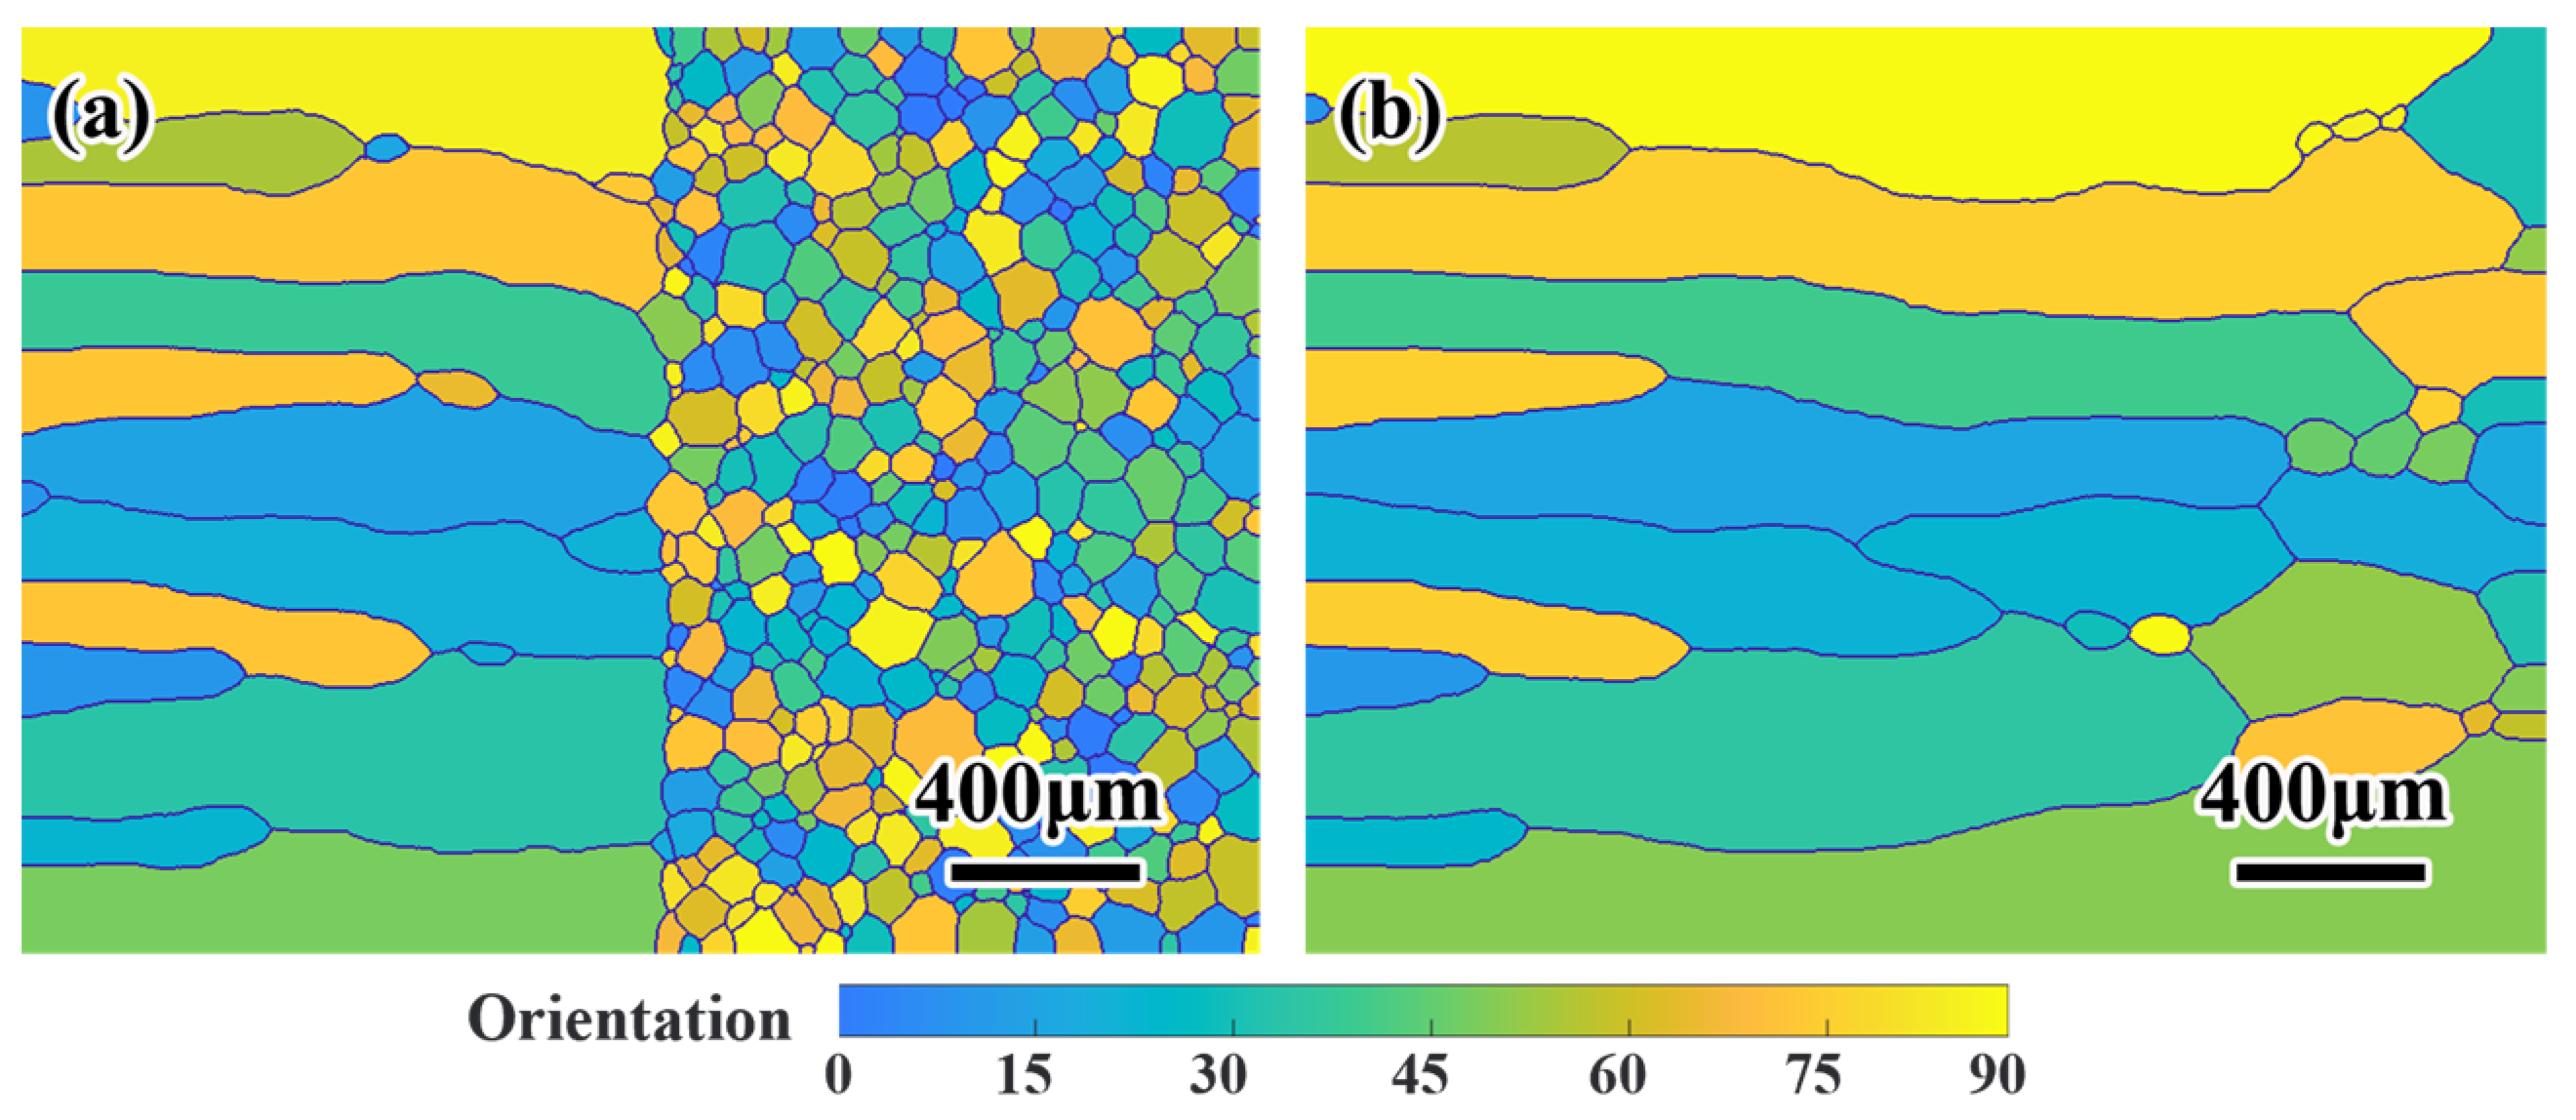
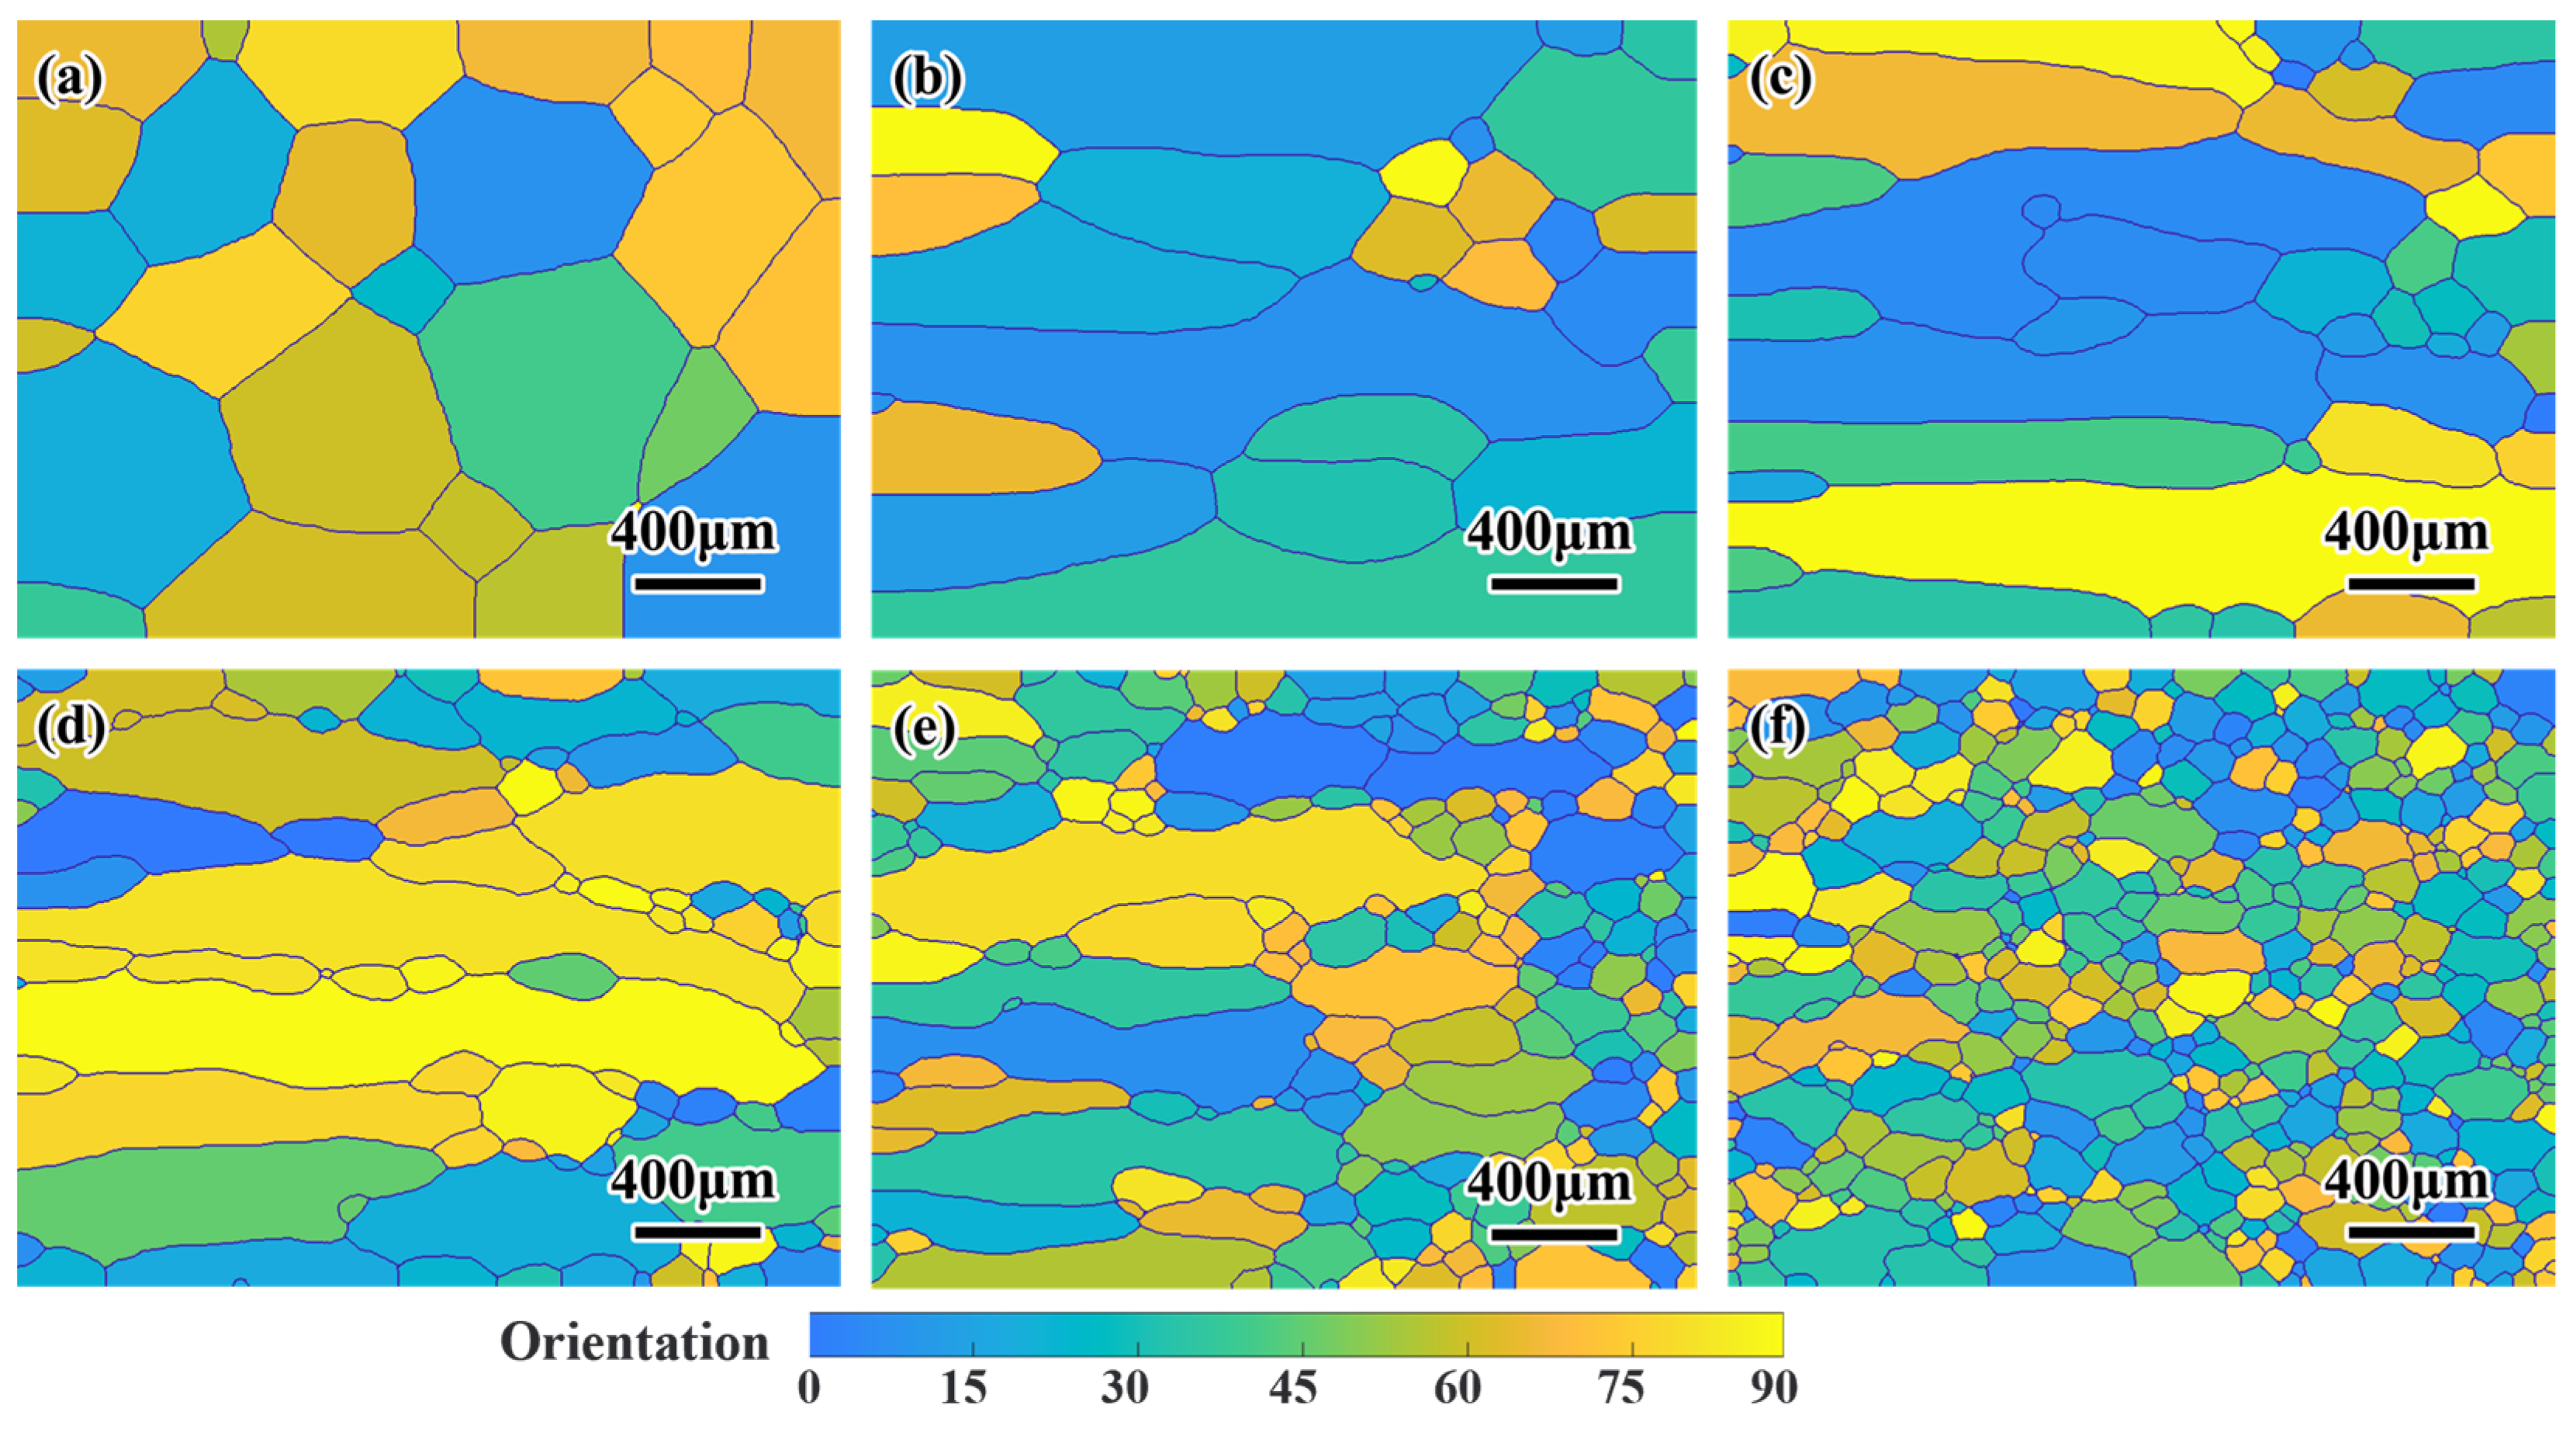
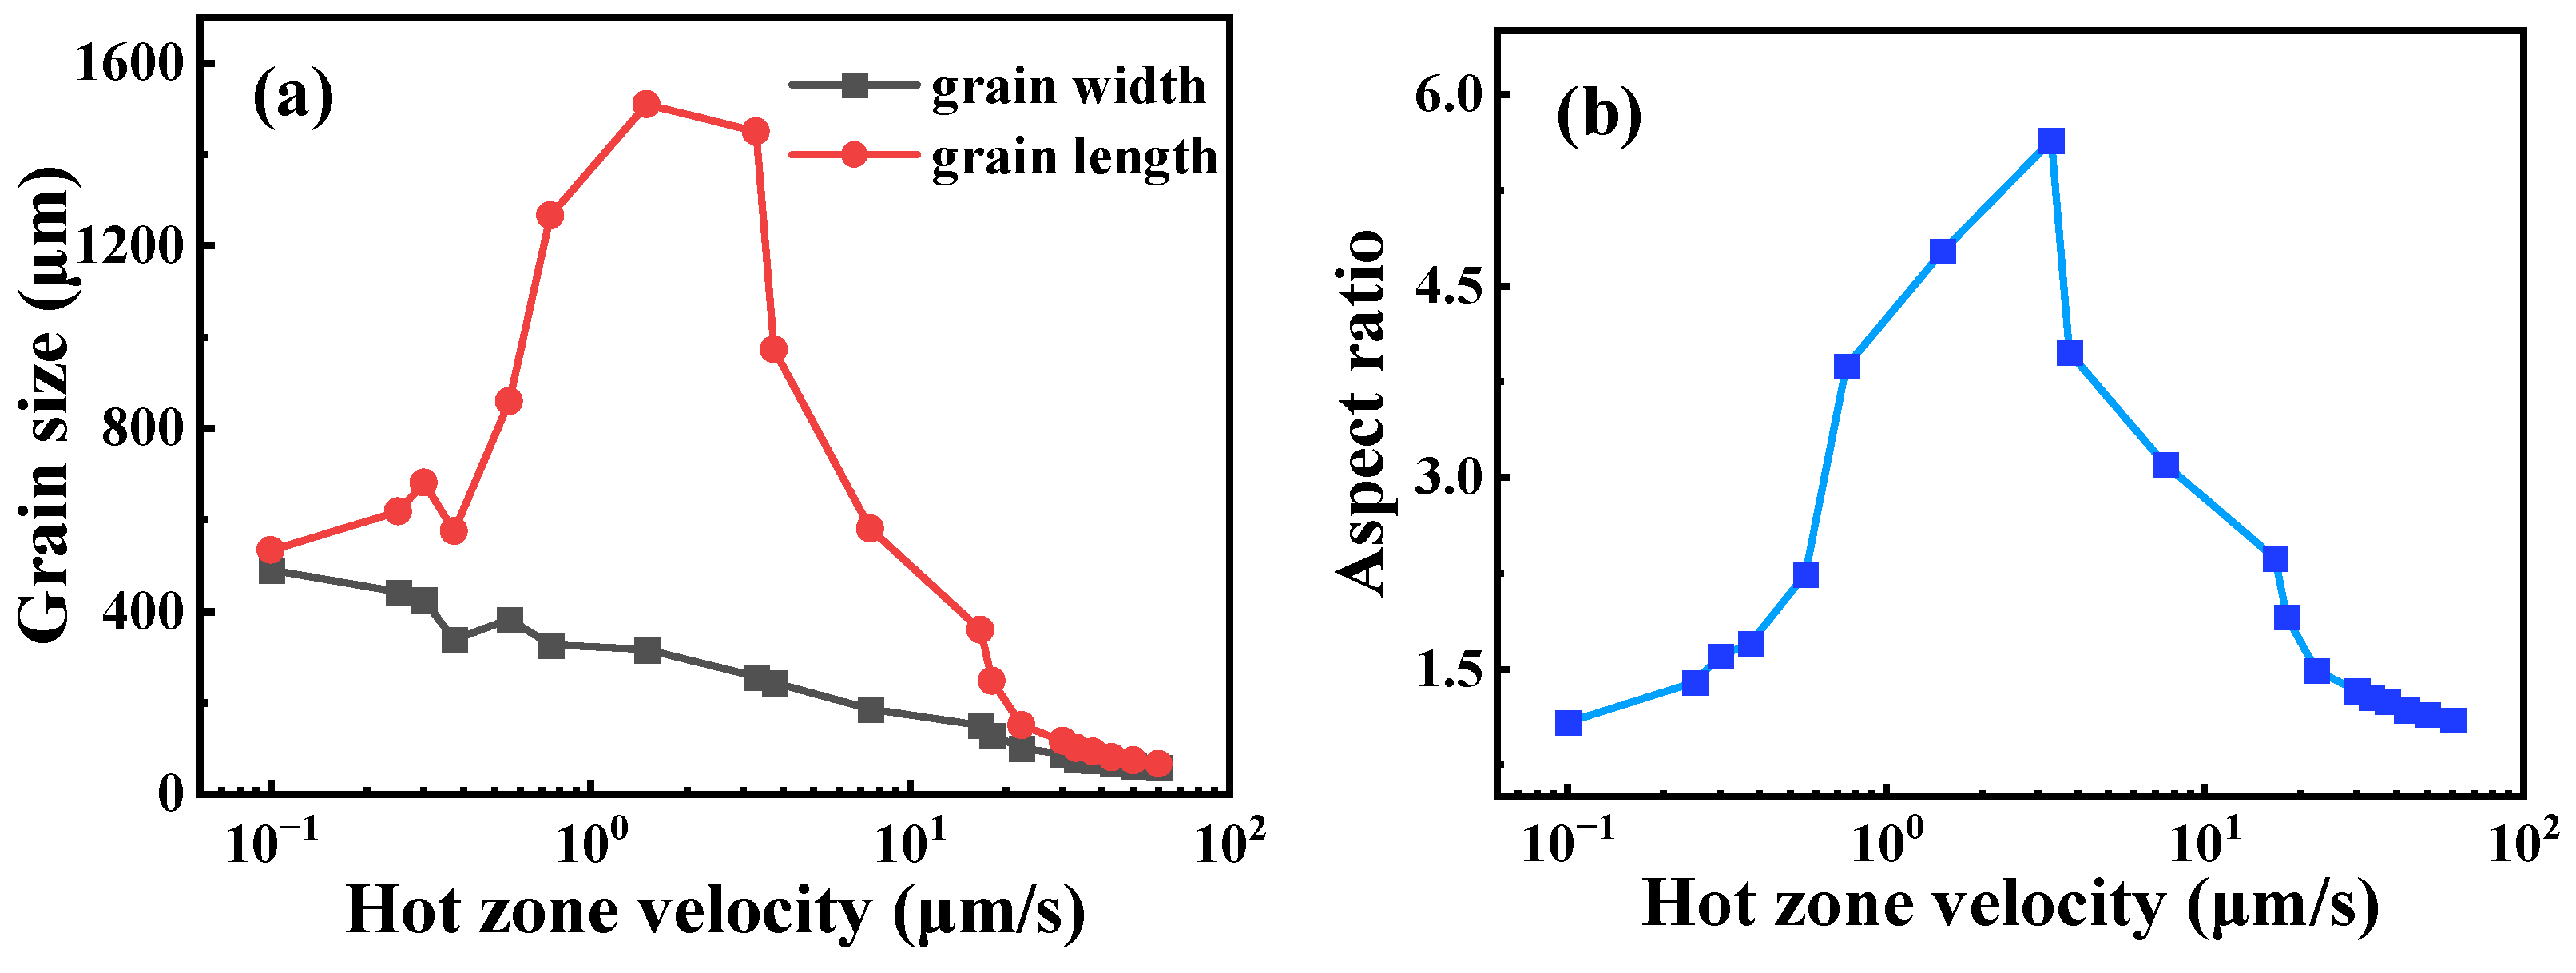
3.1. Effect of Drawing Velocity

Figure 6 shows the evolution of equiaxed grains into columnar grains during directional annealing. As the heat zone moves from left to right, the columnar GB at the front of the heat zone moves with it, and the columnar grains continue to grow by engulfing the equiaxed grains at the front of the moving heat zone.
Figure 7 shows the simulated microstructures during directional annealing with various drawing velocities. The equiaxed grains can be obtained at low and high drawing velocities. When the drawing velocity is 0.1 μm/s, coarse equiaxed grains are obtained, as shown in Figure 7a. When the drawing velocity is 30 μm/s, a fine equiaxed grain structure is obtained, with a grain size of 102 μm, as shown in Figure 7f. The grain size after directional annealing at 30 μm/s is larger than the initial grain size, indicating that a certain degree of grain growth also occurs at 30 μm/s, as show in Figure 5 and Figure 7f. However, the equiaxed grain size of 102 μm after 30 μm/s is much smaller than 549 μm at 0.1 μm/s, as shown in Figure 7a, f. The columnar grains can be generated at the middle drawing velocity, but slightly higher drawing velocity such as 18 μm/s result in a mixture of both columnar grains and equiaxed grains, as illustrated in Figure 7b–e.
The grain length, grain width and aspect ratio obtained after directional annealing at 900 °C with different drawing velocities are shown in Figure 8. The grain length is parallel to the direction of movement of the heat zone, and the grain width is perpendicular to the direction of movement of the heat zone. The grain length and width are calculated using the intercept method, and the aspect ratio is defined as the ratio of the grain length to the grain width. As shown in Figure 8a, the columnar grains can be formed in range of 0.1 μm/s to 30 μm/s. The grain width gradually decreases as the drawing velocity increases, due to increased drawing velocity reducing the heating time of the sample. In terms of grain length, it increases first and then decreases with increasing drawing velocity. As shown in Figure 8b, the aspect ratio increases and then decreases with increasing drawing velocity. The columnar grains with the maximum aspect ratio are obtained at 3.3 μm/s.
In the experimental study of directional annealing, it was observed that there is a lower and upper limit of drawing velocity for columnar grains formation [1,5,31,32], which is generally consistent with our simulated results. Zhang et al. [5] investigated the effect of different drawing velocities on directionally annealed pure iron at 900 °C. It was found that columnar grains can be obtained at a drawing velocity between 0.5 μm/s and 30 μm/s, while the equiaxed grains can be obtained at a drawing velocity lower than 0.5 μm/s or higher than 30 μm/s, and columnar grains with the maximum aspect ratio could be obtained at 0.3 μm/s. For the simulation of directional annealed pure iron at 900 °C, the range of drawing velocity for the formation of columnar grains is approximately 0.1 μm/s to 30 μm/s, and the columnar grains with the maximum aspect ratio were obtained at 3.3 μm/s. The simulation results are close to the experimental results.
Previous simulation research of moving hot zone with an infinite temperature gradient [15] demonstrated that columnar grains were obtained at very low drawing velocity due to zero growth at the front of the hot zone, and the grain length and width remain approximately constant with varying drawing velocity. In comparison to the simulation study presented in this paper, the temperature gradient had a significant effect on the microstructure at low drawing velocity.
Figure 9 shows a schematic illustration of the growth of columnar grains during directional annealing at different drawing velocities. When the drawing velocity is as low as V1, the coarsened equiaxed grains at the front of the heat zone inhibit the formation of columnar grains [1]. When the drawing velocity is increased from V2 to V3, the heating time of the equiaxed grains at the front of the heat zone is reduced, resulting in smaller grain sizes compared to when the drawing velocity is V2. The main driving force for the growth of columnar grains during directional annealing is the reduction of GB energy caused by curvature driving. The driving force is given by, where γ is the GB energy between columnar grains and equiaxed grains, d is the size of the equiaxed grains at the front of the hot zone, and D is the width of columnar grains. As the size of the equiaxed grains at the front of the columnar grains decreases, the driving force increases, which is more favorable for the growth of columnar grains.

3.2. Effect of Initial Grain Size

The simulated patterns of directionally annealed pure iron with various initial grain sizes are shown in Figure 10. It can be seen from the morphology after directional annealing that small initial grain size is conducive to obtaining columnar grains, as shown in Figure 10a–c. When the initial grain size is 99 μm, the microstructure is predominantly composed of equiaxed grains, as shown in Figure 10f. The more grain boundaries of the equiaxed grains at the front of hot zone due to the smaller initial grain size afford the larger driving force for GB migration, which is beneficial for the formation of columnar grains.
The grain length and width after directional annealing with different initial grain sizes are shown in Figure 11. At 3.3 μm/s, the grain length after directional annealing significantly decreases with increasing initial grain size, while the grain width does not change significantly. When the initial grain size is about 99 μm, the grain length and grain width are similar, but when the initial grain size is less than 99 μm, the grain length is much greater than the grain width. This indicates that there is an upper limit of the initial grain size for columnar grain formation during directional annealing, which has also been reported in experiment study [9]. A previous simulation study [15] on initial grain size indicated that the ability of columnar grains formation decreases with increasing initial grain size, but the upper limit of initial grain size for columnar grains formation has not been discovered yet due to the limited range of initial grain size.

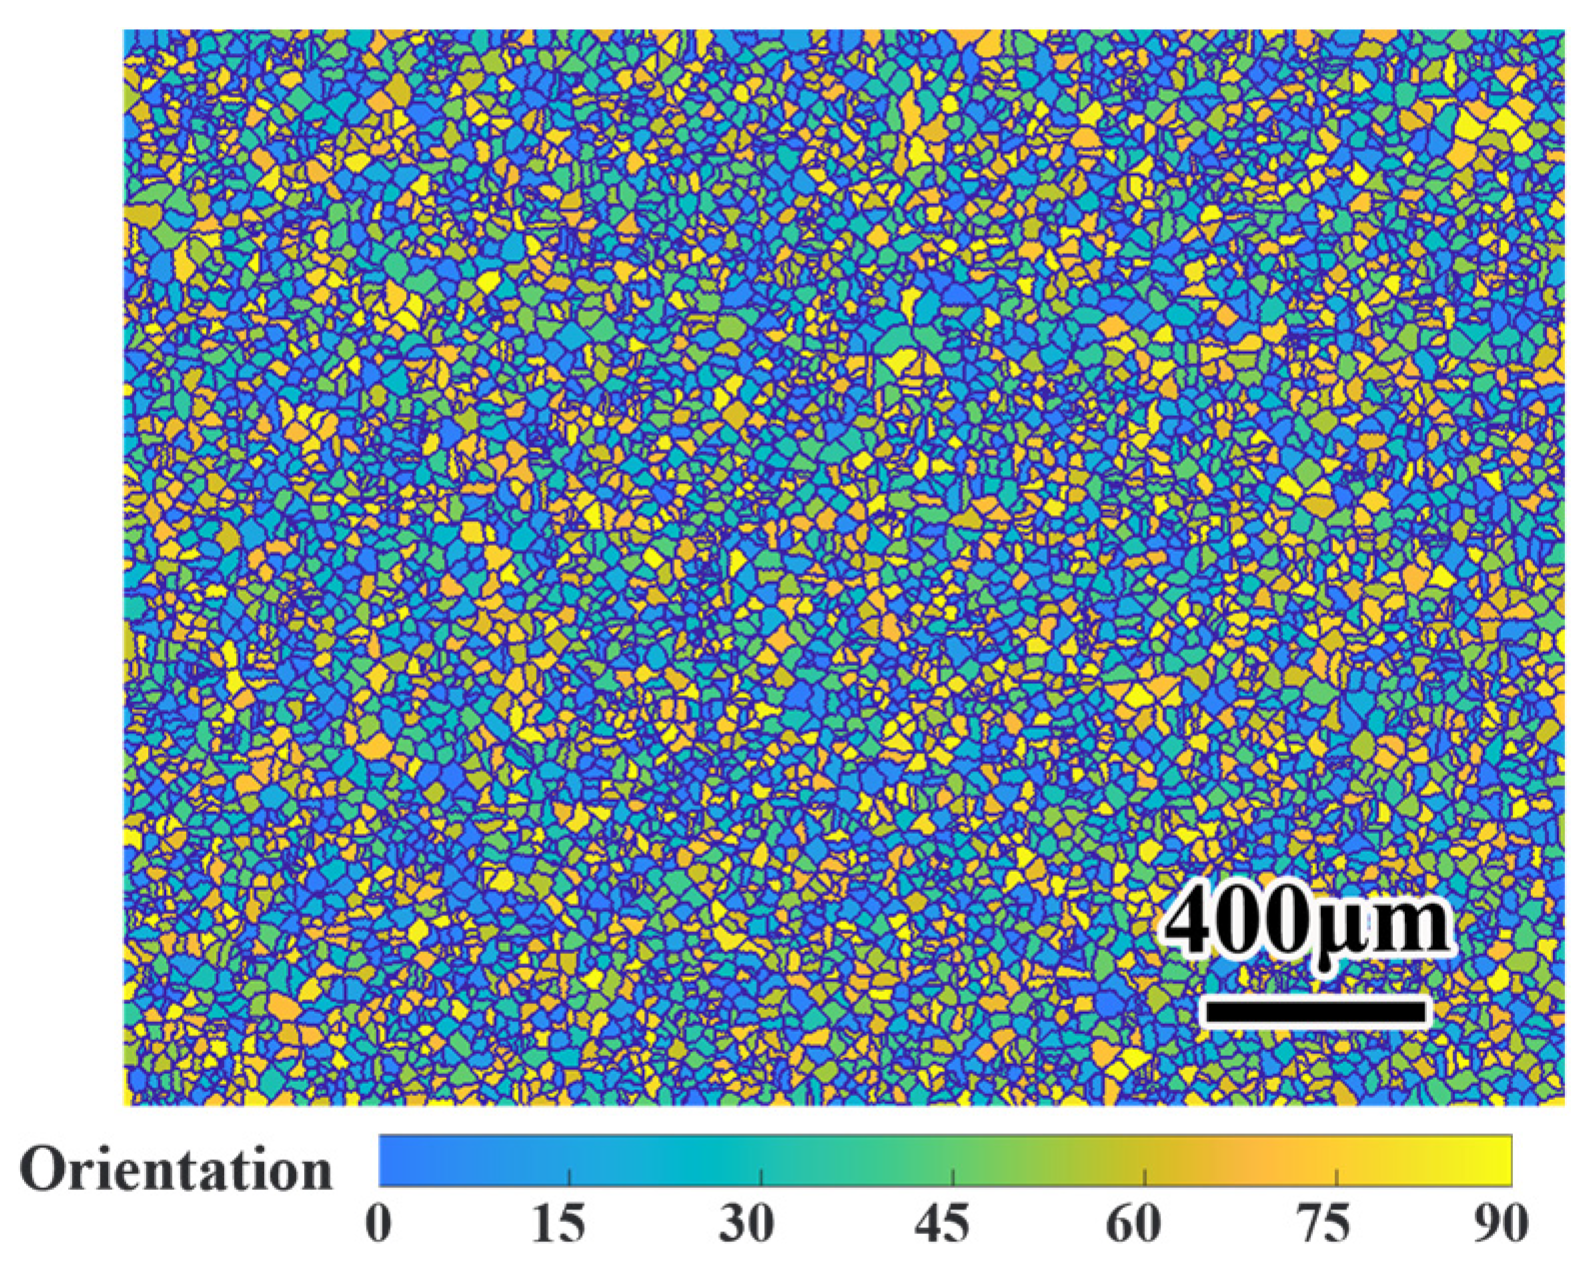
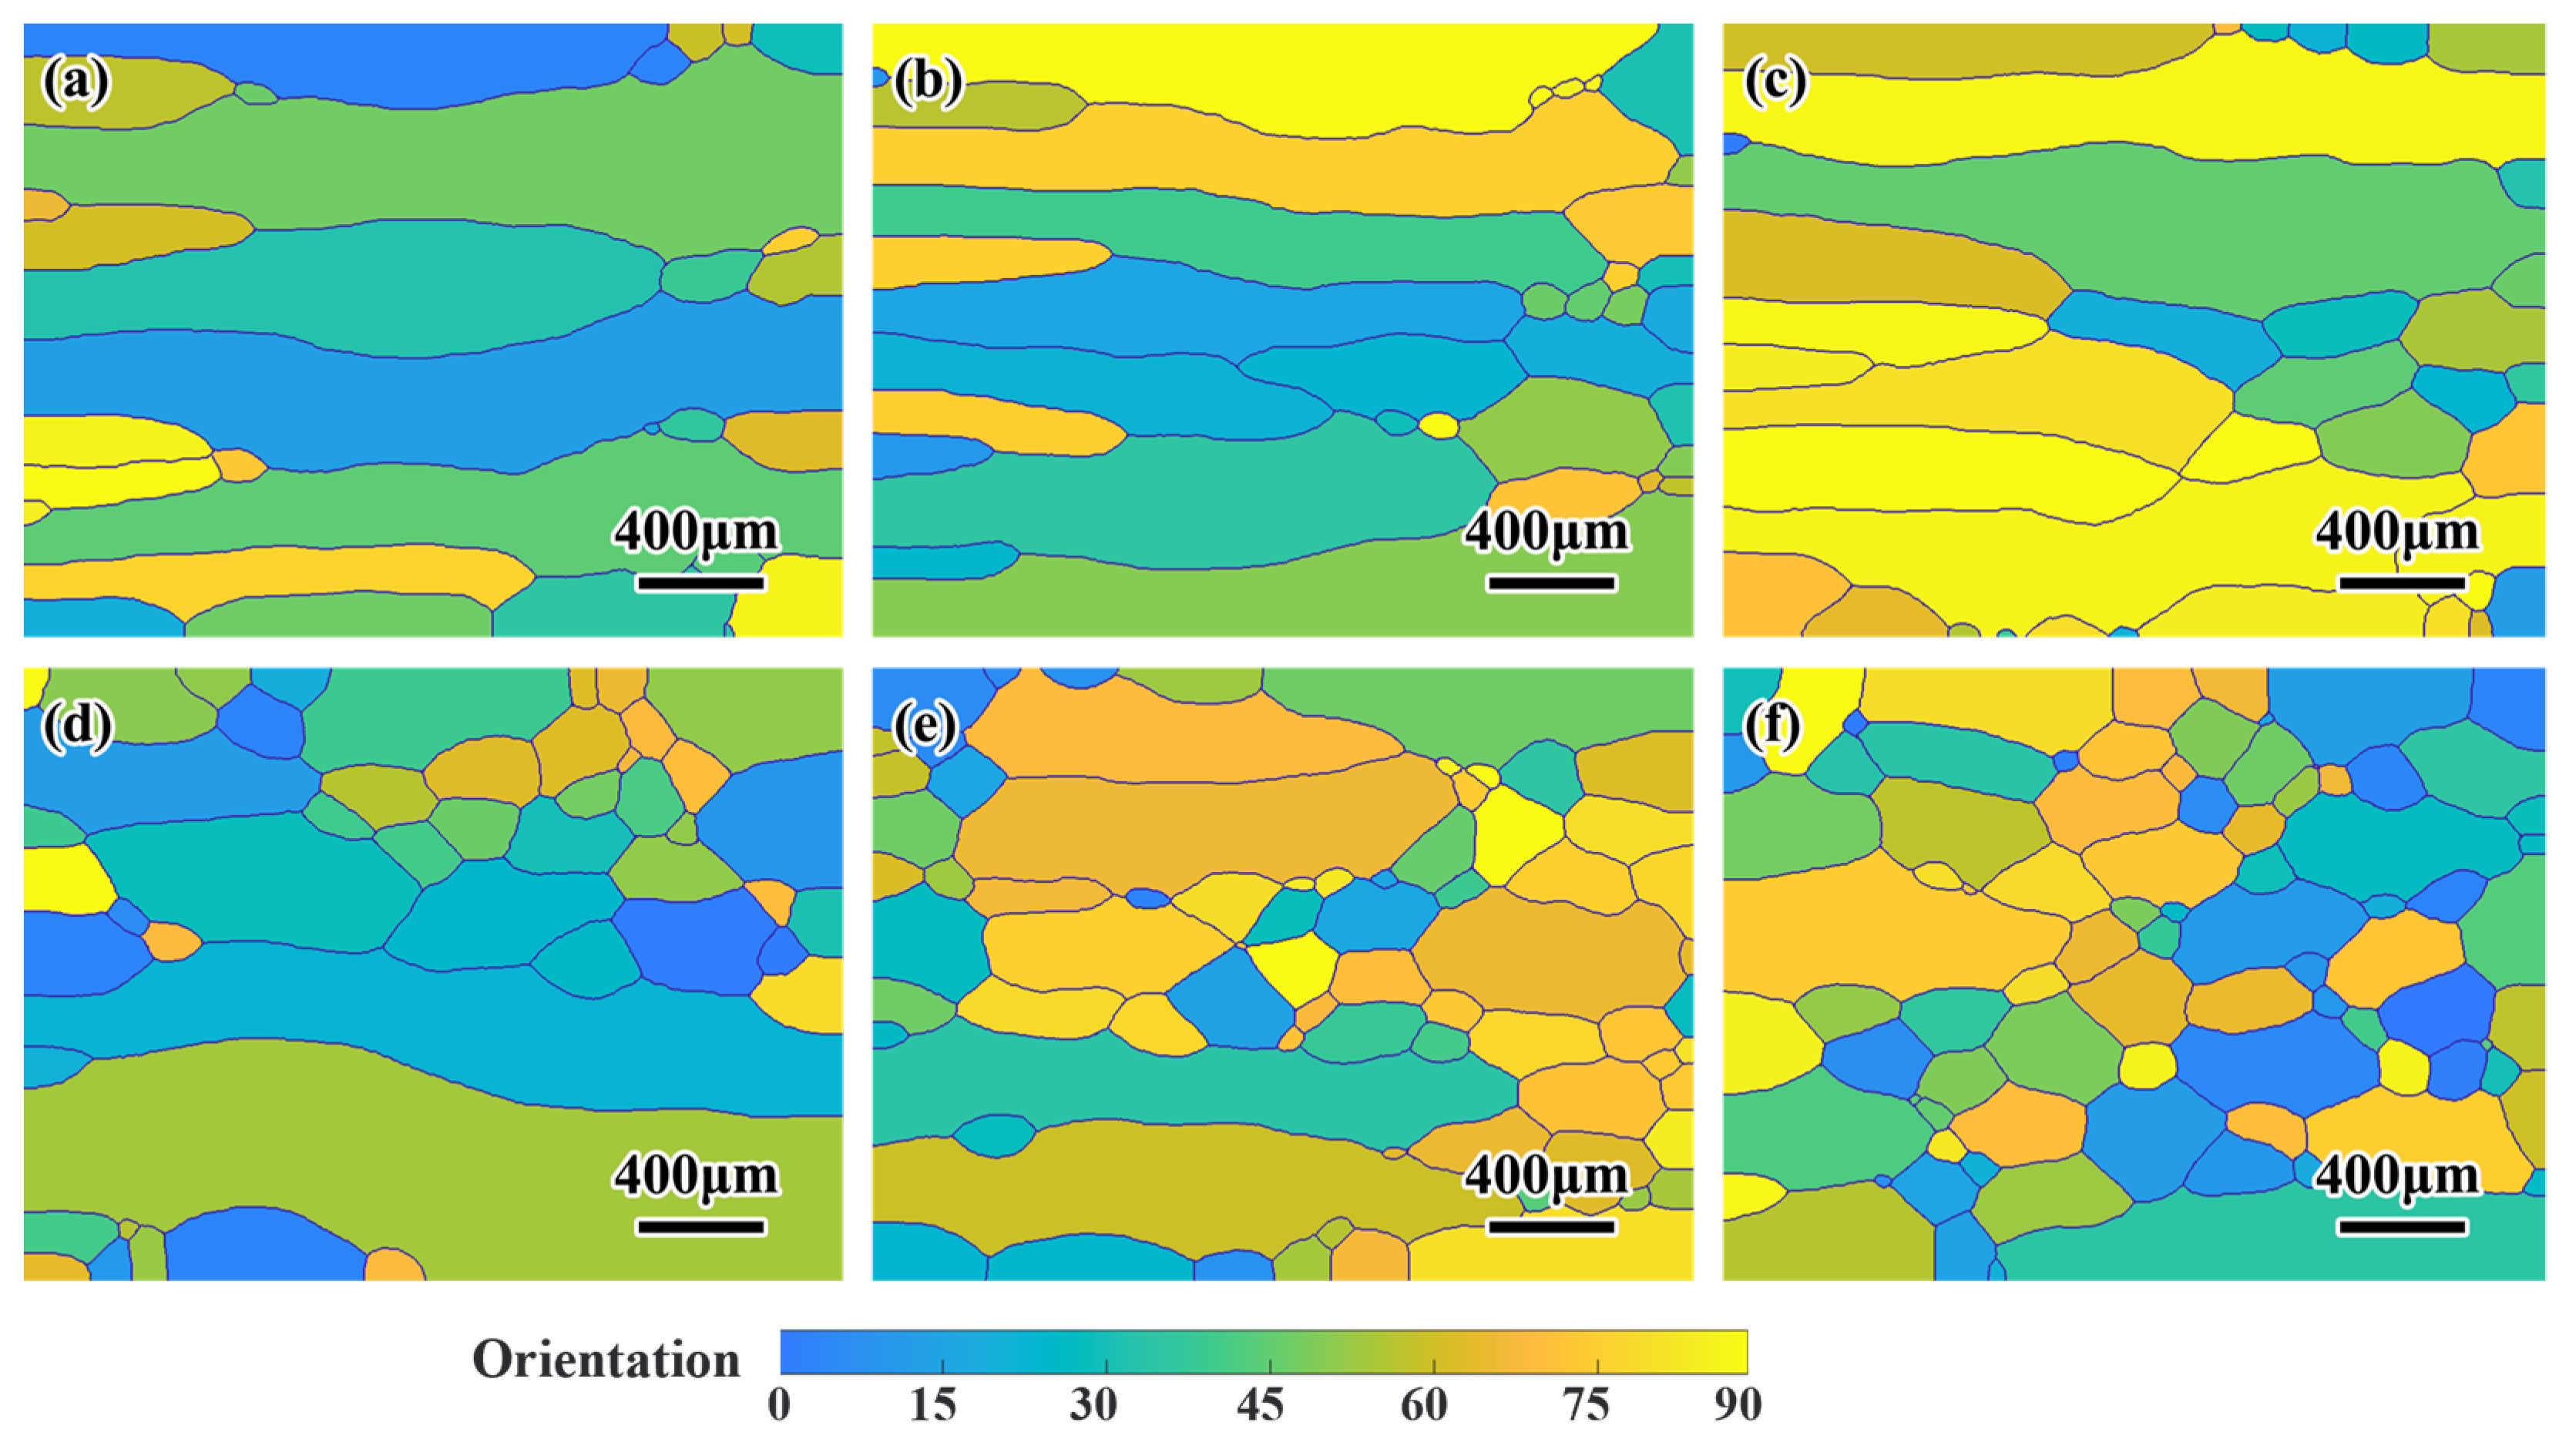
3.3. Effect of Texture

During directional annealing, recrystallization has already occurred in the front of hot zone [1], which meaning that the sample near the hot zone already have a recrystallized microstructure. Therefore, the effect of recrystallization texture on grain growth was considered for deformed materials during directional annealing, and other complex processes were ignored. The texture can affect GB migration by influencing GB energy, which has a significant impact on microstructure evolution during directional annealing. Zhang et al. [8] found that after directional recrystallization of pure iron with cold-rolled 85% reduction, the primary recrystallization grains at the front of columnar grains had a texture with {110}<112>, and the presence of texture hindered the growth of the columnar grains. In order to study the impact of texture on the microstructure evolution during directional annealing, the initial grain orientation was varied from 0° to 90° for cubic materials in 2D CA model. The texture was described by the distribution of orientation. Figure 12 shows the initial grain structure with different texture strengths. Figure 12a–c have orientation variances of 10°, 5°, and 2.5°, respectively, and contain 10% random grains, representing weak, moderate, and strong texture. The initial grain orientation for the weak microstructure is more dispersed in color compared to the strong microstructure in Figure 12d–f.
The grain morphology after directional annealing with different texture strengths at 3.3 μm/s is shown in Figure 13. The number of equiaxed grains after directional annealing with strong texture in Figure 13(c2) is far more than the weak texture in Figure 13(a2), and strong texture is detrimental to the growth of columnar grains during directional annealing. Several large grains grow rapidly in a matrix of fine grains at front of columnar grains, and the size of the abnormal grains with strong texture is larger than weak texture. The presence of texture causes the abnormal growth of equiaxed grains at the front of the heat zone. The colors of the abnormal grains are mainly yellow and blue, which deviate from the colors of the texture component, as shown in Figure 13(a1–c1). The reason for the abnormal growth is that most grains are inhibited from growing, and only a small number of grains grow rapidly. The grain boundaries between grains deviating from the texture component and grains belonging to the texture component are usually high angle grain boundaries with high GB energy and high GB velocities. The grain boundaries between grains belonging to texture component are usually low angle grain boundaries with low GB energy and low GB velocities. Therefore, grains deviating from the texture component can grow rapidly, while texture component grains grow slowly, resulting in abnormal grain growth. Additionally, columnar grains are formed by grain boundaries of abnormal grain moving with the hot zone. The columnar grains are mainly composed of grain deviating from the texture component. There are few simulation studies on the effect of texture on columnar grain growth during directional annealing. Godfrey et al. [33] used the Monte Carlo method and confirmed that columnar grains could form from texture materials after directional annealing. Our research not only confirms this conclusion but also goes further to analyzed the impact of texture strength during directional annealing, which can provide a valuable guidance for pretreatment process before directional annealing.

4. Conclusions

In this paper, the influence of the relative position of GB and curvature calculation region on curvature calculation model was discussed, and the average shape factor was A = 3.22. A CA model was used to analyze the influence of drawing velocities, initial grain sizes, and texture on grain morphology during directional annealing. The specific conclusions are as follows:
(1)
A CA model for directional annealing was established, which involves various factors affecting the microstructure evolution, including the drawing velocity, initial grain size and orientation texture;
(2)
The drawing velocity of columnar grain formation has an upper limit and lower limit during directional annealing. When the drawing velocity is between the lower and upper limits, columnar grains are formed, and there exists a drawing velocity that produces columnar grains with the maximum grain length. Otherwise, only equiaxed grains can be obtained;
(3)
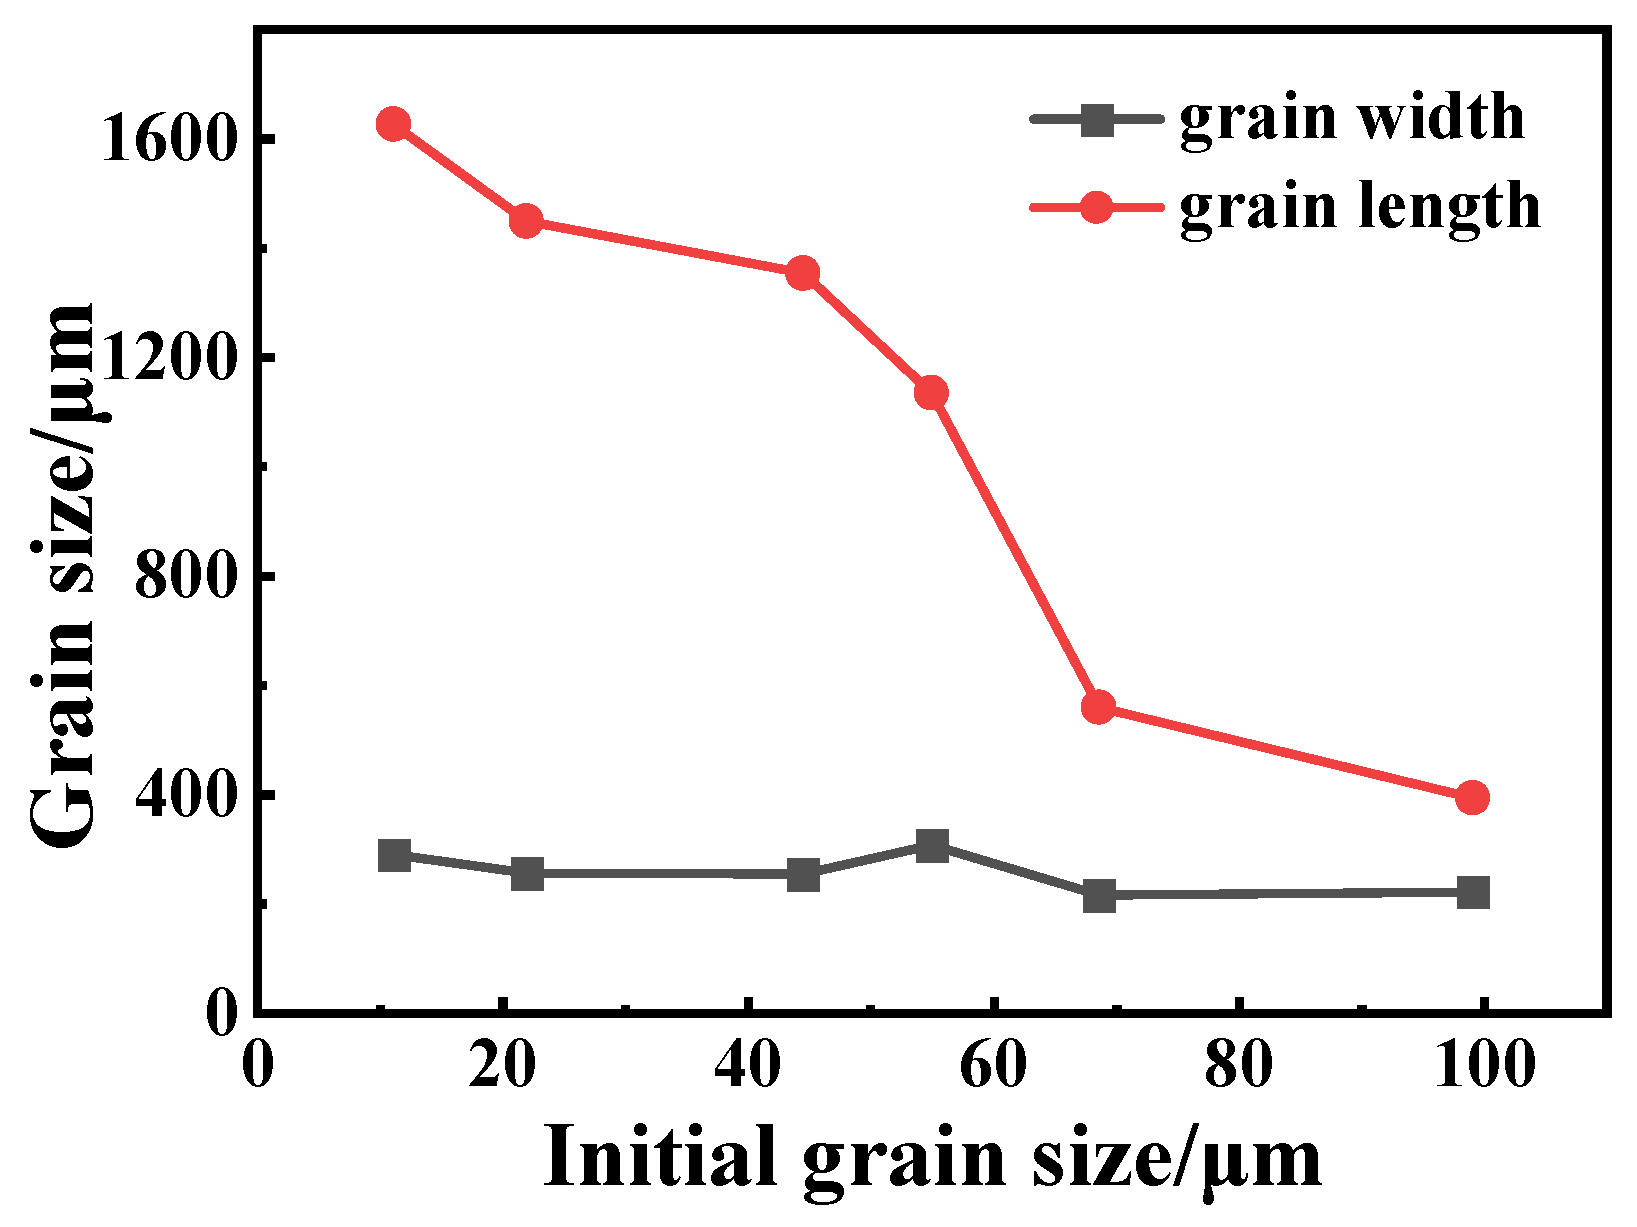
The grain length decreases as the initial grain size increases after directional annealing. A large initial grain size is not conducive to the formation of columnar grains. There is an upper limit of initial grain size for columnar grain formation. As the GB velocities of grains with a large initial grain size are low, the grain boundaries at the heat zone are difficult to move with the heat zone. The larger initial grain size causes in the lower GB velocities, which results in the GB cannot keep up with the moving heat zone;
(4)
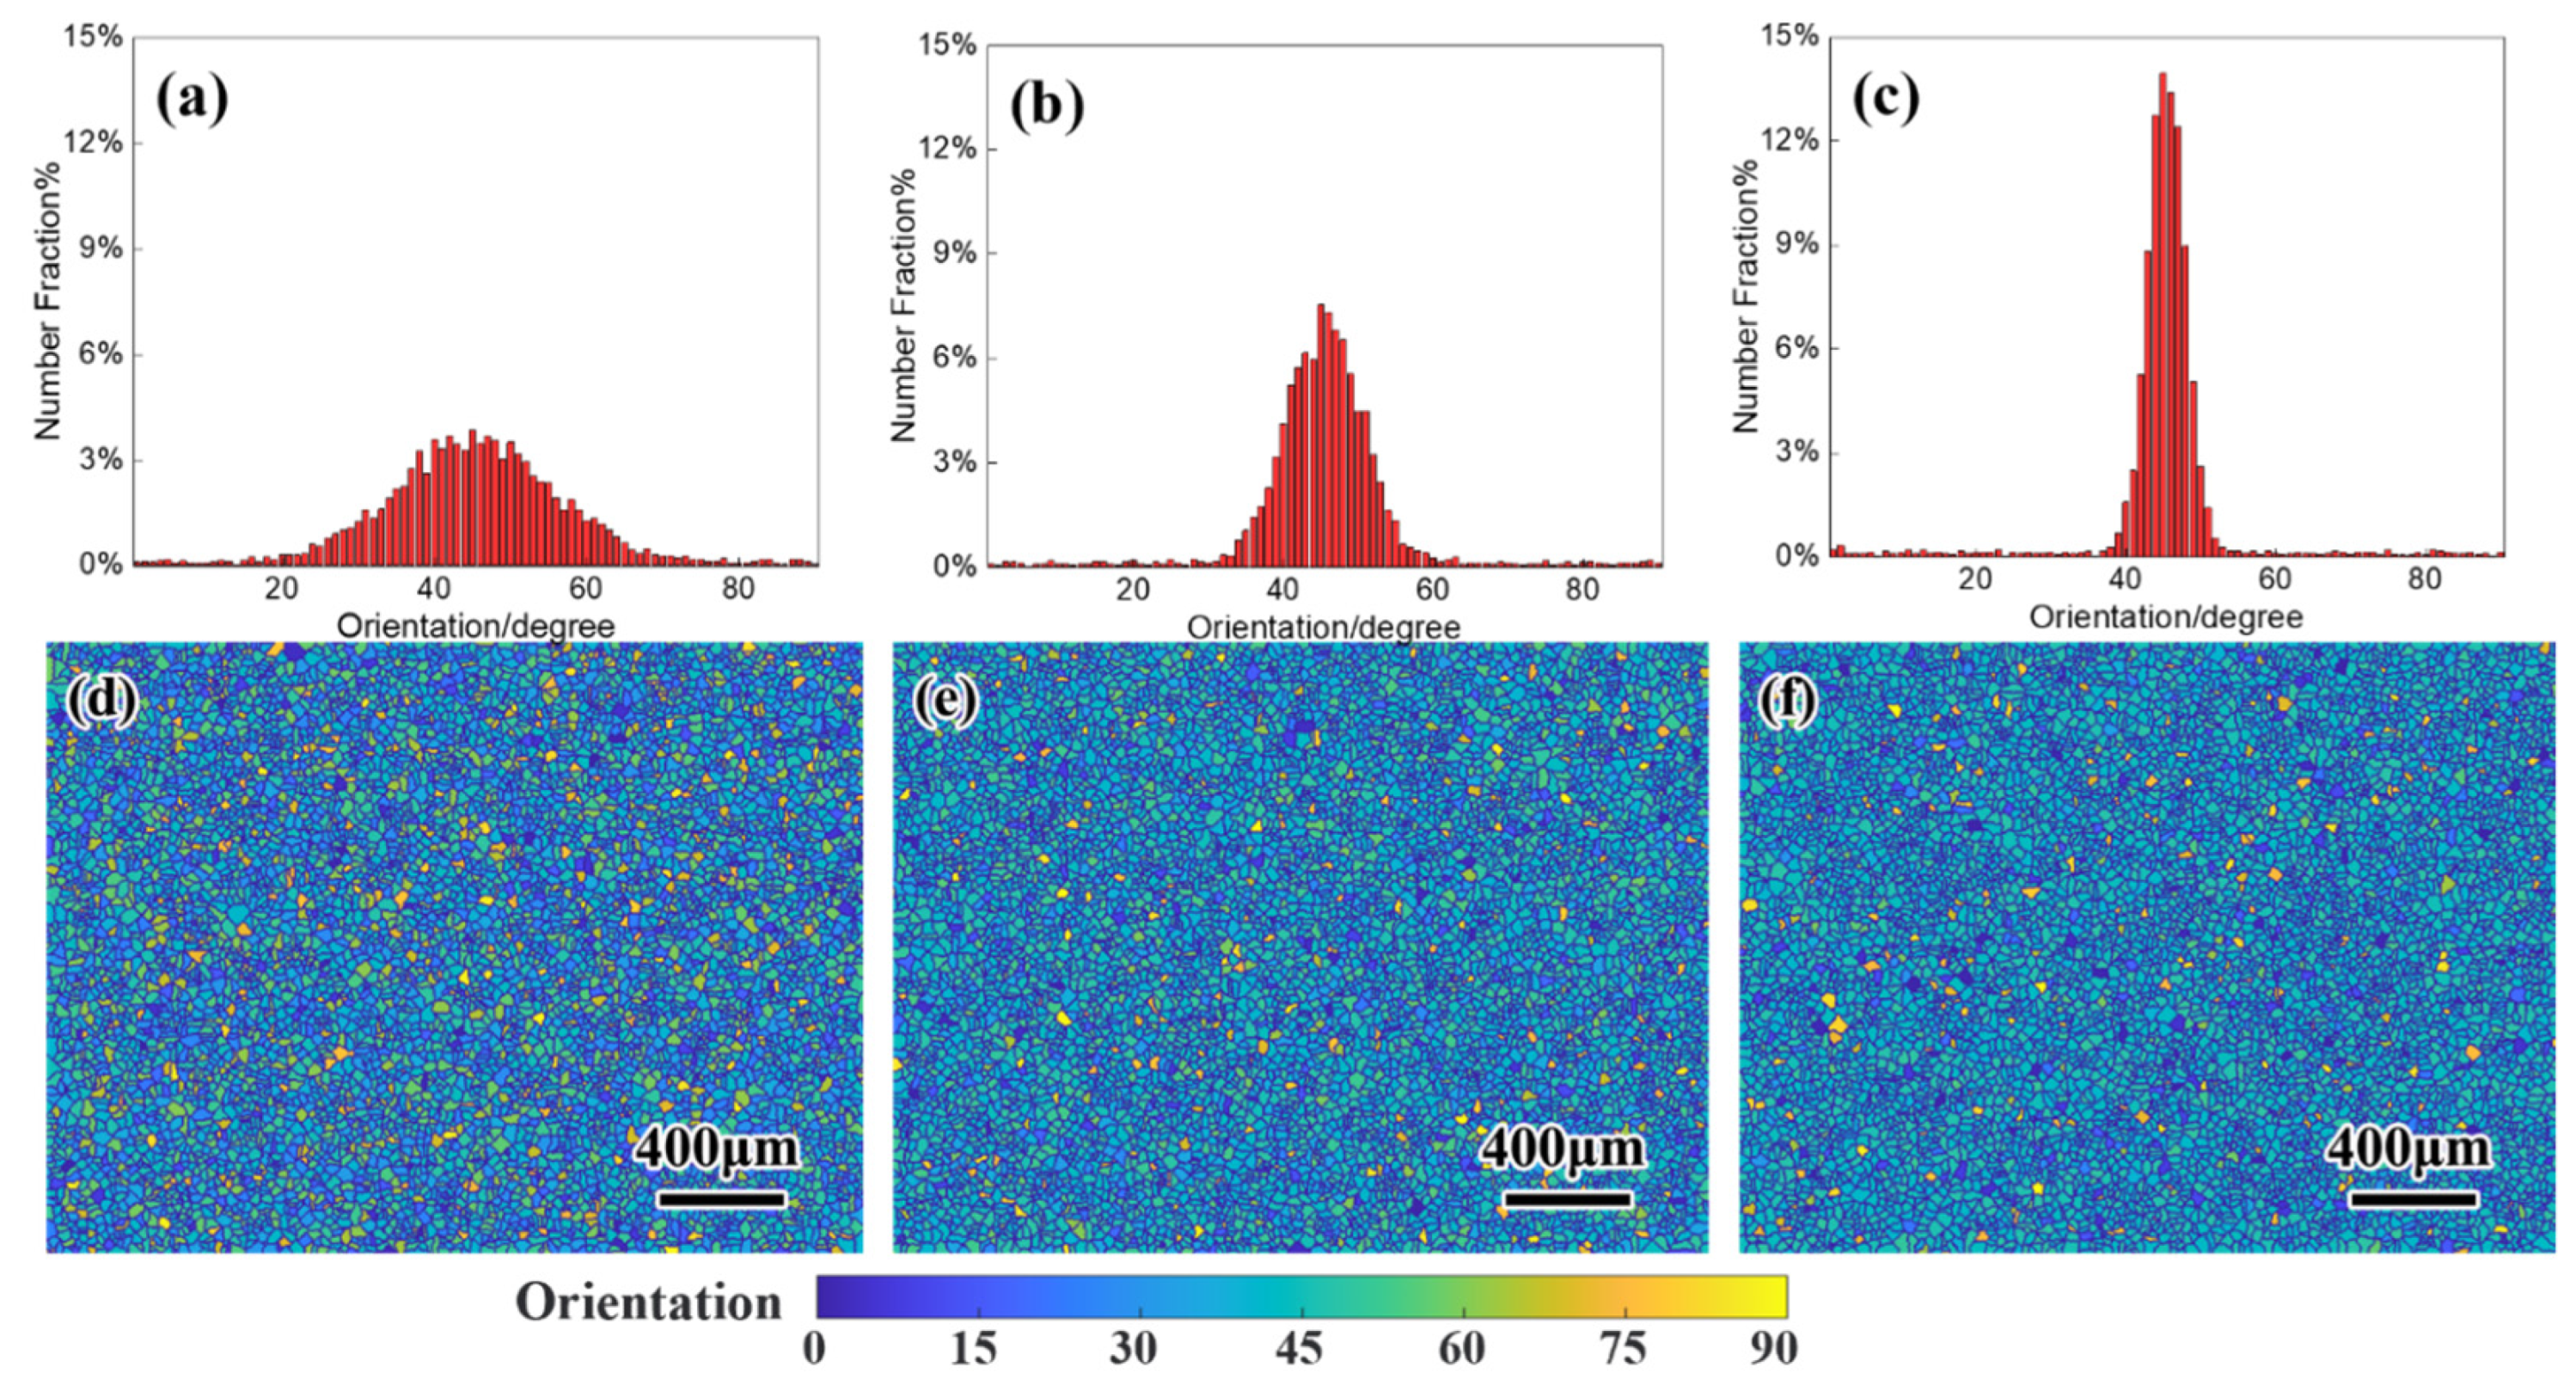
The abnormal growth induced by orientation texture hinders the growth of columnar grains during directional annealing. A weak texture is more conducive to the columnar grain growth than a strong texture and columnar grains are primarily composed of grains deviating from the texture component.

Author Contributions

Conceptualization, X.F. and Y.Y.; methodology, R.Z., X.F., C.Z., Q.H. and Y.L.; investigation, R.Z. and X.F.; writing—original draft, R.Z.; writing—review and editing, X.F. and R.Z.; validation and supervision, X.F. and Y.Y; funding acquisition, Y.Y. All authors have read and agreed to the published version of the manuscript.

Funding

This work was supported by the National Key Research and Development Program of China (grant No. 2018YFE0115800).

Data Availability Statement

Not applicable.

Conflicts of Interest

The authors declare no conflict of interest.

References

  1. Yang, C.; Baker, I. Directional recrystallisation processing: A review. Int. Mater. Rev. 2020, 66, 256–286. [Google Scholar] [CrossRef]
  2. Yang, C.; Baker, I. Breakdown of growth front at elevated drawing velocity during directional recrystallization. Philos. Mag. Lett. 2019, 99, 167–172. [Google Scholar] [CrossRef]
  3. Liu, Y.L.; Zheng, W.W.; Fang, H.Z.; Yang, Y.H.; Chen, R.R. Effect of cyclic DHT on microstructural evolution and mechanical properties of Ti44Al6Nb1Cr2V alloy. J. Alloys Compd. 2022, 936, 168173. [Google Scholar] [CrossRef]
  4. Muralikrishnan, V.; Liu, H.; Yang, L.; Conry, B.; Marvel, C.J.; Harmer, M.P.; Rohrer, G.S.; Tonks, M.R.; Suter, R.M.; Iii, C.E.K.; et al. Observations of unexpected grain boundary migration in SrTiO3. Scr. Mater. 2023, 222, 115055. [Google Scholar] [CrossRef]
  5. Zhang, Z.W.; Chen, G.; Chen, G.L. Dynamics and mechanism of columnar grain growth of pure iron under directional annealing. Acta Mater. 2007, 55, 5988–5998. [Google Scholar] [CrossRef]
  6. Manuel Vallejos, J.; Alberto Malarria, J. Growing Fe-Mn-Al-Ni single crystals by combining directional annealing and thermal cycling. J. Mater. Process. Technol. 2020, 275, 116317. [Google Scholar] [CrossRef]
  7. Yang, C.; Baker, I. Elevated temperature directional recrystallization of high-purity nickel. Philos. Mag. 2019, 99, 1057–1078. [Google Scholar] [CrossRef]
  8. Zhang, Z.W.; Chen, G.L.; Chen, G. The effect of crystallographic texture on columnar grain growth in commercial pure iron during directional annealing. Mater. Sci. Eng. A 2006, 435, 573–578. [Google Scholar] [CrossRef]
  9. Hotzler, R.K.; Glasgow, T.K. The influence of γ’ on the recrystallization of an oxide dispersion strengthened superalloy-MA 6000E. Metall. Trans. A 1982, 13, 1665–1674. [Google Scholar] [CrossRef]
  10. Baker, I.; Iliescu, B.; Li, J.; Forest, H.J. Experiments and simulations of directionally annealed ODS MA 754. Mater. Sci. Eng. A 2008, 492, 353–363. [Google Scholar] [CrossRef]
  11. Yang, C.; Baker, I. Effect of soluble particles on microstructural evolution during directional recrystallization. Acta Mater. 2020, 188, 288–301. [Google Scholar] [CrossRef]
  12. Fang, H.; Tang, Q.Y.; Zhang, Q.Y.; Fan, Y.M.; Pan, S.Y.; Rettenmayr, M.; Zhu, M.F. Simulation of the Peritectic Phase Transition in Fe-C Alloys. Materials 2022, 15, 537. [Google Scholar] [CrossRef] [PubMed]
  13. Gao, J.B.; Li, Z.C.; Liu, J.; Zhang, J.H.; Song, B.; Zhang, L.J. Current Situation and Prospect of Computationally Assisted Design in High-Performance Additive Manufactured Aluminum Alloys: A Review. Acta Metall. Sin. 2023, 59, 87–105. [Google Scholar] [CrossRef]
  14. Holm, E.A.; Zacharopoulos, N.; Srolovitz, D.J. Nonuniform and directional grain growth caused by grain boundary mobility variations. Acta Mater. 1998, 46, 953–964. [Google Scholar] [CrossRef]
  15. Badmos, A.Y.; Frost, H.J.; Baker, I. Microstructural evolution during directional annealing. Acta Mater. 2002, 50, 3347–3359. [Google Scholar] [CrossRef]
  16. Wei, C.Y.; Li, S.Y. Effect of temperature gradient on grain growth behavior from phase field simulations. Acta Phys. Sin. 2011, 60, 100701. [Google Scholar] [CrossRef]
  17. Ye, L.Y.; Mei, B.Z.; Yu, L.M. Modeling of Abnormal Grain Growth That Considers Anisotropic Grain Boundary Energies by Cellular Automaton Model. Metals 2022, 12, 1717. [Google Scholar] [CrossRef]
  18. Zhang, Z.; Wang, Y.F.; Ge, P.; Wu, T. A Review on Modelling and Simulation of Laser Additive Manufacturing: Heat Transfer, Microstructure Evolutions and Mechanical Properties. Coatings 2022, 12, 1277. [Google Scholar] [CrossRef]
  19. Zhang, J.H.; Li, X.X.; Xu, D.S.; Yang, R. Recent progress in the simulation of microstructure evolution in titanium alloys. Prog. Nat. Sci. Mater. Int. 2019, 29, 295–304. [Google Scholar] [CrossRef]
  20. Liu, Y.X.; Ke, Z.J.; Li, R.H.; Song, J.Q.; Ruan, J.J. Study of Grain Growth in a Ni-Based Superalloy by Experiments and Cellular Automaton Model. Materials 2021, 14, 6922. [Google Scholar] [CrossRef]
  21. Su, F.Y.; Liu, W.L.; Wen, Z. Three-Dimensional Cellular Automata Simulation of the Austenitizing Process in GCr15 Bearing Steel. Materials 2019, 12, 3022. [Google Scholar] [CrossRef]
  22. Mason, J.K. Grain boundary energy and curvature in Monte Carlo and cellular automata simulations of grain boundary motion. Acta Mater. 2015, 94, 162–171. [Google Scholar] [CrossRef]
  23. Li, Z.Q.; Wang, J.S.; Huang, H.B. Grain boundary curvature based 2D cellular automata simulation of grain coarsening. J. Alloys Compd. 2019, 791, 411–422. [Google Scholar] [CrossRef]
  24. Kremeyer, K. Cellular automata investigations of binary solidification. J. Comput. Phys. 1998, 142, 243–263. [Google Scholar] [CrossRef]
  25. Su, F.Y.; Liu, W.L.; Wen, Z. Three-dimensional cellular automaton simulation of austenite grain growth of Fe-1C-1.5Cr alloy steel. J. Mater. Res. Technol. 2020, 9, 180–187. [Google Scholar] [CrossRef]
  26. Humphreys, J.; Rohrer, G.S.; Rollett, A. Recrystallization and Related Annealing Phenomena, 3rd ed.; Elsevier: Amsterdam, The Netherlands, 2017; p. 147. [Google Scholar]
  27. Read, W.T.; Shockley, W. Dislocation models of crystal grain boundaries. Phys. Rev. 1950, 78, 275–289. [Google Scholar] [CrossRef]
  28. Hallberg, H.; Wallin, M.; Ristinmaa, M. Simulation of discontinuous dynamic recrystallization in pure Cu using a probabilistic cellular automaton. Comput. Mater. Sci. 2010, 49, 25–34. [Google Scholar] [CrossRef]
  29. Lin, X.; Zou, X.; An, D.; Krakauer, B.W.; Zhu, M. Multi-Scale Modeling of Microstructure Evolution during Multi-Pass Hot-Rolling and Cooling Process. Materials 2021, 14, 2947. [Google Scholar] [CrossRef] [PubMed]
  30. Zhu, G.M.; Kang, Y.L.; Lu, C.; Li, S.C. Microstructure Evolution of Cold-Rolled Dual Phase Steel Simulated by Cellular Automata. Steel Res. Int. 2014, 85, 1035–1046. [Google Scholar] [CrossRef]
  31. Ukai, S.; Taya, K.; Nakamura, K.; Aghamiri, M.S.; Oono, N.; Hayashi, S.; Okuda, T. Directional recrystallization by zone annealing in a Ni-based ODS superalloy. J. Alloys Compd. 2018, 744, 204–210. [Google Scholar] [CrossRef]
  32. Yang, C.; Baker, I. Effect of solute on microstructural evolution during directional recrystallization. J. Alloys Compd. 2020, 815, 15. [Google Scholar] [CrossRef]
  33. Godfrey, A.W.; Martin, J.W. Some Monte Carlo studies of grain growth in a temperature gradient. Philos. Mag. A 1995, 72, 737–749. [Google Scholar] [CrossRef]
Figure 1. Schematic view of local GB curvature calculation.
Metals 13 00368 g001
Figure 2. The relative position of the GB and the curvature calculation region. (a) θ = 0°, |R| = 1.5a, (b) θ = 30°, |R| = 1.5a, (c) θ = 0°, |R| = 3a, and (d) θ = 30°, |R| = 3a.
Metals 13 00368 g002
Figure 3. The calculation results for three different area ratios at θ = 0°.
Metals 13 00368 g003
Figure 4. The relation between area ratio and dimensionless curvature when GB and curvature calculation region are at different relative positions.
Metals 13 00368 g004
Figure 5. Initial grain structure generated for the CA simulations.
Metals 13 00368 g005
Figure 6. Microstructure evolution of directional annealing at a drawing velocity of 3.3 μm/s at 900 °C. (a) the hot zone passes through half of the specimen, (b) the hot zone passes completely through the specimen.
Metals 13 00368 g006
Figure 7. Simulated microstructures with various drawing velocities after directional annealing at 900 °C. (a) 0.1 μm/s, (b) 0.75 μm/s, (c) 3.75 μm/s, (d) 7.5 μm/s, (e) 18 μm/s, (f) 30 μm/s.
Metals 13 00368 g007
Figure 8. The relationship between drawing velocity and grain size at 900 °C. (a) grain length and grain width, (b) aspect ratio.
Metals 13 00368 g008
Figure 9. Schematic view of the columnar grain growth during the directional annealing, where V1 < V2 < V3, data from [15].
Metals 13 00368 g009
Figure 10. Simulated microstructures with different initial grain sizes after directional annealing at 3.3 μm/s. (a) 11 μm, (b) 22 μm, (c) 45 μm, (d) 55 μm, (e) 69 μm and (f) 99 μm.
Metals 13 00368 g010
Figure 11. Trend of grain length and grain width as a function of initial grain size after directional annealing at 3.3 μm/s.
Metals 13 00368 g011
Figure 12. Initial grain structure of different texture strengths. The orientation variances of (ac) were 10°, 5° and 2.5°, respectively, and (df) are the initial grain structures corresponding to (ac), respectively.
Metals 13 00368 g012
Figure 13. Simulated microstructures with different texture strengths after directional annealing at 3.3 μm/s. (a1c2) are the microstructure evolution of orientation variance of 10°, 5° and 2.5°, respectively.
Metals 13 00368 g013
Table 1. Parameters of CA model for grain growth during directional annealing, data from [28,29].
Γm (J/m2)D0 (m2/s)b (m)Qb (KJ/mol)rγ
0.561.11 × 10−62.48 × 10−101400.66
Table 2. The fitting parameters of area ratio and dimensionless curvature.
Relative Angle θShape Factor AParameter S0
3.580.51
15°2.940.52
30°2.970.48
45°3.400.50
On average3.220.50
Disclaimer/Publisher’s Note: The statements, opinions and data contained in all publications are solely those of the individual author(s) and contributor(s) and not of MDPI and/or the editor(s). MDPI and/or the editor(s) disclaim responsibility for any injury to people or property resulting from any ideas, methods, instructions or products referred to in the content.

