Abstract
As a modification of the conventional blast furnace (BF), the top gas recycling-oxygen blast furnace (TGR-OBF) has been continuously studied in the context of the technological transformation of low-carbon metallurgy. As it has a set of new gas inlets in the stack and changes the blast operation system in the hearth, the pressure drop and the in-furnace gas flow are the primary problems to be solved in the TGR-OBF’s industrialization. In this paper, a two-dimensional model of a whole blast furnace, based on a softening-and-melting experiment and porous-medium theory, is established. The in-furnace pressure drop and the gas velocity with different oxygen concentrations and tuyere heights are studied. The results show that the suitable height of the stack tuyere is the same as that of the elevation as the cohesive zone inside the furnace. With the gradual increase in oxygen enrichment, the permeability of the cohesive ore layer (COL) increases, while the gas flow through the coke layer (CL) decreases gradually up to 10%. The simulation results provide a theoretical basis for the TGR-OBF to reduce the coke rate and keep the pressure drop from increasing, or even to enable it to decrease.
1. Introduction
The complex multiphase flow, heat and mass transfer, chemical reaction, and performance of blast furnaces (BFs) under different conditions have been the focus of academic research for decades. Studying the transfer phenomenon from the top charging system to the bulk column in the stack, then to the raceway and, finally, to the liquid iron in the hearth plays an important role in understanding and optimizing the blast furnace process. A numerical simulation method provides an economical and effective tool for this purpose [1].
Dong et al. [2] studied the influence of cohesive zone shape on the powder flow and accumulation in BFs. By presetting a W-shaped, V-shaped, or inverse V-shaped cohesive zone, they found that the unburned coal powder is likely to have a stable accumulation area in the lower central region of a BF. For the same cohesive zone shape, the thick cohesive layer will lead to a large pressure drop, while the resistance of the narrow cohesive layer to the gas powder flow is relatively small. Fu et al. [3] combined three sub-models, including prediction of the falling curve trajectory, the stock-line profile, and the burden descent, to model the entire burden-formation process by taking the non-uniform descending velocity into consideration and applying the modifications on two existing GP models and a PF model. They found that the O/C ratio increased in the regions where the descending speed was relatively high. More ore was charged into the locations where the descending speed was larger under the condition of non-uniform descending velocity. Shen et al. developed a three-dimensional (3D) CFX-based mathematical model to describe the internal state of BFs in terms of multiphase flow and the related thermochemical behavior. This model considered the intense interactions between gas, solid, and liquid phases, and was capable of describing the key in-furnace phenomena such as flow/temperature patterns and component distributions of solid, gas, and liquid phases. This model offered a cost-effective tool to analyze the in-furnace transfer phenomenon and to predict the key performance indicators, such as the reduction degree and gas utilization [4].
In this paper, a two-dimensional (2D) full-furnace porous-media model based on our 2D cohesive-zone porous-media [5] is developed. By considering the layered cohesive zone, the stock-line profile, and the deadman structure, it can simulate the pressure drop and gas velocity during different processes of a top gas recycling-oxygen blast furnace. The results are verified against the data from industrial BFs. The gas flow and velocity characteristics of the cohesive ore layer (COL) and the coke layer (CL) are also discussed. A series of softening-and-melting experiments were carried out to derive the resistance coefficient for the porous model. Through the combination of experiment and numerical simulation, this paper discusses how the indirect reduction degree and the macro characteristics of BFs, such as the pressure drop of the cohesive zone and of the whole furnace, can be mutually influenced in different TGR-OBF processes. We demonstrate that the whole furnace and the cohesive zone maintain a stable pressure drop and gas flow under the condition of a low coke rate.
2. Deriving a Resistance Coefficient via Experiment
In our previous paper [5], we explained in detail how to derive a resistance coefficient from softening-and-melting experiments. The experimental instruments and methods, as the establishment process of porous model, were also described in that paper. In this section, the softening-and-melting experimental data and the inertial resistance coefficient of the traditional blast furnace’s cohesive zone (R = 50% in Table 1) are added for the application of the whole-furnace porous model.

Table 1.
Correspondence between different parameters.
2.1. Softening and Melting Experiments
Comparing with the traditional BF, the new process of the TGR-OBF adopts a high-oxygen enriched blast. The transformation of gas composition and the amount lead to great changes in the temperature field and the gas distribution in BFs, which change the softening-and-melting behavior of the burden in the cohesive zone. According to the calculation of the energy and the mass balance of a BF [6,7] and a study on the programmed reduction of iron ore under high-reduction potential [8], the oxygen concentration has an approximately corresponding relationship with the coke rate, the coal rate, the direct reduction degree, and the utilization coefficient, as shown in Table 1.
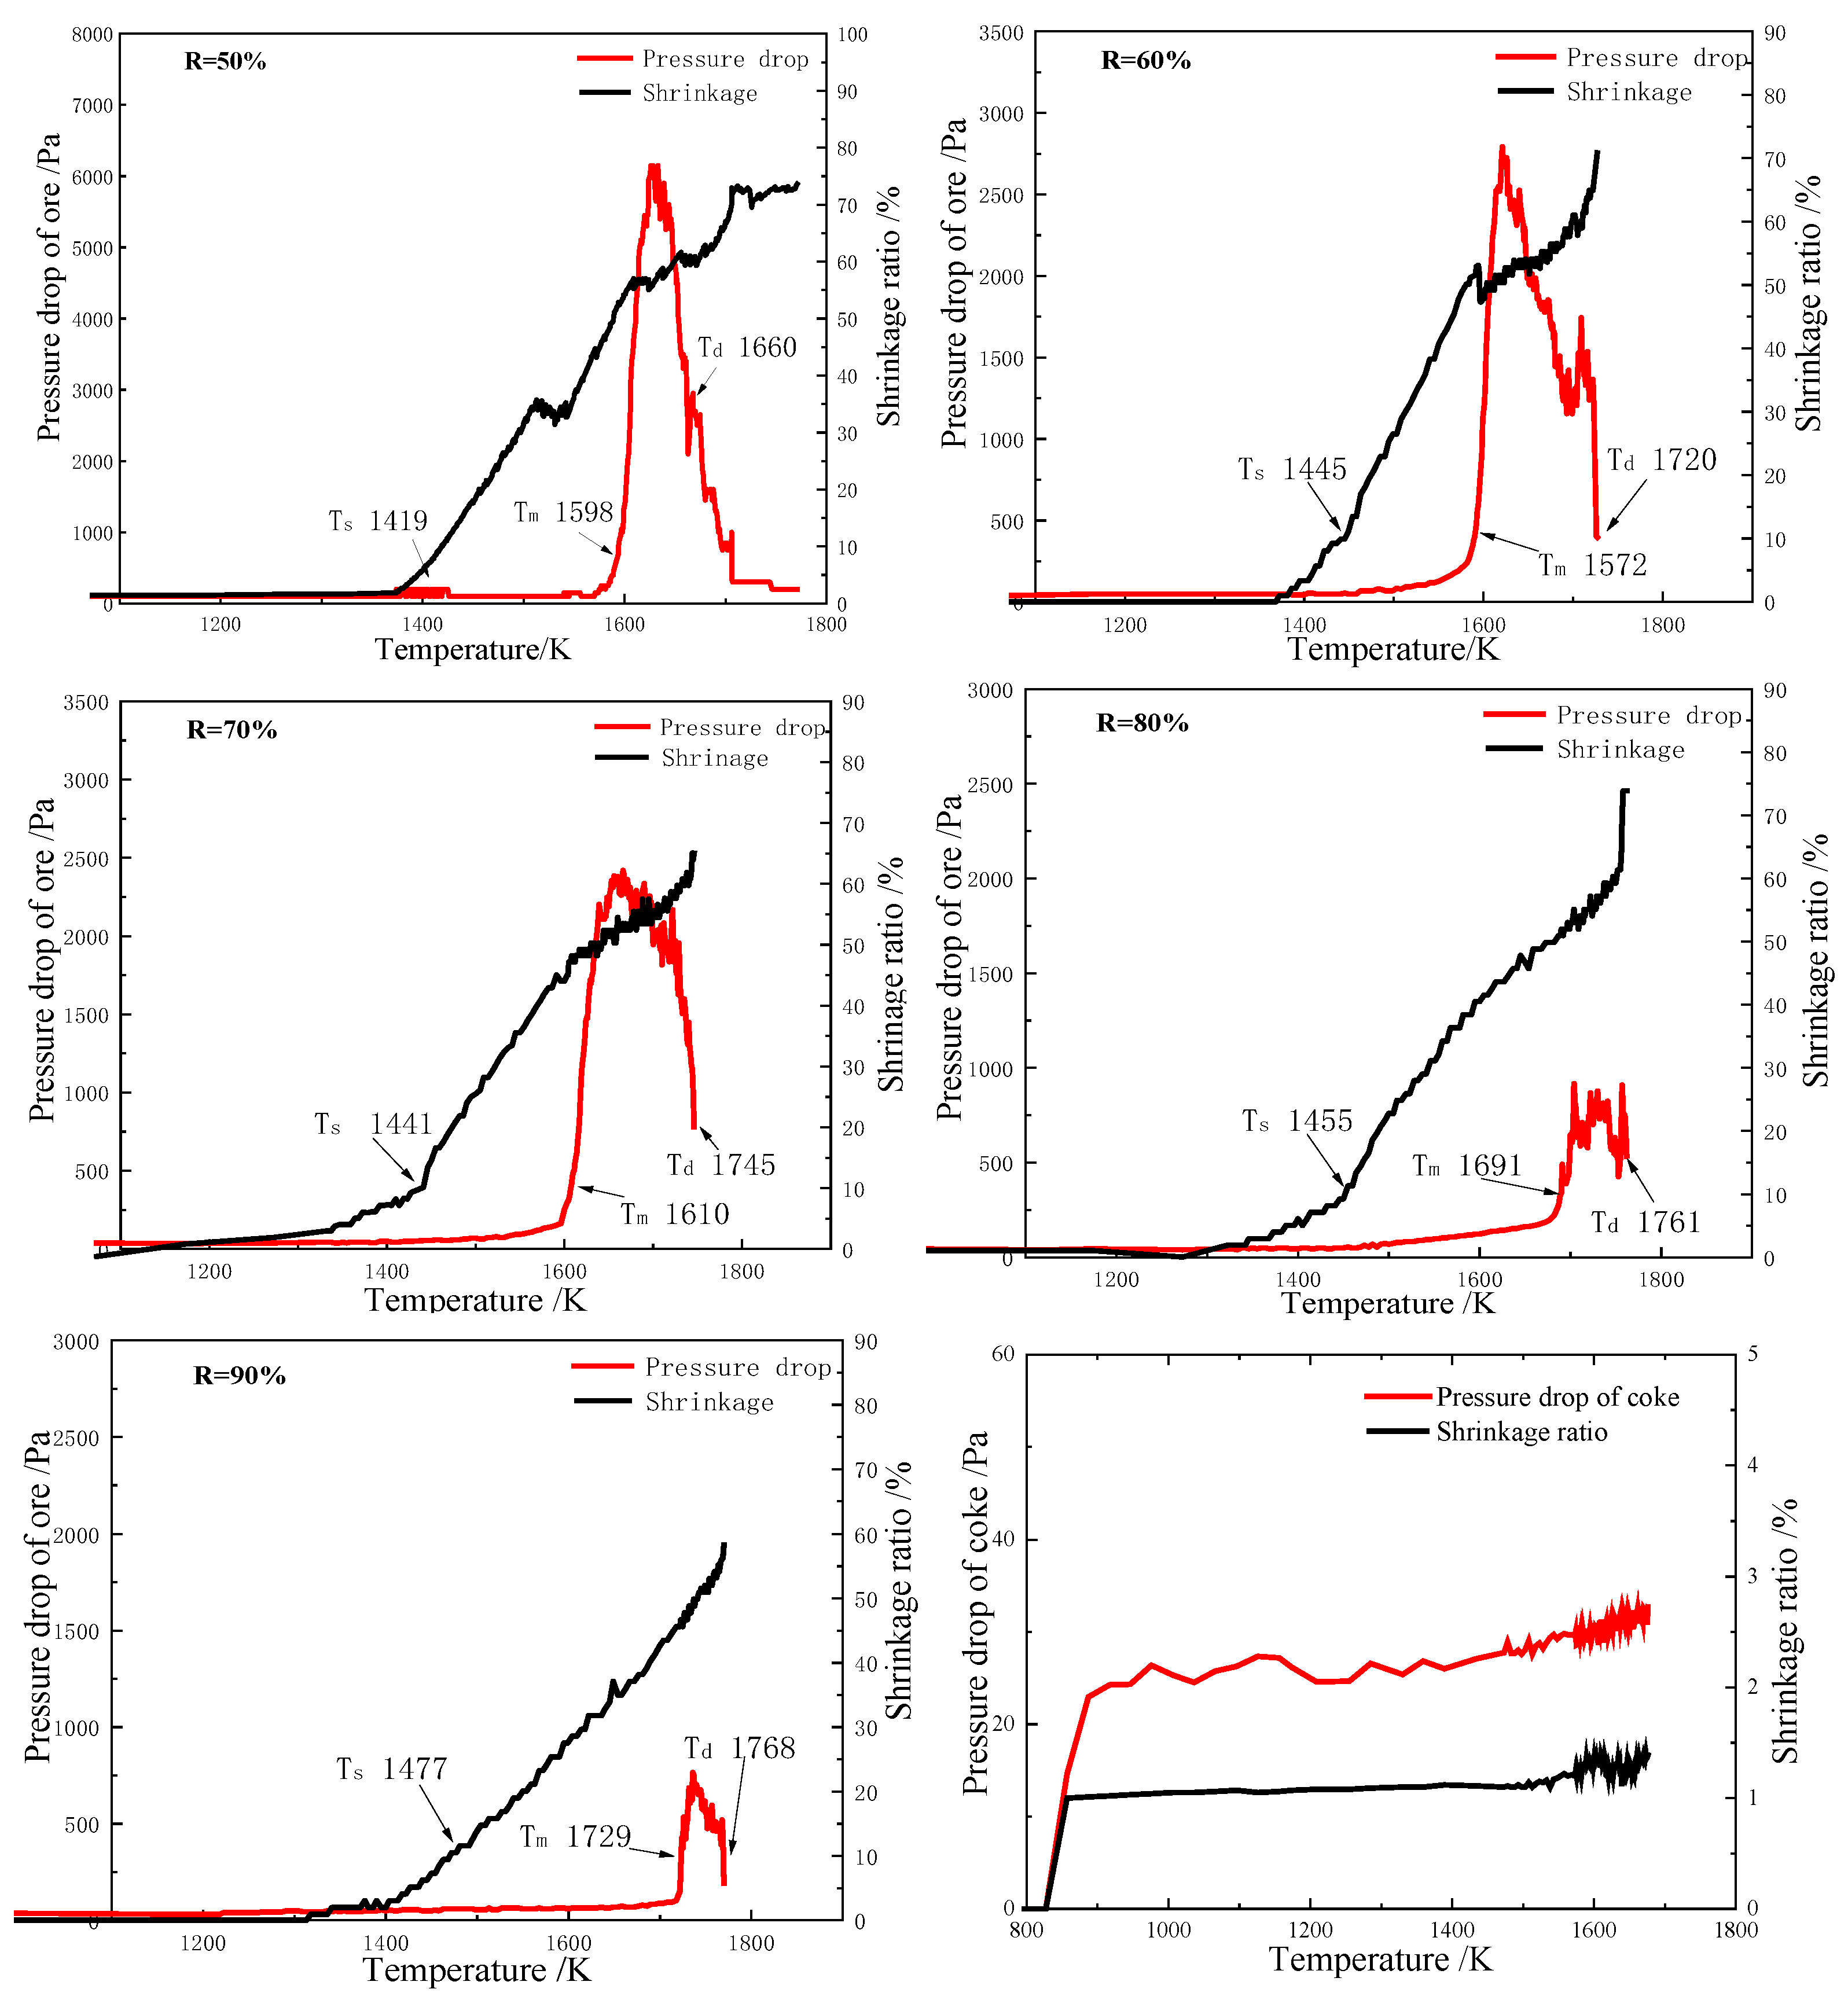
The softening-and-melting experiment results are shown in Figure 1.
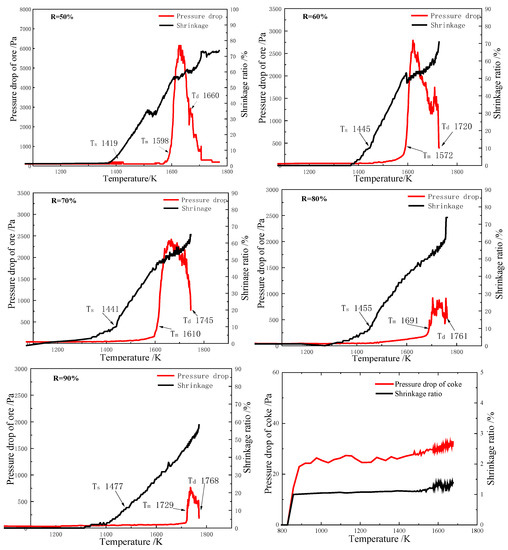
Figure 1.
Pressure drop and coke layer shrinkage ratio, respectively, of the ore layer with prereduction rates of 50%, 60%, 70%, 80%, and 90%.
is temperature point at which softening starts (10% shrinkage); is the temperature value when melting starts (a 490 Pa pressure drop); is the temperature when the dripping begins (the first liquid metal appears).
The trend of the temperature-pressure-drop curve of the softening-and-melting experiment was very consistent with the results in the literature [9,10], and the values were also very close to each other. The curve in Figure 1 shows that the pressure drop and the shrinkage of the coke layer did not change significantly. This explains why coke can play the roles of supporting the material column and maintaining the channel of the upward flow of gas and the downward flow of molten iron, especially in the high-temperature region in the middle and lower parts of BFs.
2.2. Deriving Resistance Coefficient
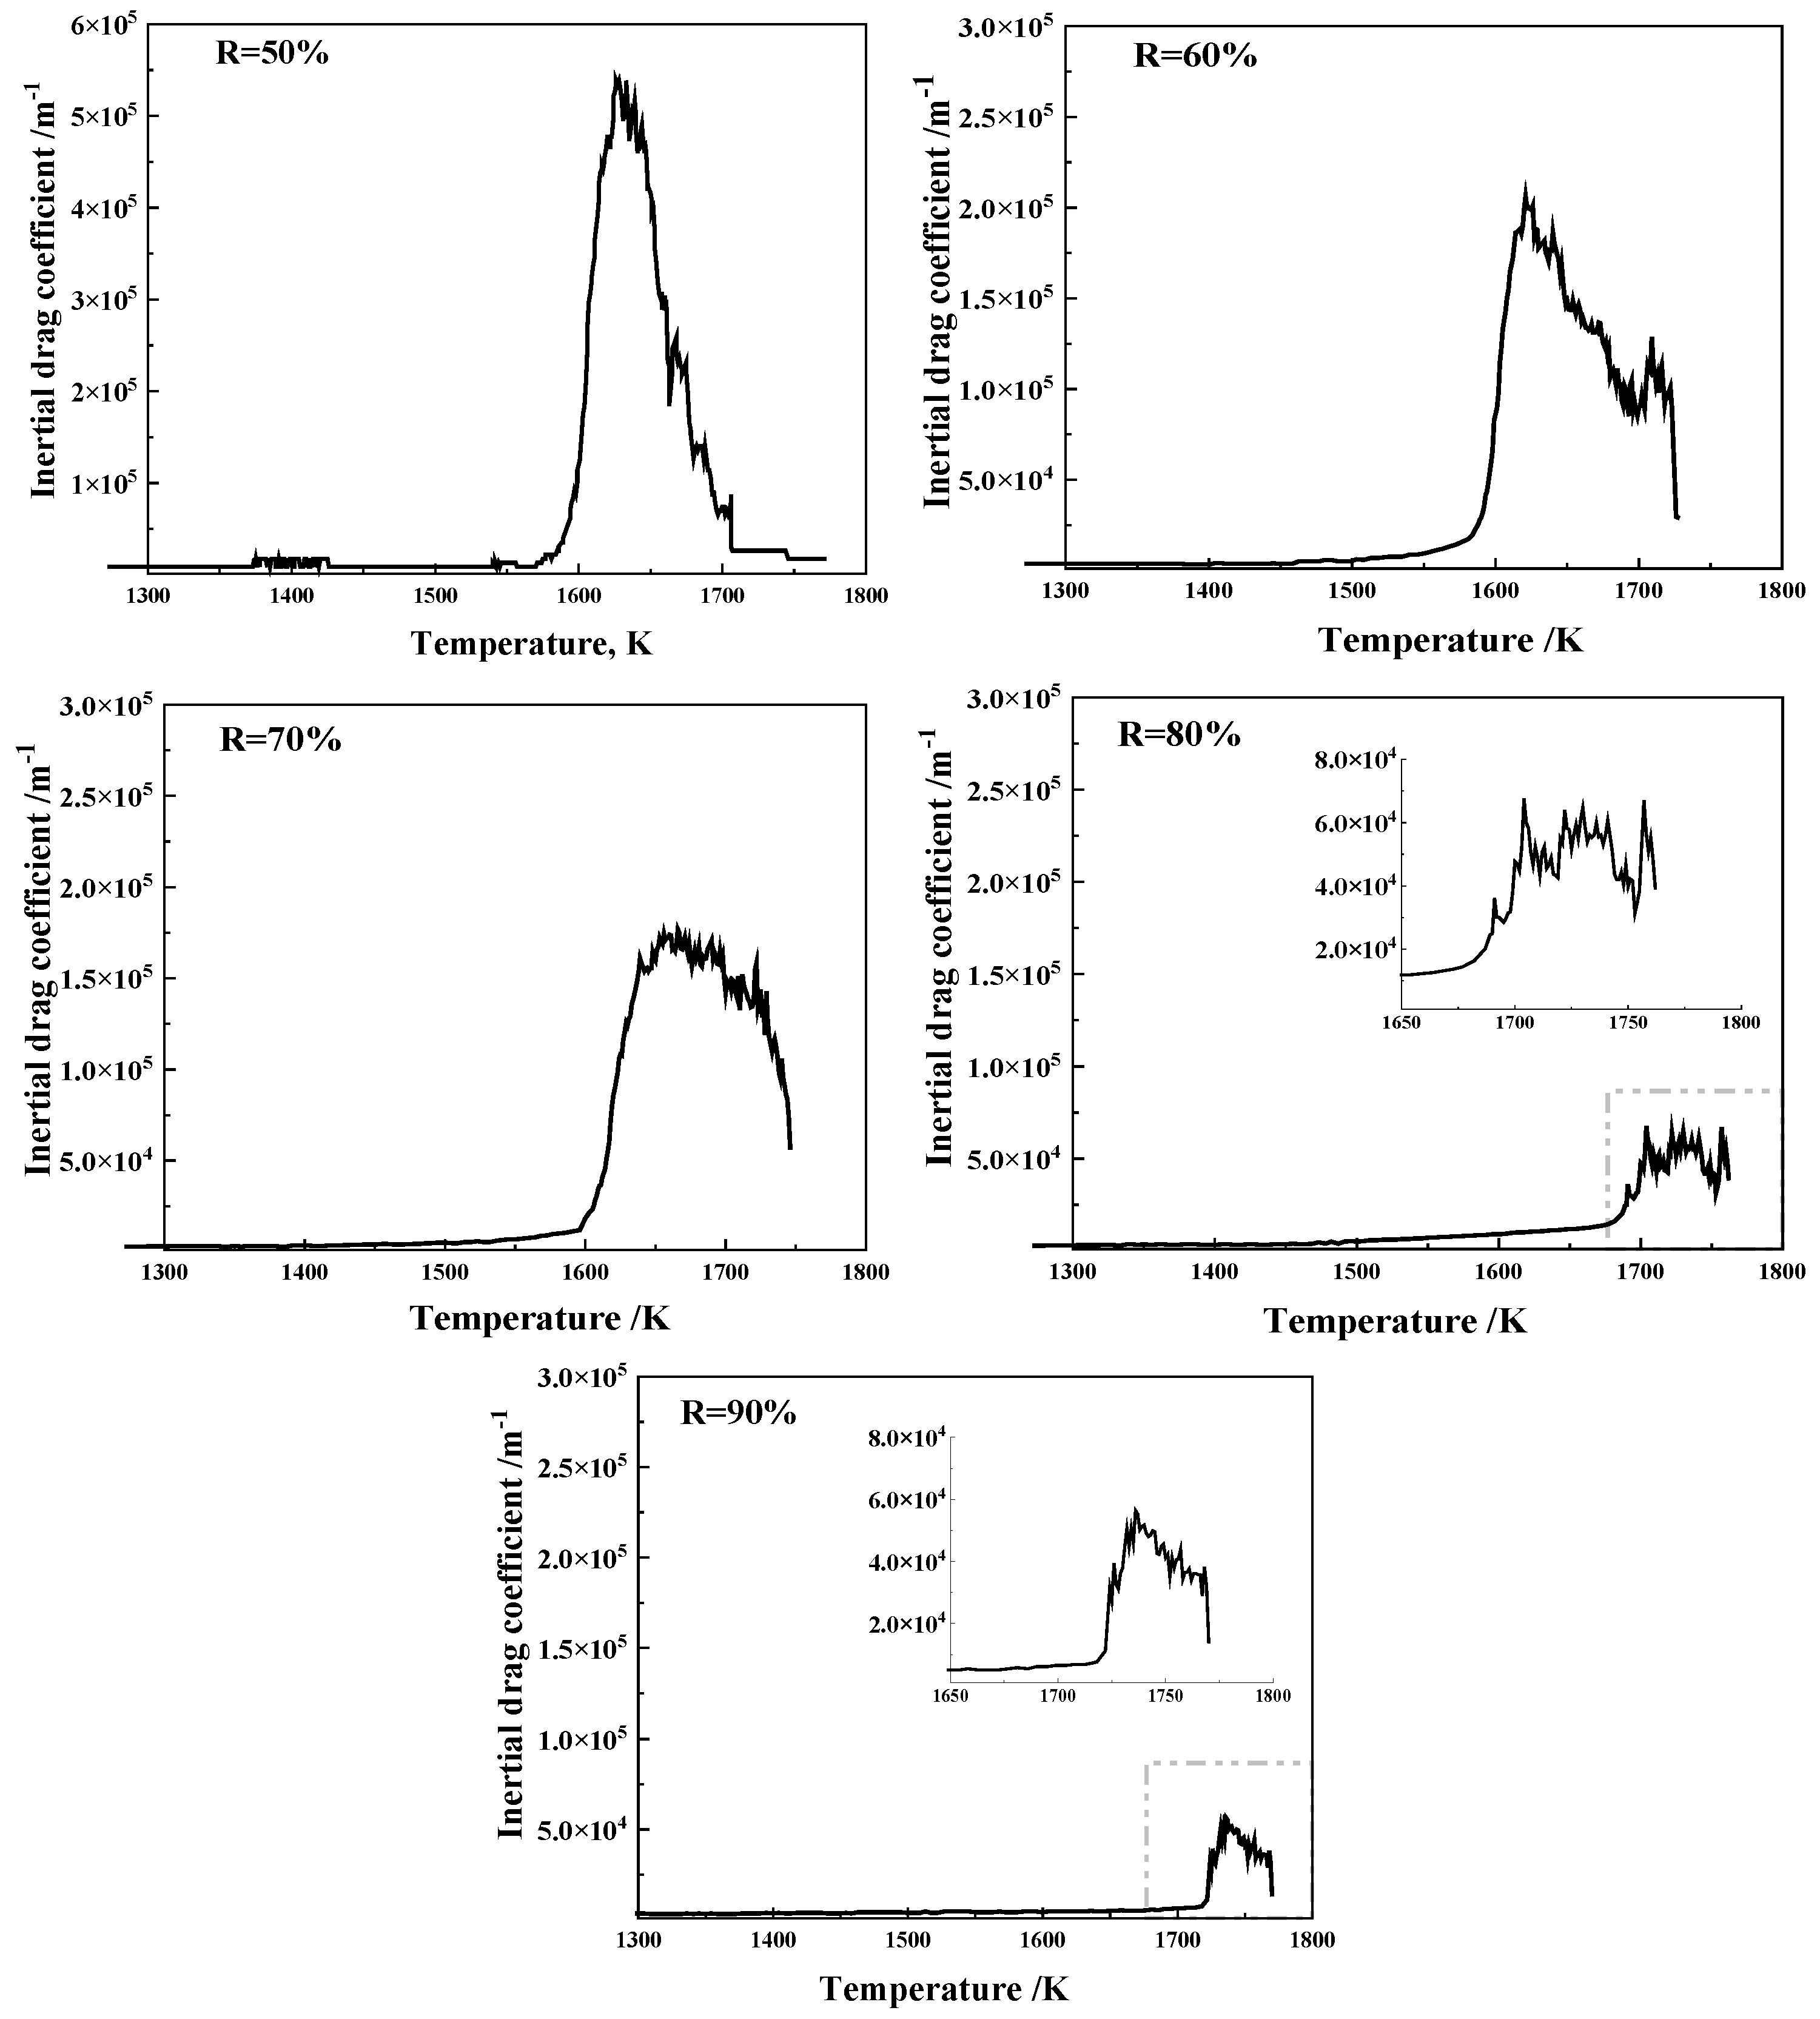
The inertial resistance coefficient is calculated in the same way as in our previous paper; the results are shown in Figure 2.
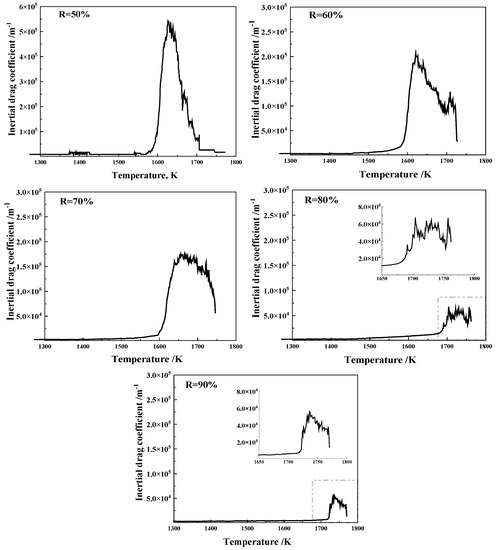
Figure 2.
Inertial drag coefficients of different prereduction ores (50%, 60%, 70%, 80%, and 90%).
With the increase in temperature, the iron ore layer gradually softens and melts. The appearance of the liquid phase worsens the permeability of the ore layer and significantly increases the inertial resistance coefficient in the temperature range of 1600–1800 k. When the liquid phase begins to drip, the channel for the gas flow opens and the inertial resistance coefficient decreases immediately. The inertial resistance coefficient decreases with the increase in the iron ore pre-reduction degree from 50% to 90%. This is because, on the one hand, the more fully the iron ore is reduced, the less the slag phase will be generated and, consequently, the more difficult it is to generate low-melting-point materials. On the other hand, the melting point of iron is much higher than that of the low-melting-point ore material. Therefore, the more complete the pre-reduction of the iron ore, the higher the melting point of its layer, resulting in rapid dripping after melting and shortening the dripping temperature range.
The Riemann summation method is used to solve the average inertial resistance coefficient (named in IDC) of iron ore. Table 2 shows the results.

Table 2.
Average Inertial drag coefficient of different pre-reductions.
Because the pressure drop and the shrinkage of the CL are very small, the average pressure drop is used to calculate the inertia resistance coefficient of the CL directly. The ore burden still remains as bulk in the cohesive zone. As the pressure drops of the ore layer at the shrinkage starting temperature () with different pre-reduction degrees are relatively similar, a uniform inertial resistance coefficient of the bulk ore layer (BOL) is used. The results are shown in Table 3:

Table 3.
Inertial drag coefficient of coke and bulk burden.
3. Model Description
In this paper, the governing equations for flow are the same as those in our previous paper. Therefore, only the BF geometry and the solution domain are described here. The grid and solution domain were established based on the performance indicators of a traditional BF in plant A and the research results of the height and width of the cohesive zone as described in the literature. A layered inverse V-shaped cohesive zone with an inclination of 60°, which is commonly detected in industrial BF, was used. The root of the cohesive zone was set to locate at the middle of the BF bosh. The coke and ore were charged alternatively, layer by layer [11]. The charging system of the BF (430 m3) in plant A is shown in Table 4:

Table 4.
Operation condition of BF (430 m3) in plant A.
The radial length of the lowest COL in the cohesive zone is half of the bosh radius [12]. The radial length of the uppermost COL is calculated by Equation (1) [13]. The radial length of the other COLs is calculated according to the equal difference sequence:
where is the COL’s radial length, is the cohesive zone inclination, d is the coke’s mean diameter, m is the coke and ore layer thickness‘s ratio, and n is the number of COLs in the simulation domain.
The ore layer thickness in the cohesive zone was fixed to 0.3 m because the average shrinkage of ore was approximate 40% in the high-temperature experiment. In order to compare the results of R = 50% and R = 60%, the CL thickness and the number of COLs were set to be the same in this paper, although the coke rates of the R = 60% and R = 50% processes were different. In addition, we considered the simplified stock-line profile of a bell-less charging system [3,14]. The position and shape of the tuyere raceway [15] and the deadman [16] were set according to the literature. In addition, the influence of different stack tuyere heights on the pressure drop and the gas flow rate was studied. The parameters and the internal geometry of different pre-reduction degrees are shown in Table 5.

Table 5.
Parameters and internal geometry of different pre-reduction degrees.
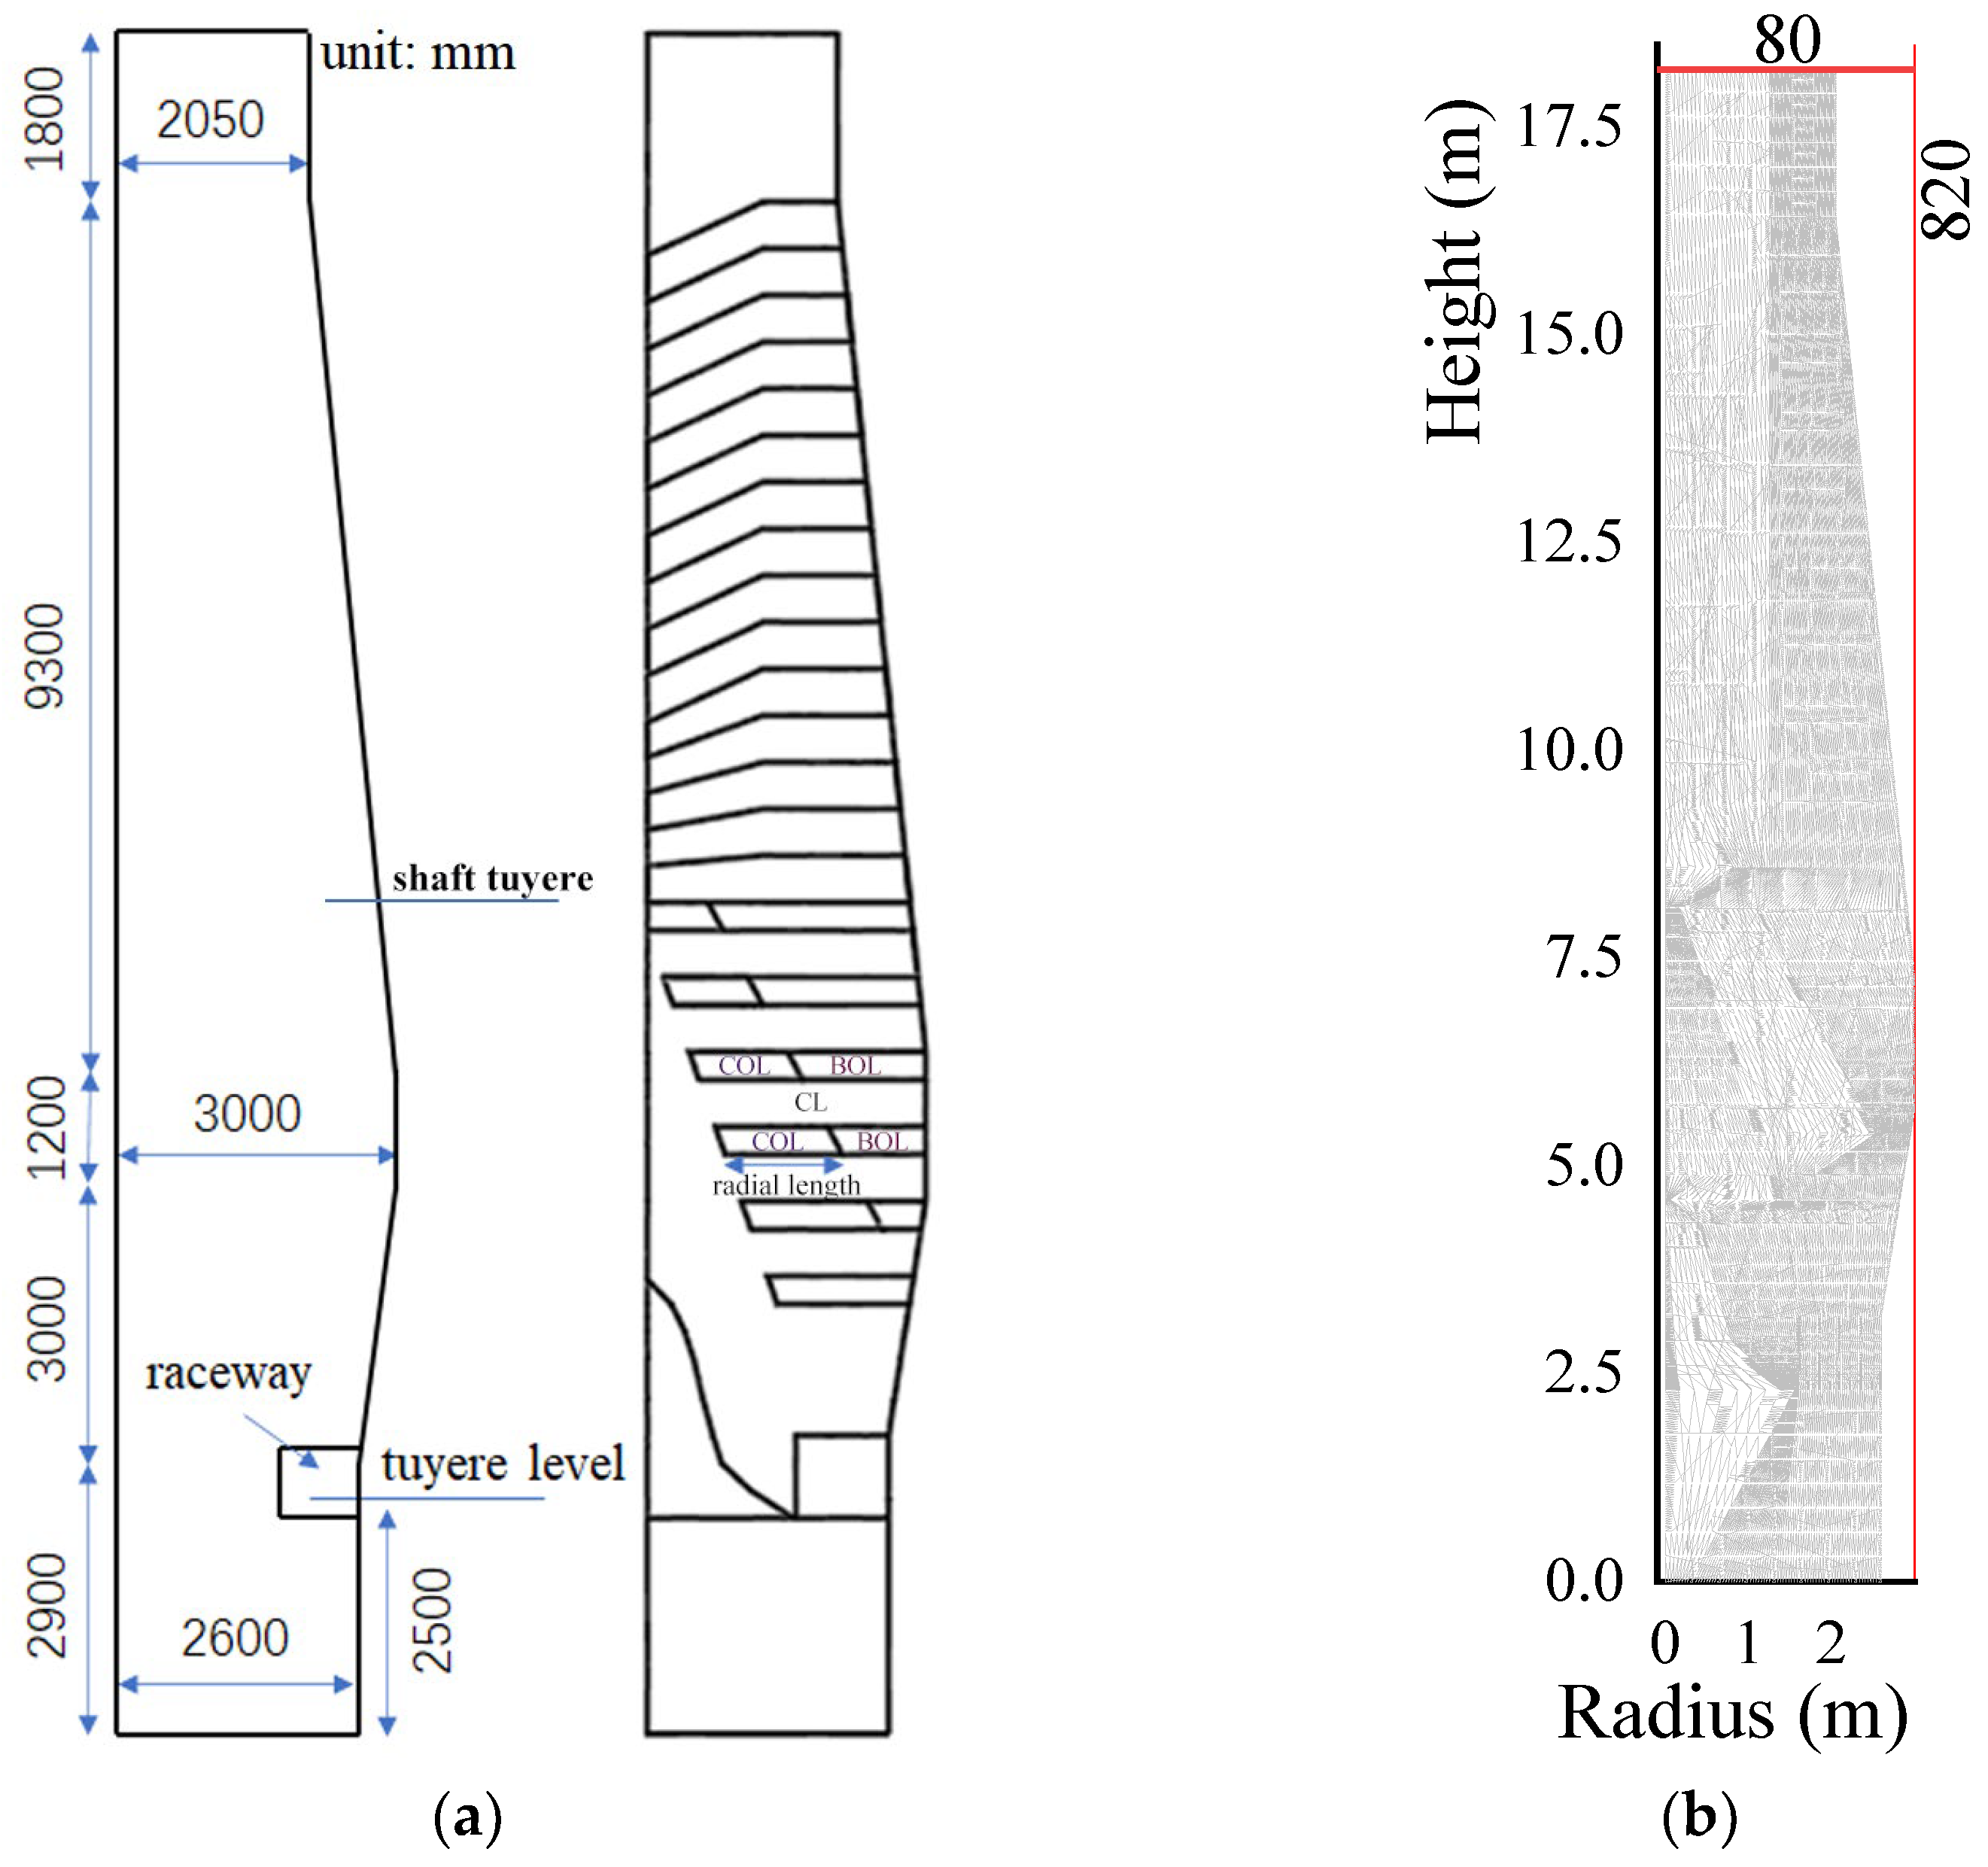
Taking the case of R = 60% as an example, the furnace geometry and the grid are shown in Figure 3. The number of grid nodes is 820 × 80 = 65,600.
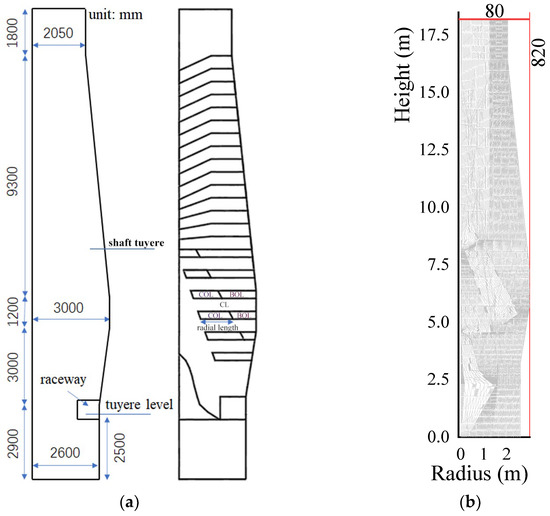
Figure 3.
Schematic of BF geometry (a) and grid diagram (b) (R = 50%, in mm). COL: cohesive ore layer, BOL: bulk ore layer, CL: coke layer.
A validated 2D steady-state porous model is used in this work. Velocity-inlet is used for both hearth and shaft tuyeres. Operating pressure is set zero kPa. Gravitational acceleration is −9.8 m/s2 in the Y direction. Boundary conditions are shown in Table 6.

Table 6.
Boundary conditions of different cases *.
4. Results and Discussion
This section compares the whole furnace pressure drop and the gas flow velocity of different cases. For example, we consider a conventional BF with or without charged central coke, different stack tuyere heights, and different pre-reduction degrees. In addition, a permeability index is established to quantitatively compare the gas amount through the COL or the CL.
4.1. Conventional BF with Charged Central Coke
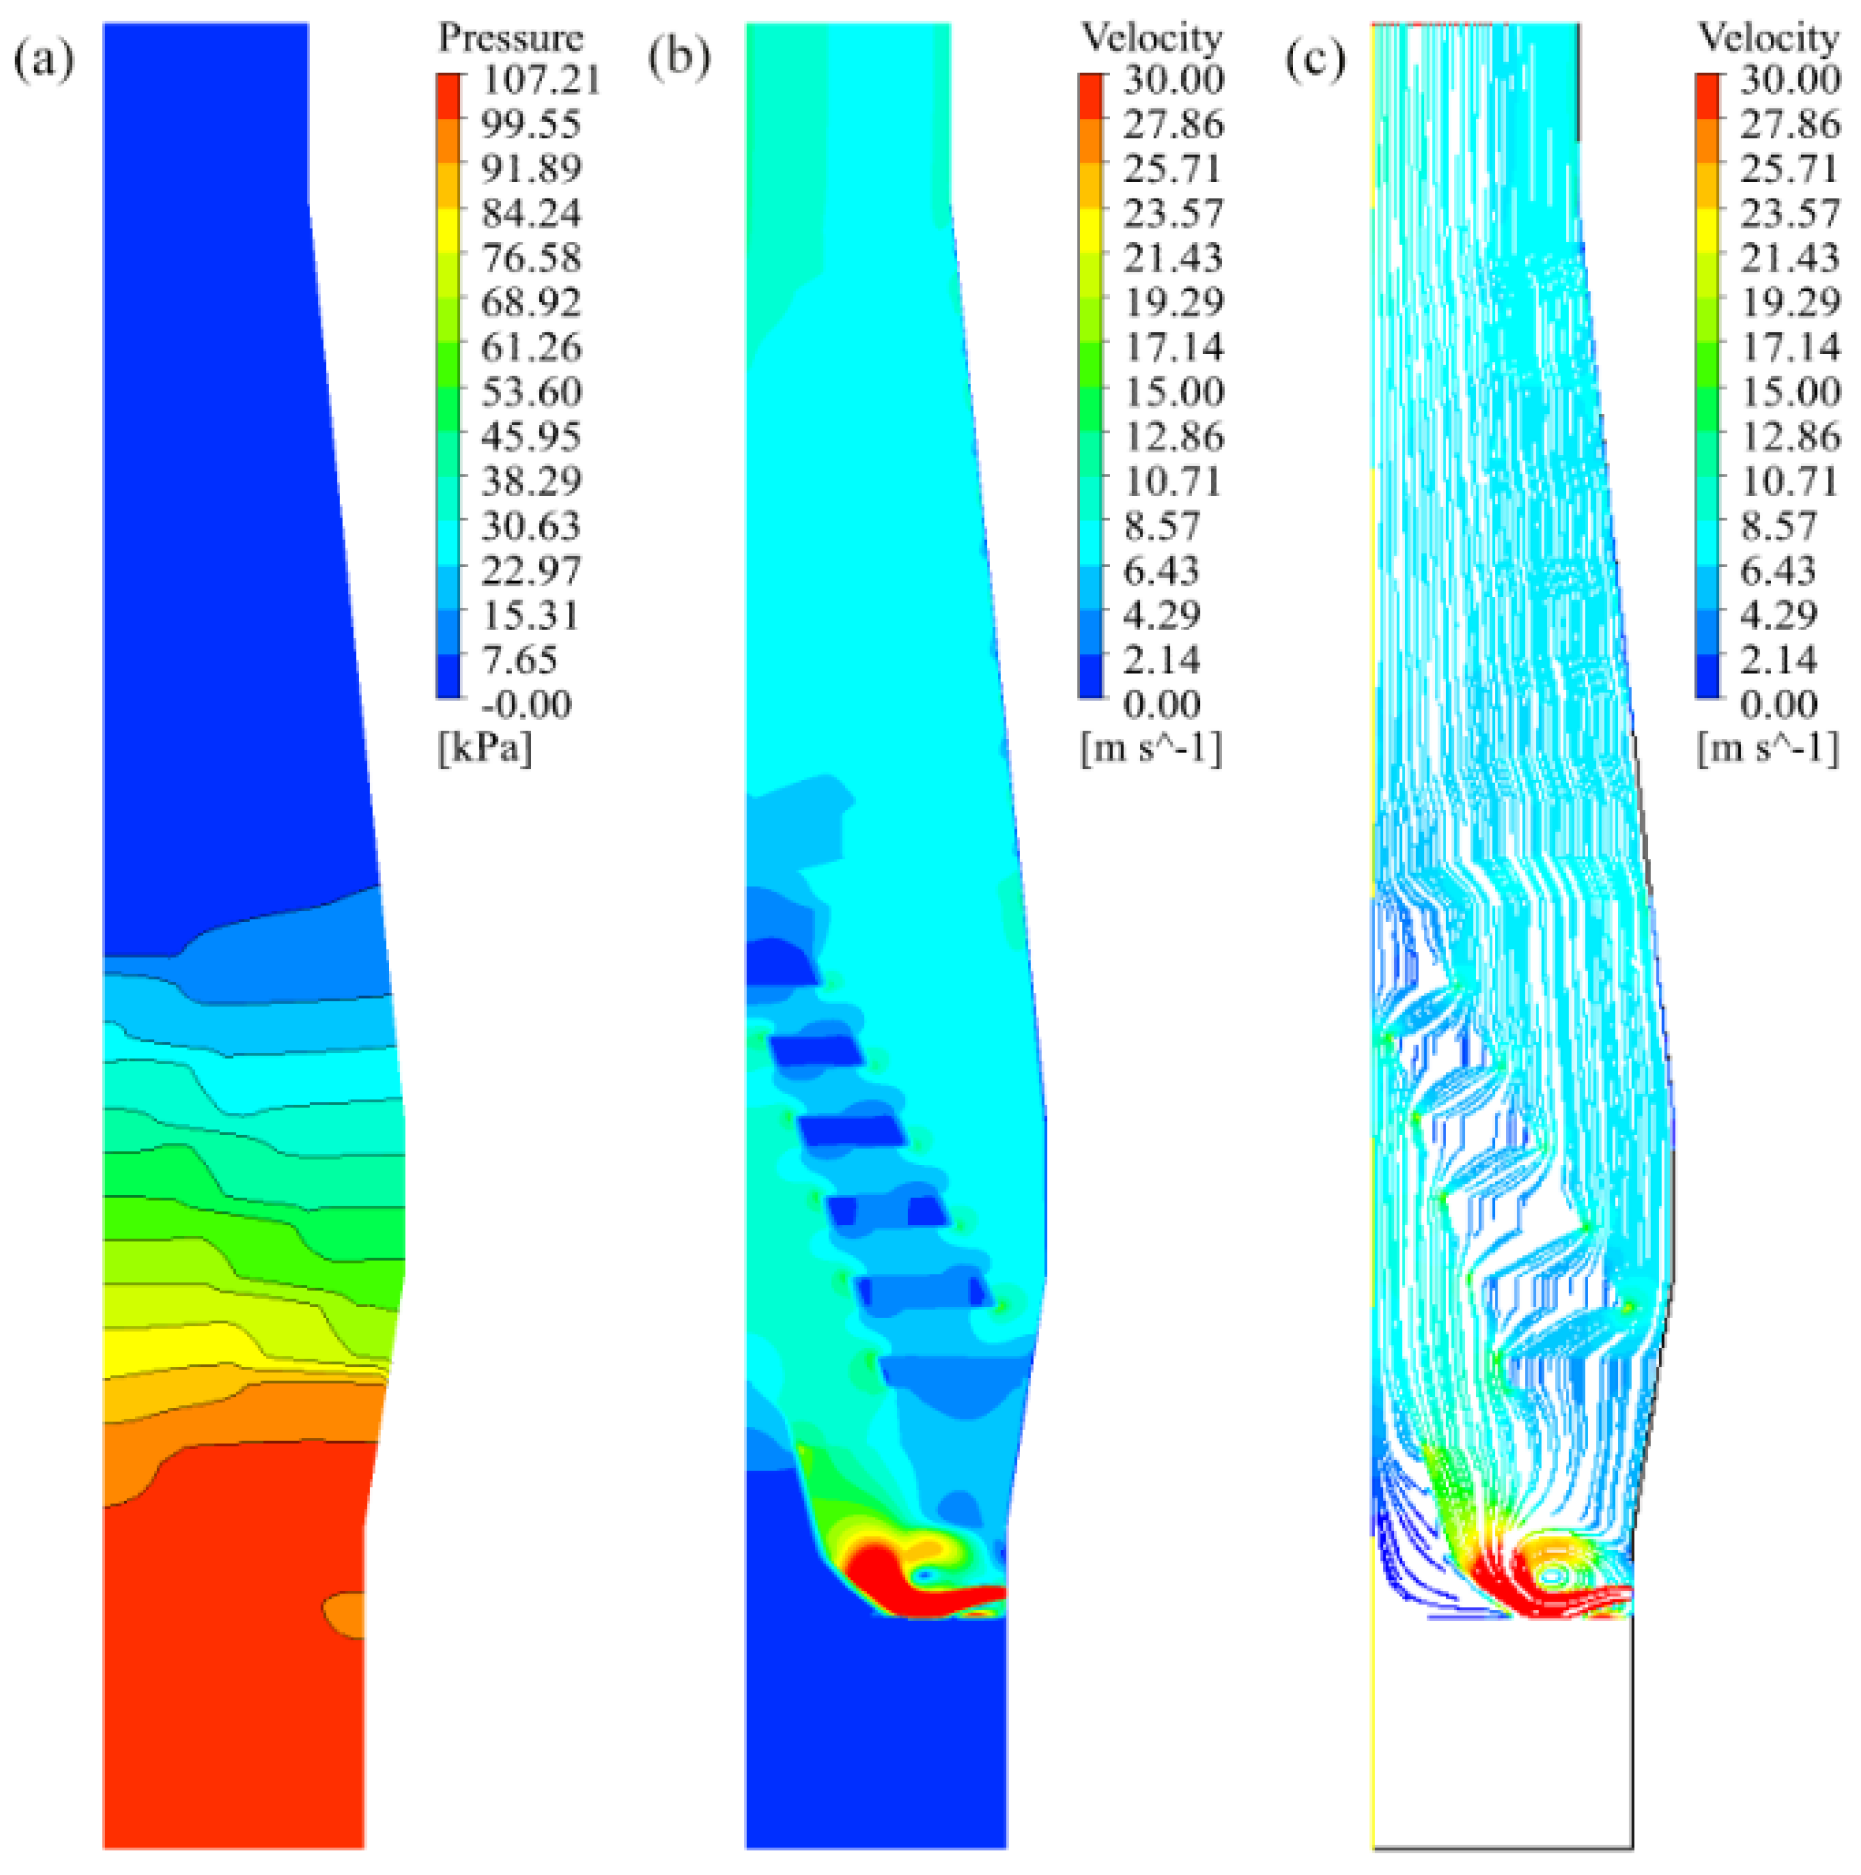
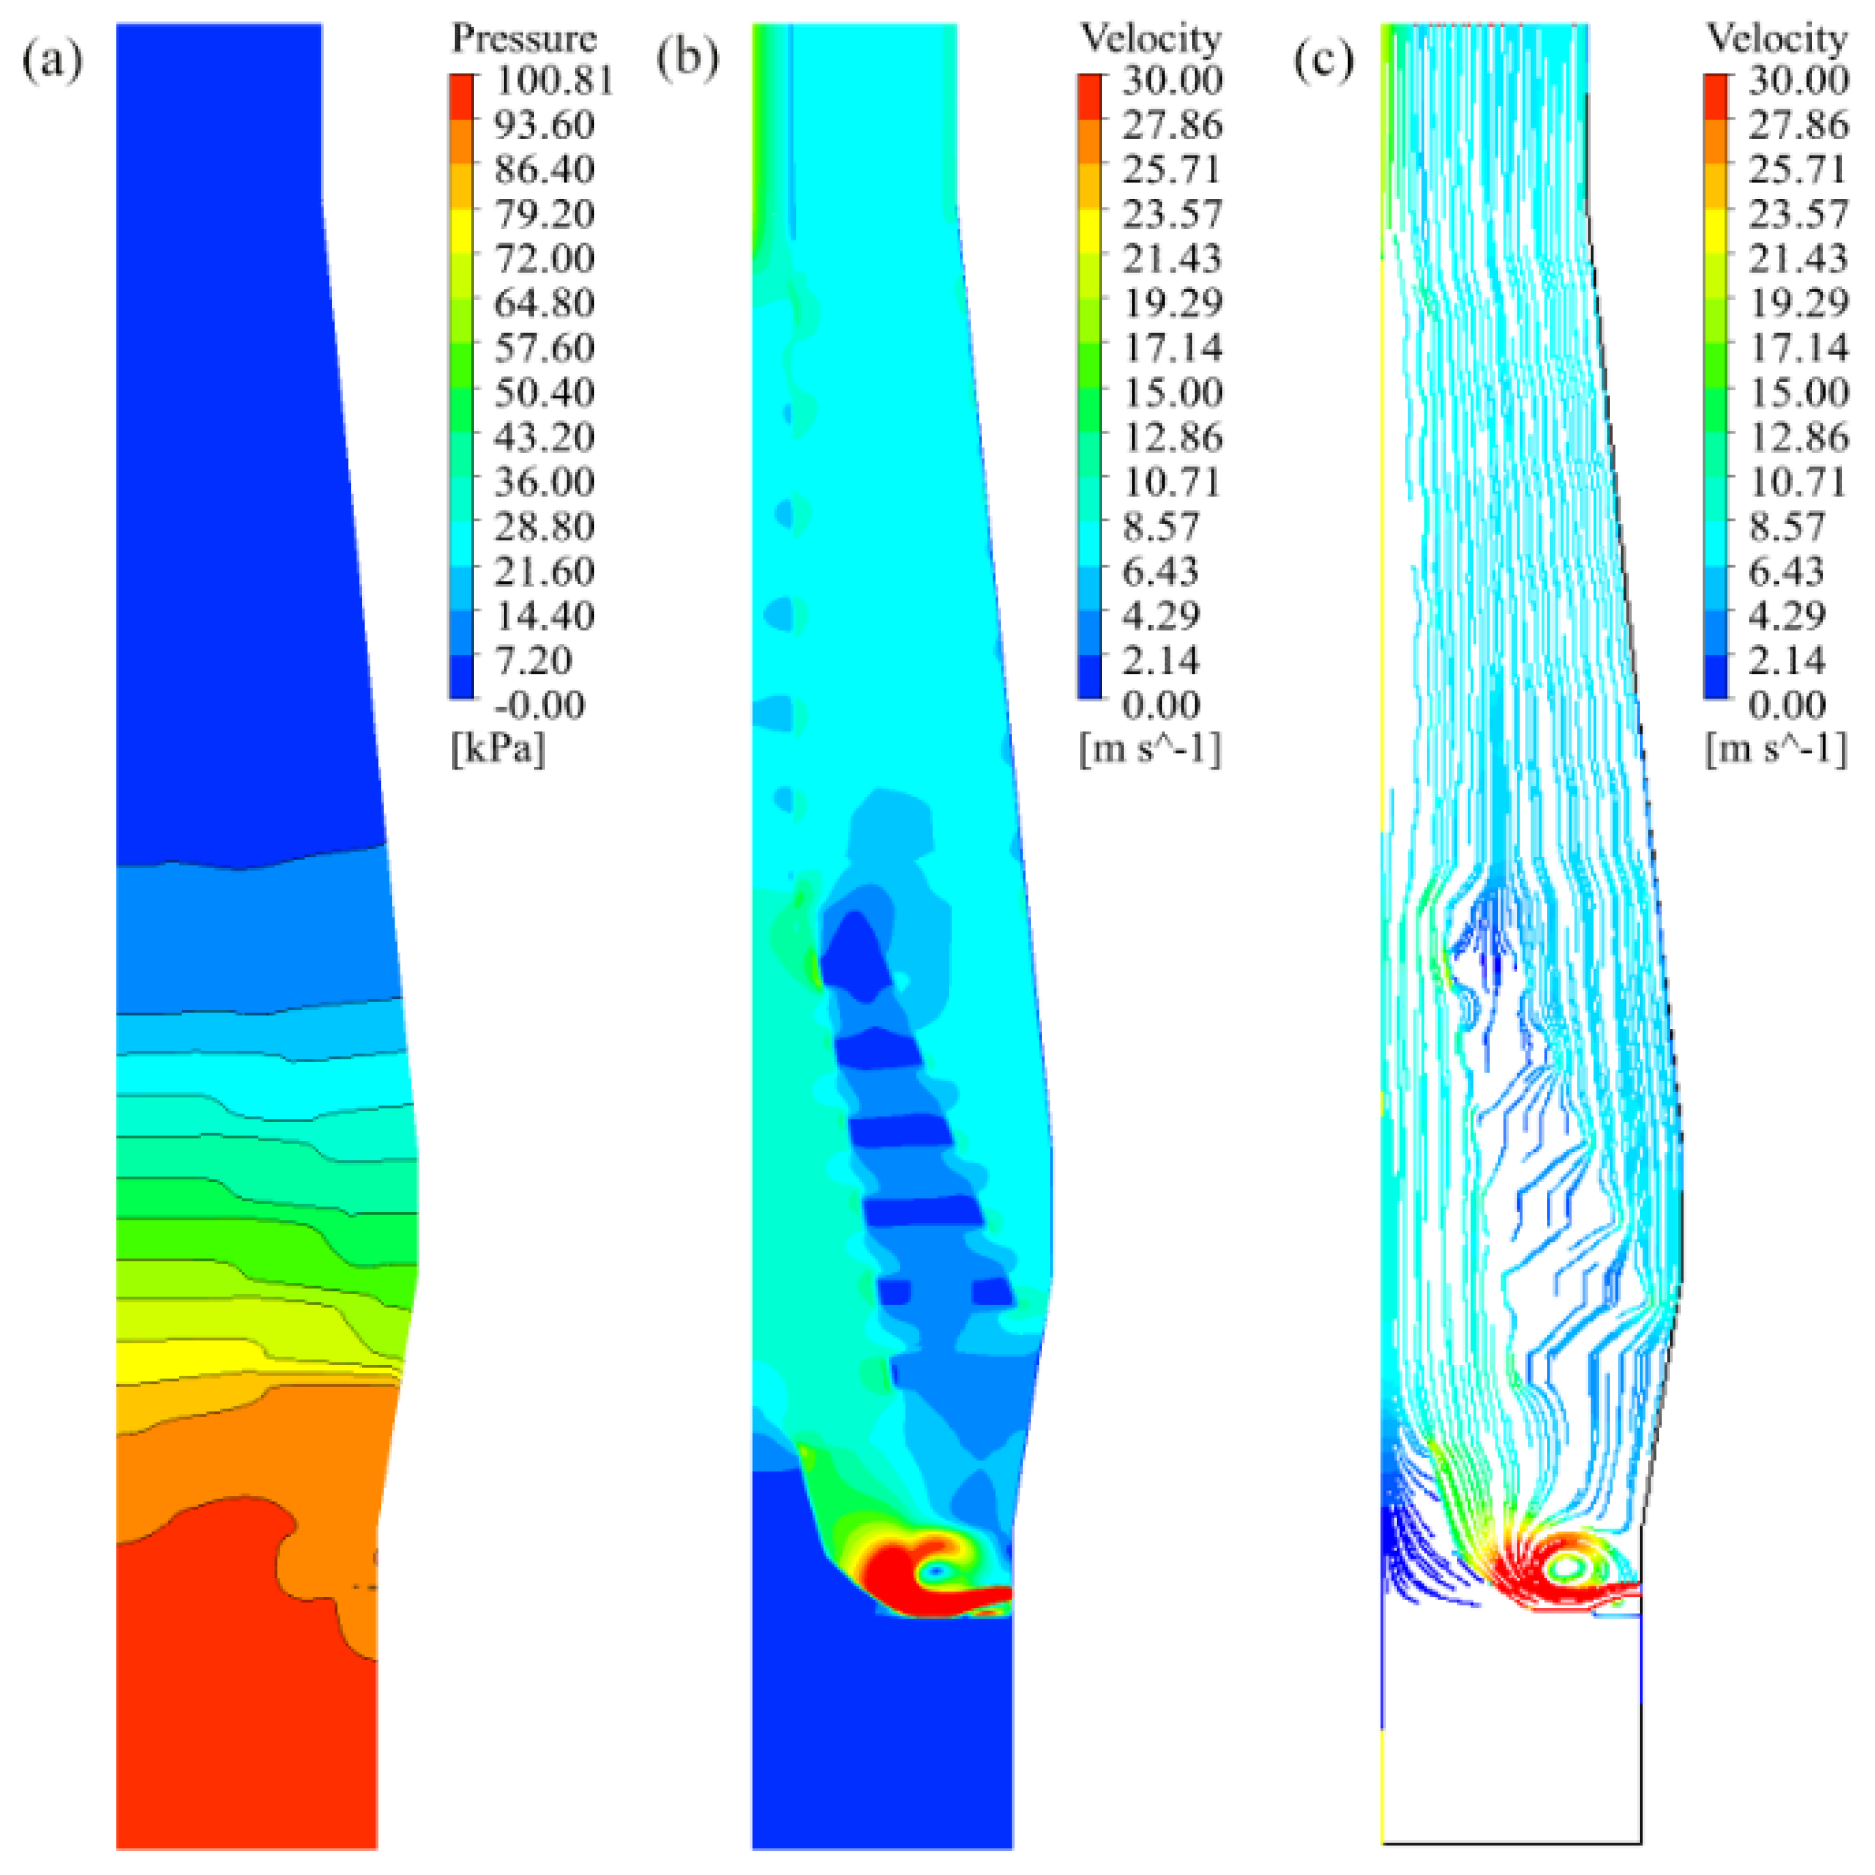
Charging more coke into the central region is commonly used by industrial BFs to reduce the in-furnace pressure drop. In this section, we study the whole-furnace pressure drop and the gas flow velocity of the traditional BF process (R = 50%), with and without charged central coke. In this way, it is feasible to verify the accuracy of the 2D porous model. The whole-furnace pressure drop (107.21 kPa) without coke enrichment in the center is consistent with the present-day 500 m3 BF. The whole-furnace pressure drop with central coke charging is 100.81 kPa, which is lower than that when central coke is not considered and reflects the effect of the central coke operation in reducing the whole-furnace pressure drop. This verifies the reliability of our 2D porous model. In order to clearly display the speed distribution in the low-speed region, areas with gas flow velocity ≥ 30 m/s are all configured to red.
Some typical in-furnace phenomena, such as the high-speed gas flow in the raceway, the low-speed gas flow in the deadman and the cohesive zone, and the central gas flow and a small amount of border gas flow at the outlet, are based on the velocity contours, as shown in Figure 4 and Figure 5. Under the operating conditions of central coke, a large amount of gas blown from the raceway can flow directly to the furnace center, then to the outlet, without the secondary distribution of the CL in the cohesive zone, resulting in the central gas flow velocity increasing from 8.57 m/s (without central coke) to 17.14 m/s (with central coke). Therefore, for some blast furnaces, temporary central-coke charging is only used when the furnace condition is not smooth.
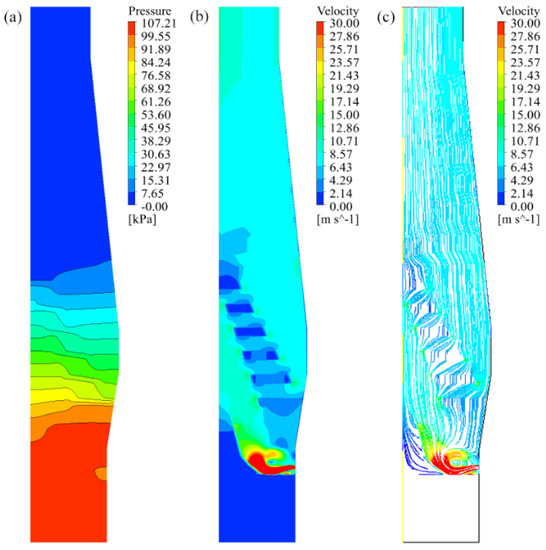
Figure 4.
Contour and path line of traditional BF (without central coke, R = 50%, = 60°, n = 6): (a) pressure contour, (b) velocity contour, and (c) path line.
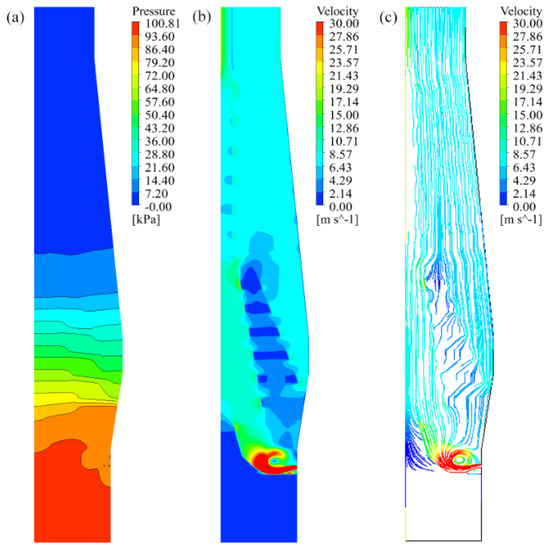
Figure 5.
Contour and path line of traditional BF (with central coke, R = 50%, = 60°, n = 6): (a) pressure contour, (b) velocity contour, and (c) path line.
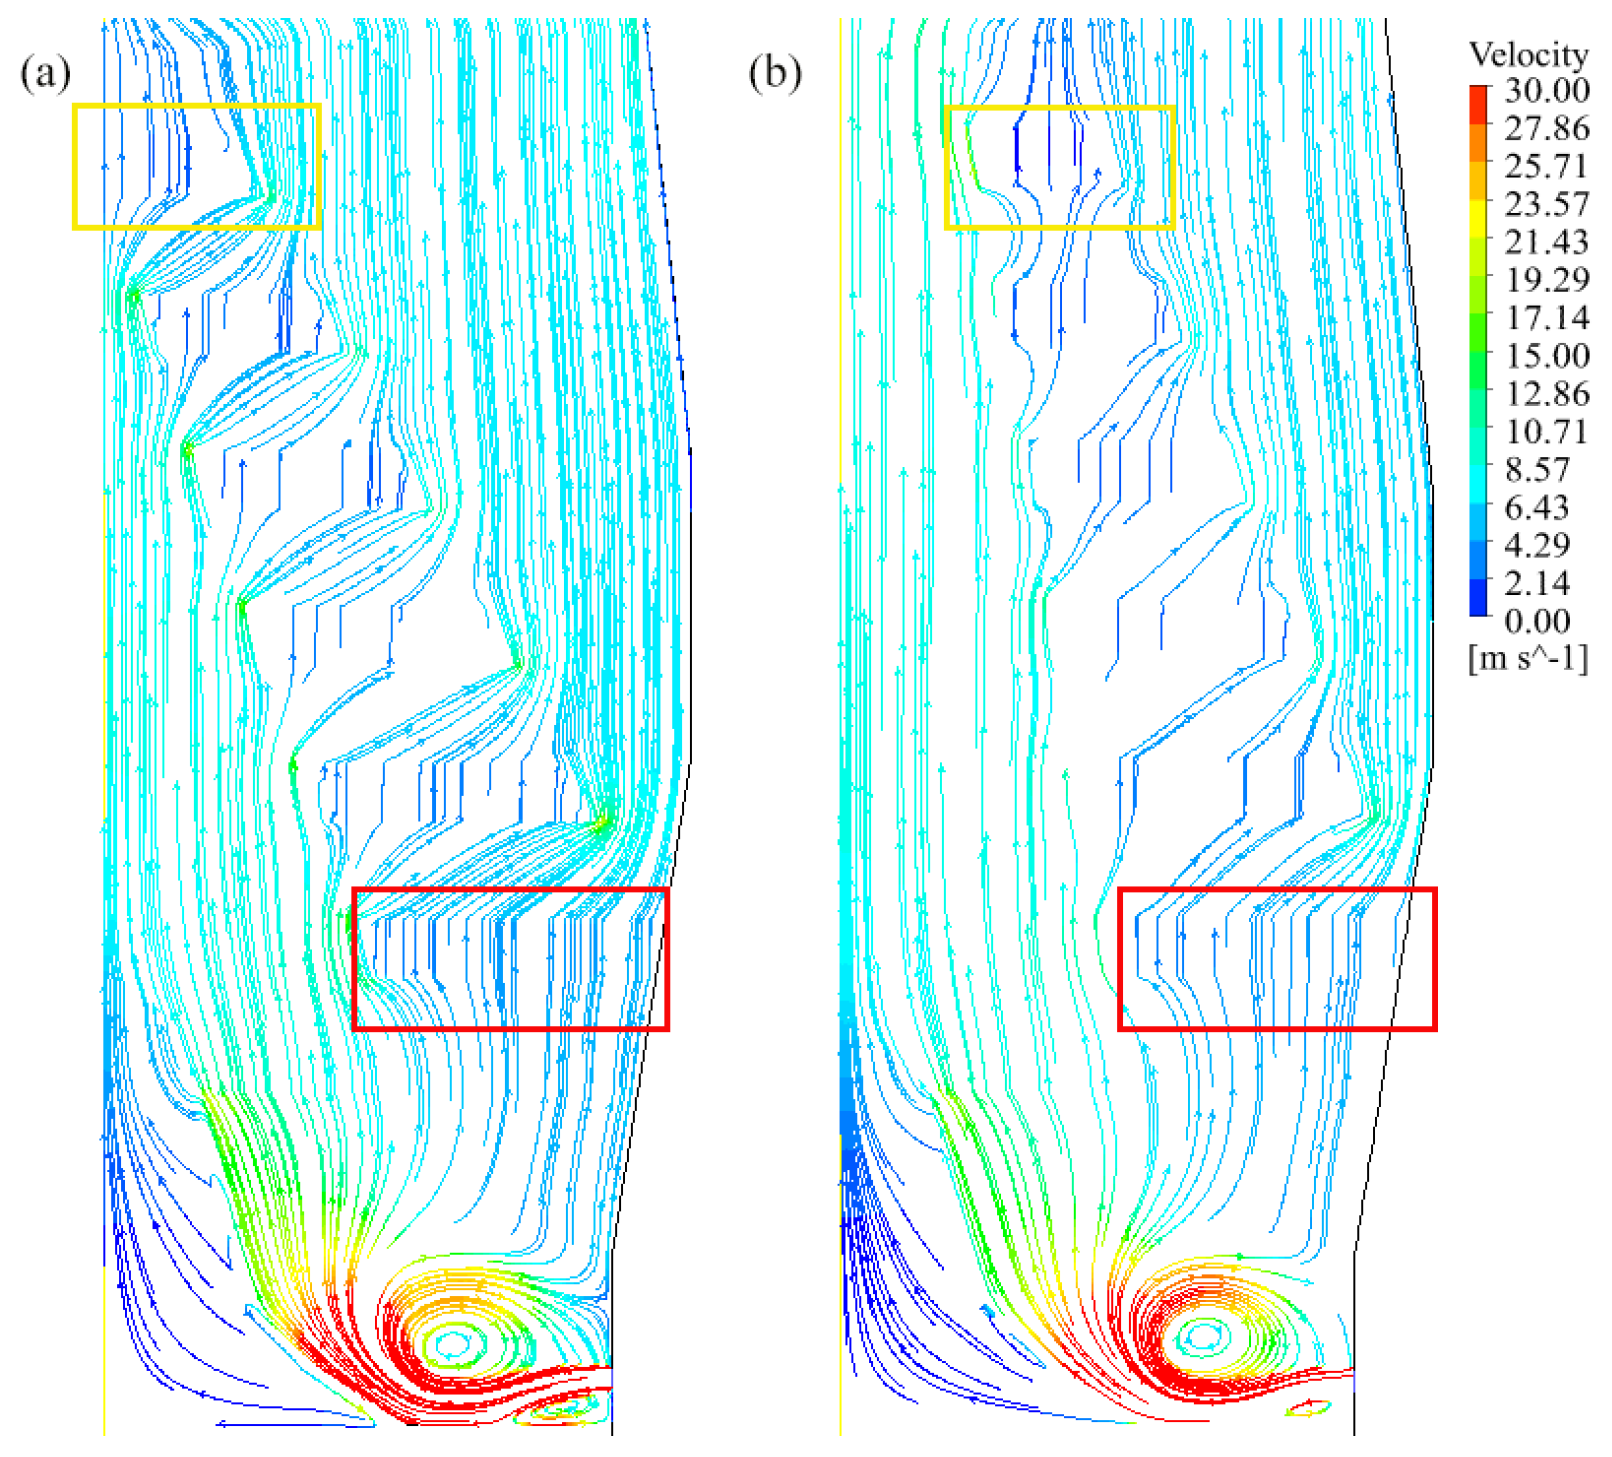
As shown in Figure 6, the gas flow in the raceway starts to whirl after its entrance into the furnace because of the blocking effect of coke. During whirling, the gas is basically divided into two major streams. One turns to move vertically upward, passes through the lowest COL, then deflects the flow direction again under the resistance influence of the COL, imposing a strong scouring on the lining at the bosh angle, then adhering to the furnace wall to finally converge with a border gas flow. The other one flows upward along the loose coke layer in the center and mostly passes through the topmost COL and its adjacent CL to form the central gas flow. In addition to the above two major streams, a small part of the stream passes through the rest of the CL and the COL, then continues to move upward through the porous burden bed.
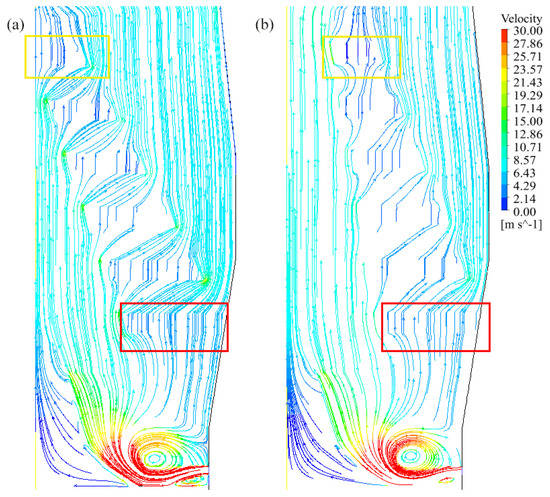
Figure 6.
Path line of cohesive zone in a traditional BF (R = 50%, = 60°, n = 6): (a) without central coke; (b) with central coke.
For central coke charging, a gas channel from the raceway to the furnace top is formed directly. Therefore, the gas flow velocity in the central region at the outlet is large, while the gas flow velocity through the CL of the cohesive zone is relatively small. By comparing the velocity contour and the path line of the two charging systems, this model can explain the formation mechanism of two in-furnace gas streams, the primary distribution function performed by the raceway, and the secondary distribution function performed by the cohesive zone.
4.2. Influence of Different Stack Tuyere Heights
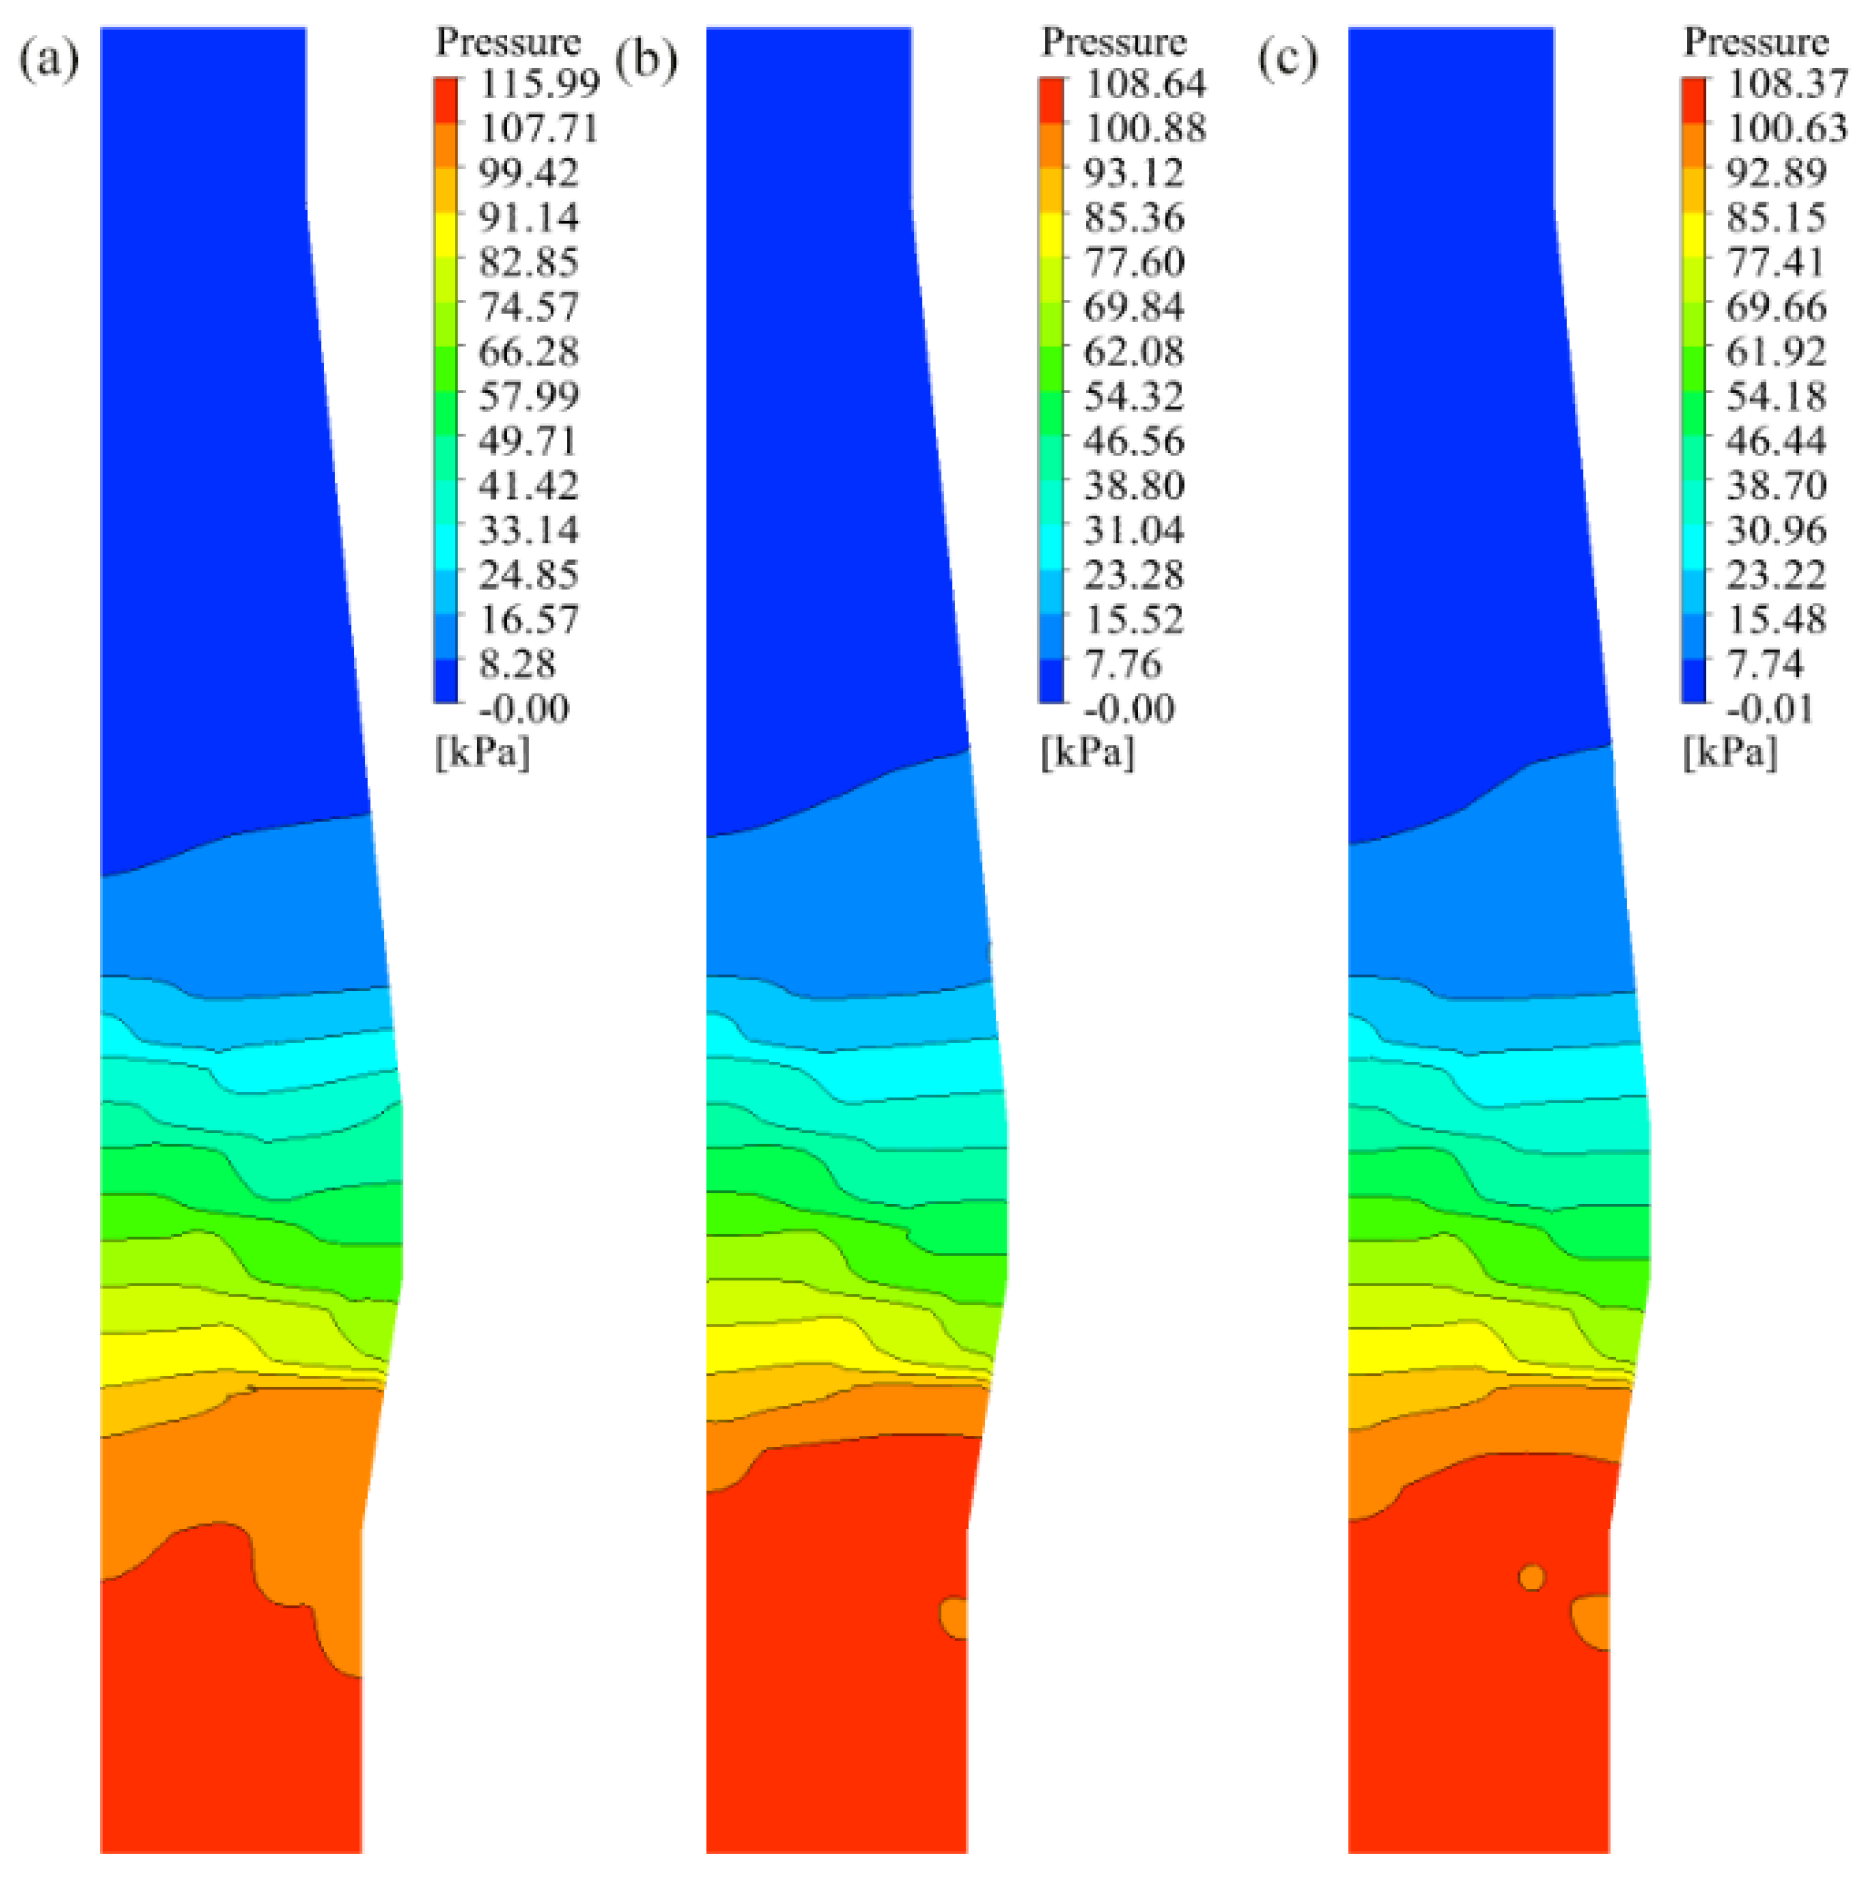
As a supplement for insufficient heat in the stack, the TGR-OBF designs a set of tuyeres for injecting heated recycling gas into the stack. In this section, three kinds of stack tuyere heights (0.0 m, 1.8 m, and 3.6 m up from the upper edge of the furnace belly) are calculated to study the influence of stack tuyere heights on the pressure drop and the gas flow velocity in BFs. The pressure contour in Figure 7 shows that the pressure drop of the whole furnace generally decreases with the increase in the stack tuyere height.
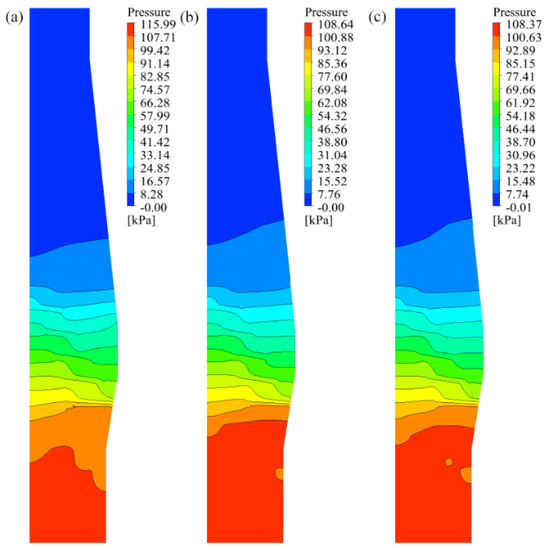
Figure 7.
Pressure contour of three stack tuyere heights (R = 60%, blast velocity = 23 m/s): (a) H = 0.0 m, (b) H = 1.8 m, (c) H = 3.6 m.
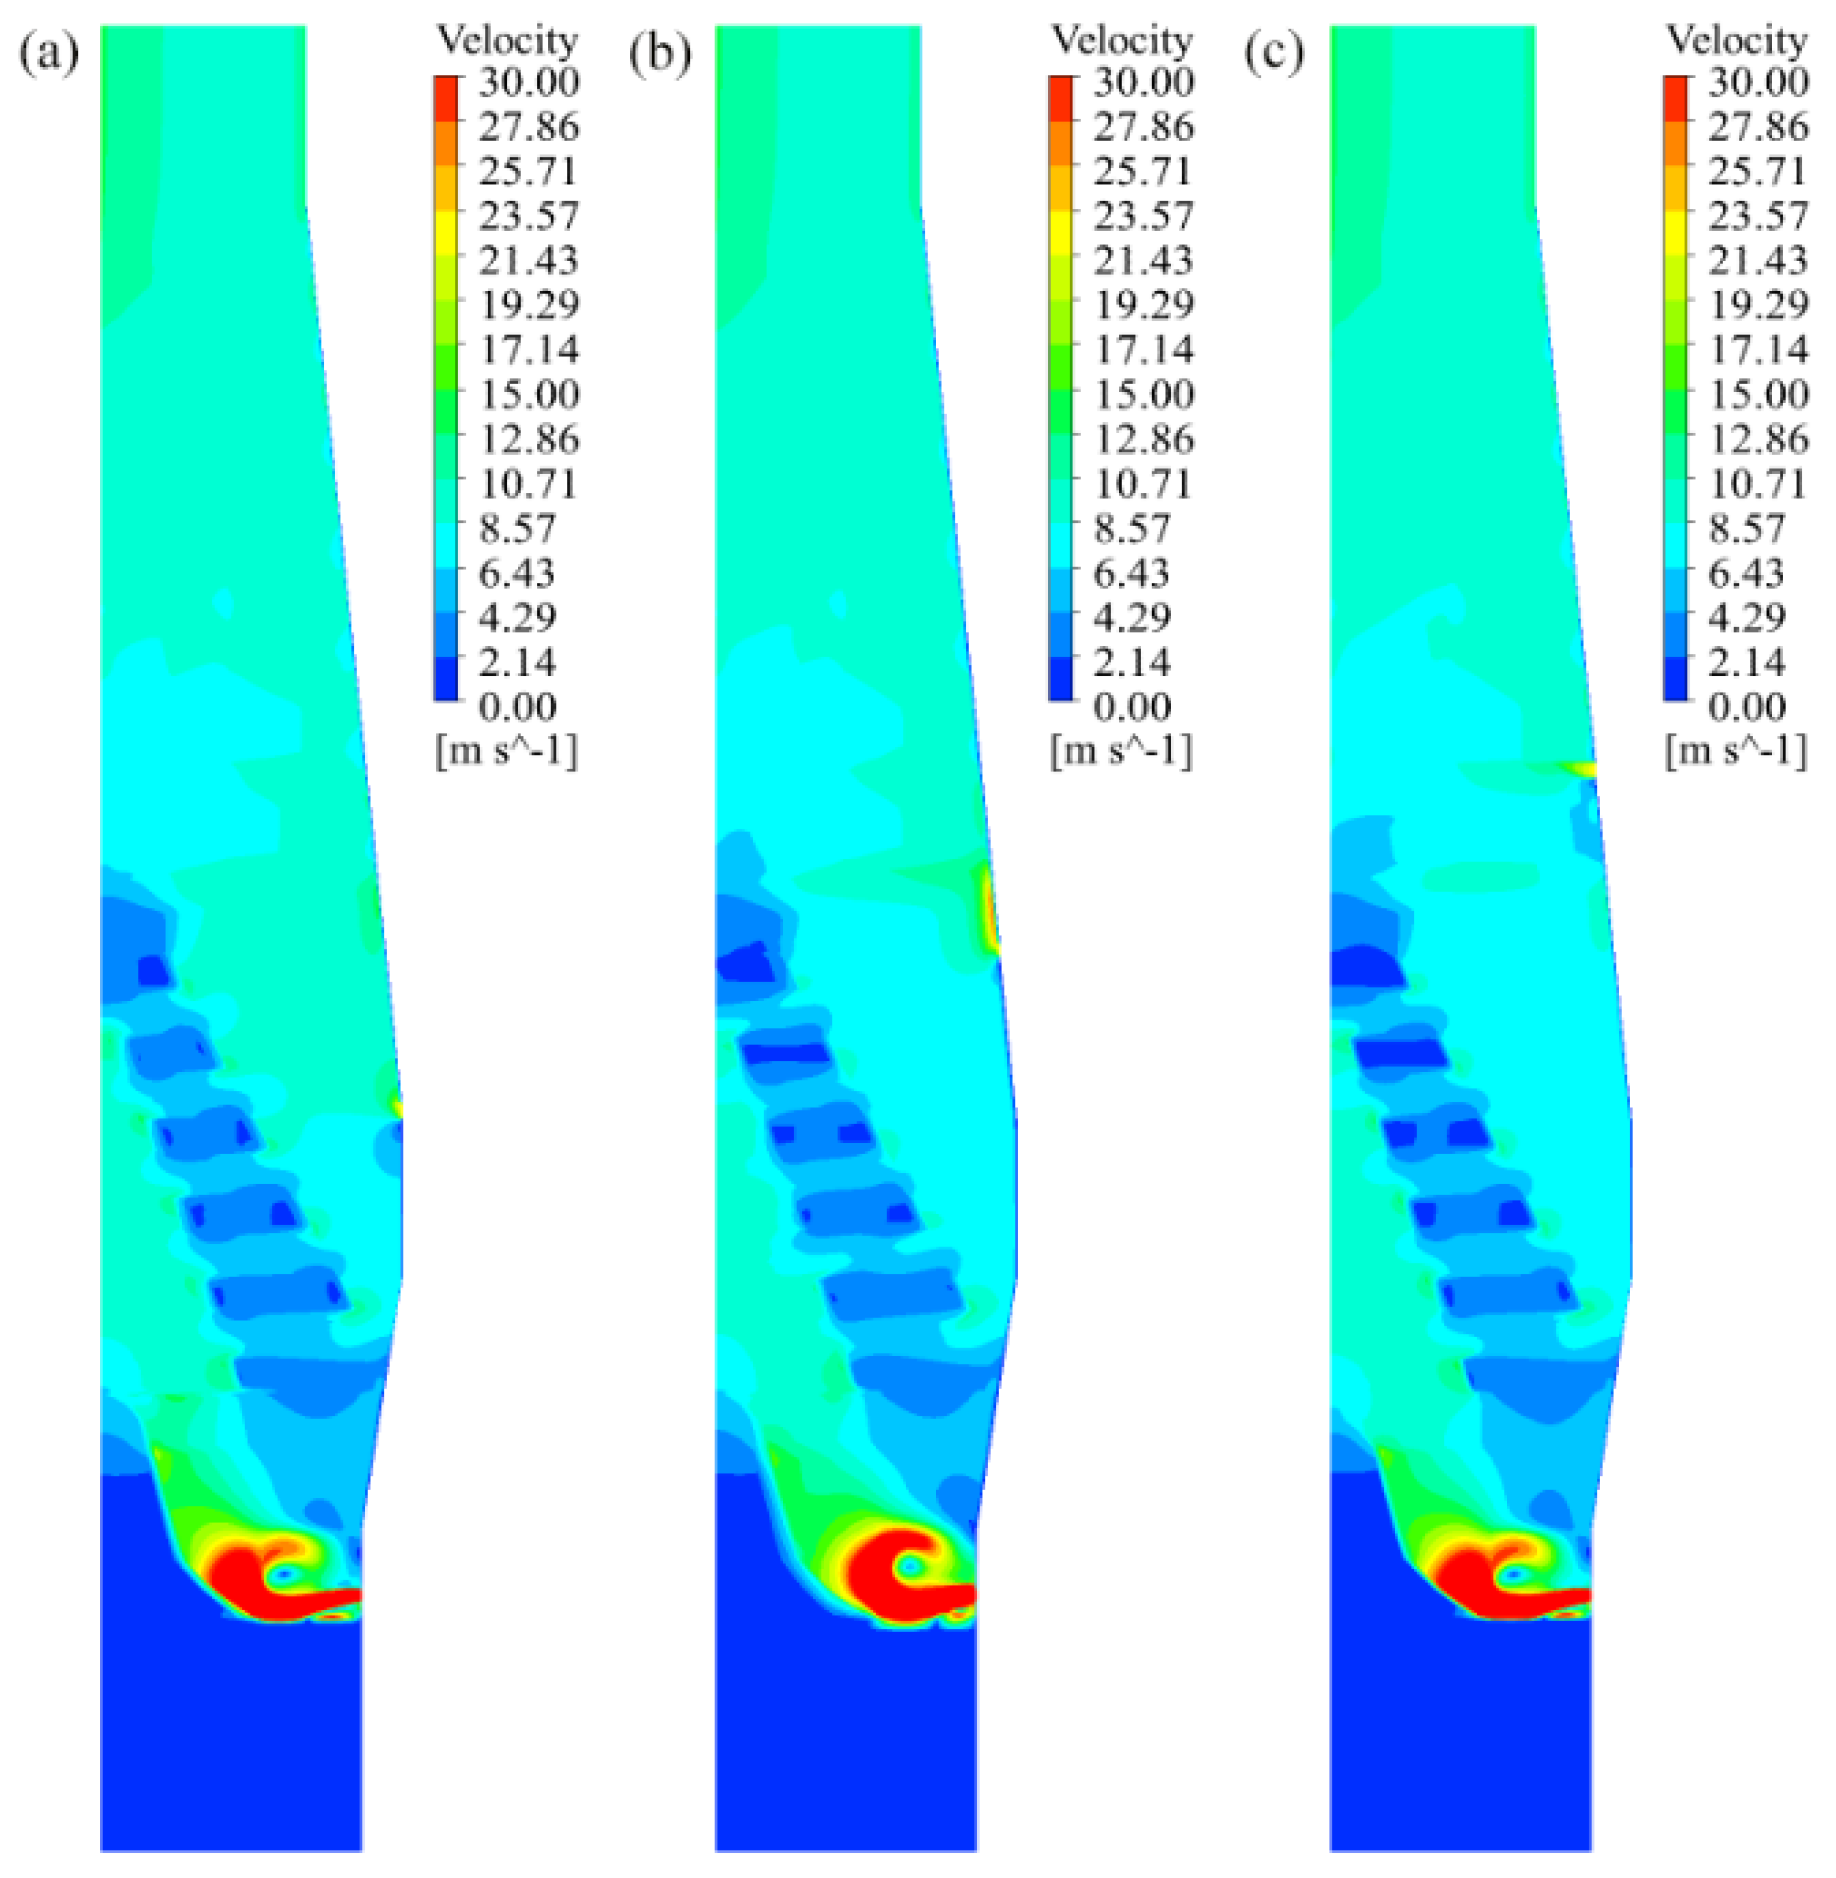
Specifically, the pressure drop of H = 0.0 m is much higher than that of H = 1.8 m and H = 3.6 m, but the pressure drop of H = 1.8 m is very close to that of H = 3.6 m. It should be noted that the elevation of H = 1.8 m is the same as that of the topmost COL inside the BF. Therefore, this shows that when the stack tuyere is the same height as the topmost COL, continued increasing of the stack tuyere height has little effect in reducing the in-furnace pressure drop. The velocity contours (Figure 8) indicate that when the stack tuyere is located at the upper edge of the belly (H = 0.0 m, equal to the elevation of the cohesive zone’s half height), the stack recycling gas can impose a strong horizontal force on the gas flow from the cohesive zone and then increase the gas flow velocity, finally resulting in increasing the whole furnace pressure drop. These results are very close to the bed pressure distribution and the gas flow fields of a 380 m3 BF, as discussed in the literature [17], especially the velocity distribution in the stack area.
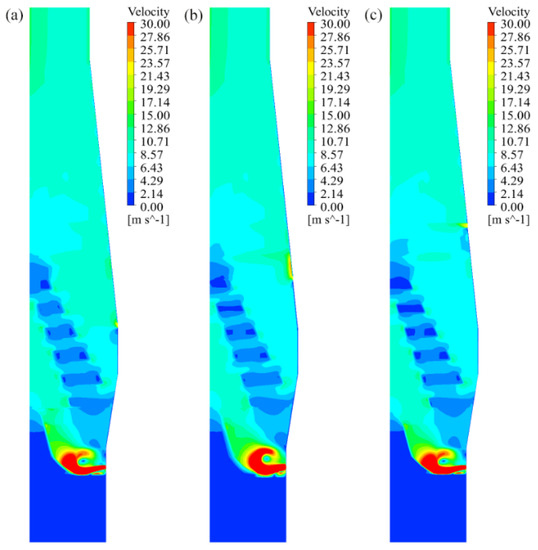
Figure 8.
Velocity contour of three stack tuyere heights (R = 60%, blast velocity = 23 m/s): (a) H = 0.0 m, (b) H = 1.8 m, (c) H = 3.6 m.
Based on the above results, the stack tuyere is set at an elevation 1.8 m higher than that of the belly (equal to the elevation of the topmost COL) for this paper’s rest simulations of different pre-reduction degrees.
4.3. Pressure Drop and Gas Flow of Different Pre-Reduction Degrees
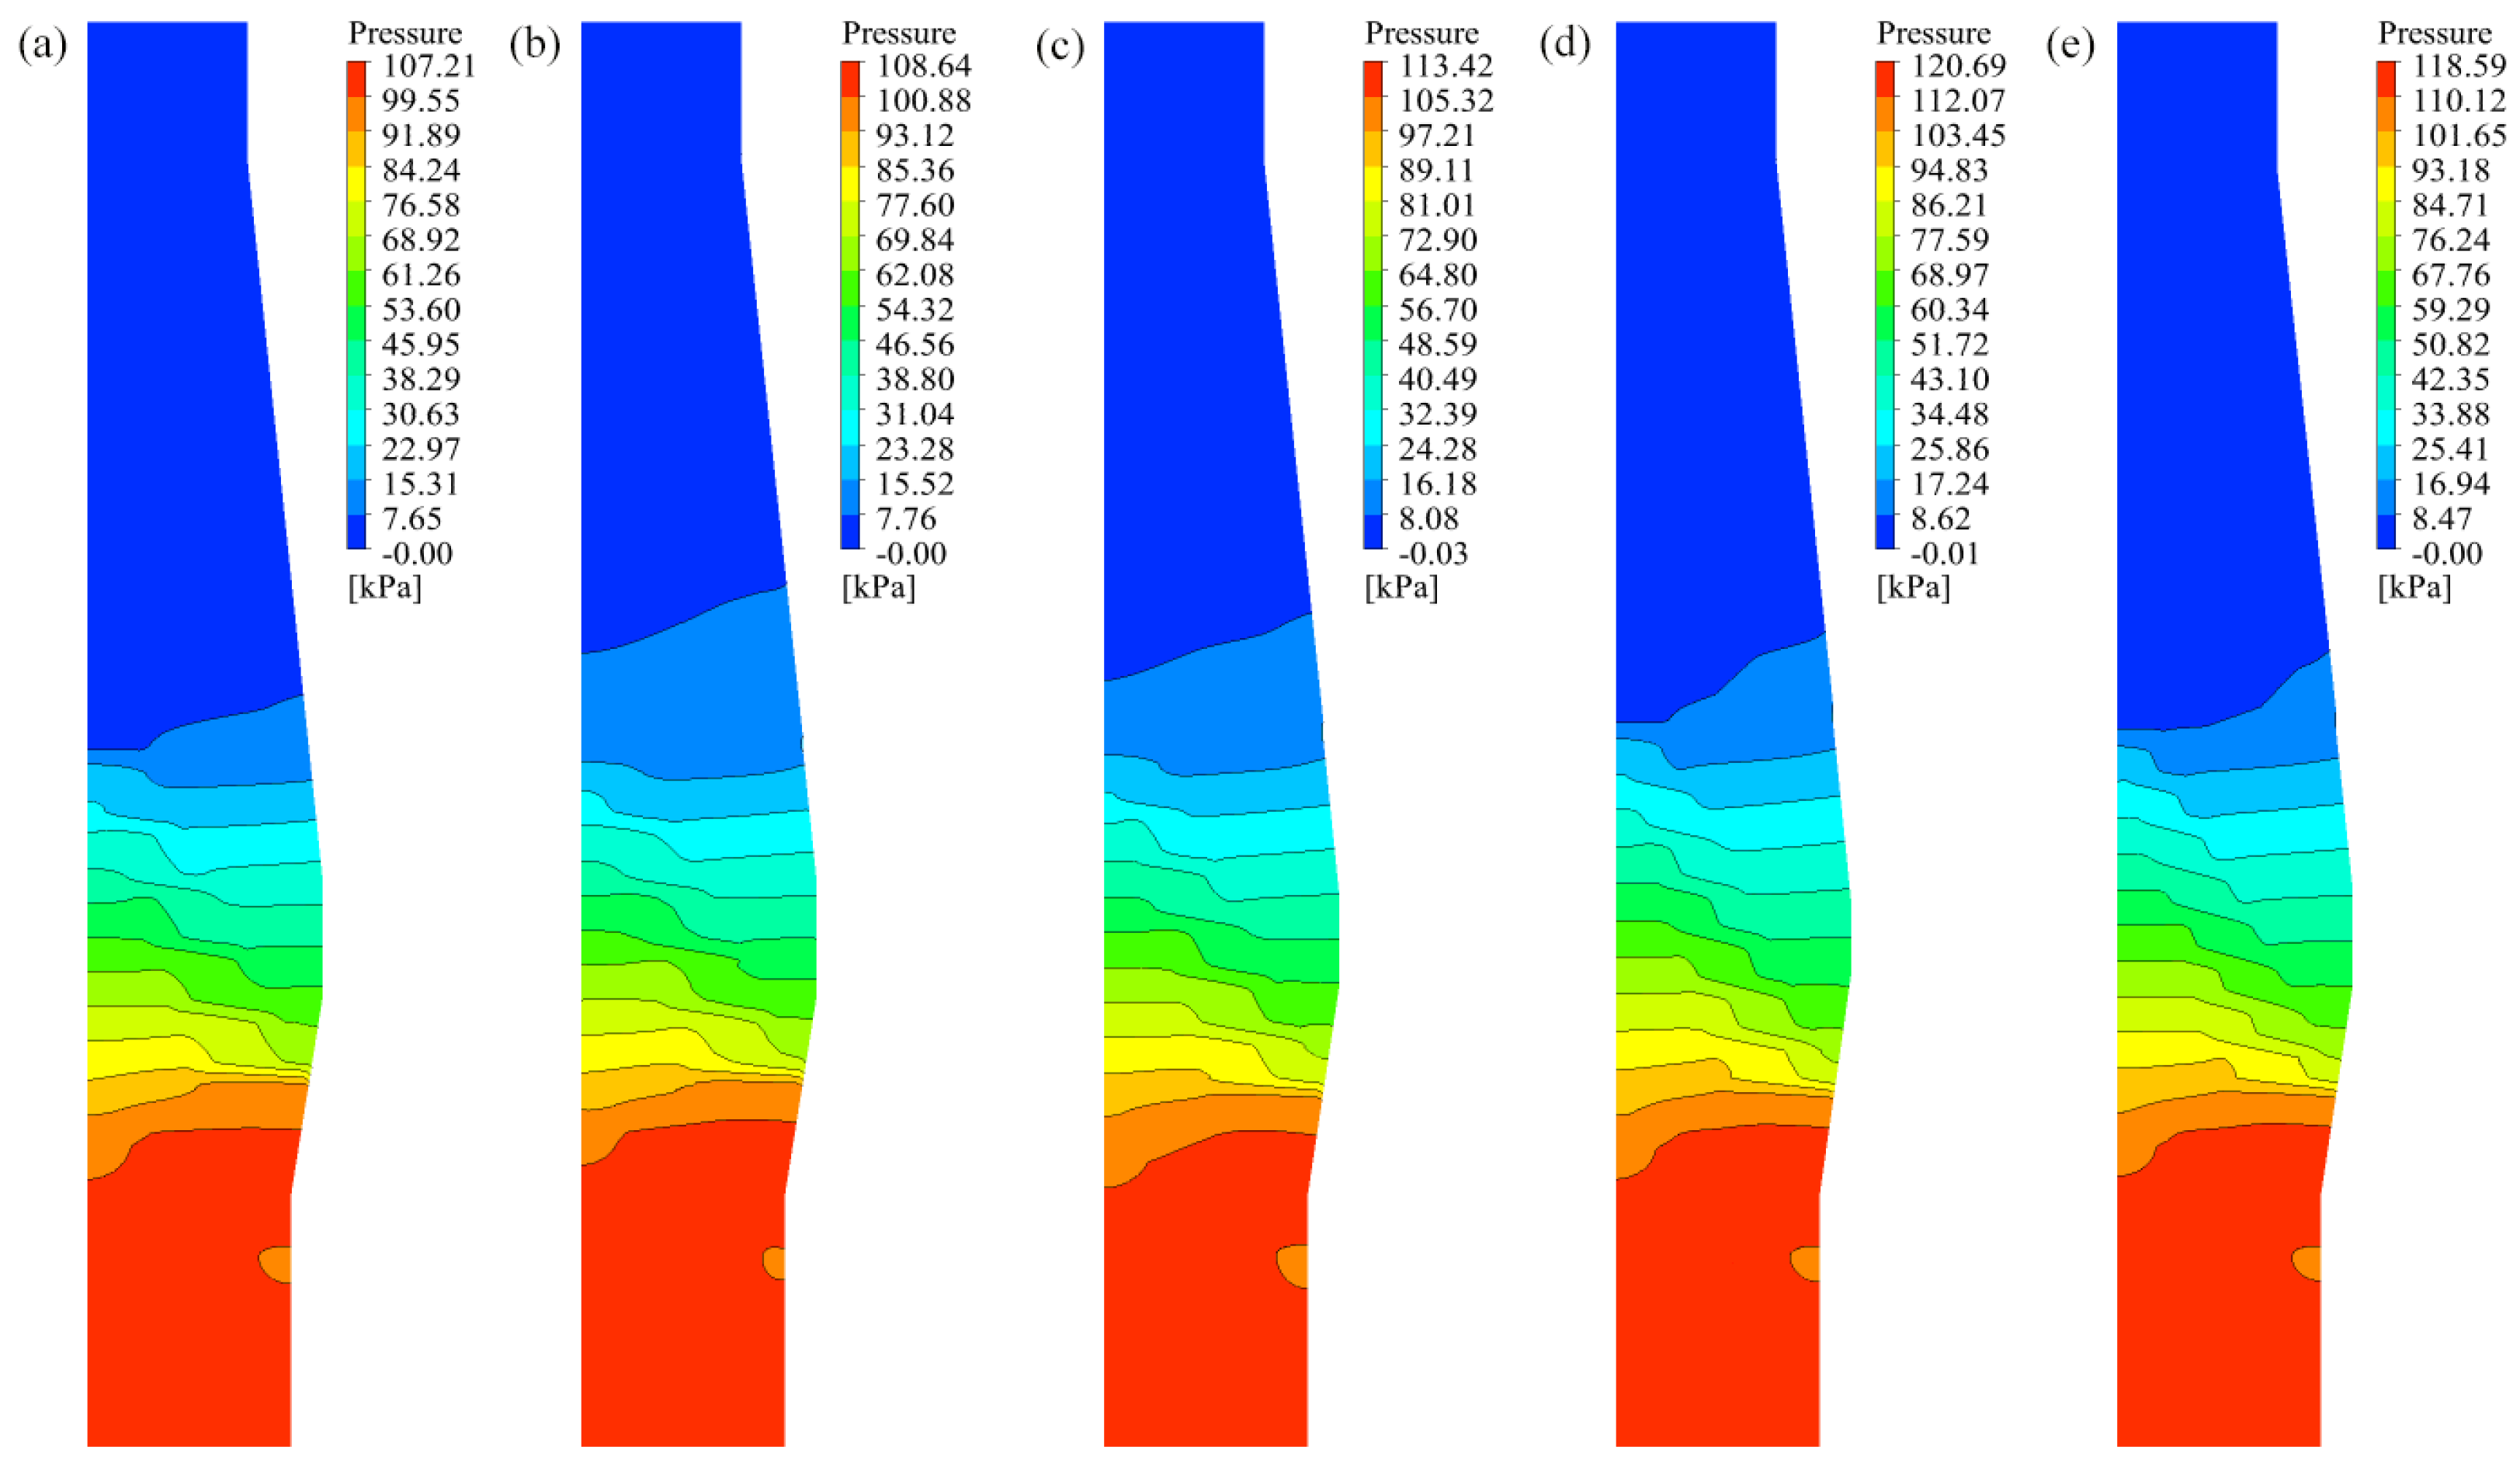
The results of different pre-reduction degrees are shown in Figure 9. As shown in Table 5, the coke layer becomes thinner when the indirect reduction degree increases from 50% to 90%. Therefore, when the cohesive zone inclination remains at 60°, the number of burden layers in the cohesive zone increases to 7, 8, or 9 for reduction degrees of 70%, 80%, or 90%, respectively, with the result that that the pressure drop of the cohesive zone and the whole furnace still increases gradually, from 107.21 kPa to 118.59 kPa, even if the resistance coefficient of the COL decreases.
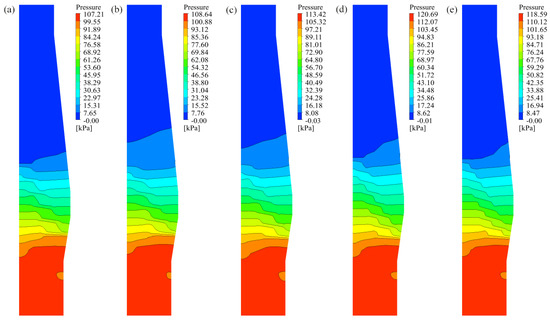
Figure 9.
Pressure contours of different pre-reduction degrees (= 60°): (a) R = 50%, n = 6, (b) R = 60%, n = 6, (c) R = 70%, n = 7, (d) R = 80%, n = 8, (e) R = 90%, n = 9.
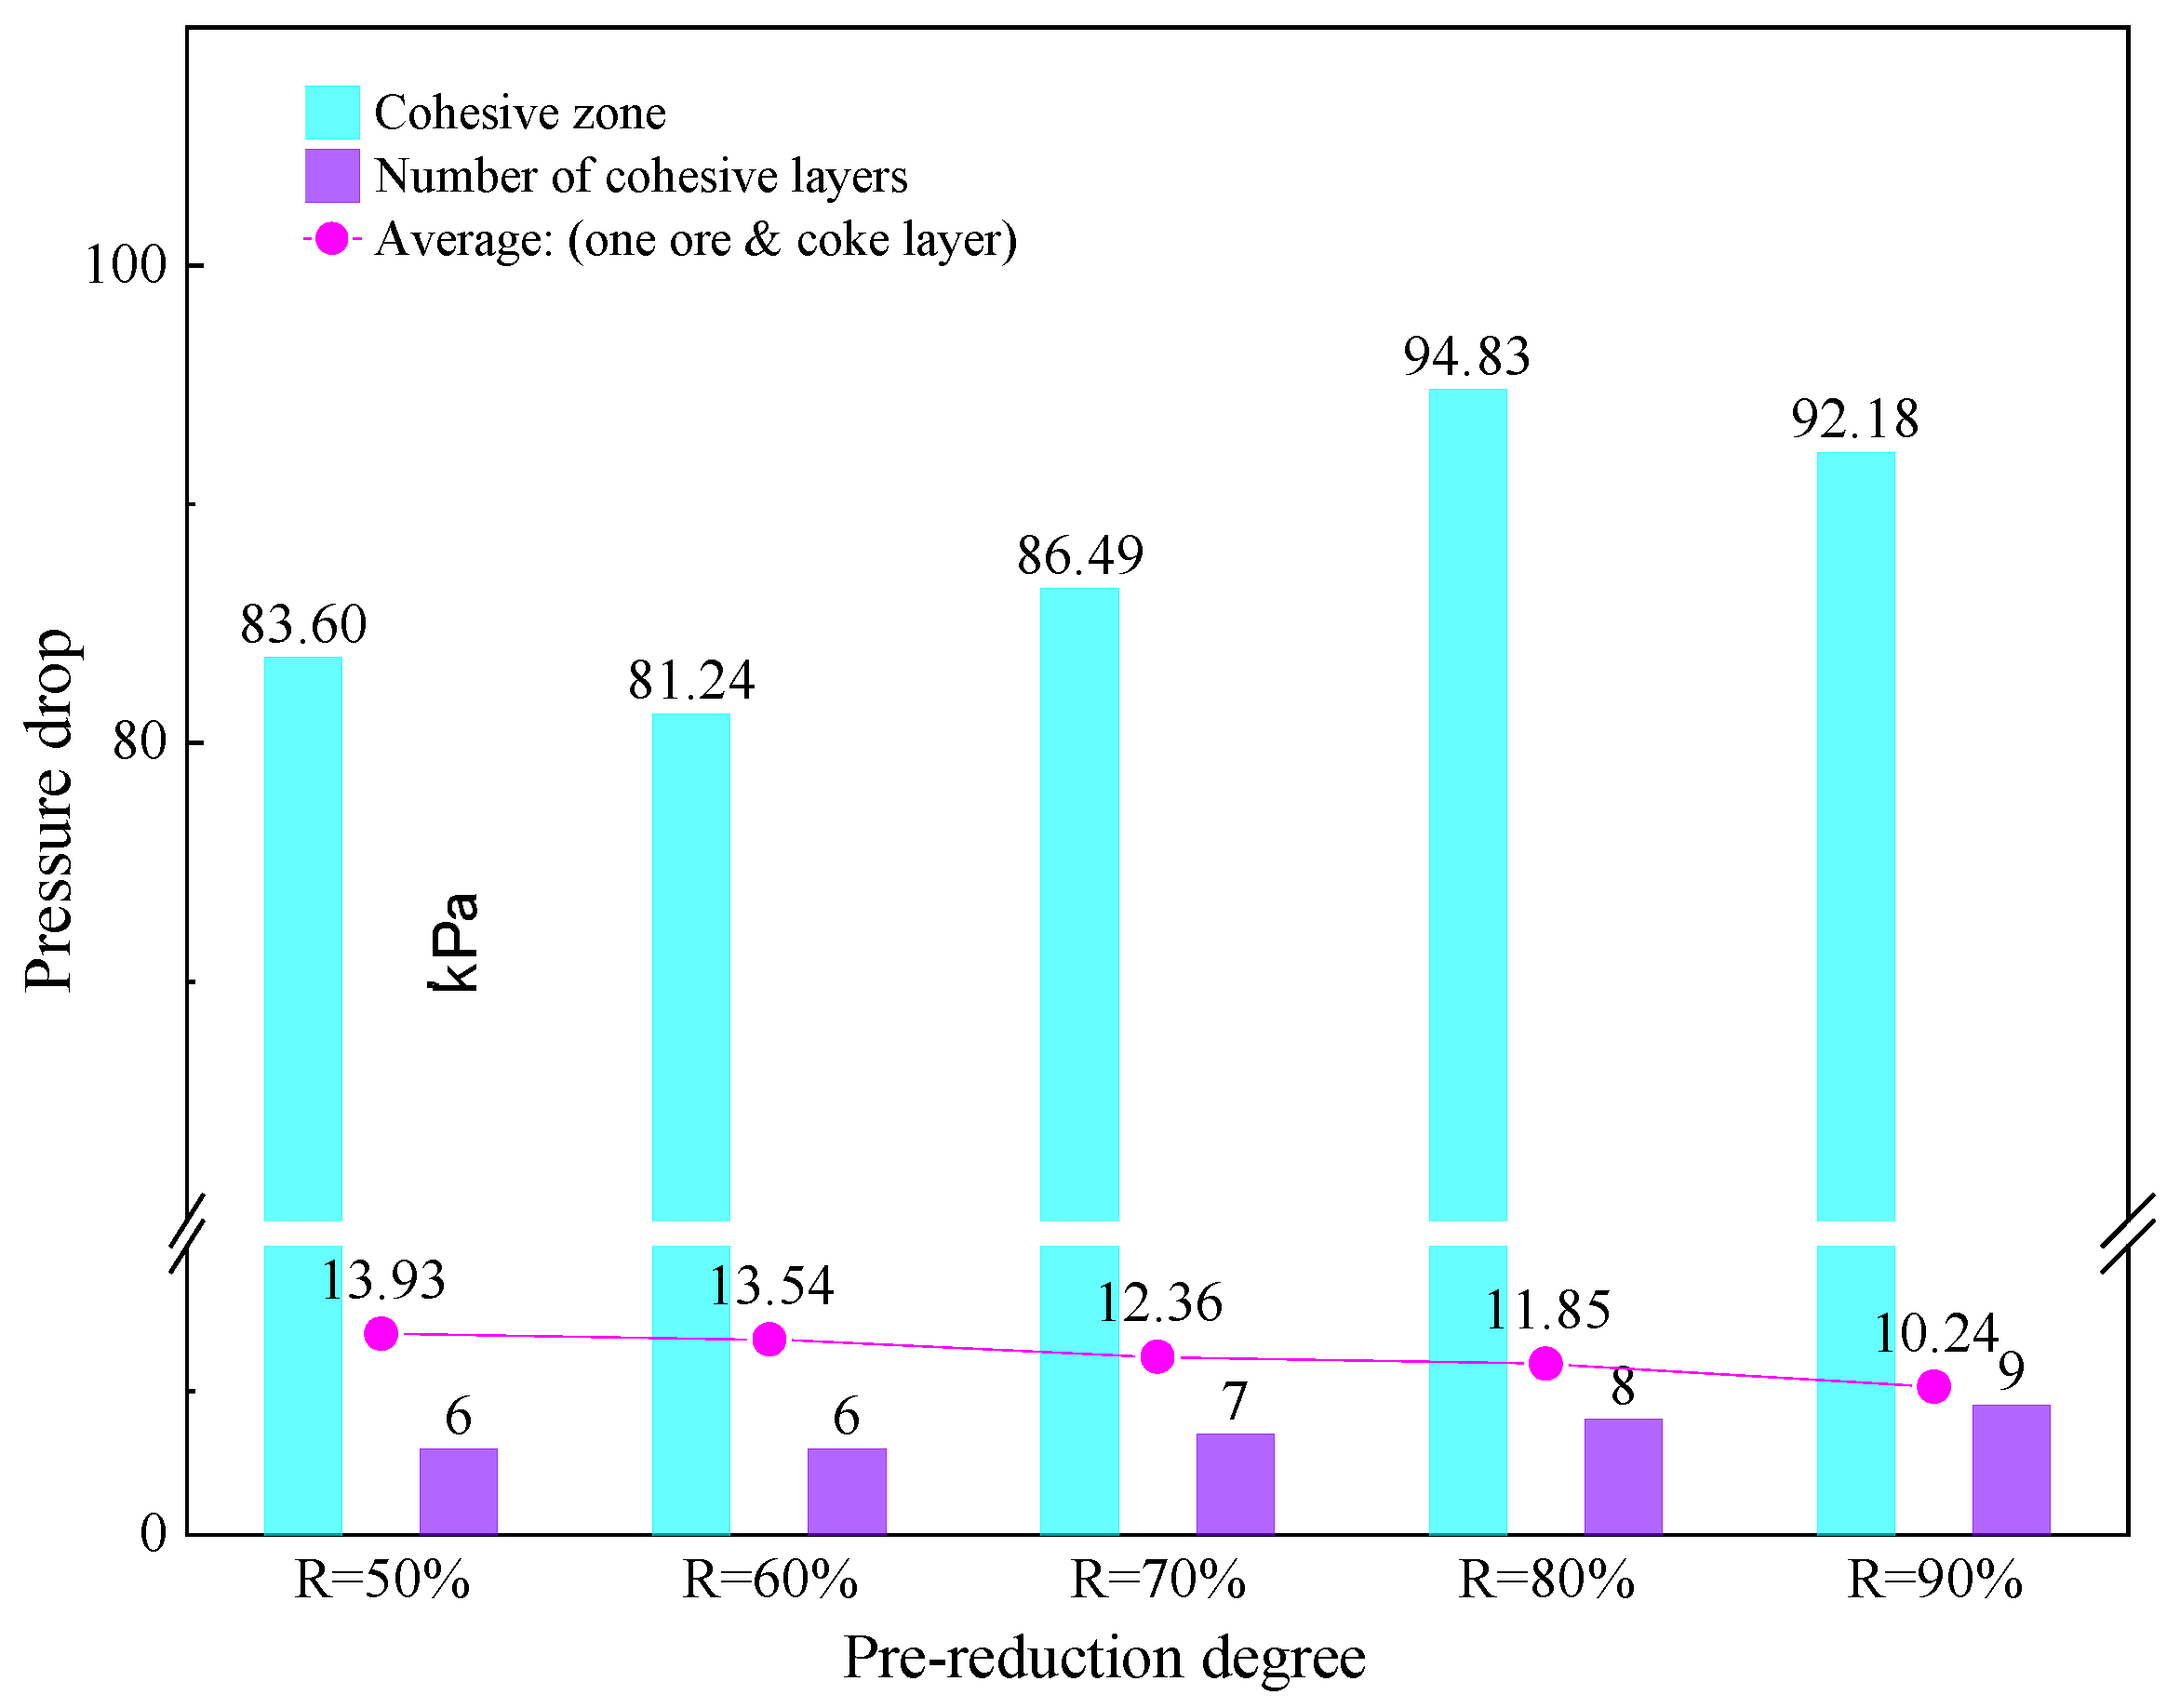
The results of the pressure drop of the cohesive zone and the average pressure drop of one layer are shown in Figure 10. The average pressure drop of one ore and the coke layer shows an obvious downward trend and is consistent with the tendency of the resistance coefficient. Table 7 shows the proportion of the cohesive zone pressure drop in the whole furnace. It can be seen that the cohesive zone pressure drop accounts for 74~80% of the whole furnace, and this proportion increases slightly with the increase in the indirect reduction degree.
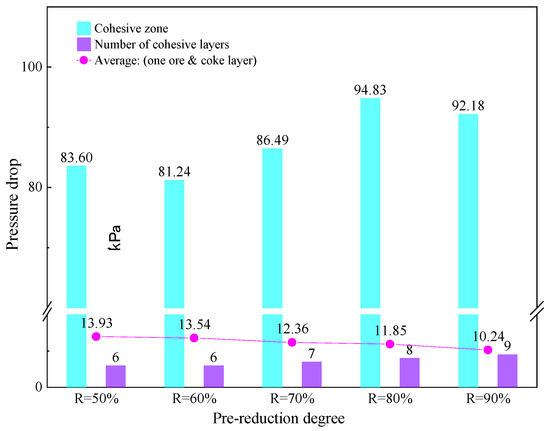
Figure 10.
Pressure drop of the cohesive zone and the average pressure drop of one layer.

Table 7.
Pressure drop of the whole furnace and the cohesive zone.
4.4. Index of Coke Layer Flow
An index of the coke layer flow () and an index of the cohesive ore layer flow () are introduced to quantitatively compare the gas flow amount through the burden layers within the cohesive zone during different processes. The formula is as follows:
where is the average y-velocity of the CL; indicates the area of the CL; and , and represent the counterparts of the cohesive zone. can be calculated based on the same principle.
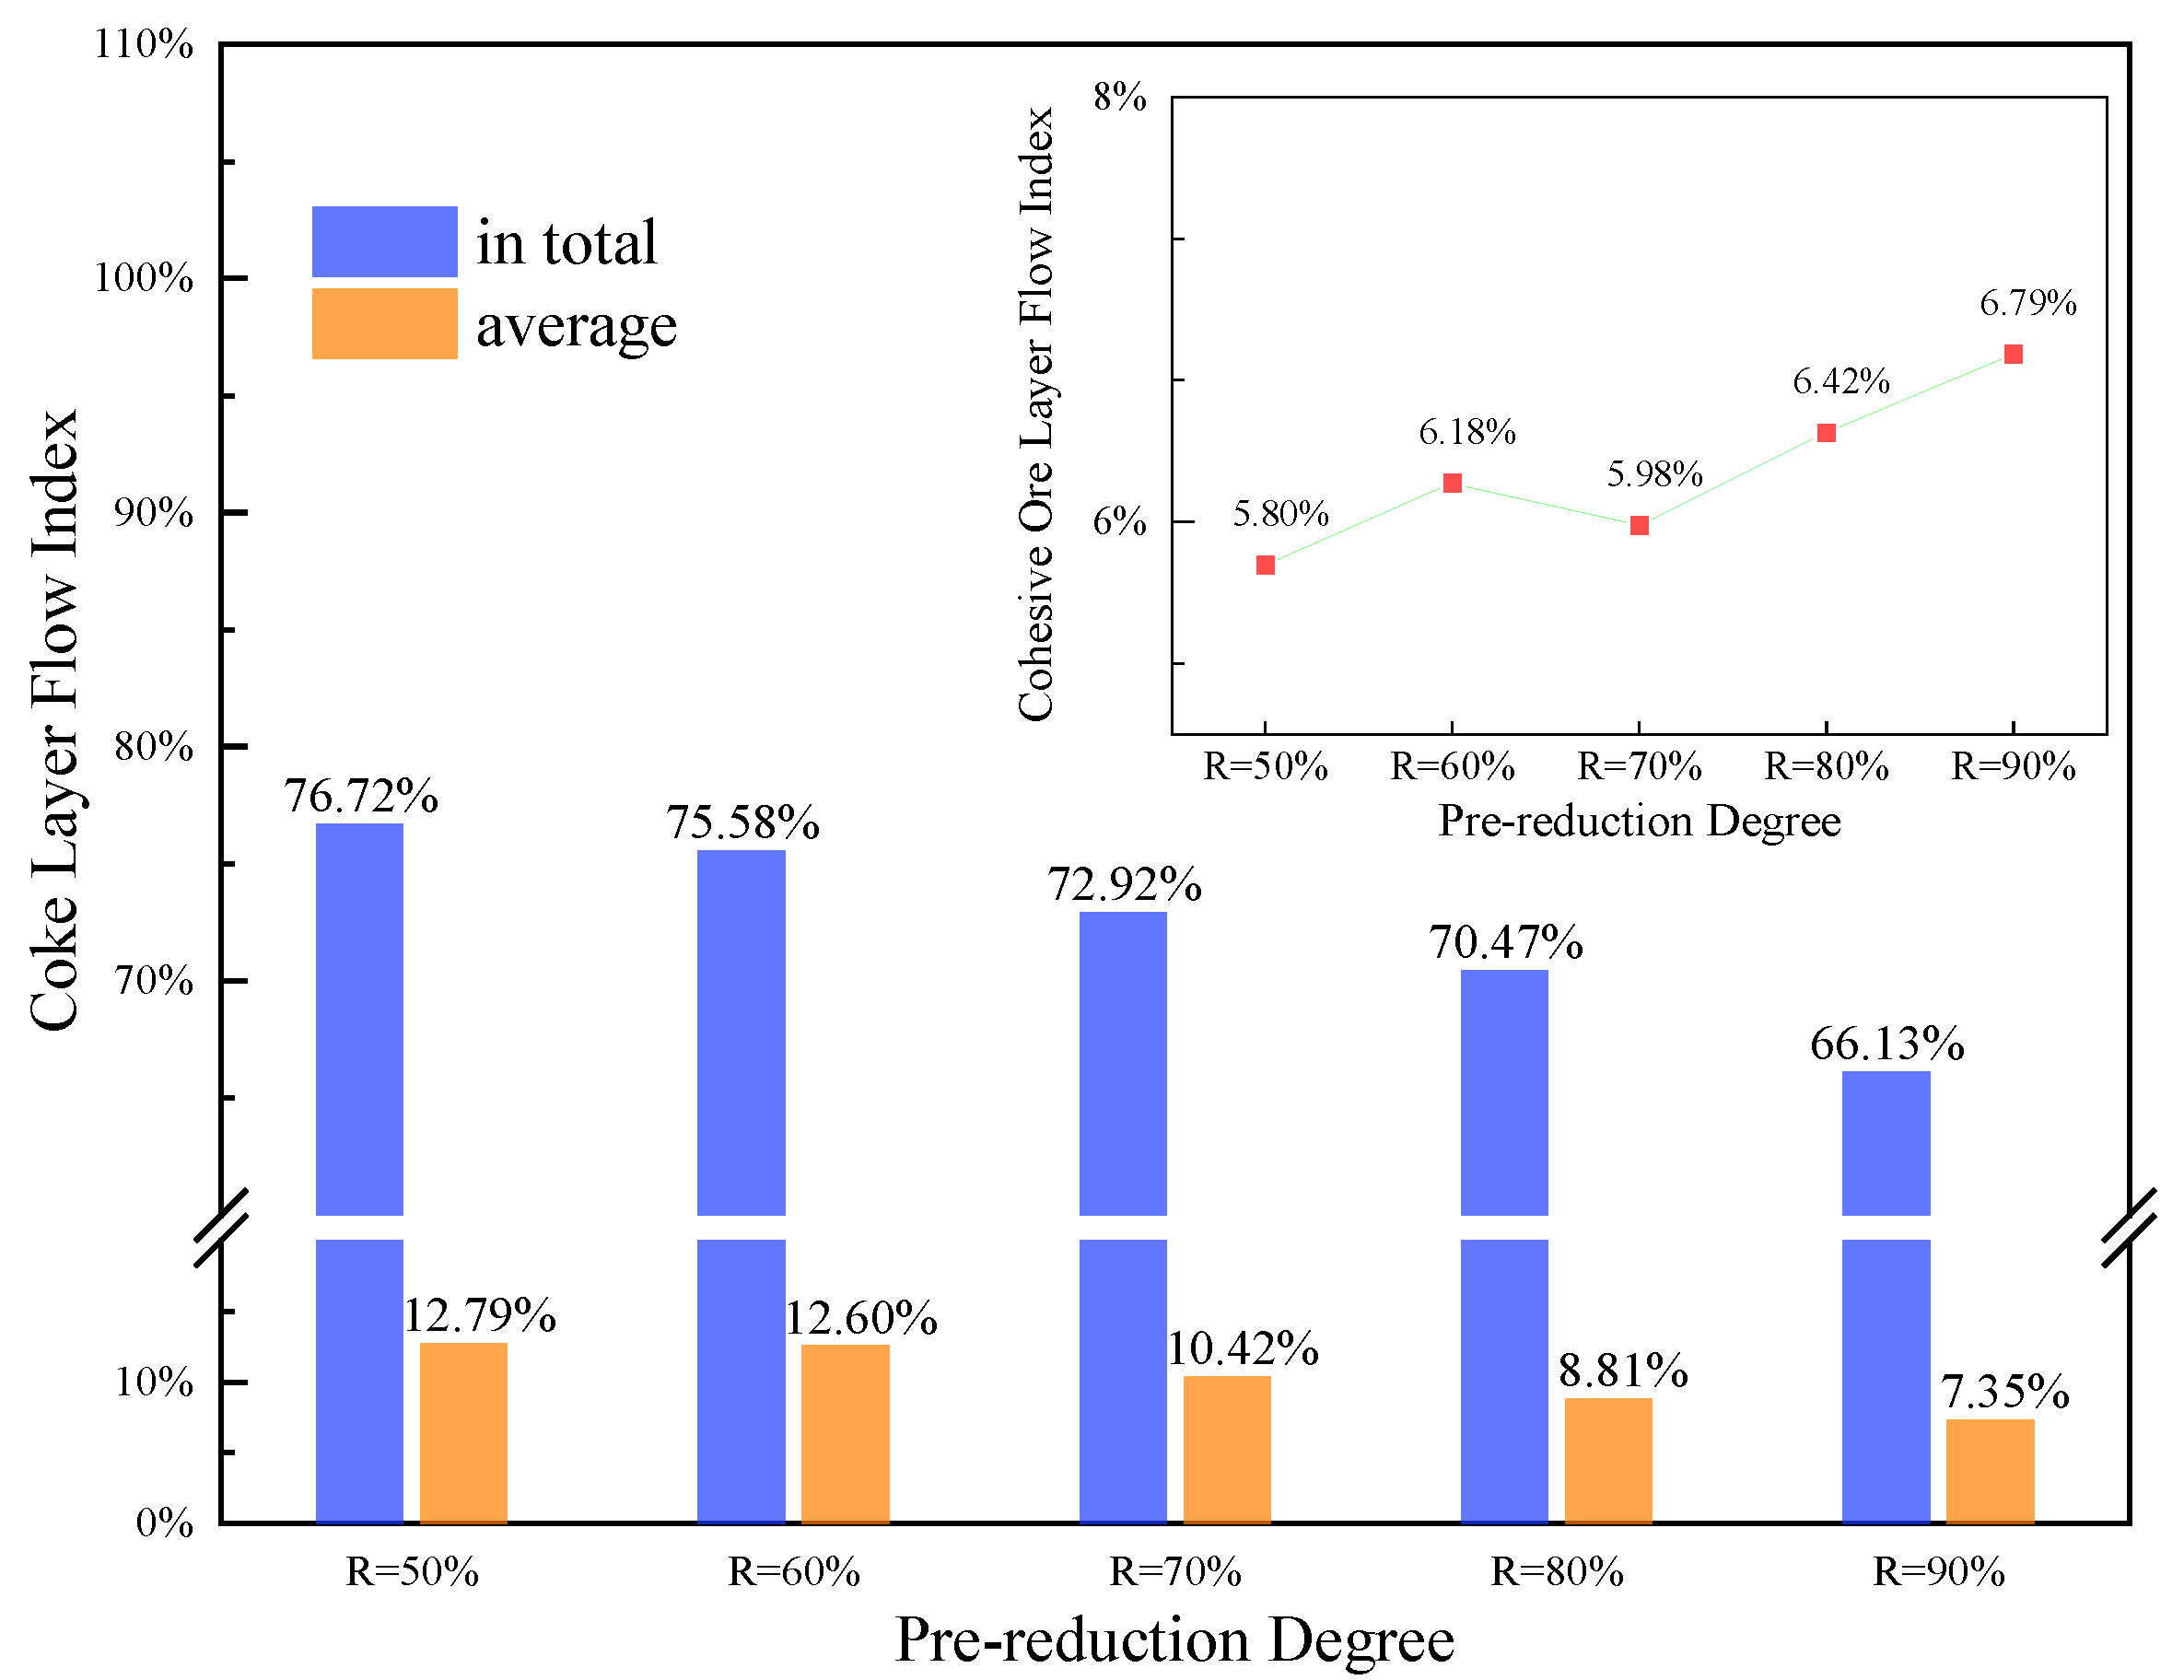
Figure 11 shows the data of and . descends from 76.72% to, at most, 66.13% with the increase in the pre-reduction degree. This means that the majority of the gas still flows through the coke layer. Coke keeps playing the key role of the channel for the reducing gas in the TGR-OBF. The decrease in also illustrates that about 10% of the gas flow can permeate through the ore layer rather than the coke layer. Therefore, compared with a conventional BF, the permeability in the TGR-OBF does not deteriorate badly before the drippage of pig iron.
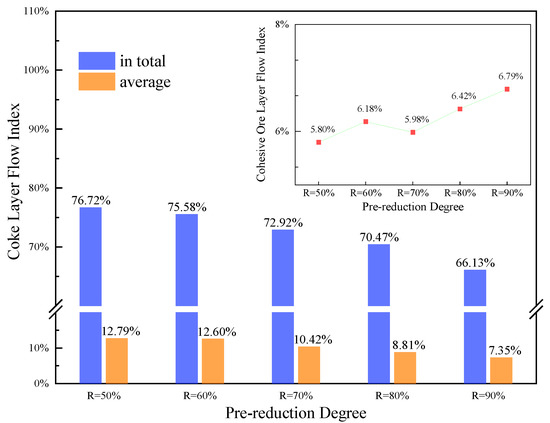
Figure 11.
Flow index of the CL and the COL.
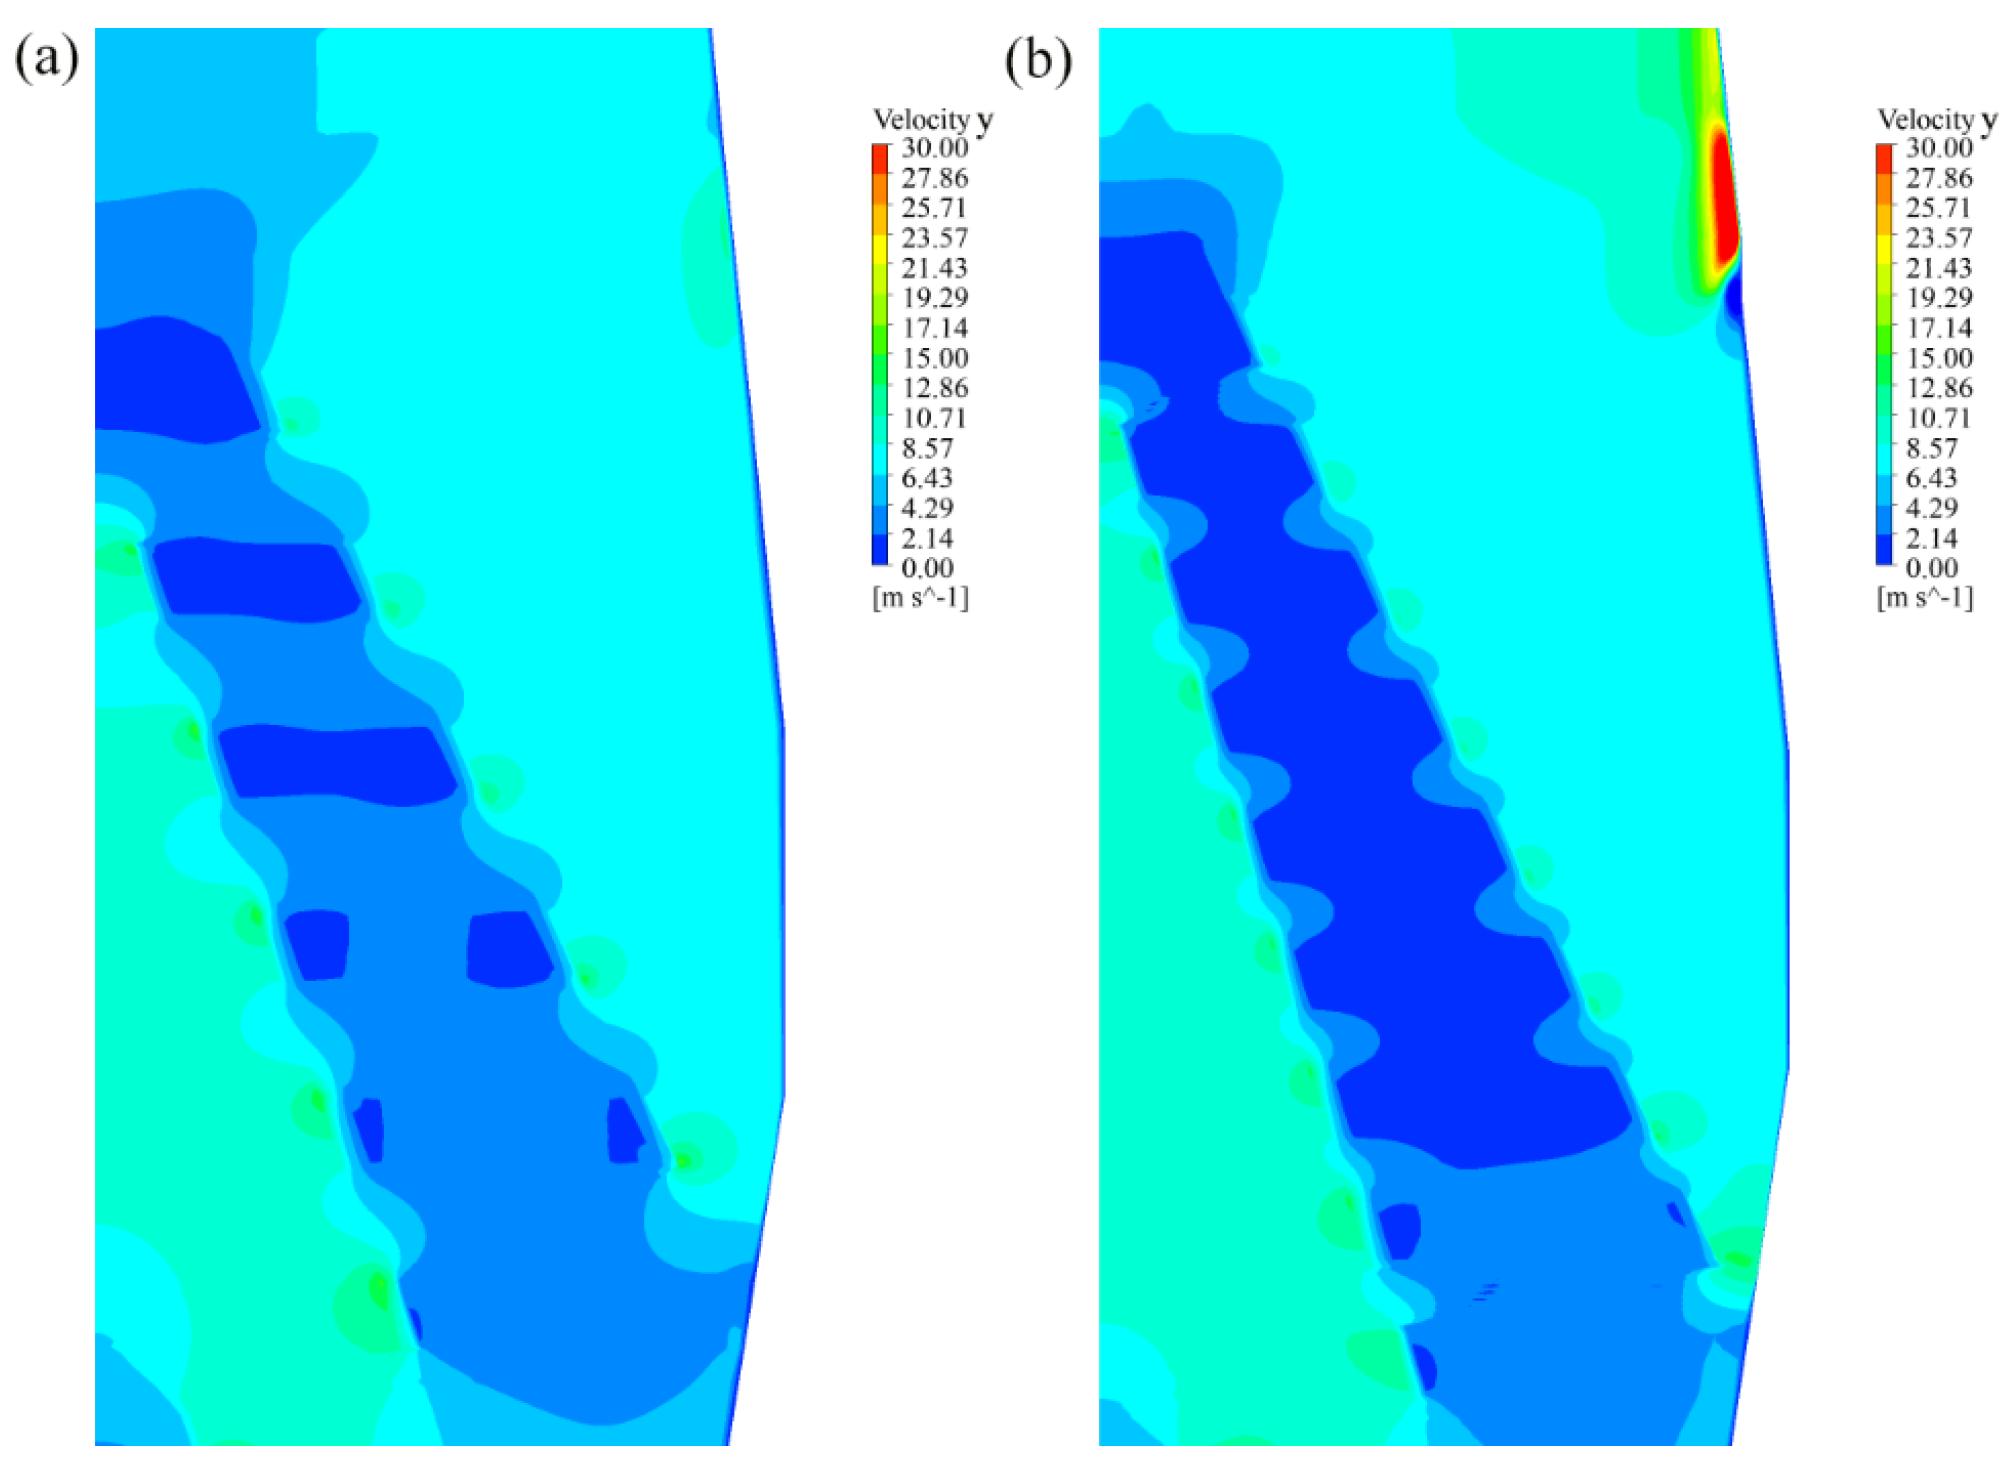
indicates that gas flows around 5~7% can still pass through the COL, even when the ores have already softened and melted. Figure 12 shows that the y-direction velocity of the gas flow in the COL and its adjacent region is much slower. For the pre-reduction degree of 50%, the gas velocity in the CL is 4.29 m/s, which is about twice that of the COL. For the pre-reduction degree of 90%, an equalization of velocity in the COL and CL regions can be found, as shown clearly in Figure 12. This shows that with the increase in the indirection degree, the permeability of the cohesive zone is improved, and the capacity for gas flowing is enhanced. These changes are significant in reducing the pressure drop, increasing the coal rate, reducing the coke rate, and improving the performance indicator of a BF.
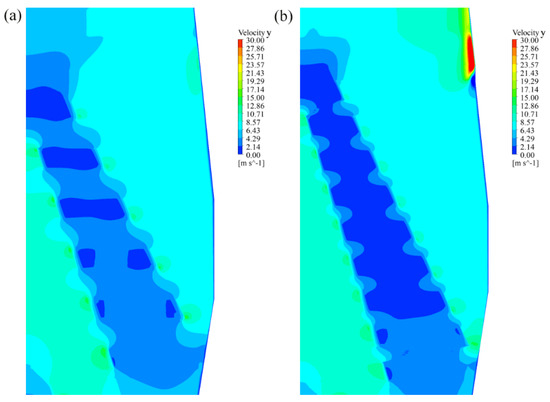
Figure 12.
Velocity contours of y-direction in cohesive zone ( = 60°): (a) R = 50%, n = 6, (b) R = 90%, n = 9.
5. Conclusions
A two-dimensional porous-medium model of the whole furnace was established to study the pressure and gas flow of various TGR-OBF processes under different conditions, such as different oxygen concentrations and different stack tuyere heights. The results showed that the model is capable of indicating the pressure drop and velocity distribution of the whole furnace and providing a reliable and effective tool for the optimization and improvement of blast furnace processes. The conclusions are as follows:
- (1)
- The pressure drop of the whole furnace without central coke was consistent with industrial BFs of a similar size, which verified the effectiveness and reliability of the model. The high-speed whirling movement in the raceway and in two majority gas flows (central and border) at the outlet were observed. Under the condition of charging central coke, the central gas flow velocity increased significantly. The results also verified the effect of central coke in reducing the pressure difference of a BF.
- (2)
- With the increase in stack tuyere height, the pressure drop of the whole furnace decreased continuously. However, when the stack tuyere height was at the same elevation as the upper edge of the cohesive zone, a further increase in the stack tuyere height had little effect in reducing the in-furnace pressure drop.
- (3)
- The differential pressure of the whole furnace increased generally, although the resistance coefficient of the COL of the high indirect reduction degree was lower. This was because the number of burden layers in the cohesive zone increased, due to the thinning of the coke layer under the condition of 60° inclination. The ratio of the cohesive zone pressure drop to the total pressure drop of the whole furnace was between 75% and ~80%.
- (4)
- The gas flow index was used to quantitatively compare the gas distribution between the CL and the COL. With the increase in the reduction degree, the permeability of the ore layer increased and the proportion of the gas flow through the CL could be reduced by up to 10%. This proved that the cohesive zone could still ensure the in-furnace gas permeability under the condition of a low coke rate in the TGR-OBF.
Compared with our previous model for only the cohesive zone [5], the results of this study are much closer to the real situation in BFs, because the whole furnace model was adopted and the inlet speed was set as the actual blast speed in the BF tuyere. However, due to the limitations of the two-dimensional model, some transmission phenomena may differ from the actual three-dimensional situation, and our results should be improved in the future.
Author Contributions
Conceptualization ideas, Q.X.; methodology development, H.Z.; supervision oversight and leadership, J.W.; experiments, data collection, writing—review, G.W.; experiments, data collection, writing—original draft, C.L. All authors have read and agreed to the published version of the manuscript.
Funding
This research was founded by the National Natural Science Foundation of China (U1960205) and by the China Minmetals Science and Technology Special Plan Foundation (2020ZXA01).
Institutional Review Board Statement
Not applicable.
Informed Consent Statement
Not applicable.
Data Availability Statement
Not applicable.
Conflicts of Interest
The authors declare no conflict of interest.
References
- Kuang, S.B.; Li, Z.Y.; Yu, A.B. Review on Modeling and Simulation of Blast Furnace. Steel Res. Int. 2017, 89, 71–96. [Google Scholar] [CrossRef]
- Dong, X.F.; Pinson, D.; Zhang, S.J.; Yu, A.B.; Zulli, P. Gas-powder flow in blast furnace with different shapes of cohesive zone. Appl. Math. Model. 2006, 30, 1293–1309. [Google Scholar] [CrossRef]
- Fu, D.; Chen, Y.; Zhou, C.Q. Mathematical modeling of blast furnace burden distribution with non-uniform descending speed. Appl. Math. Model. 2015, 39, 7554–7567. [Google Scholar] [CrossRef]
- Shen, Y.S.; Guo, B.Y.; Chew, S.; Austin, P.; Yu, A.B. Three-Dimensional Modeling of Flow and Thermochemical Behavior in a Blast Furnace. Metall. Mater. Trans. B 2014, 46, 432–448. [Google Scholar] [CrossRef]
- Li, C.; Pan, Y.Z.; Xu, Z.; Xue, Q.G.; Zuo, H.B.; She, X.F.; Wang, G.; Wang, J.S. Pressure Drop and Gas Flow of Cohesive Zone in Oxygen Blast Furnace Using a Combination of Experimentation and Porous Model. ISIJ Int. 2022, 62, 91–98. [Google Scholar] [CrossRef]
- Rasul, M.G.; Tanty, B.S.; Mohanty, B. Modelling and analysis of blast furnace performance for efficient utilization of energy. Appl. Therm. Eng. 2007, 27, 78–88. [Google Scholar] [CrossRef]
- Liu, L.Z.; Jiang, Z.Y.; Zhang, X.R.; Lu, Y.X.; He, J.K.; Wang, J.S.; Zhang, X.X. Effects of top gas recycling on in-furnace status, productivity, and energy consumption of oxygen blast furnace. Energy 2018, 163, 144–150. [Google Scholar] [CrossRef]
- Zuo, X.J.; Wang, J.S.; An, X.W.; She, X.F.; Xue, Q.G. Reduction behaviors of pellets under different reducing potential. J. Iron Steel Res. Int. 2013, 20, 12–18. [Google Scholar] [CrossRef]
- Mitra, S.; Liu, X.; Honeyands, T.; Evans, G.; O’Dea, D.; Zulli, P. Pressure-drop Modelling in the Softening and Melting Test for Ferrous Burden. ISIJ Int. 2020, 60, 1416–1426. [Google Scholar] [CrossRef]
- Baniasadi, M.; Peters, B.; Pierret, J.C.; Vanderheyden, B.; Ansseau, O. Experimental and numerical investigation into the softening Behavior of a packed bed of iron ore pellets. Powder Technol. 2018, 339, 863–871. [Google Scholar] [CrossRef]
- Fojtik, D.; Tuma, J.; Faruzel, P. Computer modelling of burden distribution in the blast furnace equipped by a bell-less top charging system. Ironmak. Steelmak. 2021, 48, 1226–1238. [Google Scholar] [CrossRef]
- Narita, K.; Inaba, S.; Shimizu, M.; Yamaguchi, A.; Kobayashi, I.; Okimoto, K. Burden and gas distribution considering blast furnace aerodynamics. Trans. ISIJ 1981, 21, 405–413. [Google Scholar] [CrossRef]
- Zhou, C.L.; Li, Y.Z. Research on charging patch and cohesive zone width. Ironmak. Steelmak. 1989, 2, 19–23. [Google Scholar]
- Kurita, K.; Murai, T. Estiamation of the inner states by the use of the burden distribution model based on the profile meter measurements at blast furnce. Tetsu-to-Hagane 1987, 73, 2052–2059. [Google Scholar] [CrossRef] [PubMed]
- Nomura, S. A Simple Treatment on the Geometry of Raceway Zone. Trans. ISIJ 1986, 26, 107–113. [Google Scholar] [CrossRef]
- Kohichi, I.; Kuwabara, M.; Muchi, I. Simulation of solid particle movement in the lower part of blast furnace. Tetsu-to-Hagane 1981, 67, 53. [Google Scholar] [CrossRef]
- Li, J.; Kuang, S.; Zou, R.; Yu, A. Numerical Investigation of Burden Distribution in Hydrogen Blast Furnace. Metall. Mater. Trans. B 2022, 53, 4124–4137. [Google Scholar] [CrossRef]
Disclaimer/Publisher’s Note: The statements, opinions and data contained in all publications are solely those of the individual author(s) and contributor(s) and not of MDPI and/or the editor(s). MDPI and/or the editor(s) disclaim responsibility for any injury to people or property resulting from any ideas, methods, instructions or products referred to in the content. |
© 2023 by the authors. Licensee MDPI, Basel, Switzerland. This article is an open access article distributed under the terms and conditions of the Creative Commons Attribution (CC BY) license (https://creativecommons.org/licenses/by/4.0/).

