Abstract
In this work, the effect of a filler wire feed rate was studied with special attention to the proportion of porosity volume in the weld metal, microstructure, and mechanical properties. Butt laser weld joints were created using the Nd:YAG laser. Weld joints were produced with the AZ31 filler wire with a diameter of 1.2 mm. Decreasing the filler wire feed rate of the filler wire led to an increase in the porosity of the weld metal. Therefore, porosity is more likely to occur in laser welding without the use of a filler wire. Clear segregation of aluminium, manganese, and zinc was observed in the EDS maps and the local EDS line profile measurements. The precipitates formed were rich in Al and Mn or Al and Zn, compared to the matrix. They also show a large decrease in Mg content to minimum values ranging from 10 to 60 wt.% in the precipitates. To investigate pores in the weld metal of the weld joint, computed tomography was used. The highest volume of porosity was measured in weld joint no. 3. (0.63 mm3). On the contrary, the lowest porosity volume was detected in weld joint no. 1. (0.06 mm3). The largest width of the weld metal (2.25 mm) was measured if the filler wire feed rate was 130 cm/min. The highest average microhardness (82.5 HV0.1) was recorded in the weld metal of weld joint no. 1. In weld joint no. 3, a fracture occurred in the weld metal and the measured tensile strength was only 154 MPa.
1. Introduction
Because of their lightweight and high specific strength, magnesium alloys are excellent prospects for usage in the transportation and aerospace sectors. Magnesium and its alloys have unique physical and chemical properties that influence the material’s weldability [1,2]. As a result, welding and joining processes for integrated components made of these materials will be necessary. Mg alloys display low ductility and cold workability as hexagonal close-packed (hcp) metals because of inadequate slip systems, particularly at room temperature, limiting their extensive applicability [3,4,5]. Magnesium alloys have a very low specific weight; nonetheless, they are extremely oxidizable and have a low melting point, which inevitably leads to the creation of imperfections when soldered or welded [6]. As a result, such systems’ formability using standard procedures is rather constrained. To address this issue, a number of improved bonding techniques for magnesium alloy systems have been proposed, including friction stir welding [7], tungsten inert gas welding with additional flux [8], laser/electron beam welding [9], and vacuum diffusion bonding [10]. Laser welding, in particular, provides a number of significant advantages, including a low heat input and high welding speed (leading to less thermal deformation), as well as the possibility of automation. However, research into the laser welding of magnesium alloy systems is still in its early phases, hence there are few relevant studies [11]. Researchers, on the other hand, have studied the microstructure and characteristics of several magnesium alloy weldments created utilizing a laser technique under varied welding parameters [12]. The results show that a number of these welding factors have a significant impact on joint shape. An increased heat input widens the weld while decreasing variances in the depth of penetration between the top and bottom of the weld. It should be noted that a higher weld power results in a higher energy density, which leads to increased weld penetration as well as different thermal effects that impact the supercooling rate, precipitate formation, and the solidified grain structure of the laser weldments [13]. It was documented in [12] how the heat input affects metallurgical changes and that grain shape, average grain size, and the precipitate phase all have a significant effect on weldment performance. The welding of magnesium alloys is directly related to weld metal shrinkage, the production of low-melting phases (Mg17Al12), low laser beam absorption, low melting point, and low evaporation temperatures between 906 °C and 1100 °C [14]. The strong affinity of magnesium for oxygen and the concomitant production of oxide inclusions is a serious concern caused by its chemical characteristics. This issue is most prevalent when employing Nd:YAG and Yb:YAG lasers, where it is thought that their wavelengths (1.06 µm and 1.03 µm) are transparent to Mg (OH)2. As a result, the Mg (OH)2 layer does not melt and then evaporates (melting point 2800 °C), and the beam just passes through it; hence, weld surface preparation prior to welding is inevitable [15]. These shortcomings result in issues such as porosity, spatter, recrystallization, weld pool instability, and weld heat and liquid cracking. Because of the high heat conductivity of magnesium alloys, it is necessary to employ a very high-power source for welding, which might result in significant grain coarsening. At grain boundaries, low-melting eutectics occur, increasing the susceptibility to hot cracking [16]. Deformations and residual stresses are other issues induced by a high thermal conductivity and coefficient of thermal expansion. These selected properties are similar to aluminium alloys, so the welding conditions are practically identical. Nonetheless, laser welds with adequate welding parameters for crack-free wrought magnesium alloys with low porosity and high surface quality are conceivable [17]. Mg alloys are primarily ternary, with the primary alloys being Al, Zn, and Th. Aluminium and zinc are the primary alloying elements in magnesium alloy AZ31B. Aluminium enhances castability, strength, and hardness. Zinc promotes toughness in addition to enhancing hardness and strength. Because of the creation of hot cracks after solidification, the amount of Zn is restricted [18]. Because of the improved welding process stability, macropores induced by keyhole collapse and instability may be prevented. When filler metal is employed, the ratio of melted base metal to filler metal in the weld seam determines the weld metal composition. When laser beam welding, the dilution ratio is typically approximately 20% [19]. Filler metal has many advantages, including the ability to compensate for the metal loss due to vaporization, reduce burn-up and weld drop-through, reduce porosity, control seam compositions to reduce susceptibility to fusion zone brittleness or stress corrosion cracking, avoid weld cracks, promote process stability, and lower sensitivity to joint gaps, resulting in a slightly wider fusion zone. Different investigations focused on the reduction of welding defects by adding appropriate filler material. Ahn et al. [18] used an Al–Si AA4043 alloy as filler material to investigate the effect of the filler wire feed rate on the weld quality. It was observed that the addition of the filler metal reduces the risk of producing defects and keyhole instability in the weld. The application of these approaches and the exploitation of filler material led to an increased ultimate tensile strength of approximately 7% when compared to the autogenously laser-welded specimens. The use of filler metal, on the other hand, necessitates greater power and a slower weld speed [20,21,22,23]. Usually, the selection of filler material depends on the base metal to be welded and the kind of weld joint. For instance, the widely used AM and AZ series alloys can be welded with AM and AZ wires. In the welding of magnesium alloys, four filler alloys (AZ61A, AZ92A, AZ101A, and EZ33A) are used. In our case, the use of AZ31 filler wire was studied [19]. The Mg element has an important effect on the stability of the laser welding process. Therefore, the porosity is more likely to occur in laser welding with higher Mg content filler wire. In addition, a higher Mg content leads to a higher evaporation rate and steam pressure, resulting in the unstable keyhole and pore defects. Furthermore, laser welding with filler wire (LWFW) provides the necessary alloying elements for the weld and makes up the element burning loss in the welding process, improving the microstructure and properties of the weld and reducing the defects such as porosity and cracks [24]. According to Yang et. al. [25], the welding speed has the most significant effect on the fusion zone area, with an impact factor of 71.5%, followed by the wire feed rate. The fusion zone area reduces with the increase in the welding speed and the decrease in the wire feed rate. Less filler metal can be melted at a low wire feed rate, which also reduces the fusion zone. The welding speed is the most significant parameter that influences the weld bead geometry, while the wire feed rate has a relatively significant effect on the upper width and the fusion zone area. Laser welding with filler wire (LWFW) has the potential to significantly increase gap-bridging capabilities while also reducing the need for joint fit-up. Furthermore, laser welding using filler wire can address the issue of solidification cracks. Laser welding with filler wire was previously thought to be a challenging procedure for industrial applications because it has too many parameters and the wire placement requirements are too stringent [26]. However, wire melting and transfer behaviour were significant components determining laser welding stability and would have an impact on the final weld quality [27,28]. Huang et. al. [26] reported that the distance between the filler wire and the laser beam and the wire feeding speed significantly affect the wire melting and transfer behavior and thus the entire welding stability. Authors [18] reported that the problems with welding defects including surface porosity, reinforcement, and undercut were found to be the most significant at 5.0 m/min and 7.0 m/min. It was possible that the feed rate was too high at these feed rates which supplied too much filler metal to the weld pool for the given laser power and welding speed. High feed rates produced instabilities, whereas low feed rates did not sufficiently modify the chemical composition of the weld pool. Researchers began to pay attention to the wire melting dynamics, which were directly connected to process stability and weld quality, with the introduction of high-speed imaging techniques. Yu et al. [29] used this approach to investigate the melting dynamics of LWFW with varying feed locations and feed rates. LWFW melting dynamics may be divided into three types: explosion, huge droplet, and molten metal bridge. According to the findings, the explosion or massive droplet form would result in an unstable welding process and poor weld quality, whereas the molten metal bridge form would result in a stable welding process and a uniform weld bead. Furthermore, the filler wire increases process stability, decreases the tendency for porosity development, and results in a larger volume of the weld pool by compensating for material loss owing to vaporization [19]. Because of the increased welding process stability, macro pores induced by keyhole collapse and instability may be prevented [18]. To optimize the laser welding process and ensure good weld quality, the influence of filler wire feed rate on the overall properties of welded joints must be understood. As a result, the study focuses on the filler wire feed rate for weld metal porosity formation.
2. Experiment
2.1. Material Characterization
Magnesium alloy AZ31B–H24 in the form of a sheet measuring 30 × 100 × 2 mm was used for this research. The designation B indicates the grade (purity) of the alloy and H24 expresses the processing of the alloy—strain hardened and partially annealed [30]. The most commonly used magnesium alloy, AZ31, contains aluminium and zinc as alloying elements. The chemical composition is given in Table 1. The presence of aluminium enhances the hardness, corrosion resistance, and tensile strength through the formation of the intermetallic Mg17Al12 phase. The zinc favours the formation of fine grains during solidification and increases tensile strength, which has led to high interest in AZ31 as a structural alloy, especially for automotive applications [31]. The mechanical properties of AZ31B magnesium alloy is given in Table 2. Due to the intensive evaporation of alloying elements (Mg and Zn alloys) in the base material AZ31B–H24, a filler wire was used. AZ31 filler wire contains 3% aluminium and 1% zinc, given in Table 3. Both elements increase the strength and hardness, while aluminium also improves the castability of the alloy.

Table 1.
Chemical composition of AZ31B magnesium alloy (in wt. %) [32].
Table 2.
Mechanical properties of AZ31B magnesium alloy [32].
Table 3.
Chemical composition of AZ31 filler wire (in wt. %) [33].
2.2. Laser Equipment and Welding Parameters
In this work, a YB:YAG disk laser with a continuous-wave mode with a wavelength of 1.03 µm and a maximum laser power of 4 kW from Trumpf with the designation TruDisk 4002 (Trumpf, Farmington, CT, USA) was used to produce butt-welded joints. The quality of the laser beam is 8 mm.mrad. A laser beam was transported to the BEO D70 (Trumpf, Farmington, CT, USA) focusing optics using an optical cable with a diameter of 200 µm. The laser beam spot size that was focused on the surface of the material was also 200 µm. The focal length was 200 mm. The whole welding process was controlled using a 6-axis robot M-710iC/50 (Fanuc, Nitra, Slovakia). Argon was used as a shielding gas from the ambient atmosphere during welding. The surface and the root of the weld were protected. The shielding gas supply nozzle was placed 3 mm above the surface of the welded sheet. For the root area, the shielding gas supply was located on the side face of the welding fixture. The gas flow rate was constant at 24 L/min. During the joining process, the welding parameters were invariable, and only the filler wire feed rate was changed from 0 cm/min to 130 cm/min. The remaining welding parameters were as follows: the welding speed was 35 mm/s, the laser power 1.5 kW, shielding gas flow rate 24 L/min, and the focal position was on the surface of the material. The welding parameters are given in Table 4. Figure 1 shows a diagram of the welding process.
Table 4.
Welding parameters.
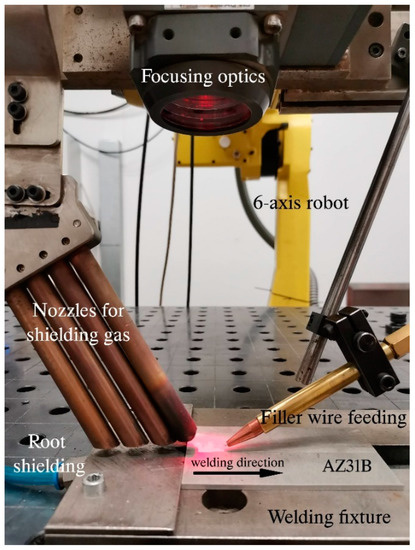
Figure 1.
Experimental procedure scheme.
2.3. Preparation of the Welded Joints
Metallographic preparation of samples was performed according to the standard for macroscopic and microscopic analysis of samples STN EN ISO 17639. After metallographic preparation of the weld joints, cross-sections were exposed to Picral etchant for 12 s. The chemical composition of the reagent was as follows: 100 mL of ethanol and 4.2 g of picric acid. The porosity in the weld joints was measured using a Computed Tomography METROTOM 1500 Zeiss. The microstructure of the welded joints was examined using a Neophot 32 light microscope (Carl Zeiss Microscopy GmbH, Jena, Germany). A JOEL 7600F scanning electron microscope (JEOL Ltd., Tokyo, Japan) was used to analyze the microstructure of the base metal–weld metal interface in more detail. The Buehler IndentaMet 1100 (Buehler, Lake Bluff, IL, USA) was used to determine the Vickers microhardness. The distance between the indents in the base material was 200 µm, in the weld metal 100 µm, and the measurement parameters were as follows: load 100 g acting during 10 s. The strength of the laser weld joints was determined via a tensile test. A LabTest E.3 machine (Labortech s.r.o., Opava, Czech Republic) with a max load force of 250 kN and crosshead speed of 5 mm/s was used for the tensile test.
3. Results
3.1. Welds Appearance
Figure 2a–f shows the surfaces and roots of the welded joints of the AZ31B magnesium alloy. The surface of weld no. 1 (Figure 2a) shows a regular shape and the width of the weld along its entire length without the presence of spatter, cracks, and undercuts. The root of the weld joint (Figure 2b) also exhibits a regular shape. The spatter was not recorded. In the case of another welded joint (Figure 2c,d), which was produced at a filler wire feed rate of 70 cm/min, no significant change in the surface and root of the weld was observed in comparison to the previous case. Even in this case, on the surface and in the weld root area, weld metal spatter, cracks, and undercuts were not observed. The last welded joint (Figure 2e,f) was produced at a filler wire feed rate of 0 cm/min. The width of the weld bead is uniform along the entire length. A slight spatter of weld metal was observed on the surface of the weld bead. Figure 2f exhibits an unregular shape of the weld root and weld metal spatter is present in the weld root area. The weld joint no. 3 is visibly narrower than the previous welds. This is attributed to the fact that no filler wire was added to the weld pool. The weld root exhibits a slight heterogeneity of its width. This width heterogeneity in the area of the weld root can be associated with intense evaporation of the alloying elements and turbulent whirl of the weld metal during laser welding without the use of filler wire. Syed et al. [34] investigated the effects of the position and direction of filler wire on the formation of the weld metal. The results show that the welding process is stable, and the well-formed weld metal can be obtained when the front wire feeding mode is used during welding.
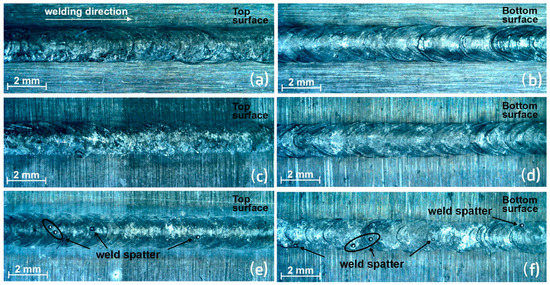
Figure 2.
Weld beads and weld roots of laser weld joints: (a,b) 130 cm/min, (c,d) 70 cm/min, (e,f) 0 cm/min.
3.2. Cross-Sections
The cross-sections of welded joints created at different filler wire feed rates are shown in Figure 3a–c. At the cross-section of welded joint no. 1 (Figure 2a), a slight excess weld metal (0.19 mm) and root excessive penetration (0.34 mm) can be seen. The width of the weld is 2.25 mm, and the width of the root is 2.01 mm. Figure 3b is given a laser weld joint fabricated at a lower filler wire feed rate, namely 70 cm/min. It is clear from the picture that the weld profile is similar to the previous weld joint, but in this case, the width of the weld bead dropped to 2.09 mm and the width of the weld root to 1.89 mm. In comparison with the previous weld joint, lower excess weld metal (0.09 mm only) was observed. As with weld no. 1, a similar amount of excessive weld metal penetration was recorded with weld no. 2, namely 0.28 mm. In this case, a pore and a lack of root fusion was observed at the fusion boundary in the root region. The last of the examined welded joints (Figure 3c) was produced without filler wire. From the micrograph, it is possible to observe an incompletely filled groove weld metal (0.17 mm) and excessive penetration of the weld metal (0.09 mm). The width of the weld bead at the surface of the material dropped to 1.92 mm and the root width dropped to 1.66 mm. As expected, the reinforcement or excess weld metal height decreased with a decreasing filler wire feed rate. In this case, two pores were recorded at the fusion boundary in the middle of the weld. The change in the filler wire feed rate had a significant effect on the weld geometry. Similar results were obtained by Chen et al. [35] when the filler wire feed rate was various. The weld joint geometry mainly depends on the welding parameters [36]. Quan et al. [37], studied the influence of heat input on the geometry and quality of laser weld joints. Based on the results of their study, they concluded that heat input into the material has a significant effect on the geometry and quality of welds fabricated from the magnesium alloy AZ31. Tadamalle et al. [38] investigated the effect of laser welding parameters on weld bead geometry. From the results of their study, they found that the power of the laser beam up to 1.7 kW has a greater effect on the dimensions of the weld bead and a less significant effect is if a higher power is used. El-Batahgy et al. [39] in their study investigated which of the three parameters (laser power, welding speed, and focal distance) has the most significant effect on the geometry of the weld bead. Matsuoka et al. [40] stated in their study that the most significant effects on the geometry of the weld bead are the welding speed, the diameter of the laser spot, and the power of the laser beam. According to Kuo et al., [41] except for the welding parameters, the shielding gas flow rate also significantly affects the weld geometry. The differences in the widths of the surfaces and the roots of the welds were observed. This fact was caused due to the differences in the filler wire feed rate, and the dimensions of weld joint no. 1 are larger compared to weld joint no. 3.
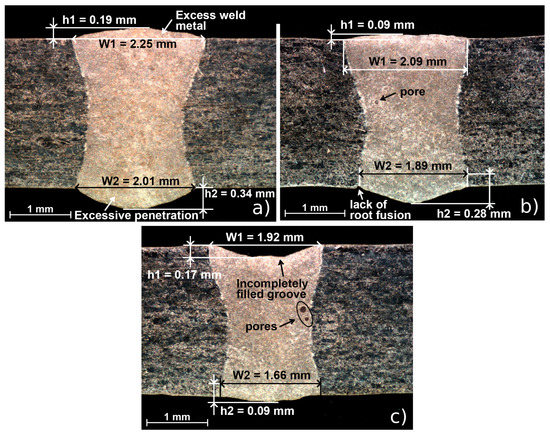
Figure 3.
Cross-sections of laser weld joints: (a) 130 cm/min, (b) 70 cm/min, (c) 0 cm/min.
In addition, using filler wire also improves the process stability, reduces the tendency to porosity formation, and leads to a wider volume of the weld pool by compensating for the loss of material due to vaporization. It was found that the top and bottom weld widths of the specimens increased with the increasing filler wire feed rate. The change in the bottom width with feed rate was relatively small but quite large for the top width. Changing the filler metal feed rate does not significantly affect the heat input, and therefore, its effect on microhardness was relatively small but rather influenced the weld width, where increasing the feed rate increased both the face and the root weld widths [18].
Figure 4 shows the effect of the filler wire feed rate on the width of the weld metal. It is clear from the figure that the greatest effect on the weld width was recorded when the filler wire feed rate was highest. On the contrary, as expected, a decrease in the width of the weld by 14.67 % compared to weld no. 1 (2.25 mm), i.e., to a value of 1.92 mm, was recorded if the filler wire feed rate was reduced to 0 cm/min. The percentage decrease in the width of the weld bead between weld no. 1 and no. 2 is 7.11 %. In terms of geometry, the effect of the change in the filler wire feed rate on the widths of weld beads and weld roots is significant.
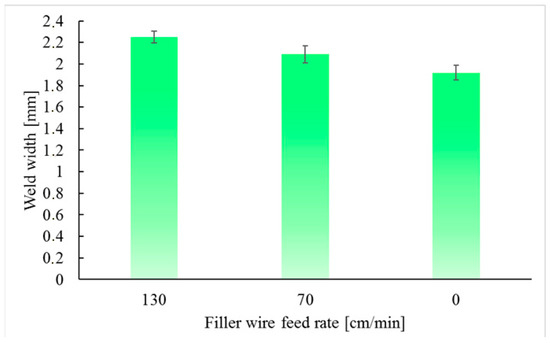
Figure 4.
Effect of filler wire feed rate on the width.
3.3. Light and Electron Microscopy
Figure 5a–d shows the microstructures of different zones of base metal (a) and the welded joints of the AZ31B magnesium alloy created at a filler wire feed rate of 130 cm/min (b), 70 cm/min (c), and 0 cm/min (d). The base metal microstructure of the investigated alloy consists of grains of a solid solution of Al and Zn in the Mg (α) matrix and regions of the Mg17Al12 (γ) phase. Rakshith et al. [42], also observed that Mg12Al17 and AlMn precipitates were dissolved in the microstructure. A fine lattice of Mg12Al17 precipitates tends to appear along the grain boundaries [41]. These precipitates have a cubic structure and are in the form of discontinuous precipitates. In our case, a cold-rolled alloy was welded. The microstructure of the WM–HAZ–BM interface (weld no. 1) is in Figure 5b. It is seen that the welding transformed the initial equiaxed microstructure into a dendritic one. At the BM–WM interface, where the heat-affected zone is difficult to observe, the microstructure can be characterized as columnar, and it transforms to equiaxed towards the centre of the weld joint. It is evident that WM is formed by a very fine equiaxed grain microstructure with an average grain size of 29.8 µm. In the bottom part of the figure, a pore with a diameter of 20.4 µm is captured in the weld metal, at the fusion boundary. Gao et al. [43] investigated the microstructure of the lap weld joint of the AZ31B magnesium alloy, which was produced with a laser power of 2.75 kW and a welding speed of 2 m/min. They measured a grain size in the range of 16.4 to 44.2 μm in the weld metal. Coelho et al. [44] observed that the microstructure of the weld metal in the centre is formed by equiaxed grains with an average grain size of 6 μm, while near the fusion boundary is a microstructure characterized by columnar grains with a grain size of 7.4 μm. Quan et al. [37] reported that with increasing heat input, the columnar grain bandwidth changed and the grains in the FZ became coarser. The difference in grain size in the base material and in the weld metal is due to the high welding speed (35 mm/s), which caused a lower heat input and a high cooling rate, which led to the formation of a very fine dendritic microstructure of the weld metal. This fact is a typical phenomenon in laser beam welding. The HAZ was very narrow and hard to distinguish via light microscopy. Because of high thermal conductivity, the heat was dissipated very quickly from the location of the weld metal. Only slight grain coarsening was observed resulting from the peak temperatures in this zone. Chowdhury et al. [45] observed that recrystallization and grain growth occurred in the HAZ. They also observed columnar dendrites in the area of the fusion boundary. Hao et al. [46] found that without the use of laser beam oscillation, the microstructure was homogeneously mixed with columnar and equiaxed grains. The columnar grains are formed at the boundary of the molten pool due to the high-temperature gradient. Gao et al. [43] reported that by oscillating the beam, the growth of the columnar grains at the edge of the weld can be reduced and a more uniform temperature gradient can be achieved, leading to the formation and growth of finer equiaxed grains. In our case, the heat-affected area is indistinct. The welded joint produced at a lower filler wire feed rate (70 cm/min) is shown in Figure 5c. The weld metal microstructure has a dendritic morphology with very fine dendrites. It can be assumed that the dendrites are formed by a solid solution of Al in Mg, and that the γ-phase (Mg Mg12Al17) and β-phase (Mg2Al3) are excluded in the inter-dendritic space. Qualitative phase analysis, namely electron diffraction, will be used to accurately identify intermetallic phases. At the fusion boundary, in the area of the columnar grains, there is a pore with a diameter of 73.6 μm. The weld joint that was produced at a filler wire feed rate of 0 cm/min is shown in Figure 5d. Figure 5d shows the microstructure of WM–BM interface no. 3, wherein the weld metal is also characterized by dendritic morphology, while the base material is formed by polyhedral grains. As can be seen from the picture, grain refinement has occurred in the weld metal. According to Kou [47], the microstructure of the fusion region is related to supercooling. The morphology of the weld metal changed from cellular crystals to columnar crystals to equiaxial crystals when the temperature gradient was reduced. Zhang et al. [48] pointed out that a longer solidification time in the transition area leads to the migration of aluminium and zinc elements from inside the grains to their boundaries. Three pores were captured at the fusion boundary. The largest of them, at the top of the figure, has a diameter of 128.4 μm. The pore, which is visible in the middle of the image at the fusion boundary, has a diameter of 42.6 μm. The last pore, which is at the bottom of the figure, has the smallest diameter, namely 38.4 μm. The entrapment of the pores in the weld metal was probably caused by the evaporation of the lightweight alloying elements.
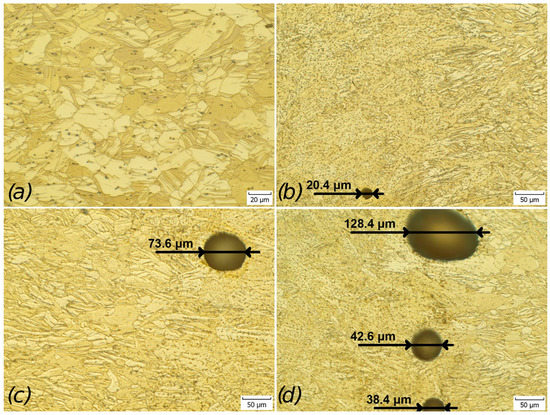
Figure 5.
Microstructure of (a) BM, (b) WM–HAZ interface of weld joint no. 1, (c) BM–HAZ–WM interface of weld joint no. 2, (d) WM–HAZ–BM interface of weld joint no. 3.
Images captured via SEM (Figure 6a–f) document various zones of weld joints that were produced at a filler wire feed rate of 130 cm/min (b), 70 cm/min (c), and 0 cm/min (d). Figure 6a shows the base material which consists especially of an α-magnesium solid solution matrix.
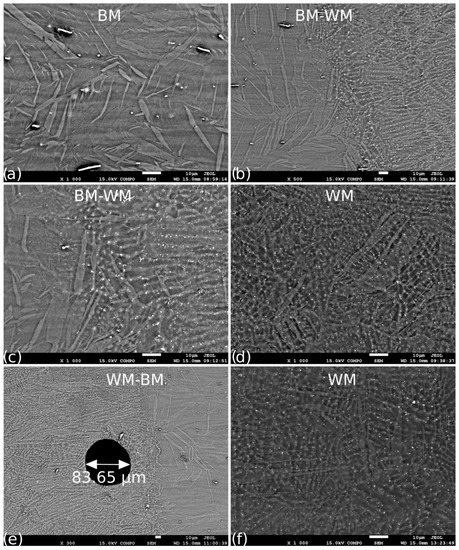
Figure 6.
Scanning electron microscope images of various areas: (a) BM; (b) BM–WM interface of weld joint no. 1; (c) higher magnification of BM–WM interface of the previous image; (d) WM of weld joint no. 2; (e) WM–BM interface of weld joint no. 3; (f) WM of weld joint no. 3.
Figure 6b (weld joint no. 1) is given the base metal–weld metal interface. The heat-affected zone is narrow and indistinct with an average width of 16.8 μm. Coelho et al. [44] measured the width of the heat-affected zone of 10 μm. In addition, coarse precipitates of Mg17Al12 were observed in this region. As can be seen from the image, grain refinement occurred in the weld metal. Chen et al. [35] found that the microstructure had much finer equiaxed grains if they used a filler wire that contained manganese. They also detected the Al8Mn5 phase. Further imaging (Figure 6c) shows a higher magnification of the previous image. Inter-dendritic spaces are enriched with lightweight alloying elements. The brighter places that can be seen in the picture are elements with a higher atomic number. The microstructure of the weld metal of weld joint no. 2 (filler wire feed rate of 70 cm/min) is given in Figure 6d. In our case, the microstructure of the weld metal is formed by very fine dendritic morphology. Song et al. [49] observed fine equiaxial dendrites in the weld metal microstructure, which consisted of α-Mg and -Mg17Al12 phases. Weld joint no. 3 was created with a filler wire feed rate of 0 cm/min, given in Figure 6e. At the fusion boundary, a pore with a diameter of 83.65 µm is captured. The entrapment of the pore in the weld metal was probably caused by the evaporation of the lightweight alloying elements. Figure 6f shows a higher magnification of the microstructure of weld metal no. 3, which is also characterized by dendritic morphology. As can be seen from the picture, grain refinement has occurred in the weld metal.
3.4. EDS Analysis
When filler metal is used, the weld metal composition is determined by the ratio between the amount of the melted base metal and the filler metal in the weld seam. For better analysis of the weld joint, SEM/EDS analysis was conducted. Energy dispersive spectroscopic measurements were carried out on the base material–weld metal interface to determine the variation, in wt.%, of the main elements. Subsequently, a line EDS analysis of the change in the concentration of Mg, Al and Zn across the base material–weld metal interface was performed. In Figure 7 is shown a line scan of the chemical composition distribution across the fusion zone for sample no. 1. A change in chemical composition along the weld cross-section for sample no. 1 (filler wire feed rate of 130 cm/min) was not observed. The results of the line EDS analysis show that there was no increase in the content of Al and Zn elements at the interface between the base material and the weld metal. No other significant increases in elements were observed.
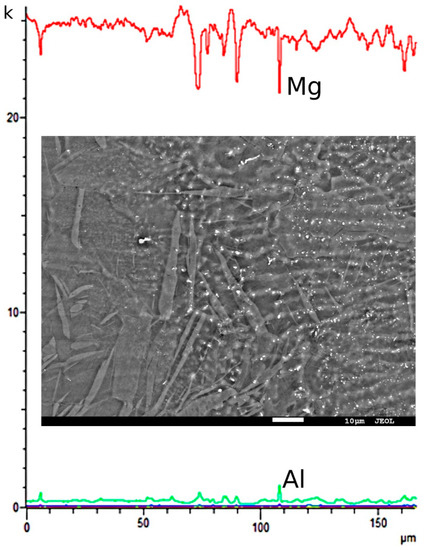
Figure 7.
SEM image of the zone for EDS line analysis for weld no. 1.
To investigate the microstructures of the laser weld joint in detail (weld No. 1), EDS analysis was performed in selected sites of the fusion zone as shown in Figure 8. In Table 5 are given the individual values of the main alloying elements for individual spectra 1 to 10. Paler areas, spectra 1–3, and 10 were characterized by an increased Al (9.36–16.04 in wt.%) and Zn (4.12–13.42 in wt.%) content. In darker areas of spectrums four to nine, the content of alloying elements dropped to 1.49–4.51 in wt.% Al, and 0.44–1.59 in wt.% Zn, and a higher Mg content was observed.
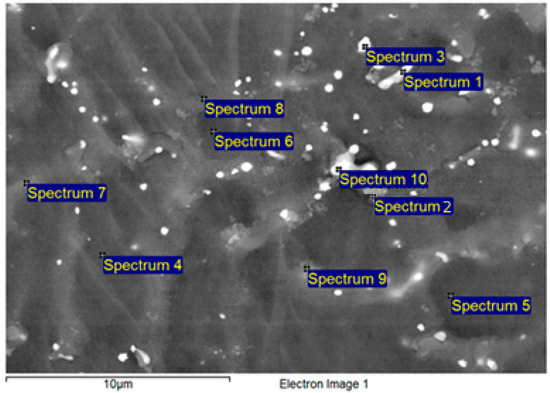
Figure 8.
Local chemical composition measurement sites using EDS analysis in the weld no. 1.
Table 5.
Element proportions in wt. % (weld joint No. 1).
For a more detailed analysis of the redistribution of alloying elements in the weld metal, elementary mapping of Mg, Al, Zn, Si, O, and Mn was performed (Figure 9). From the mapping analysis in the weld metal zone, it is clear that the content of Al and O elements is increased in the brighter areas in Figure 9a.
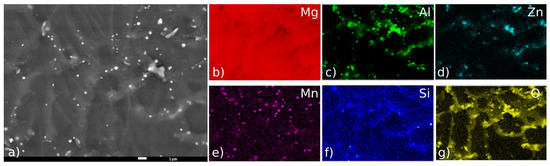
Figure 9.
Mapping of elements across weld metal no. 1; (a) weld metal, (b) Mg, (c) Al, (d) Zn (e) Mn, (f) Si, (g) O.
4. Computed Tomography
The porosity identified in the laser welding of magnesium and aluminium alloys consists mainly of four types: hydrogen pores, porosity caused by the collapse of unstable keyholes, porosity due to entrapment of gases by surface turbulence, and shrinkage porosity [50]. During keyhole laser welding, since the vaporization of alloying elements in keyholes is not uniform and keyhole positions vary with time, the inherently unstable keyhole flow may entrap shielding gas (the shielding gas cannot be truly pure) or even air, due to imperfect gas shielding. Deeper keyholes, however, are inherently unstable because the vapour pressure to laterally hold the molten metal must balance the surface tension and greater hydrostatic pressures as the depth of the pool increases. Narrower keyholes can increase their stability. The collapse of the unstable keyholes may cause porosity in magnesium alloys [51,52]. In addition, it was pointed out that the turbulent flow of molten metal in the weld pool can also form gas bubbles during the laser welding of magnesium alloys. The formation of gas porosity is greatly influenced by weld processing parameters [53]. The technical options to minimize gas pores would include the use of base metal with a low pore density, the removal of hydrogen sources before and during welding, and the production of a hydrogen–oversaturated weld fusion zone via rapid solidification [19]. A low laser power, high welding speed, and small beam diameters may increase the solidification rate and lead to the suppression of nucleation and growth of gas pores [54]. Pore area fractions go through a maximum with the welding speed. The time for the formation of gas porosity decreases with the increased cooling rate in the weld pool (increasing welding speed). At slow welding speeds, the interaction time (beam diameter/welding speed) is long enough for gas porosity to nucleate in large quantities, grow, and escape from the molten pool, mostly as a result of buoyancy or other convective flow processes. At high welding speeds, as is usually experienced in laser welding, gas pores will have insufficient time to nucleate and grow [55,56]. If several small pores coalesce to form a large pore, there will be an increase in the average pore size and total pore volume and a decrease in the pore density [57]. In weld metal, there are two different forms of porosity. In contrast to metallurgical porosity, process-induced porosity often has an irregular form and a larger size. Typically, during penetration welding, an unstable keyhole will cause processing porosity or cavities. A metallurgical porosity produced by hydrogen gas, on the other hand, has a smaller diameter, ranging from 10 to 100 µm. Hydrogen in the weld pool mostly comes from the surface oxide layers if the weld pool is adequately protected [58,59,60]. Takahashi et al. [61] investigated the effect of different shielding atmospheres in the formation of porosity in the weld metal. He found that if he used argon as the shielding atmosphere, the porosity was higher compared to mixed gases. He also found that the proportion volume of porosity changed with the change in focus of the laser beam over the sample surface. Panwisawas et al. [62] investigated the influence of the thickness of the welded material and the welding speed on the formation of porosity in the weld metal. It was found that with the increase in the thickness of the material, the proportion of porosity increased. An increase in the proportion volume of porosity was noted with a decrease in the welding speed.
Figure 10, Figure 11 and Figure 12 shows the 3D renderings of the locations of the pores present in the AZ31B magnesium alloy weld produced at different filler wire feed rates. In Figure 10 is given the weld joint created at a filler wire feed rate of 130 cm/min. It is clear from the figure that the measured value of the porosity volume in the weld metal was the lowest, namely 0.06 mm3. This can be attributed to the fact that during the welding of magnesium alloys, there is intense evaporation of the alloy elements and a turbulent swirling of the weld metal. The addition of a filler wire helps to stabilize the dynamics of the weld pool and simultaneously alloy the weld metal. In the weld joint, which was produced at a filler wire feed rate of 70 mm/min (Figure 11), a higher value of the porosity volume was measured compared to the previous weld. This is probably due to the lower filler wire feed rate to the weld pool. In this case, the value of the porosity volume in the welded joint was 0.22 mm3. The last weld joint (Figure 12), produced without the use of filler wire, recorded the highest value of the volume of porosity in the weld metal. In this case, several larger pores were detected. The value of the porosity volume is 0.63 mm3.
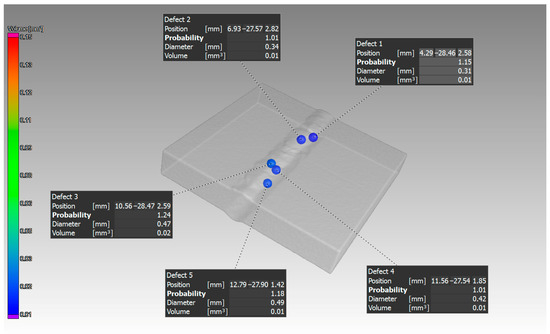
Figure 10.
Computed tomography of weld joint no. 1 created at filler wire feed of 130 cm/min.
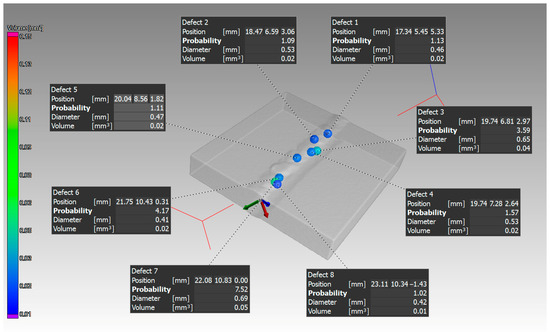
Figure 11.
Computed tomography of weld joint no. 2 created at filler wire feed of 70 cm/min.
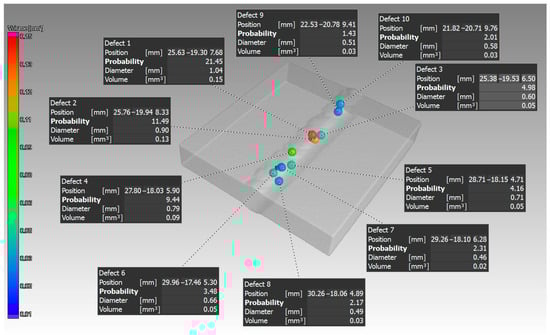
Figure 12.
Computed tomography of weld joint no. 3 created without filler wire.
Computed tomography from Zeiss, designated Metrotom 1500 (Carl Zeiss, Oberkochen, Germany), was used to determine the presence of porosity, and the distribution of pores in their dimensions and volumes in the weld metal. Metrotom OS 2.8 software was used for scanning and VG Studio MAX 3.0 software was used to evaluate the results. Welded joints with a length of 100 mm were used to detect pores in the weld metal. The computed tomography scanning parameters were as follows: Filter: Cu 1.5 mm; Number of projections: 2000; Voxel size: 82.57 microns; Voltage: 170 kV; Current: 600 µA; Distance from X-ray lamp: 310 mm; Integration time: 2000 ms; Detector resolution: 1024 × 1024 px.
5. Mechanical Tests
5.1. Microhardness of the Weld Joints
The effect of the filler wire feed rate on the microstructural changes in the microhardness of AZ31B–H24 welds was evaluated by measuring the microhardness in the direction perpendicular to the transverse cross-sections of the weld along three lines located 0.5 mm from the top and bottom surfaces with a gap of 0.5 mm between them. The weld joints’ microhardness course created at different filler wire feed rates are given in Figure 13. It is evident that the difference in the filler wire feed rates had a negligible effect on the microhardness of the fusion zone. The average microhardness value of the base material was 65.6 HV0.1. The course of the microhardness (Figure 13, orange line) of weld joint no. 1 (filler wire feed rate of 130 cm/min) showed an increased microhardness in the area of the weld metal. The average recorded value of the microhardness was 82.5 HV0.1. An increased microhardness value of the fusion region compared to the base material could be associated with the formation of a fine-grained dendritic microstructure in the weld metal. The rapid thermal cycle, which is typical for laser welding, has caused grain refinement in the fusion region. It should also be emphasized that if the AZ31 filler wire was not used, the average microhardness value of the weld metal would be lower compared to the base material due to the evaporation of the alloying elements. The filler wire contributed to the alloying of the weld metal. The increase in microhardness in the weld metal area can be related to precipitated phases β-(Mg2Al3) and γ-(Mg17Al12) in the inter-dendritic space. Similar results were measured for both weld joints. According to Shen et al. [63], the main reason for the increase in the microhardness of the weld metal compared to the base material is the refinement of the grain size. The course of the microhardness of weld no. 2 (Figure 13, grey line) showed an increased microhardness of the weld metal. The average recorded value of the microhardness was 81.7 HV0.1. The average microhardness value of the base material was 65.8 HV0.1. As in the previous case, the increase in microhardness is related to the fine dendritic microstructure of the weld metal and alloying of the weld metal by elements from filler wire. The course of microhardness of welded joint no. 3, which was produced without the use of filler wire, is shown in blue in the graph. In this case, the lowest average value of microhardness of the weld metal was measured, giving a figure of 79.7 HV0.1. Similar results were reported by Zhang et al. [48]. In their case, they measured an average microhardness of the base material of 64.5 HV, while the microhardness in the weld metal rose to 78.6 HV. The microhardness in the weld metal increased by 21.9% compared to the base material. In our case, it was similar when the microhardness increased by 23.6% compared to the base material.
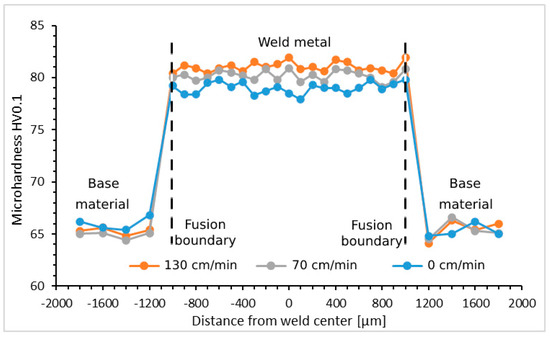
Figure 13.
Microhardness course.
5.2. Tensile Test
The dimensions’ tensile test specimen is given in Figure 14. The result of the tensile test is given in Figure 15. Three tensile tests were performed for each welded joint and the average value of the tensile strength was calculated. For the weld joint (Figure 15 red line), which was produced at a filler wire feed rate of 130 cm/min, the measured value was Rm = 220 ± 2.8 MPa. Although the filler wire feed rate was decreased to 70 cm/min, the average measured strength of weld joint no. 2 (Figure 15 blue line) was similar to the previous case, namely Rm = 224 ± 3.2 MPa. Lei et al. [64] pointed out that the proportion of the precipitated Mg17Al12 phase increases with the increasing aluminium content. They also found that the plasticity of the weld metal was declining and that fractures occurred regularly in the HAZ area. In the last sample, produced at a filler wire feed rate of 0 cm/min, the value of the tensile strength (Figure 15 black line) was measured at Rm = 154 ± 4.7 MPa. In our case, weld joints no. 1 and 2 fractured in the base material, which means that the weld joint was stronger than the base material. If filler wire was not used to produce the weld, the fracture appeared in the weld metal. This can be attributed to the intense evaporation of alloying elements during laser welding. Kuo [41] reported the same results in his study. Ahn et al. [18] observed only small variations in the yield strength and elastic modulus, while considerable differences in elongation to failure and ultimate tensile strength were measured. The addition of the filler metal reduced the risk of welding defects and improved ductility to over 3.5% and gave a fairly higher tensile strength of around 380 MPa. Based on the results of the tensile test, it is evident that the change in the filler wire feed rates had a significant effect on the tensile strength. Scintilla et al. [65] in their work investigated the laser power and speed of welding on mechanical properties. They found that the tensile strength increased with the increasing welding speed. They further found that when they used a laser beam power of 1.75 kW, the tensile strength values were almost the same as when using a 2-kW laser beam power. Based on the results, they stated that the lower the heat input, the higher the tensile strength of the laser welds.
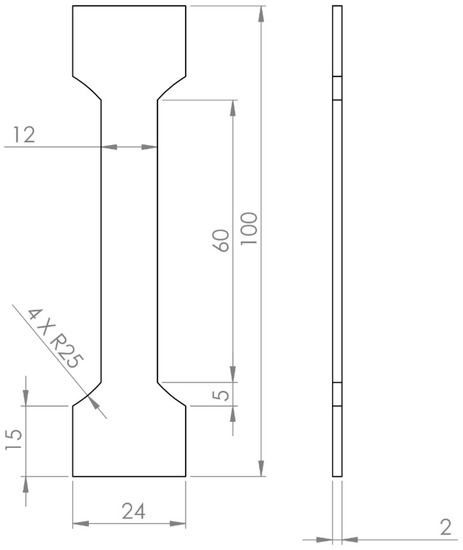
Figure 14.
Specimen dimensions for the tensile test.
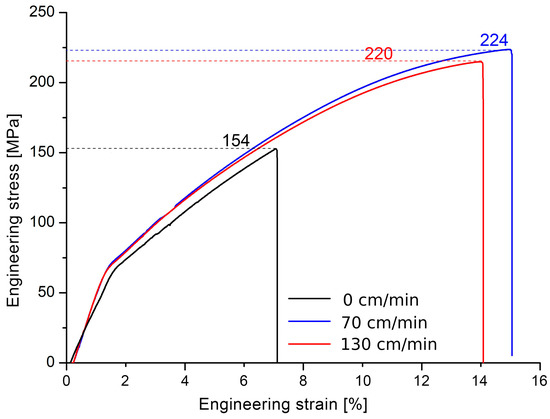
Figure 15.
Stress–strain curves for weld joints created at filler wire feed rates.
5.3. Analysis of the Fracture Surfaces
In Figure 16a–c are shown images from the SEM analysis of fracture surfaces. From the fracture surfaces at welds no. 1 and 2, it can be determined that these are fractures of a ductile character. Dimples are typical for ductile fractures, which can be seen in Figure 16a,b. It follows that the weld metal had higher strength than the base material. The average value of the tensile strength at weld no. 1 (filler wire feed rate of 130 cm/min) was 220 MPa. Welded joint no. 2, produced at a filler wire feed rate of 70 cm/min, the average measured tensile strength value was 224 MPa. A filler wire was not used to produce the third sample. As can be seen from the figure, a brittle fracture can be observed in this case. In this weld, a fracture occurred in the weld metal. In this case, the measured average tensile strength value dropped to 154 MPa. Authors [18] showed that the addition of filler wire increases the number of finer dimples within the weld, resulting in a purely ductile fracture behaviour. A significant amount of localised microscopic weld plasticity, which improved the tensile strength and ductility, was observed .
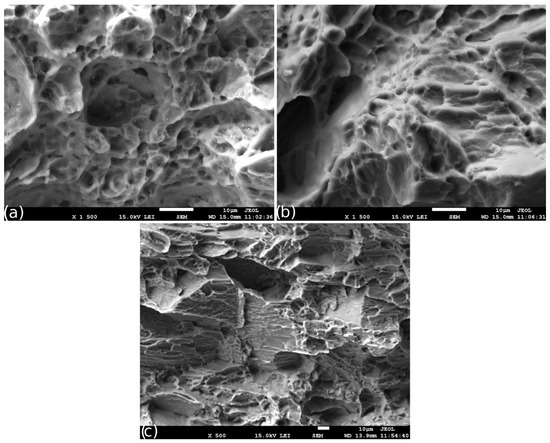
Figure 16.
Fracture surfaces: (a) 130 cm/min; (b) 70 cm/min; (c) 0 cm/min.
6. Conclusions
In this study, the effect of the filler wire feed rate on the porosity in the weld metal of the AZ31B magnesium alloy was investigated. The following conclusions could be drawn:
- -
- in all welded joints, the microstructure of the weld metal is formed by fine dendrites, while the base material is characterized by polyhedral grains;
- -
- according to elemental mapping analysis, it is evident that the wrought alloy is not homogenous in composition; larger clusters contain high concentrations of Al and Zn, while in smaller ones, the presence of a high amount of Al and Mn is observed;
- -
- clear segregation of aluminium, manganese, and zinc can be observed in the EDS maps and the local EDS line profile measurements. The precipitates formed were rich in Al and Mn or Al and Zn, compared to the matrix. They also show a large decrease in the Mg content to minimum values ranging from 10 to 60 wt.% in the precipitates;
- -
- the largest width of the weld metal (2.25 mm), as expected, was measured when the filler wire feed rate was 130 cm/min. On the contrary, the smallest width (1.92 mm) was recorded using a filler wire feed rate of 0 cm/min,
- -
- the highest average microhardness of the weld metal (82.5 HV0.1) was measured if the filler wire feed rate was 130 cm/min. Conversely, by not using filler wire, the average microhardness dropped to 79.7 HV0.1.
- -
- the tensile test revealed that weld metal no.1 (220 MPa) and no. 2 (224 MPa) had a higher strength than the base material. At the last weld joint, no. 3, which was created without the use of filler wire, a fracture occurred in the weld metal. The measured tensile strength was only 154 MPa.
Funding
This research was funded by [the Operational Programme Integrated Infrastructure for the project: Scientific and Research Centre of Excellence SlovakION for Material and Interdisciplinary Research], grant number [ITMS2014+: 313011W085] co-financed by the European Regional Development Fund And The APC was funded by [Research of physical, technical and material aspects of high-temperature reactors with the potential of hydrogen production, project code: 313011BUH7, co-financed from the resources of the European Regional Development Fund].
Institutional Review Board Statement
Not applicable.
Informed Consent Statement
Not applicable.
Data Availability Statement
Not applicable.
Conflicts of Interest
The author declares no conflict of interest.
References
- Zeng, R.-C.; Dietzel, W.; Zettler, R.; Gan, W.-M.; Sun, X.-X. Microstructural evolution and delayed hydride cracking of FSW-AZ31 magnesium alloy during SSRT. Trans. Nonferrous Met. Soc. China 2014, 24, 3060–3069. [Google Scholar] [CrossRef]
- Vyskoc, M. Influence of shielding gases on porosity during laser welding of AZ31B magnesium alloy. Met. Mater. 2021, 59, 401–414. [Google Scholar] [CrossRef]
- Chen, J.; Liu, T.; Lu, L.; Zhang, Y.; Zeng, W. Microstructure and mechanical property of rolled-weld magnesium alloy AZ31. Mater. Des. 2012, 36, 577–583. [Google Scholar] [CrossRef]
- IPolmea. Mg alloys and applications. Mater. Sci. Technol. 1994, 10, 1–16. [Google Scholar] [CrossRef]
- Yoo, M.; Agnew, S.; Morris, J.; Ho, K. Non-basal slip systems in HCP metals and alloys: Source mechanisms. Mater. Sci. Eng. A 2001, 319–321, 87–92. [Google Scholar] [CrossRef]
- Lin, C.M.; Tsai, H.L.; Lee, C.L.; Chou, D.S.; Huang, J.C. Evolution of microstructures and properties of magnesium alloy weldments produced with CO2 laser process. Mater. Sci. Eng. A 2012, 548, 12–18. [Google Scholar] [CrossRef]
- Lin, Y.-C.; Liu, J.-J.; Lin, B.-Y.; Lin, C.-M.; Tsai, H.-L. Effects of process parameters on strength of Mg alloy AZ61 friction stir spot welds. Mater. Des. 2012, 35, 350–357. [Google Scholar] [CrossRef]
- Lin, C.M.; Liu, J.J.; Tsai, H.L.; Cheng, C.M. Evolution of microstructures and mechanical properties of AZ31B magnesium alloy weldment with active oxide fluxes and GTAW process. J. Chin. Inst. Eng. 2011, 34, 1013–1023. [Google Scholar] [CrossRef]
- Quan, Y.; Chen, Z.; Gong, X.; Yu, Z. CO2 laser beam welding of dissimilar magnesium-based alloys. Mater. Sci. Eng. A 2008, 496, 45–51. [Google Scholar] [CrossRef]
- Mahendran, G.; Balasubramanian, V.; Senthilvelan, T. Developing diffusion bonding windows for joining AZ31B magnesium–AA2024 aluminium alloys. Mater. Des. 2009, 30, 1240–1244. [Google Scholar] [CrossRef]
- Abderrazak, K.; Salem, W.B.; Mhiri, H.; Lepalec, G.; Autric, M. Modelling of CO2 laser welding of magnesium alloys. Opt. Laser Technol. 2008, 40, 581–588. [Google Scholar] [CrossRef]
- Liu, H.-T.; Zhou, J.-X.; Zhao, D.-Q.; Liu, Y.-T.; Wu, J.-H.; Yang, Y.-S.; Ma, B.-C.; Zhuang, H.-H. Characteristics of AZ31 Mg alloy joint using automatic TIG welding. Int. J. Miner. Met. Mater. 2017, 24, 102–108. [Google Scholar] [CrossRef]
- Min, D.; Shen, J.; Lai, S.; Chen, J.; Xu, N.; Liu, H. Effects of heat input on the low power Nd:YAG pulse laser conduction weldability of magnesium alloy AZ61. Opt. Lasers Eng. 2010, 49, 89–96. [Google Scholar] [CrossRef]
- Li, F.; Zeng, X.; Cao, G. Investigation of microstructure characteristics of the CVCDEed AZ31 magnesium alloy. Mater. Sci. Eng. A 2015, 639, 395–401. [Google Scholar] [CrossRef]
- Yu, L.; Nakata, K.; Liao, J. Weld porosity in fibre laser weld of thixomolded heat resistant Mg alloys. Sci. Technol. Weld. Join. 2009, 14, 554–558. [Google Scholar] [CrossRef]
- Salleh, N.M.; Ishak, M.; Romlay, F.R. Effect of fiber laser parameters on laser welded AZ31B Magnesium alloys. MATEC Web Conf. 2017, 90, 1032. [Google Scholar] [CrossRef]
- Dhari, M.; Autric, M.; Masse, J.E.; Mathieu, J.F.; Barreau, G. Laser Welding of AZ91 and WE 43 Magnesium Alloys for Automotive and Aerospace Industries. Adv. Eng. Mater. 2001, 3, 504–507. [Google Scholar] [CrossRef]
- Ahn, J.; Chen, L.; He, E.; Davies, C.; Dear, J. Effect of filler metal feed rate and composition on microstructure and mechanical properties of fibre laser welded AA 2024-T3. J. Manuf. Process. 2017, 25, 26–36. [Google Scholar] [CrossRef]
- Cao, X.J.; Jahazi, M.; Immarigeon, J.P.; Wallace, W. A review of laser welding techniques for magnesium alloys. J. Mater. Process. Technol. 2006, 171, 188–204. [Google Scholar] [CrossRef]
- Dilthey, U.; Haferkamp, H.; Niemeyer, M.; Trager, G. Laser and EB Welding of Magnesium Alloys; IIW Document No. IV-701-98; American Institute of Welding: Miami, FL, USA, 1998. [Google Scholar]
- Haferkamp, H.; Goede, M.; Bormann, A.; Cordini, P. Laser beam welding of magnesium alloys—New possibilities using filler wire and arc welding. Proc. LANE Laser Assist. Net Shape Eng. 2001, 3, 333–338. [Google Scholar]
- Sahul, M.; Sahul, M.; Lokaj, J. Lokaj. Effect of surface layer on the properties of AZ31 magnesium alloy welded joints. Mater. Today Proc. 2016, 3, 1150–1155. [Google Scholar] [CrossRef]
- Harooni, M.; Ma, J.; Carlson, B.; Kovacevic, R. Two-pass laser welding of AZ31B magnesium alloy. J. Mater. Process. Technol. 2015, 216, 114–122. [Google Scholar] [CrossRef]
- Deng, A.; Chen, H.; Zhang, Y.; Liu, Y.; Yang, X.; Zhang, B. Effect of filler materials on the porosity formation of aluminum alloy by laser welding with filler wire. Opt. Laser Technol. 2023, 159, 109000. [Google Scholar] [CrossRef]
- Dongxia, Y.; Xiaoyan, L.; Dingyong, H.; Zuoren, N.; Hui, H. Huang. Optimization of weld bead geometry in laser welding with filler wire process using Taguchi’s approach. Opt. Laser Technol. 2012, 44, 2020–2025. [Google Scholar] [CrossRef]
- Huang, W.; Chen, S.; Xiao, J.; Jiang, X.; Jia, Y. Investigation of filler wire melting and transfer behaviors in laser welding with filler wire. Opt. Laser Technol. 2021, 134, 106589. [Google Scholar] [CrossRef]
- Feng, J.; Li, L.; Chen, Y.; Lei, Z.; Qin, H.; Li, Y. Effects of welding velocity on the impact behavior of droplets in gas metal arc welding. J. Mater. Process. Technol. 2012, 212, 2163–2172. [Google Scholar] [CrossRef]
- Liu, S.; Liu, F.; Zhang, H.; Shi, Y. Analysis of droplet transfer mode and forming process of weld bead in CO2 laser–MAG hybrid welding process. Opt. Laser Technol. 2012, 44, 1019–1025. [Google Scholar] [CrossRef]
- Yu, Y.; Huang, W.; Wang, G.; Wang, J.; Meng, X.; Wang, C.; Yan, F.; Hu, X.; Yu, S. Investigation of melting dynamics of filler wire during wire feed laser welding. J. Mech. Sci. Technol. 2013, 27, 1097–1108. [Google Scholar] [CrossRef]
- Lee, W.; Yeon, Y.; Jung, S. Joint properties of friction stir welded AZ31B– H24 magnesium alloy. Mater. Sci. Technol. 2003, 19, 785–790. [Google Scholar] [CrossRef]
- Chiuzuli, F.R.; Batistão, B.F.; Bergmann, L.A.; de Alcântara, N.G.; dos Santos, J.F.; Klusemann, B.; Gargarella, P. Effect of the gap width in AZ31 magnesium alloy joints obtained by friction stir welding. J. Mater. Res. Technol. 2021, 15, 5297–5306. [Google Scholar] [CrossRef]
- Lampman, S. Weld Integrity and Performance: A Source Book Adapted from ASM International Handbooks, Conference Proceedings, and Technical Books. ASM Int. 1997, 417, 9781615032044. [Google Scholar]
- Vyskoč, M. Influence of Shielding Gas on Weldability of Non-Ferrous Metals by Laser. Ph.D. Thesis, Slovak University of Technology in Bratislava, Bratislava, Slovakia, 2018. [Google Scholar]
- Syed, W.U.H.; Li, L. Effects of wire feeding direction and location in multiple layer diode laser direct metal deposition. Appl. Surf. Sci. 2005, 248, 518–524. [Google Scholar] [CrossRef]
- Chen, Q.; Yan, H.; Chen, J.; Zeng, P.; Yu, Z.; Su, B. Laser Beam Welding of AZ31 Magnesium Alloy with Filler Strip. Mater. Manuf. Process. 2010, 25, 1227–1232. [Google Scholar] [CrossRef]
- Baumgart, P. Drawn magnesium wire for robotic welding and for mechanical applications. In Magnesium: Proceedings of the 6th International Conference Magnesium Alloys and Their Applications; Wiley-VCH Verlag GmbH & Co. KgaA: Weinheim, Germany, 2005; ISBN 9783527309757. [Google Scholar]
- Quan, Y.; Chen, Z.; Gong, X.; Yu, Z. Effects of heat input on microstructure and tensile properties of laser welded magnesium alloy AZ31. Mater. Charact. 2008, 59, 1491–1497. [Google Scholar] [CrossRef]
- Tadamalle, A.; Ramjee, E.; Reddy, Y. Influence of laser welding process parameters on weld pool geometry and duty cycle. Adv. Prod. Eng. Manag. 2013, 8, 52–60. [Google Scholar] [CrossRef]
- El-Batahgy, A.-M. Effect of laser welding parameters on fusion zone shape and solidification structure of austenitic stainless steels. Mater. Lett. 1997, 32, 155–163. [Google Scholar] [CrossRef]
- Matsuoka, S.; Okamoto, Y.; Okada, A. Influence of Weld Bead Geometry on Thermal Deformation in Laser Micro-Welding. Procedia CIRP 2013, 6, 492–497. [Google Scholar] [CrossRef]
- Kuo, T.-Y.; Lin, Y.-T. Effects of Shielding Gas Flow Rate and Power Waveform on Nd:YAG Laser Welding of A5754-O Aluminum Alloy. Mater. Trans. 2006, 47, 1365–1373. [Google Scholar] [CrossRef]
- Rakshith, M.; Seenuvasaperumal, P. Review on the effect of different processing techniques on the microstructure and mechanical behaviour of AZ31 Magnesium alloy. J. Magnes. Alloy. 2021, 9, 1692–1714. [Google Scholar]
- Gao, M.; Wang, H.; Hao, K.; Mu, H.; Zeng, X. Evolutions in microstructure and mechanical properties of laser lap welded AZ31 magnesium alloy via beam oscillation. J. Manuf. Process. 2019, 45, 92–99. [Google Scholar] [CrossRef]
- Coelho, R.; Kostka, A.; Pinto, H.; Riekehr, S.; Koçak, M.; Pyzalla, A. Microstructure and mechanical properties of magnesium alloy AZ31B laser beam welds. Mater. Sci. Eng. A 2008, 485, 20–30. [Google Scholar] [CrossRef]
- Chowdhury, S.H.; Chen, D.L.; Bhole, S.D.; Powidajko, E.; Weckman, D.C.; Zhou, Y. Fiber Laser Welded AZ31 Magnesium Alloy: The Effect of Welding Speed on Microstructure and Mechanical Properties. Met. Mater. Trans. A 2012, 43, 2133–2147. [Google Scholar] [CrossRef]
- Hao, K.; Wang, H.; Gao, M.; Wu, R.; Zeng, X. Laser welding of AZ31B magnesium alloy with beam oscillation. J. Mater. Res. Technol. 2019, 8, 3044–3053. [Google Scholar] [CrossRef]
- Kou, S. Welding Metallurgy, 2nd ed.; John Wiley & Sons, Inc.: Hoboken, NJ, USA, 2003. [Google Scholar]
- Zhang, X.; Cao, Z. Effects of pulse shaping on Nd:YAG laser spot welds in an AZ31 magnesium alloy. Opt. Lasers Eng. 2019, 119, 1–8. [Google Scholar] [CrossRef]
- Song, G.; Diao, Z.; Lv, X.; Liu, L. TIG and laser–TIG hybrid filler wire welding of casting and wrought dissimilar magnesium alloy. J. Manuf. Process. 2018, 34, 204–214. [Google Scholar] [CrossRef]
- Cao, X.; Wallace, W.; Immarigeon, J.P.; Poon, C. Research and progress in laser welding of wrought aluminum alloys. I. Laser welding processes. Mater. Manufact. Process. 2003, 18, 1–22. [Google Scholar] [CrossRef]
- Aghion, E.; Bronfin, B. Magnesium Alloys Development towards the 21st Century. Mater. Sci. Forum 2000, 350–351, 19–30. [Google Scholar] [CrossRef]
- Polmear, I.J. Light Alloys: Metallurgy of the Light Metals, 3rd ed.; Arnold: London, UK, 1995; p. 207. [Google Scholar]
- Jutter, S. Arc Welding of Magnesium alloys. In Proceedings of the IIW Seminar: Trends in Welding of Lightweight Automotive and Railroad Vehicles, Wels, Austria, 26–28 February 1997. [Google Scholar]
- Pastor, M.; Zhao, H.; DebRoy, T. Continuous wave-Nd:yttrium aluminium–garnet laser welding of AM60B magnesium alloys. J. Laser Appl. 2000, 12, 91–100. [Google Scholar] [CrossRef]
- Haferkamp, H.; von Alvensleben, M.; Goede, M.; Niemeyer, J.; Bunte, J. Fatigue strength of laser beam welded magnesium alloys. In Proceedings of the 32 ISATA, International Symposium on Automotive Technology and Automation: Advances in Automotive and Transportation Technology and Practice for the 21st Century, Vienna, Austria, 14–18 June 1999; pp. 389–397. [Google Scholar]
- Marya, M.; Edwards, G. The laser welding of magnesium alloy AZ91. Weld. World 2000, 44, 31–37. [Google Scholar]
- Zhao, H.; DebRoy, T. Pore formation during laser beam welding of die-cast magnesium alloy AM60B—Mechanism and remedy. Weld. J. 2001, 80, 204S–210S. [Google Scholar]
- Xiao, R.; Zhang, X. Problems and issues in laser beam welding of aluminum–lithium alloys. J. Manuf. Process. 2014, 16, 166–175. [Google Scholar] [CrossRef]
- Wu, S.C.; Yu, X.; Zuo, R.Z.; Zhang, W.H.; Xie, H.L.; Jiang, J.Z. Porosity, Element Loss, and Strength Model on Softening Behavior of Hybrid Laser Arc Welded Al-Zn-Mg-Cu Alloy with Synchrotron Radiation Analysis. Weld. J. 2013, 92, 64. [Google Scholar]
- Sato, S.; Matsumoto, J.; Okoshi, N. Effects of porosity on the fatigue strength of 5083 alloy butt-welds. J. Jpn. Inst. Light Met. 1976, 26, 398–405. [Google Scholar] [CrossRef]
- Takahashi, K.; Mehmetli, B.; Sato, S. Influence of shielding gas and laser irradiation conditions on porosity formation in CO2laser welding of aluminium alloy. Weld. Int. 1998, 12, 347–353. [Google Scholar] [CrossRef]
- Panwisawas, C.; Perumal, B.; Ward, R.M.; Turner, N.; Turner, R.P.; Brooks, J.W.; Basoalto, H.C. Basoalto. Keyhole formation and thermal fluid flow-induced porosity during laser fusion welding in titanium alloys: Experimental and modelling. Acta Materialia 2017, 126, 251–263. [Google Scholar] [CrossRef]
- Shen, J.; Wen, L.; Li, Y.; Min, D. Effects of welding speed on the microstructures and mechanical properties of laser welded AZ61 magnesium alloy joints. Mater. Sci. Eng. A 2013, 578, 303–309. [Google Scholar] [CrossRef]
- Lei, Z.; Bi, J.; Li, P.; Guo, T.; Zhao, Y.; Zhang, D. Analysis on welding characteristics of ultrasonic assisted laser welding of AZ31B magnesium alloy. Opt. Laser Technol. 2018, 105, 15–22. [Google Scholar] [CrossRef]
- Scintilla, L.D.; Tricarico, L.; Brandizzi, M.; Satriano, A.A. Nd:YAG laser weldability and mechanical properties of AZ31 magnesium alloy butt joints. J. Mater. Process. Technol. 2010, 210, 2206–2214. [Google Scholar] [CrossRef]


Disclaimer/Publisher’s Note: The statements, opinions and data contained in all publications are solely those of the individual author(s) and contributor(s) and not of MDPI and/or the editor(s). MDPI and/or the editor(s) disclaim responsibility for any injury to people or property resulting from any ideas, methods, instructions or products referred to in the content. |
© 2023 by the author. Licensee MDPI, Basel, Switzerland. This article is an open access article distributed under the terms and conditions of the Creative Commons Attribution (CC BY) license (https://creativecommons.org/licenses/by/4.0/).