Abstract
Rocket engine thrust chambers withstand very high temperatures and thermal gradients during service that induce multiple damaging phenomena such as plasticity, low-cycle-fatigue (LCF) and creep. Numerical models can be used during the design of these mechanical components in order to simulate the main mechanical damaging processes, accounting for complex material behavior as due to non-linear hardening phenomena and viscoplasticity. This work represents an improvement upon previous research by the authors, with particular reference to the addition of the Wang–Brown fatigue criterion, to consider the effects of multiaxiality and non-proportionality of loads, and the Voce model to account for non-linear isotropic hardening. A precipitation hardened copper alloy has been considered as the material of the thrust chamber internal structure. The most critical areas resulted to be on the internal surface of the chamber and in particular in correspondence of the throat region, consistently with experimental tests available in the literature conducted on similar geometries. Results demonstrated that low cycle fatigue and thermal ratcheting (plastic instability) are the dominant damaging phenomena for the considered test case.
1. Introduction
A liquid-propellant rocket, or liquid rocket, utilizes a rocket engine that uses liquid propellants. In a liquid rocket engine, stored fuel and stored oxidizer are pumped into a combustion chamber where they are mixed and burned. The hot exhaust passes through a nozzle which accelerates the flow, and thrust is produced according to Newton’s third law of motion. The combustion produces great amounts of exhaust gases at high temperature and pressure, with consequent heavy thermal loads acting on the structure. In the latest applications, liquid rocket engines generally use a mixture of oxygen and methane in liquid form as propellant, in order to achieve the requests in terms of thrust.
Active cooling is one of the latest advances that allows to avoid excessive temperatures by using methane as coolant, to reduce temperature in the structure, before it is injected in the chamber. At the same time, this technology requires pressure inside the cooling channels that surround the engine higher than that occurring in the chamber itself. Therefore, bending is induced in the inner wall that separates the hot gases from the coolant. Furthermore, especially during transients, compressive hoop stresses are generated in the inner wall that is restrained by the colder outer structure. This phenomenon causes thermal-stresses that can potentially exceed the yield stress of the material generating plastic deformations in the walls that can, in turn, affect the overall structural safety.
The possible failure mechanisms of a thrust chamber were analyzed in numerous experimental campaigns. Hannum et al. [1] studied the thermo-mechanical behavior of cooling channels made of NArloy-Z copper alloy and OFHC (Oxygen Free High Conductivity copper) from an experimental point of view; they found that ratcheting was the dominant damaging phenomenon leading to the rupture of the cooling channel.
Quentmeyer [2] extended the investigations to the AMZIRC copper alloy and found that a thinning of the ligament was detected during the experimental tests.
More recently, Gernoth et al. [3] conducted several thermo-mechanical fatigue (TMF) tests on panels to validate thermo-fluid-dynamic analyses and to assess state-of-the-art viscoplastic models. From a numerical point of view, several studies have been conducted to develop viscoplastic models capable of reproducing the actual deformation of the cooling channel [4].
The present paper can be considered as a continuation of previous works [5,6]; in particular, one of the aims was to improve the isotropic hardening model from a linear to a non-linear one (through the Voce model), and to provide more insights in the low cycle fatigue evaluations by employing the Wang–Brown model.
The thrust chamber structure under examination is made of a precipitation-hardened copper alloy (C18150), exposed to the combustion chamber gases, and electrodeposited layers made of copper and nickel on the outside. Combined non-linear hardening models (isotropic and kinematic hardening) were considered for the simulation of the thermo-mechanical behavior [7,8,9]. More accurate modelling, with respect to literature works, was preferred to model creep, considering both primary and secondary creep stages, obtained by means of the combined time hardening rule (creep is usually modelled with Norton’s law, i.e., with allowance for secondary creep only).
Regarding the investigation of typical thrust chamber failure mechanisms, creep, Low-Cycle Fatigue (LCF) and ratcheting have been identified as the most likely causes of failure [10,11,12]. Typically, a “dog-house” effect with ligament thinning is recorded between the cooling channels as a result of a combination of those failure mechanisms.
Previous works adopted the Manson–Coffin law for LCF evaluations [8,11,12]. However, no studies can be found on the investigation of the effects of multiaxial and non-proportional loading on the fatigue life of the thrust chamber. Hence, a significant effort was made in the present study to fill this gap, so as to gain a better understanding regarding the relevance of their effects. In the present work, in addition to Smith Watson and Topper (SWT), the Wang–Brown (WB) criterion has been used to evaluate the service life of the thrust chamber. In particular, the WB method is very versatile since it allows to estimate, besides the effects of multiaxiality (modelled by the SWT method too), the non-proportional loading consequences on the service life of the component.
In previous works [5,6], the authors have studied the thermomechanical behavior of the HYPROB thrust chamber cooling channel adopting an annealing softened copper alloy (CuCrZr), whereas a precipitation hardened copper alloy is considered in the current work.
In more details the new feature implemented and tested in this work are:
- Non-linear isotropic hardening model (VOCE) instead of the multilinear isotropic one; in such a way a saturation yield stress is considered;
- Wang–Brown fatigue criterion, using the commercial code ncode DesignLife. Fatigue results are compared with those obtained with the SWT fatigue criterion; multiaxiality non-proportional loading effects are considered.
Since a precipitation hardened alloy is considered for the inner layer of the thrust chamber, softening behavior is expected when the thrust chamber is thermo-mechanically cyclically loaded. The finite element code adopted to solve the thermostructural analyses is ANSYS 2021 R1.
The work is organized in the following manner: a description of the adopted numerical models (hardening, creep and fatigue) is given in the next section; then the numerical results are analyzed and summarized; finally, conclusions and future perspectives are described in the Section 6.
2. Structural Model
An illustration of a rocket engine thrust chamber is shown in Figure 1. Being the throat region the most critical zone of the whole component, this was the core of the analyses reported in this document. Figure 2 shows the throat region highlighting the thermo-mechanical boundary conditions set up in the framework of a submodelling approach. Namely, an axis-symmetric FEM (Finite Element Method) model of the whole chamber was used as global model, whereas only the local submodel of the throat area shown in Figure 2 was extracted and used for the detailed analyses of this critical zone.
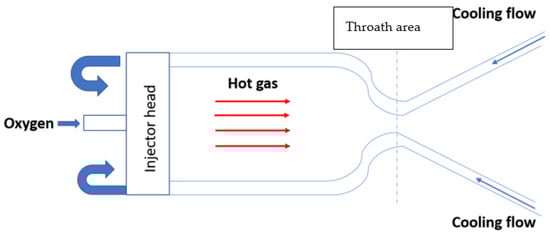
Figure 1.
Rocket engine thrust chamber and related functional scheme [5].
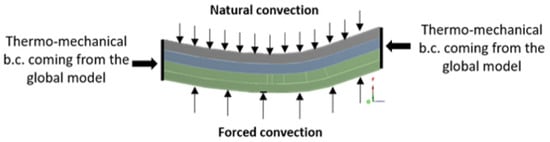
Figure 2.
Thermo-mechanical boundary conditions [5].
Plasticity was modelled with the von Mises yield criterion, Prandtl–Reuss flow rule, and both non-linear isotropic and kinematic hardening laws, as respectively proposed by Voce [13] and Chaboche [14,15,16]. Creep effects are simulated considering primary and secondary creep models (combined time hardening) [17,18]. Such a choice has been driven by literature results, such as [17], where the authors have demonstrated that the adoption of a comprehensive creep model including primary and secondary creep effects ensure a more reliable solution.
Plastic instability, fatigue and creep damage mechanisms are taken into account in a cumulative damage model. A weak coupling has been considered between the thermal and the displacement field, namely the temperature field influences the strain–stress response, and not vice versa. Several papers from literature demonstrated that such an approximation provided accurate results [19].
The transient thermal behavior of cooling channels was investigated by non-linear FEM analyses, considering the dependence of material properties with temperature.
2.1. Creep
The creep effect was modeled by a combined time hardening relationship. The combined time hardening model can be described through Equation (1), whose calibration parameters are shown in Table 1 as obtained from [20]:
where , … are material constants retrieved by one-dimensional creep tests.

Table 1.
Material parameters for combined time hardening equation, where temperature is expressed in K, time in s, and stress in MPa.
A more extensive discussion on the adopted viscoplastic model and a comparison among different approaches are described in [21].
2.2. Plasticity
Plasticity can be considered as one of the primary mechanisms of failure of the engine and has to be modelled in the most accurate way. To this aim, a combined isotropic-kinematic hardening model was set up in this work to model the material behavior. The Chaboche kinematic hardening law comprising three back stresses (these latter defined by Armstrong–Frederick models) was adopted to account for the kinematic hardening phenomenon [8]. A detailed explanation of this plasticity hardening model was reported in [5,6] where also the related calibration parameters can be found.
The Voce hardening model is adopted to represent the non-linear isotropic hardening behavior. It is described by the following equation:
where:
- is the current yield stress,
- is the initial yield stress,
- , and are material parameters characterizing the isotropic hardening behavior of materials,
- is the equivalent plastic strain.
In the present case, the term is equal to zero, then, a saturation yield stress is present, namely ( . Voce model hardening parameters are summarized in Table 2.
Table 2.
Voce model parameters for CuCrZr [9].
The material parameters of the Voce law are calibrated by the fitting method using the stabilized (saturated) loops obtained from a series of strain-controlled uni-axial cyclic tension/compression tests for precipitation-hardened CuCrZr alloy (Figure 3) [9].
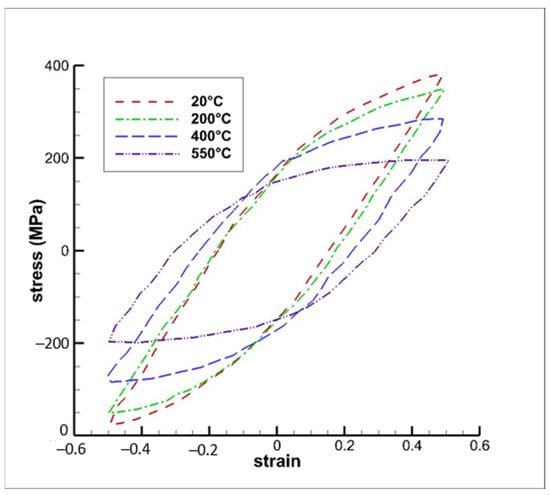
Figure 3.
Precipitation-hardened CuCrZr-Saturated loops at different temperatures [14].
2.3. Low Cycle Fatigue
2.3.1. Smith Watson Topper Method
The Smith–Watson–Topper criterion was considered in this work to account for the LCF phenomenon. Among the various possible options, this model was chosen because accounting for the mean stress effect through following equation:
where the exponent b and the fatigue strength coefficient are the Basquin law coefficients, the exponent and the fatigue ductility coefficient are the Manson–Coffin parameters, finally 2Nf is the number of reversals to failure. SWT calibration parameters can be found in [6]. Equation (3) was therefore solved for the assessment of damage produced by loads or for the life prediction directly. Furthermore, the effect produced by the multiaxiality of the local stresses are considered by means of the biaxiality ratio :
where and are the second and the first principal stress respectively. In what follows, the SWT calibration parameter values are summarized:
2.3.2. Wang–Brown Fatigue Method
The Wang-Brown (WB) fatigue criterion is made of two parts: a multiaxial rainflow cycle counting algorithm, and a path-independent multiaxial fatigue damage parameter. The multiaxial cycle counting method is based on strain hardening behavior under non-proportional variable amplitude loading. The concept of relative stresses and strains is introduced so that a pair of turning points define the start and end points of a reversal, where the equivalent relative strain rises monotonically to a peak value. Since plastic deformation generates the driving force for small fatigue cracks, hardening provides a physical parameter for cycle counting analogous to rainflow counting in the uniaxial case.
Then, the input for the present method is the elastic-plastic strain and stress history, coming from the finite element solution. Unlike critical plane methods where crack initiation is assumed to occur along a single plane, the Wang–Brown approach considers that crack initiation may occur in several planes depending on the direction of the principal strains.
The path-independent damage parameter proposed by Wang and Brown has been shown to provide good correlation for several materials under proportional and non-proportional loading [22]:
where:
- -
- is the maximum shear strain amplitude on critical plane;
- -
- is the normal strain excursion between two turning points of the maximum shear strain (that is the range of the normal strain experienced on the maximum shear plane over the interval from start to end of the reversal);
- -
- is the mean stress normal to the maximum shear plane;
- -
- − S is a material constant determined from a multiaxial test (default = 1);
- -
- is the effective Poisson’s ratio;
- -
- and b are parameters from Basquin law;
- -
- and c are parameters from Coffin–Manson law.
In general, the Wang–Brown method’s main features can be summarized as follows:
- The method adopts of a complex recursive multi-axial rainflow counting method,
- a mean stress correction method can be considered,
- the method can be adopted for proportional and non-proportional loadings,
- it may be slow for long loading histories,
- evaluates a different critical plane for each rainflow reversal.
3. Description of Numerical Model
A local model of the throat region, where maximum heat fluxes and temperature gradients are expected, was analyzed by a submodelling approach (Figure 4), in order to reduce the computational burden related to an accurate investigation involving the whole chamber. In particular, a global model with a coarse mesh in the throat region, was built to evaluate the displacement and thermal boundary conditions to be applied on the cut surfaces of the local model [23]. Considerable computational savings can be achieved, since a full model with a refined mesh, useful to rigorously capture local stress gradients, would ask for a computation time that is one order of magnitude higher than that needed with a sub-modelling approach.
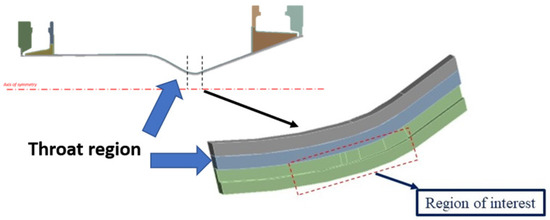
Figure 4.
Global model (up), submodel with highlight of the region of interest where to focus the analysis of numerical results (down) [5].
In general, sub-modelling approaches allow to restrict the mesh refinement to the zones where plastic strains are envisaged. In particular, FEM analyses on a global model with a coarse mesh and a local model with a fine mesh are sequentially conducted. The displacements and temperatures, obtained by a FEM analysis of the global model, calculated on the interface between the global and local models, are transferred to the local refined model as boundary conditions for each time step. As demonstrated in [5,6], only a few cycles, need to be simulated with a global model to provide appropriate boundary conditions to the local model, because after 3–4 cycles such boundary conditions become stabilized, without any more significant variations (the variations are restricted to the submodelled volume where high plastic strains are expected). Only half-cooling channel was modeled (Figure 5), taking advantage of the symmetry of the chamber, with related boundary conditions (Figure 6).
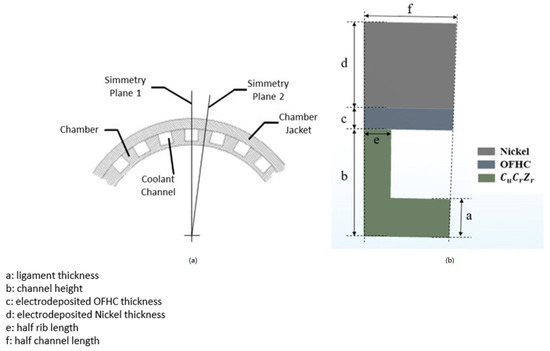
Figure 5.
Highlight of symmetry conditions (a) and cooling channel section (b) [5].
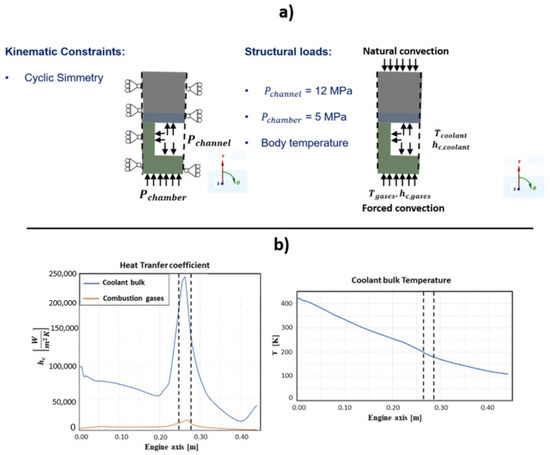
Figure 6.
(a) Thermal and structural boundary conditions; (b) Convective boundary conditions [5,6].
The combustion chamber was realized with three different materials, as shown in Figure 5:
- CuCrZr alloy, in the zone in contact with the hot gases and the coolant;
- a thin layer of electrodeposited oxygen-free high-thermal conductivity copper (OFHC Cu);
- a layer of electrodeposited nickel to afford adequate chamber stiffness.
Table 3, Table 4, Table 5, Table 6, Table 7 and Table 8, also reported in [5,6], summarize the mechanical, physical and thermal properties of the copper alloy CuCrZr, the electrodeposited OFHC Cu material, and nickel [5,6,24].
Table 3.
Thermal and physical properties of CuCrZr alloy [5].
Table 4.
Mechanical properties of CuCrZr alloy [5].
Table 5.
Physical properties of electrodeposited OFHC Cu [24].
Table 6.
Mechanical properties of the electrodeposited OFHC Cu [24].
Table 7.
Physical properties of the electrodeposited nickel as reported in [24].
Table 8.
Mechanical properties of the electrodeposited nickel as reported in [24].
The active cooling procedure requires the presence of different pressure levels in the cooling channels and the combustion chambers. In this work, 5 MPa and 12 MPa were considered for the hot gas region and the cooling region respectively. Although variations of these values are expected during the actual operating conditions, these values were considered as constant during time and spatially uniform, in a conservative perspective. Figure 6 shows the FEM boundary conditions considered thermally and structurally. Combustion gases pressure, coolant temperature and their respective heat transfer coefficients (considered as variable along the chamber axis) were carried out by computational fluid dynamics (CFD) analyses [25,26]. Dashed lines in Figure 6b represent the heat transfer coefficients and temperatures applied as local model boundary conditions for the thermal analyses. Natural convection was assumed for the closeout structure external surface. Displacement and temperature boundary conditions applied to the cut surfaces were retrieved according to the results of thermal and structural analyses performed on the global model. Initial temperature was set to 293 K.
Heat transfer coefficients and temperatures considered for purging and relaxation phases are listed in Table 9, according to the literature [27].
Table 9.
Input data for the thermal analysis.
FEM model used for both thermal and structural analyses (Figure 7) was set up after conducting a grid convergence analysis, reported in previous works [5,6].
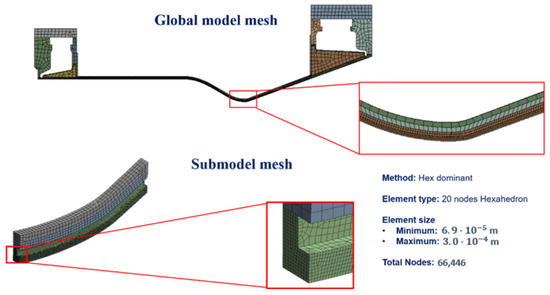
Figure 7.
Adopted FEM mesh, as obtained from convergence analysis [5,6].
4. Thermostructural Cycle Description
Each operative cycle of the liquid rocket engine can be considered as a single thermostructural loading-unloading cycle. This latter can be broadly subdivided into four consecutive steps (Figure 8):
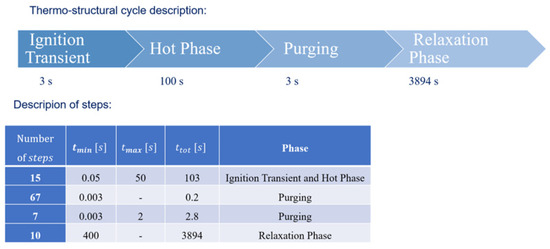
Figure 8.
Thermo-structural cycle description [5].
- an ignition transient phase elapsing 3 s in which the activation of the thermal combustion occurs,
- a hot phase with duration of 100 s corresponding to the combustion,
- a purging phase with duration of 3 s, during which liquid oxygen is injected inside the channels to eliminate any waste produced during the combustion process,
- a relaxation phase, lasting around 4000 s, to recover the chamber temperature back to room temperature and consisting of natural convection only.
Appropriate time step sizes were defined. After that, a preliminary convergence analysis was carried out in [5].
Creep can be considered as of relevance during ignition and hot phases only, namely those events where the maximum values of temperature are expected. With reference to previous research [5,6], this represented a further refinement if considering that creep was considered as activated during the hot phase only.
In Figure 8, the phases composing the simulated thermo-mechanical load cycle are reported.
Heat convective transfer coefficients and pressures were considered as null in the thrust chamber during the purging and relaxation phases, because there is no combustion. When the combustion occurs, i.e., during the ignition and hot phase, chamber pressures and convective heat fluxes are considered on the inner surfaces.
In order to account for the different damaging phenomena involved the linear uncoupled cumulative life prediction model adopted is the same as in [5,6]. In summary, a total usage factor is evaluated summing the effects of creep, fatigue and ratcheting.
The computation time requested to perform a thermostructural global-local analysis with 25 loading cycles was 16 h, using an Intel Xeon Gold processor with 4 cores (the remaining 18 cores available were not active during the calculation due to license restrictions) and 3 GHz, RAM of 190 GB and an SSD storage system of 1 TB.
5. Results and Discussions
The main results of the thermal–mechanical analyses conducted on the throat region are summarized in this Section. Figure 9 shows the location of the node where the maximum equivalent plastic strains after 16 cycles were detected.
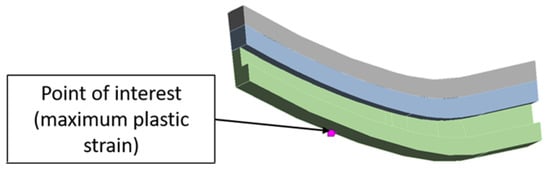
Figure 9.
Location of the node with the maximum equivalent plastic strain value.
Figure 10 shows temperature variations during the first cycle for two points, A and B; the former lies in the internal surfaces of the thrust chamber (nearby the point of interest), directly in contact with combustion gases, the latter lies in the same tangential and axial position of the former point, but it is in contact with cooling fluid. It is clear that transient phases are very short and steady-state temperature values (550 K for the point of interest) are reached in less than a tenth of a second; moreover, the temperature difference during the hot phase between point A and point B is about 160 K, generating, then, a significant thermal gradient in the ligament, whose thickness is equal to 0.9 mm. On the contrary, the temperature difference during the purging phase rapidly tends to very small values since combustion heat fluxes are switched off.
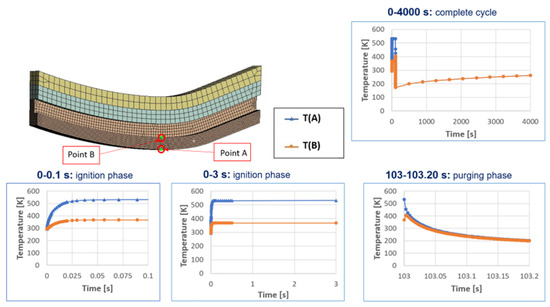
Figure 10.
Temperature evolution during the thermomechanical cycle for point A and point B.
Temperature contour plots of the most interesting portion of the cooling channel, namely the copper alloy part, which encounters highest thermal gradients and plastic strains, are shown in Figure 11, together with the corresponding Von Mises stresses. It is clear that the steady state temperatures are reached only 0.3 s after the beginning of the ignition phase. A similar result is obtained in the purging phase since the associated heat transfer coefficients are very high.
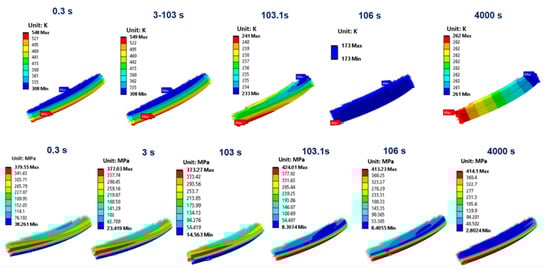
Figure 11.
Temperature and von Mises contour plots at the most significant time instants of the first cycle.
Figure 12 shows the evolution of the circumferential stresses vs. the circumferential plastic strain for the first three cycles, highlighting with different colors the thermo-mechanical loading cycle phases. It is worth noting that, during the relaxation phase, the increase in the circumferential stresses and plastic strain continues. Furthermore, the ligament circumferential stresses in the hot phase remain compressive up to the end of the creep period. Then, temperature and stress values during the hot phase, are such that creep damage can be considered as negligible, as demonstrated in [28], where stress-time curves are reported for temperature values higher than those encountered in the present test case. Therefore, no creep failure predictions were needed for the life assessment. On the contrary, creep failure can become dominant when higher thrust levels are required. From Figure 12 it is also evident that the hysteresis cycle becomes stabilized after the first cycle, apart from a continuous drift related to the ratcheting phenomenon.
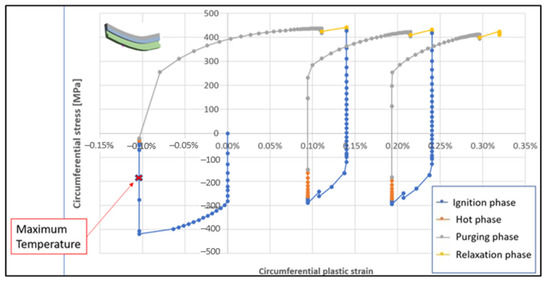
Figure 12.
Circumferential stress vs. circumferential plastic strain for the point of interest along the first three loading cycles.
Another interesting result can be detected in Figure 13 where the circumferential stress at the beginning and at the end of the creep phase, namely at the start of the ignition phase and at the end of the hot stage, are shown: it is clear that the effects of material softening cause a decrease of the circumferential stress at the beginning of the ignition stage, while the effects of creep remain almost constant especially from the 6th cycle up to the 36th cycles as the circumferential stress difference between the beginning and the end of the creep stage remain quite the same (see blue and orange curves in Figure 13).
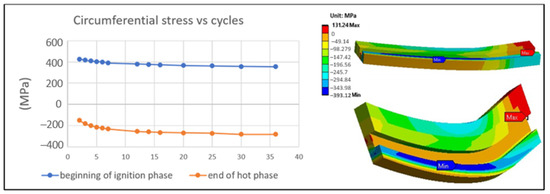
Figure 13.
Circumferential stress at the end and beginning of the hot phase (left). Circumferential stress contour plot at the end of the hot phase (right).
As demonstrated in previous works, the circumferential stresses and strain are the most critical for the present application [5,6]. Figure 14 shows the evolution of the circumferential stresses with respect to the circumferential plastic strain for the selected point of interest for all the simulated cycles. As expected, peak tensile stress values, occurring during the purging phase, decrease cycle after cycle as a consequence of the softening occurring on the precipitation hardened copper alloy. Then, the CuCrZr softening is responsible for the ratcheting behavior of the cooling channel since the tensile yield stress decreases with the number of cycles.
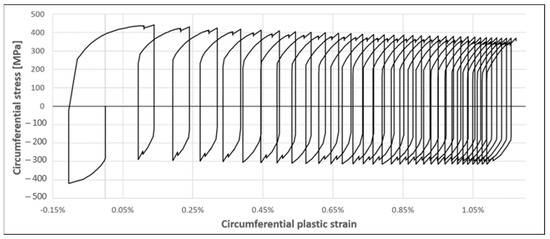
Figure 14.
Circumferential stress vs. circumferential plastic strain (35 cycles).
Thermal ratcheting behavior can also be detected observing the equivalent plastic strain variation with time (see Figure 15); In fact, it is clear that after 25–30 cycles the slope of the equivalent plastic strain curve remain constant, then a couple of different extrapolations are attempted to forecast the number of cycles needed to reach a plastic strain equal to 2.5%.
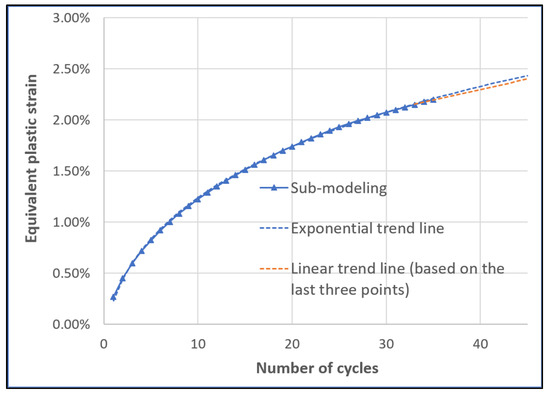
Figure 15.
Equivalent plastic strain vs. number of cycles (10 cycles extrapolation).
Finally, fatigue evaluations have been conducted using the commercial code ncode DesignLife, which works in the post-processing phase, namely after the solution of the non-linear structural analyses, by processing the calculated stress and strain field adopting the SWT and WB methods.
Using both SWT and WB methods, an evaluation of the cumulative fatigue damage for the first three cycles was carried out (Figure 16), by means of the following relationship:
where , and represent the number of cycles to failure corresponding to the first, the second or the third cycle, respectively.
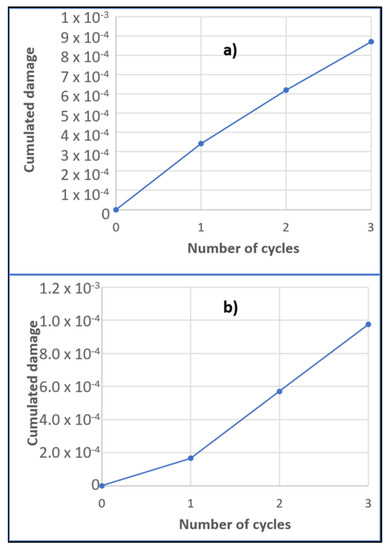
Figure 16.
Cumulated damage for the SWT method (a), and for the WB method (b).
The corresponding thrust chamber fatigue life , evaluated considering only the first three cycles (Equation (7)), adopting the SWT and the WB methods, are respectively 3984 and 2475 cycles:
Figure 17 shows the service life contour plot obtained with the SWT and WB methods. It is clear that the WB method is more conservative. Non-proportional loading effects, considered in the WB method, turn out to be negligible. In fact, a very small non-proportional loading factor, equal to 0.002, was estimated (usually non-proportional loading becomes significant for a factor greater than 0.25). This result is consistent with the results obtained in [5,6], where it was demonstrated that the curve representing the variation in the circumferential stress vs. the axial stress (load path) was very close to a straight line passing through the origin. The definition of the non-proportional loading factor can be found in the ncode Design Life theory guide [29]. On the other hand, since the biaxiality ratio is equal to 0.45, multiaxiality has significant effects on the thrust chamber service life.
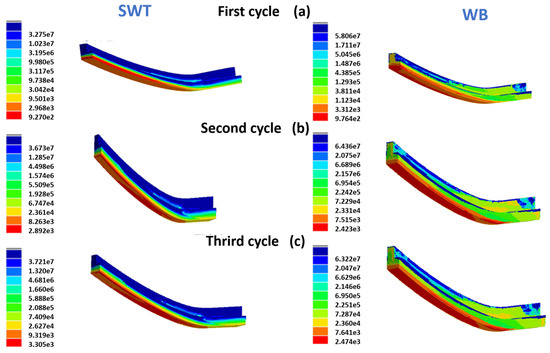
Figure 17.
Service life for the SWT (left) and WB methods (right): (a) first cycle (N1), (b) second cycle (N2), (c) third cycle (N3).
6. Conclusions
A numerical simulation of the thrust chamber of a liquid rocket engine adopting state of the art plasticity and creep numerical models was reported in this work. Global/local sub-modelling approaches were employed to focus on the most critical part of the chamber, i.e., the throat region where the maximum heat fluxes generated by the combustion gases were recorded.
With respect to previous works by the authors, a precipitation hardened copper alloy was considered; furthermore, the Voce non-linear isotropic hardening model and the WB fatigue criterion were used to evaluate the thrust chamber service life.
Results have shown that thermal ratcheting represents the main cause of failure of the chamber, as plastic strains in the cooling channel made of the copper alloy do not stop increasing. LCF can be considered as a secondary cause of failure, with the WB results more conservative than those of the SWT, i.e., 3984 and 2475 cycles respectively.
Although no experimental fire tests were conducted on the examined thrust chamber at the present time, the numerical results can be considered as consistent with the results and the experimental tests carried out on very similar thrust chambers. As a matter of fact, location and extension of the most damaged areas observed experimentally were very similar to those numerically obtained here.
As a future activity, the authors are implementing a damage model considering ductile, creep and damage effects.
Author Contributions
Conceptualization, M.F., E.A. and R.C.; Data curation, M.F., V.G. and R.C.; Investigation, M.F., E.A. and R.C.; Writing—original draft, M.F. and R.C.; Writing—review and editing, M.F., V.G. and R.C. All authors have read and agreed to the published version of the manuscript.
Funding
This research received no external funding.
Data Availability Statement
Not applicable.
Conflicts of Interest
The authors declare no conflict of interest.
References
- Hannum, N.P.; Kasper, H.J.; Pavli, A.J. Some effects of thermal-cycle induced deformation in rocket thrust chambers. In Proceedings of the AIAA/SAE 12th Propulsion Conference, Palo Alto, CA, USA, 26–29 July 1976; pp. 76–685. [Google Scholar]
- Quentmeyer, R.J. Experimental fatigue life investigation of cylindrical thrust chambers. In Proceedings of the AIAA/SAE 13th Propulsion Conference, Orlando, FL, USA, 11–13 July 1977; pp. 77–893. [Google Scholar]
- Gernoth, A.; Riccius, J.R.; Haidn, O.J. TMF panel tests: Close-to-reality simulation of thermo-mechanical fatigue processes in heat-loaded walls. In Proceedings of the AIAA/ASME/SAE/ASEE 44th Joint Propulsion Conference, Hartford, CT, USA, 21–23 July 2008. [Google Scholar]
- Arya, V.K.; Halford, G.R. Finite Element Analysis of Structural Engineering Problems Using a Viscoplastic Model Incorporating Two Back Stresses; TM-106046; NASA: Washington, DC, USA, 1993. [Google Scholar]
- Citarella, R.; Ferraiuolo, M.; Perrella, M.; Giannella, V. Thermostructural Numerical Analysis of the Thrust Chamber of a Liquid Propellant Rocket Engine. Materials 2022, 15, 5427. [Google Scholar] [CrossRef] [PubMed]
- Ferraiuolo, M.; Perrella, M.; Giannella, V.; Citarella, R. Thermal–Mechanical FEM Analyses of a Liquid Rocket Engines Thrust Chamber. Appl. Sci. 2022, 12, 3443. [Google Scholar] [CrossRef]
- Chaboche, J.L. A review of some plasticity and viscoplasticity constitutive theories. Int. J. Plast. 2008, 24, 1642–1693. [Google Scholar] [CrossRef]
- Asraff, A.K.; Sheela, S.; Paul, A.; Mathew, A.; Savithri, S. Cyclic stress analysis of a rocket engine thrust chamber using chaboche, voce and creep constitutive models. Trans. Indian Inst. Met. 2016, 69, 495–500. [Google Scholar] [CrossRef]
- Palma, M.D. Hardening parameters for modelling of CuCrZr and OFHC copper under cyclic loadings. In Proceedings of the 2013 IEEE 25th Symposium on Fusion Engineering (SOFE), San Francisco, CA, USA, 10–14 June 2013; pp. 1–5. [Google Scholar] [CrossRef]
- Song, J.; Sun, B. Thermal-structural analysis of regeneratively-cooled thrust chamber wall in reusable LOX/Methane rocket engines. Chin. J. Aeronaut. 2017, 30, 1043–1053. [Google Scholar] [CrossRef]
- Riccius, J.R.; Haidn, O.J.; Zametaev, E.B. Influence of time dependent effects on the estimated life time of liquid rocket combustion chamber walls. In Proceedings of the 40th AIAA/ASME/SAE/ASEE Joint Propulsion Conference and Exhibit, Fort Lauderdale, FL, USA, 11–14 July 2004. [Google Scholar]
- Thiede, R.G.; Riccius, J.R.; Reese, S. Life prediction of rocket combustion-chamber-type thermomechanical fatigue panels. J. Propuls. Power 2017, 33, 1529–1542. [Google Scholar] [CrossRef]
- Borja, R.I. Plasticity Modeling and Computation; Springer: Berlin/Heidelberg, Germany, 2013; p. 255. ISBN 9783642385476. [Google Scholar] [CrossRef]
- You, J.-H.; Miskiewicz, M. Material parameters of copper and CuCrZr alloy for cyclic plasticity at elevated temperatures. J. Nucl. Mater. 2008, 373, 269–274. [Google Scholar] [CrossRef]
- Broggiato, G.B.; Campana, F.; Cortese, L. The Chaboche nonlinear kinematic hardening model: Calibration methodology and validation. Meccanica 2008, 43, 115–124. [Google Scholar] [CrossRef]
- Araujo, M.C. Non-Linear Kinematic Hardening Model for Multiaxial Cyclic Plasticity. Master’s Thesis, Louisiana State University, Baton Rouge, LA, USA, 2002; p. 1650. Available online: https://digitalcommons.lsu.edu/gradschool_theses/1650 (accessed on 10 January 2023).
- Calì, C.; Cricrì, G.; Perrella, M. An advanced creep model allowing for hardening and damage effects. Strain 2010, 46, 347–357. [Google Scholar] [CrossRef]
- Golan, O.; Arbel, A.; Eliezer, D.; Moreno, D. The applicability of Norton’s creep power law and its modified version to a single-crystal superalloy type CMSX-2. Mater. Sci. Eng. A 1996, 216, 125–130. [Google Scholar] [CrossRef]
- Giannella, V.; Citarella, R.; Fellinger, J.; Esposito, R. LCF assessment on heat shield components of nuclear fusion experiment “Wendelstein 7-X” by critical plane criteria. Procedia Struct. Integr. 2018, 8, 318–331. [Google Scholar] [CrossRef]
- Li, G.; Thomas, B.J. Modeling Creep and Fatigue of Copper Alloys. Metall. Mater. Trans. A 2000, 31, 2491–2502. [Google Scholar] [CrossRef]
- Ferraiuolo, M.; Russo, V.; Vafai, K. A comparative study of refined and simplified thermo-viscoplastic modeling of a thrust chamber with regenerative cooling. Int. Commun. Heat Mass Transf. 2016, 78, 155–162. [Google Scholar] [CrossRef]
- Chen, H.; Shang, D.-G.; Tian, Y.-J.; Liu, J.-Z. Comparison of multiaxial fatigue damage models under variable amplitude loading. J. Mech. Sci. Technol. 2012, 26, 3439–3446. [Google Scholar] [CrossRef]
- Ferraiuolo, M.; Leo, M.; Citarella, R. On the Adoption of Global/Local Approaches for the Thermomechanical Analysis and Design of Liquid Rocket Engines. Appl. Sci. 2020, 10, 7664. [Google Scholar] [CrossRef]
- Esposito, J.J.; Zabora, R.F. Thrust Chamber Life Prediction. Volume 1: Mechanical and Physical Properties of High Performance Rocket Nozzle Materials; NASA-CR-134806, D180-18673-1-VOL-1; NASA: Washington, DC, USA, 1795. [Google Scholar]
- Ricci, D.; Battista, F.; Ferraiuolo, M.; Salvatore, V.; Fragiacomo, M. Methane Transcritical Behavior in the Cooling System of the HYPROB-BREAD LOX/LCH4 Demonstrator Rocket Engine. In Proceedings of the ASME 2015 International Mechanical Engineering Congress and Exposition, Houston, TX, USA, 13–19 November 2015. [Google Scholar] [CrossRef]
- Ricci, D.; Battista, F.; Fragiacomo, M. Transcritical Behavior of Methane in the Cooling Jacket of a Liquid-Oxygen/Liquid-Methane Rocket-Engine Demonstrator. Energies 2022, 15, 4190. [Google Scholar] [CrossRef]
- Masuoka, T.; Riccius, J.R. Life evaluation of a combustion chamber by thermomechanical fatigue panel tests based on a creep fatigue and ductile damage model. Int. J. Damage Mech. 2020, 29, 226–245. [Google Scholar] [CrossRef]
- Porowski, J.S.; O’Donnell, W.; Badlani, M.L.; Kasraie, B.; Kasper, H.J. Simplified design and life prediction of rocket thrust chambers. J. Spacecr. Rocket. 1985, 22, 181–187. [Google Scholar] [CrossRef]
- DesignLife Theory Guide 1, NC-DL-TH 9.00.092. Available online: www.ncode.com (accessed on 15 May 2022).


Disclaimer/Publisher’s Note: The statements, opinions and data contained in all publications are solely those of the individual author(s) and contributor(s) and not of MDPI and/or the editor(s). MDPI and/or the editor(s) disclaim responsibility for any injury to people or property resulting from any ideas, methods, instructions or products referred to in the content. |
© 2023 by the authors. Licensee MDPI, Basel, Switzerland. This article is an open access article distributed under the terms and conditions of the Creative Commons Attribution (CC BY) license (https://creativecommons.org/licenses/by/4.0/).