Article

Kinetics of Martensite Decomposition and Microstructure Stability of Ti-6246 during Rapid Heating to Service Temperatures

1
Institute of Applied Materials (IAM-WK), Karlsruhe Institute of Technology (KIT), Engelbert-Arnold-Str. 4, D-76131 Karlsruhe, Germany
2
Institute of Materials Physics, Helmholtz-Zentrum Hereon, Max-Planck-Str. 1, D-21502 Geesthacht, Germany
3
Heinz Maier-Leibnitz Center (MLZ), Technical University of Munich, Lichtenberg Str. 1, D-85748 Garching, Germany
*
Author to whom correspondence should be addressed.
Metals 2023, 13(3), 484; https://doi.org/10.3390/met13030484
Submission received: 18 January 2023 / Revised: 22 February 2023 / Accepted: 23 February 2023 / Published: 26 February 2023

Abstract

:
The aerospace alloy Ti-6246 was subjected to inductive heat treatments with high heating and quenching rates (up to 1500 K/s) while being applied to an in situ diffraction study at the HEMS beamline P07B at DESY. Thereby, the characterization of the emerging phases was possible at any point in the process. The heat treatment schedules include the preparation of Ti-6246 samples by means of a homogenization treatment and subsequent quenching to trigger α″-martensite formation. In order to simulate fast reheating within the scope of application, the samples were reheated to the upper range of possible service temperatures (550–650 °C) with a heating rate of 100 K/s. In a second heat treatment design, the homogenized and quenched sample state was exposed to high-temperature tempering at 840 °C, which aims for the elimination of α″. Again, fast reheating to the same service temperatures was executed. With the aim of this approach, the stability of the microstructure consisting of α-Ti, β-Ti and α″-martensite was characterized. Further, the martensite decomposition path was analyzed. It shows a two-tier nature, firstly approaching the bcc β-unit cell in the low-temperature range (<400 °C) but subsequently transforming into an hcp-like unit cell and later on into equilibrium α-Ti.

1. Introduction

The dual phase α + β alloy Ti-6Al-2Sn-4Zr-6Mo (Ti-6246) has high industrial relevance due to its advantageous property profile that is, in brief, characterized by high specific strengths (even higher than that of Ti-6Al-4V) as well as moderate medium temperature strength up to 800 MPa at 399 °C, correlating with improved temperature endurance compared to Ti-6Al-4V [1,2,3,4]. Additionally, it shows good creep resistance, sufficient heat treatability by making use of solid-solution-strengthening and great corrosion resistance [2,5,6,7]. Altogether, this profile qualifies Ti-6246 for applications in high-performance automotive parts and further has admission for usage in oil and gas tubes as well as in maritime applications. Most relevant, however, is the application of Ti-6246 in the aerospace industry as fan blades in cold sections in compressors of gas turbines. There, it is exposed to temperatures up to 550 °C for long-term applications and even higher temperatures in the case of short-term applications [4,8,9].
In Ti-6246, the most common microstructure consists of the hexagonal-close-packed α- and the body-centered-cubic β-phase wherein α appears in globular and/or needle shapes and β builds the matrix. Via targeted heat treatments, the microstructure can be tuned starting from the adjustment of α- and β-morphology in terms of grain sizes and shapes as well as the triggering of martensitic transformations (MT) upon high quenching rates [10]. In Ti-6246, MT are generally expected in the form of the orthorhombic α″-martensite (Table 1) due to the molybdenum content of 6 wt.% (Moeq = 6 wt.%) [10].
Historically, martensitic transformations have already been proven to occur in Ti-6246 in the 1970s and 1990s by laboratory X-Ray diffraction (XRD) analysis, which limited the analysis to room temperature (R.T.) sample states and hence was not appropriate in covering transformation kinetics. In such a way, specific characteristics like the martensite start temperature ( M S ) were approximated but the results scatter widely from 550 °C to 880 °C [10,11,12]. Despite further developments in fast in situ XRD analyses to monitor heat treatment processes, merely a few small-scale studies were conducted on Ti-6246 in the past and thus little knowledge was gained in this regard. Moreover, the majority of the studies on martensitic Ti-phases are presently performed on highly β-stabilized alloys such as binary Ti-Nb or Ti-Mo [13,14,15,16,17]. When more complex alloying systems are investigated, the workhorse Ti-6Al-4V [18,19] regularly comes into play as well as further Ti-Al-V alloys with only a slight addition of Mo, Sn [20] and highly stabilized Ti-Nb-Sn [21] among others. Luckily, many concepts of binary alloys can be transferred to Ti-6246 in broad outline if the Moeq roughly match.
From the application-related point of view, MT are predominantly rated as critical since they contribute to materials softening in spite of the grain refinement effect rather than the expected hardening [11,12,22]. This becomes relevant in processes with high cooling rates such as welding techniques and additive manufacturing. For the latter, a few studies are available dealing with Ti-6246 microstructures after additive manufacturing and postprocessing. Carrozza et al., e.g., studied Ti-6246 samples processed by Laser Powder Bed Fusion (LPBF) with solidification rates of 105 to 107 °C/s) [22]. A fully martensitic (α″) microstructure was found in the as-built version with specifically oriented, elongated martensite needles. A subsequent heat treatment at 750 °C for 2 h adjusted the microstructure to an α + β assemblage. The mechanical properties were tested by tensile testing and the yield strength was found to increase by a factor of ~2 compared to the as-built state due to the elimination of α″-martensite [22]. The understanding of the decomposition path during reheating of α″-martensite is therefore an interesting and essential aspect in Ti-6246.
For binary Ti-Nb alloys, the decomposition path has been examined over the last few years. Bönisch et al. [13,14,15] set their focus on the distinction of diffusive and diffusionless transformations in the decomposition path of α″-martensite and were able to give specific data on the anisotropy of thermal expansion. Demakov et al. [16] expanded these investigations and invented a novel model for the unique characterization of martensite crystal structure and facilitated the inter-alloy comparison. Comprehensive investigations for Ti-6246 focusing on the stability and the decomposition of martensite during heating to temperatures corresponding to possible service temperatures in the upper application regime (~550–650 °C) and elevated temperatures approaching the M S (~840–880 °C) are lacking. In particular, no data exist addressing the martensite stability during fast reheating.
In order to address this gap in information, inductive heat treatments with very high cooling rates were performed via dilatometry in combination with in situ high energy X-ray diffraction. The heat treatments were performed using a homogenization treatment in the β-phase field at 970 °C followed by fast quenching to generate a martensitic microstructure. Subsequently, a tempering step was introduced with fast heating rates of 100 K/s in order to imitate re-heating of a component to service temperatures and to elevated temperatures. In the former case, three temperatures (550, 600 and 650 °C) were used covering short-term and long-term applications. In the latter case, a high-temperature tempering at 840 °C was introduced in order to intentionally eliminate α″-martensite prior to re-heating to the chosen high application temperatures. It is expected that this treatment step strongly influences α″-martensite, not least because this tempering step is executed slightly below the M S of ~880 °C as proposed by Stella et al. [11]. Subsequently, the expected martensite-free sample was also reheated to service temperature (600 °C). Through this approach, the microstructural evolution of martensitic sample states during fast reheating can be studied, covering a broad span of possible application and manufacturing scenarios, as, e.g., the use of L-PBF manufactured Ti-6246 parts, which are martensitic after processing and might be quickly heated up under service conditions to rather high application temperatures.
Firstly, the Ti-6246 samples were characterized within an “ex situ” part of this study in terms of the R.T. microstructure subsequent to each treatment step. Further, with the help of in situ synchrotron X-ray diffraction analysis, detailed statements about the present phases, the crystal structure as well as the transformation pathways and kinetics are viable at any point in the process. This procedure allows the determination of exact transformation temperatures as, e.g., the martensite decomposition temperature. Especially in the case of fast running processes, dilatometry, i.e., dilatometry in combination with high-energy X-ray diffraction analysis, is the method of choice, since it provides a finely controlled process flow with wide-ranging options in a stable environment and is a well-established procedure [23,24]. It further combines the integral view of dilatometry over the entire sample length with the local view of in situ X-ray diffraction into the areas of special interest.
Within the present study, these techniques were used for the data acquisition for Ti-6264. Regarding the analysis of martensite transformation, kinetics and crystal structure characterization, some studies served as guides [13,15,16]. Concerning data analysis and interpretation, the latter study by Demakov et al. [16] expanded the standardized determination of the lattice parameter development with a new crystal-structure-based model. This model allows the unique identification of the transformation status along the b.c.c.-Cmcm-h.c.p. pathway by breaking down the whole crystal structure to an atom configuration of three atoms in layer A and one atom in layer B, which form a tetrahedron [16]. This procedure was firstly transferred from highly β-stabilized titanium alloys to Ti-6246 in order to give information about whether the martensite decomposition paths are comparable.

2. Materials and Methods

2.1. Material and Sample Preparation

Ti-6246 was provided as ø14 mm rod material by Henschel KG, Munich, Germany, in the solution-treated and aged condition. EDX (energy dispersive X-ray spectroscopy) revealed an actual composition of about 82.9% Ti, 5.8% Mo, 5.4% Al, 3.8% Zr and 2.0% Sn. The rod material was processed into hollow dilatometry-samples (Ø 10 mm × length 4 mm × wall thickness 0.5 mm) by turning and drilling.

2.2. Heat Treatment Schedules

All heat treatments were performed by a modified quenching and forming dilatometer (DIL 805, TA Instruments, New Castle, DE, USA). In all cases, the first stage—a homogenization treatment (H + Q)—was performed at 970 °C for 600 s (cf. Figure 1 and Table 2). For the treatments, the reheating (T) was executed in accordance with application temperatures and process descriptions of present studies [11]: three target temperatures (550 °C (D_970_550); 600 °C (D_970_600); 650 °C (D_970_650)) with a duration of 600 s. The martensite-free sample was produced via high-temperature tempering (T1) at 840 °C for 30 s before being reheated to 600 °C for a duration of 120 s (T2, Table 2). The shorter holding period was chosen since in the previous experiment it was noticed that no significant microstructural change occurs after 2 min. at 600 °C. For each experiment, the heating rate was set to 100 K/s and the cooling rate to a maximum that could be realized with the set-up, which corresponds to ~1000–1600 K/s. Protective atmosphere (He) was used to reduce oxidation of the sample surface.

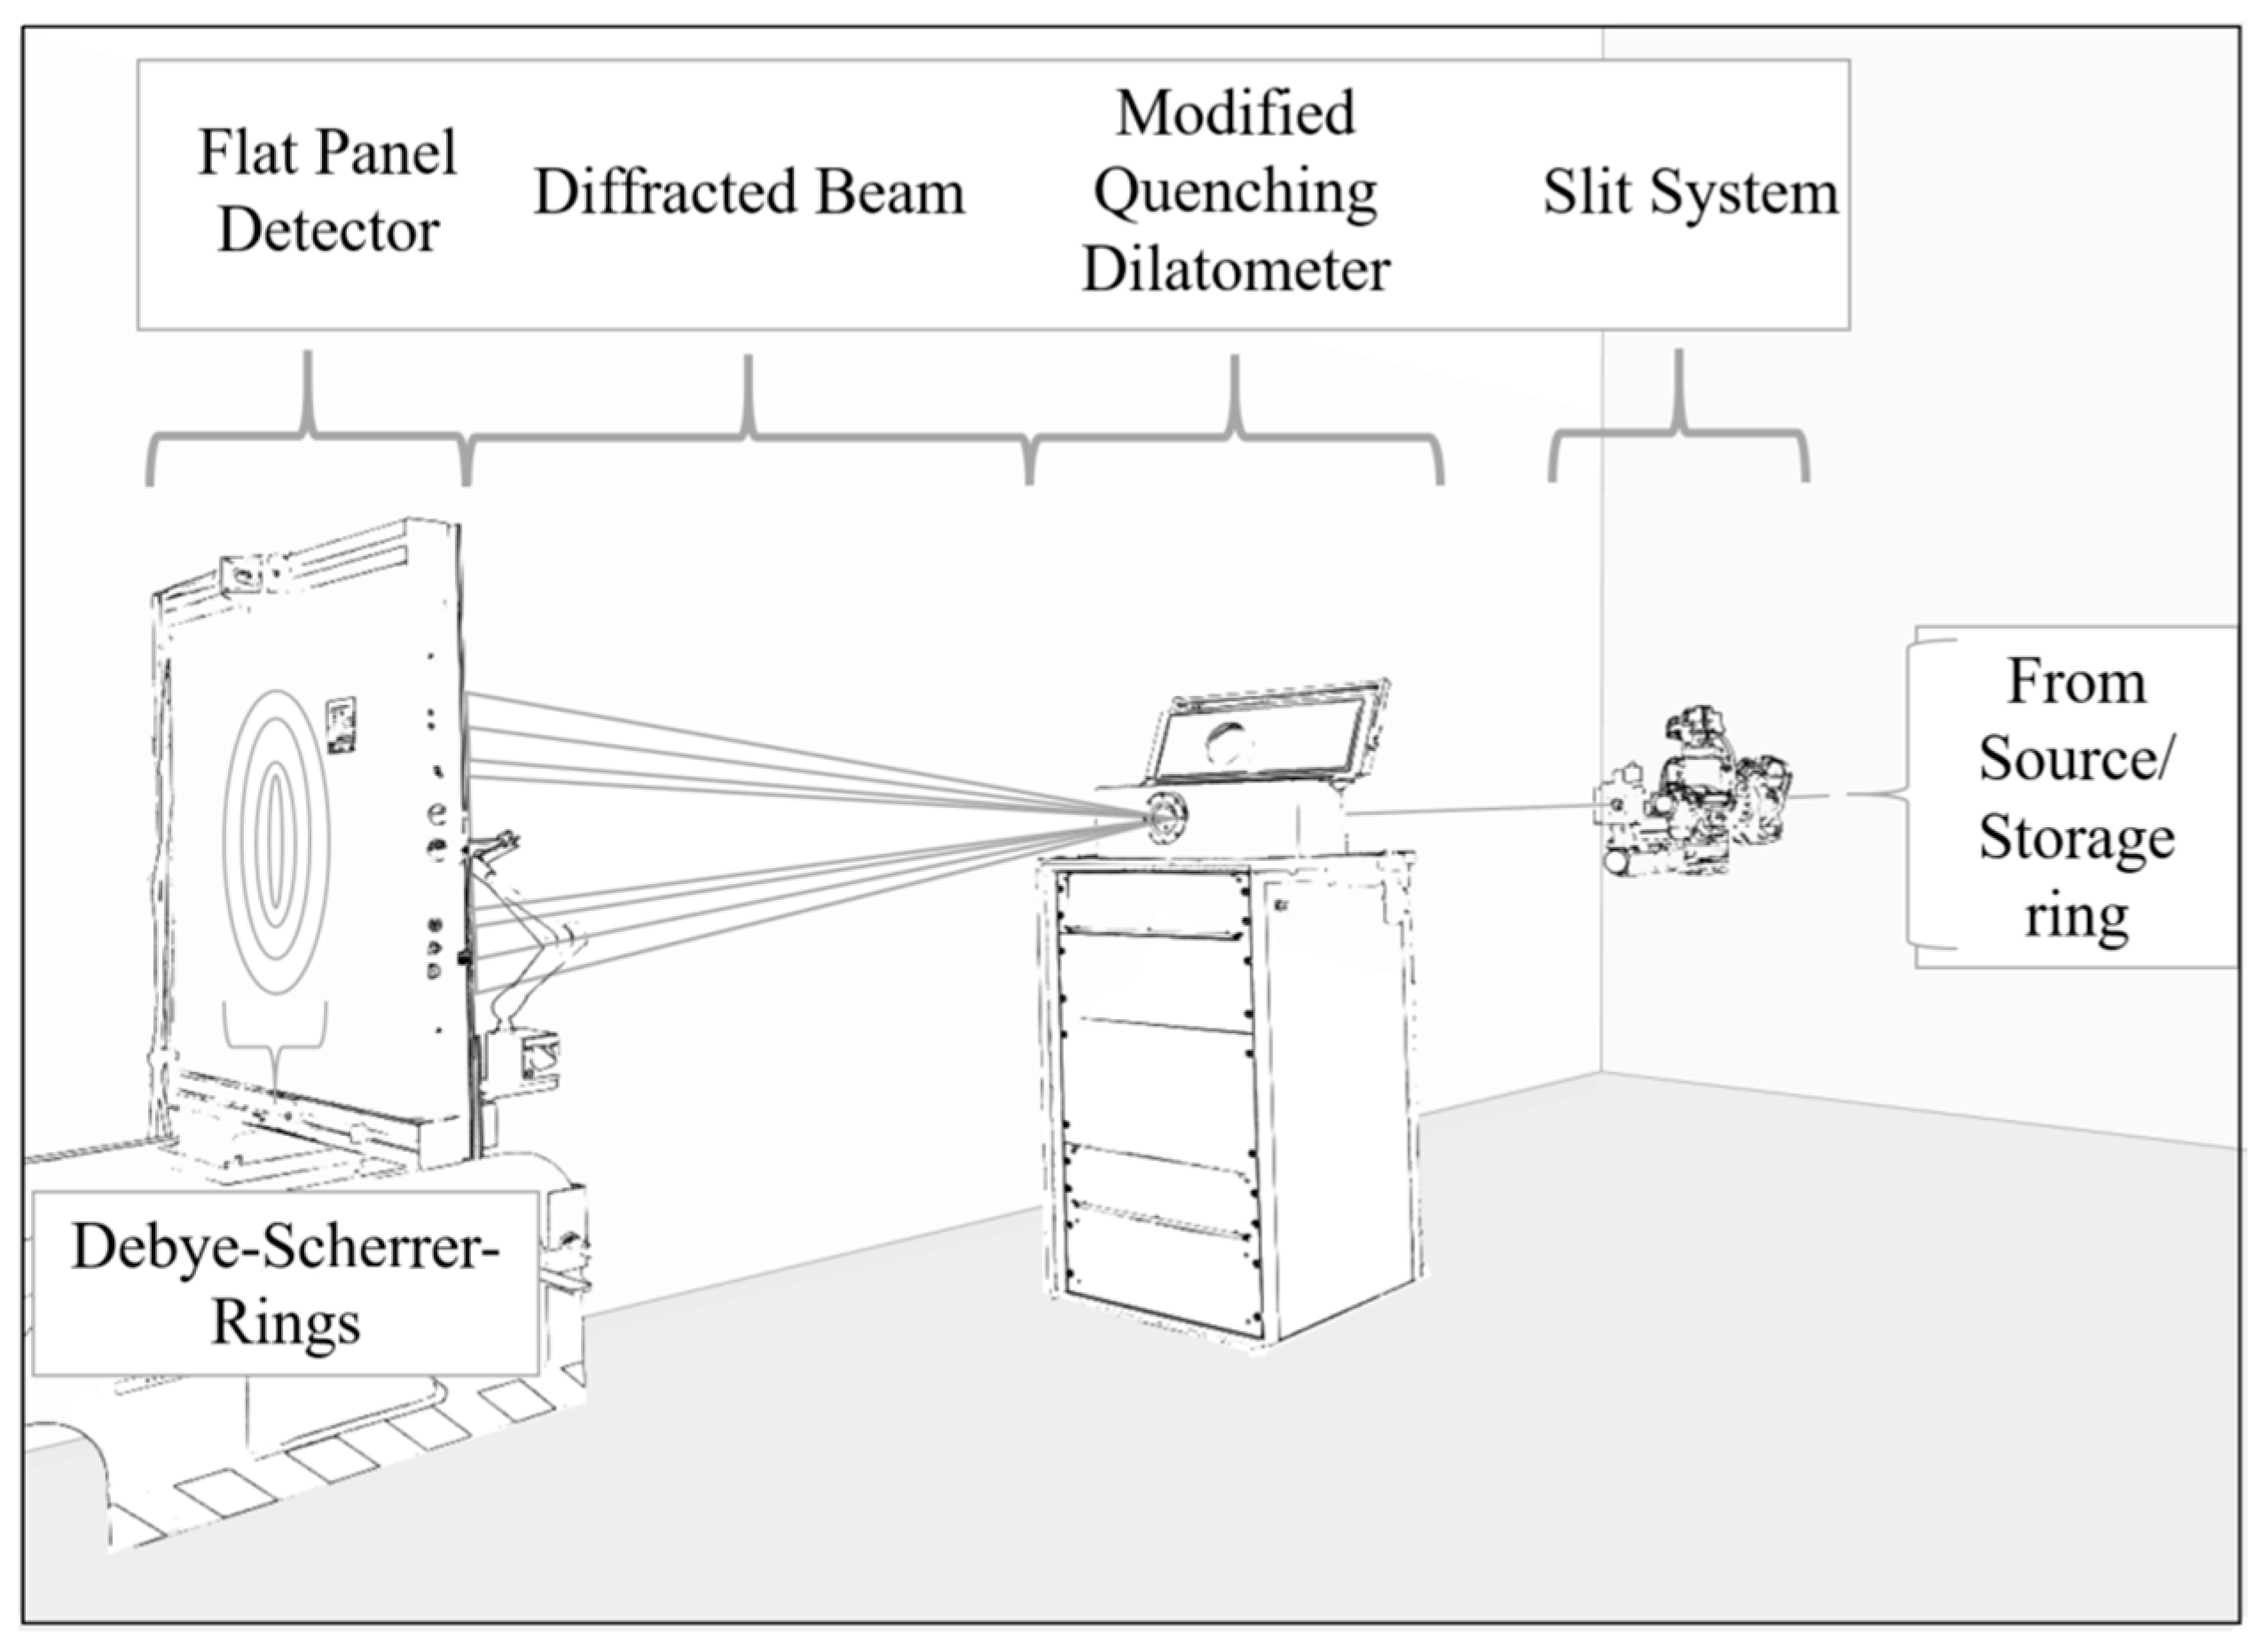
2.3. In Situ Data Acquisition

The in situ heat treatments were performed using the monochromatic beam (size: 1 mm × 1 mm) of the High Energy Materials Science (HEMS) side station P07B at PETRA III (DESY) in transmission geometry with a photon energy of 87.1 keV (Figure 2). Debye–Scherrer rings (2θ-range: 0–9°) were detected by a 2D-image detector (Perkin Elmer XRD 1621 Flat Panel, 2048 × 2048 pixels2 at 200 × 200 µm2). The measuring rate was defined using scripts for (i) heating and cooling sections programmed in fast mode (with a rate of 10 Hz) and (ii) all other sections in slow mode (0.3 Hz).

2.4. In Situ Data Post-Processing and Analyses

Synchrotron X-ray diffraction data of all experiments incl. calibration measurements using LaB6-powder as reference material were post-processed via the software Fit2D (ESRF, Grenoble, France) for data reduction. Additionally, the LaB6 reference data were used to create an instrument profile for an advanced Rietveld analysis. This mathematical model was applied using the open-source software package GSAS-II (UChicago Argonne, LLC, Chicago, IL, USA) [26]. The Rietveld approach performs the calculation of the phase fractions based on the input parameters—such as the expected phase constitution—unobstructed whether the assumptions correspond to the phase constitution that is actually present. Therefore, it is, unfortunately, error-prone, especially in the following cases: (i) high superposition of interference lines of the included phases, (ii) the refinement is performed in batch mode without detailed investigation of the results and (iii) the phase constitution drastically changes (e.g., one phase decomposes and is not eliminated manually).
Keeping these in perspective, an R.T. diffractogram of the H + Q (=martensitic) sample state was thoroughly analyzed regarding the 2θ peak position of each phase in order to ascertain the crystal structure (in particular the R.T. lattice parameter) for the Ti-6246 alloying system for α- and β-phase as well as α″-martensite. This allowed the refinement to be altogether more rapid. For the present study, firstly, all R.T and all high temperature data were analyzed for a process overview. Specific process cut-outs of the heating section were analyzed in detail in order to characterize the phase transformations and lattice parameter evolution. At this point, a Rietveld-based evaluation is only possible by means of a sequential refinement (=batch mode). The sequential refinements were systematically performed in three subsequent steps: (i) refinement of lattice parameters and phase fractions for all phases, (ii) refinement of texture as an additional fit parameter (spherical harmonics of order 6) and phase fraction for all phases and finally, (iii) refinement of the microstrain (as an additional parameter for peak fitting without analytical relevance) for α″-martensite and phase fractions for all phases. In the evaluation of the XRD data, the results of manual and sequential refinements are compared and discussed. Section 3.2.1 as well as Section 3.2.2 address this aspect.

2.5. Characterization of Microstructural Properties

Microstructural investigations were performed subsequently to standardized and non-caustic metallographic sample preparation. The initial sample state (Figure 3) as well as the intermediate and final states of the heat-treated samples (Figure 4) were characterized as follows: The microstructure was investigated by scanning electron microscopy (SEM) using a SEM of type LEO Gemini 1530 (Carl Zeiss AG, Oberkochen, Germany) with a field emission gun as the source. Images were taken using the BSE mode (backscattered electron imaging) and an acceleration voltage of 10 kV, a working distance WD ≈ 4 mm and an aperture size of 120 μm.

3. Results and Discussion

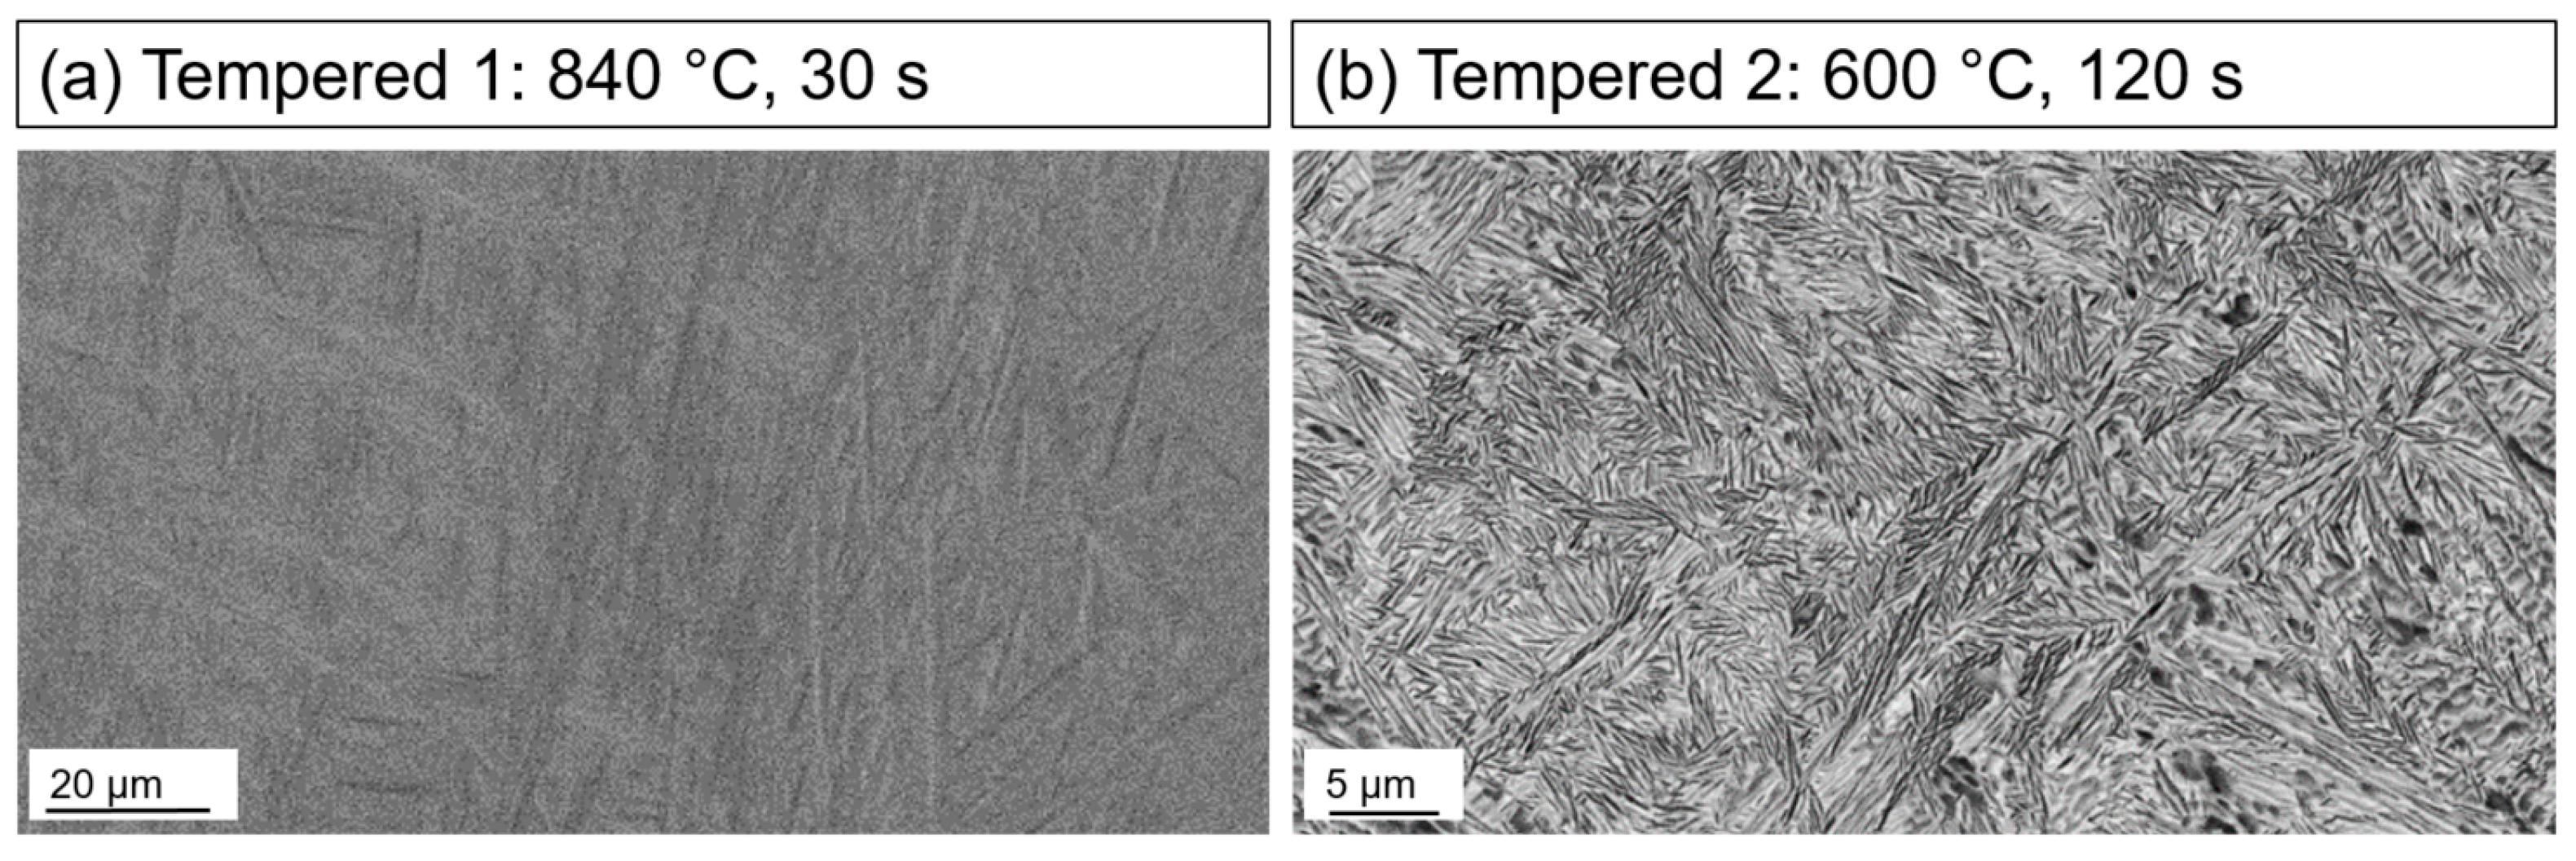
3.1. Ex Situ Microstructural Characterization

The initial microstructure (Figure 3) shows a bimodal arrangement of relatively large globular grains corresponding to the primary alpha (αp) and needle-like secondary alpha (αs) in a matrix of β-phase. The BSE image reveals the chemical inhomogeneity according to the elements’ α- or β-stabilization property. Aluminum as a strong α-stabilizer and a very light atom has a low ability to interact with incident electrons and, ultimately, less intensity can be detected. Consequently, areas with high Al content appear dark in the BSE image. On that basis, atoms with higher atomic numbers (=heavier atoms) such as Mo appear light gray and correspond to the β-phase. The micrographs further show a slight alignment of globular grains in the direction of extrusion and hints of residual deformation inside the primary alpha due to the shading inside the single grains. α and β-phase are present in an equilibrium constitution of approx. 78 vol.% hexagonal close-packed α-Ti and, accordingly, approx. 22 vol.% body-centered cubic β-Ti according to the in situ XRD data.
In the homogenized and quenched microstructure (Figure 4a, H + Q), this contrast is very attenuated or even absent. The microstructure thus appears with a rather low grayscale contrast. Instead, the grayscale differences originate from different orientations of the grains (orientation contrast). Morphologically, the microstructure consists of very fine needles, which can be divided into two size categories. The larger needles show length in the low, single-digit micrometer range while the small needles are on a much smaller scale. The parent β-grains and grain boundaries can be easily recognized by clear grayscale deviation over the whole grain (Figure 4a, overview and red-framed insert). In this image, another feature is visible: within a lamella, fine plate-like/stripped structures exist. Based on the investigations of X. Ji et al. [27], these structures are identified as internal twins, which may originate from strain-accommodation processes. Solely based on the contrast of the micrographs, it is not possible to distinguish between parent beta and martensite. A detailed phase characterization by XRD is given in Section 3.2.
The tempered microstructures show a generally similar and lamellar structure (Figure 4b). Again, within a lamella, twin structures are observable, which can best be seen in the SEM image of the sample tempered at the lowest temperature of 550 °C. However, microscopic observation reveals deviations between the three treatment temperatures. For 500 °C, the microstructural changes may be the smallest. Considered independently, it is not self-explanatory whether the observed contrast originates from Z-contrast (contrast from grains including elements of specific atomic numbers Z) or from orientation contrast. The 600 °C sample shows diffuse, disordered areas within the needle structures. These may indicate α″ → α + β transformation on a very small scale—possibly depending on the local presence of α- or β-stabilizing elements trapped in the former, fine martensite lamellae. P. Barriobero-Vila et al. [20] identified twins as nucleation sites for fine α-plates from which growth can continue subsequently along the twin boundary. Tempering at 650 °C enhanced the formation of larger α-needles as well as α-grains surrounding the former martensite needles. Additionally, clear β-grains can be distinguished by Z-contrast in the BSE images, which are located in interspaces between the parent lamellae. This is also in agreement with [20], who identified the boundaries of α″-plates as preferred β-nucleation sites. Having a closer look, very fine α-needles decorating the novel β-grains in a Widmanstätten structure can be detected. Unfortunately, preparation residues are present on the polished surface (exemplarily marked in the image). However, they deviate in form and size from the Ti-6246 microstructure features and can clearly be distinguished.
High-temperature tempering at 840 °C (T1 = martensite-free sample; cf. Table 2) causes a microstructure (Figure 5), which is similar but even more blurry than the H + Q state (Figure 4). Morphologically, the microstructure kept its fully lamellar and highly distorted shape. At this point, i.e., solely based on microstructure images, it cannot be determined if martensite elimination and prevention of its reformation during quenching as aimed in this study was successful.
During the final tempering (T2 = reheating to service temperature; cf. Table 2) process at 600 °C, the microstructure transformed into a clearly demarcated α + β microstructure, which strongly deviates from the microstructures achieved by reheating of the homogenized and quenched sample to moderate service temperatures. A near-equilibrium microstructure could be achieved, which does not show twins or atypical grain structures. Extremely small α-needles are visible, which partially seem to be parallel-oriented following the former needle pattern. Rarely, fine globular α-grains formed.

3.2. In Situ Characterization

In the following, the results of in situ characterization of heat treatment response of Ti-6246 by means of high-energy synchrotron X-ray diffraction are shown. The development of phase composition and phase fraction during the whole heat-treatment processes are shown. With respect to the quantitative analysis, some challenges in the analysis using Rietveld refinement emerged, which are important for the interpretation of the results. These challenges are first identified and their influence is estimated. Subsequently, a detailed view on the phase transformation behavior and the crystallography of α″-martensite during re-heating of the homogenized and quenched sample state is provided.

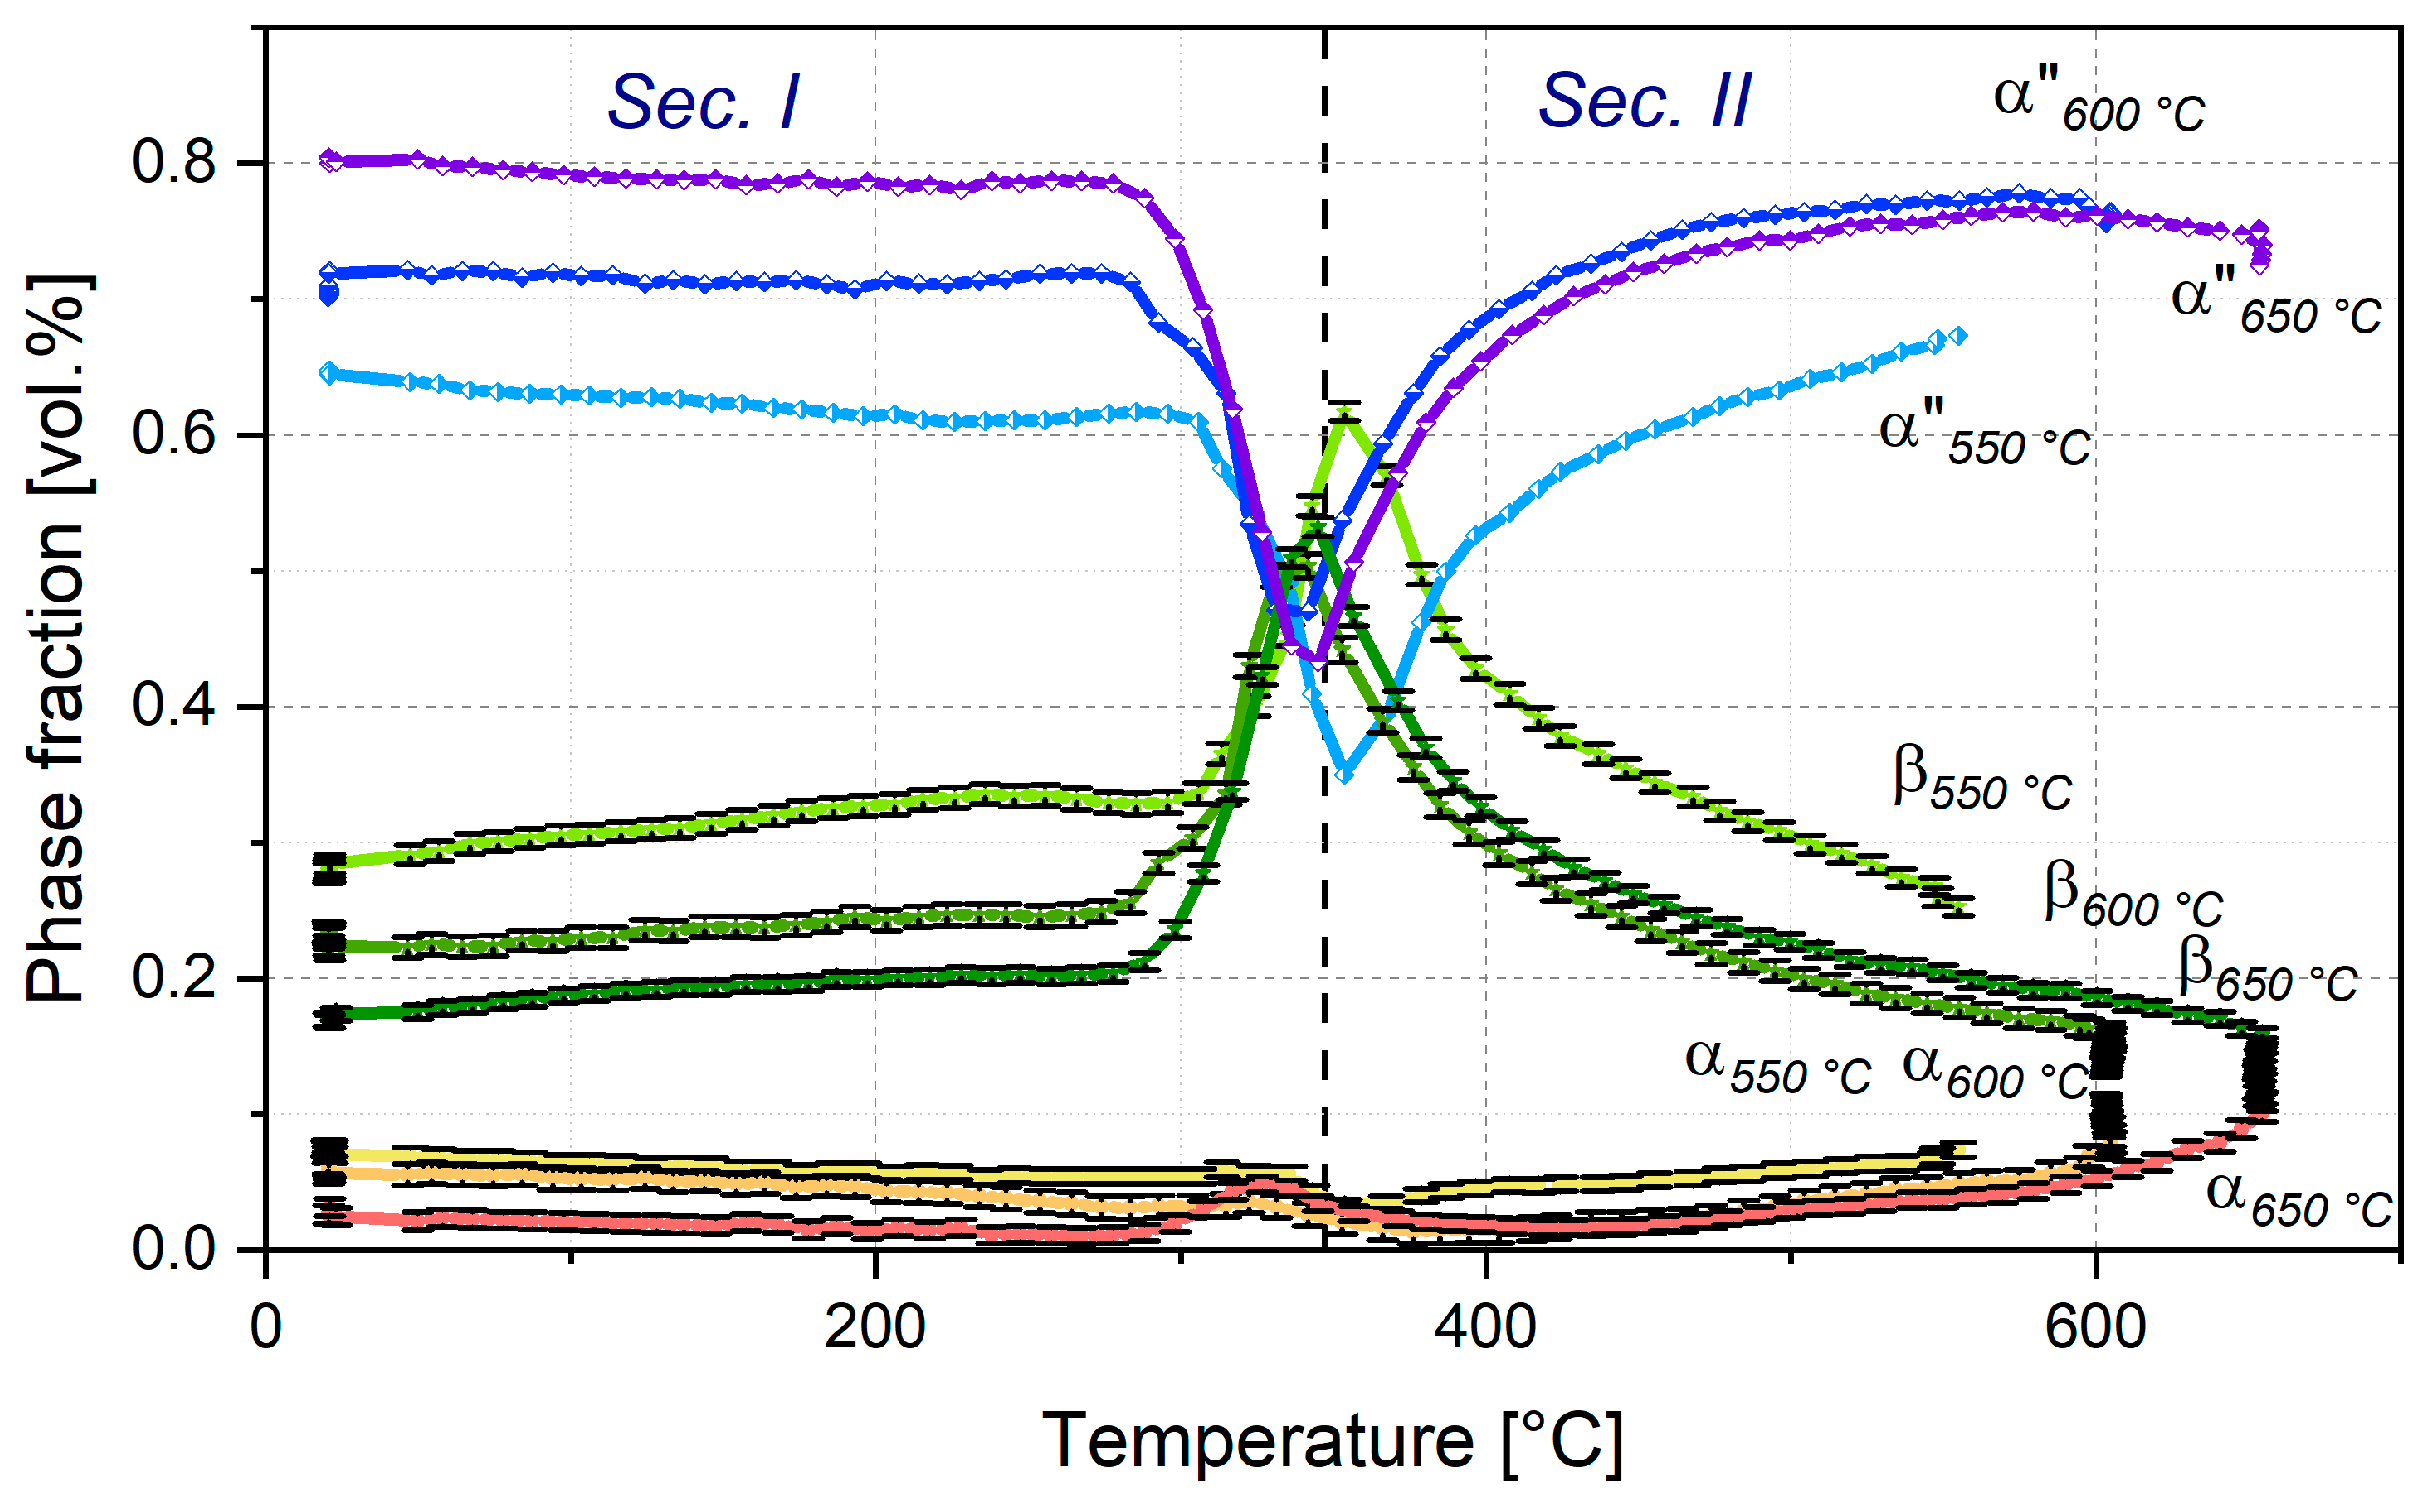
3.2.1. Evolution of Phase Fractions during Continuous Reheating to Service Temperature and Martensite Start Temperature

In the first step, diffractograms recorded in situ at R.T. and at high temperature during the holding stages of all treatment steps were analyzed, i.e., to monitor the changes in phase fractions, without considering the temporal evolution. For each holding stage, five diffractograms were averaged. Figure 6 shows the evolution of the averaged phase fraction of α- and β-phase as well as α″-martensite with the indication of the temperature profile. In all cases, the initial microstructure consisted of around 78 vol.% α-Ti and around 22 vol.% β-Ti. During rapid heating to homogenization temperature, a high fraction of α-phase of up to approx. 44 vol.% was already dissolved into β-Ti. After the holding time of 600 s, the amount of residual α-phase was determined to be approx. 2–10 vol.%. Regarding experiment D_970_600, the high temperature phase fractions could not be analyzed properly due to pronounced coarse grain effects.
In the post-quenched microstructure of all processes, a high fraction of approx. 57–77% orthorhombic α″-martensite could have formed from the β-phase during quenching. During heating to the respective tempering temperature, during tempering and during quenching, martensite gradually decomposed. However, in each final microstructure, residual α″-martensite was detected following the expected tendency that more martensite can be decomposed at higher temperatures.
The results shown in Figure 6 indicate that heating after homogenization is of particular interest, since the most relevant phase transformations take place then. Therefore, sequential refinements of all diffractograms recorded in this process section were performed and the results were visualized in dependence of the process temperature in Figure 7 to monitor the temporal evolution during fast reheating. It becomes apparent that two different sections can be distinguished. In brief, these sections are (i) martensite decomposition into β-Ti and (ii) martensite “re-formation”.
When examining Figure 7 systematically starting from low temperatures, some coherences in transformation paths of all three observed phases may be identified. In Section 1 of the diagram, a slight drop in the curve of α″-martensite is visible connected to a rise in the β-Ti phase fraction. Both progressions are strongly amplified at temperatures approaching ~300 °C before transformation trends start to develop in the opposite direction at ~370 °C. Surprisingly, martensite seems to be re-formed in the intermediate temperature section (370–600 °C). During the entire heating process, the α-phase seems to dissolve slightly until approx. 400 °C. However, it is not evident if this development is caused from actual phase transformations or is a relic of the sequential Rietveld refinement caused by the overlap of α″-martensite and α-Ti diffraction lines and the already low α phase fractions (see below and next chapter).
In the direct comparison between the results of the manual (Figure 6) and the sequential refinement (Figure 7), it becomes further apparent that the R.T. phase fractions differ between both routines, e.g., the phase fractions in the 650 °C process vary by ~3 vol.% for α″-martensite, by ~6 vol.% for β-Ti and consequently also by ~3 vol.% for α-Ti. This illustrates the challenges that occur for the three-phase sample state of Ti-6246 due to the superposition of diffraction lines of the present phases due to their crystallographic similarity. A detailed discussion is given in the following chapter (Section 3.2.2).
The identical analytical approach was applied for the characterization of fast high-temperature tempering (840 °C) plus quenching and subsequent reheating to service temperature (600 °C). Figure 8a shows the process overview with its 12 points of interest (averaged values for the phase fractions at R.T. and the high-temperature holding stages). Figure 8b resolves the heating section to the first high-temperature tempering in more detail. A similar evolution of the phase fractions can be seen. Directly after continuous and fast heating to homogenization temperature, almost the entire α-phase fraction was transformed into β-phase. This low α-phase fraction remained until heating to tempering step 1. Again, during heating, the most significant phase transformations took place. In this case, α″-martensite was completely dissolved and did not re-form during quenching from intermediate short-term tempering at 840 °C. Simultaneously, both α- and β-phase fractions increased. During all further processing steps, α-Ti phase fraction increased gradually until it stabilized at approx. 76 vol.%, which corresponds approximately to its initial phase fraction.
Reviewing the tempered (T1, see Figure 5a) microstructure, the hoped-for phase constitutions were found in the XRD data analysis. The orthorhombic α″-martensite was completely decomposed. However, from the microstructure images, it is not evident that only α- and β-phases are present since they do not occur in their regular morphology. On this basis, it might be reasonable to consider the occurrence of the hexagonal α′-martensite after the first tempering stage. This second form of martensite represents a distorted form of the hcp-unit cell [28]. By means of X-ray diffraction, α-phase and α′-martensite cannot be distinguished due to the very small lattice parameter deviations. According to Siemers’ assessment [29], both phases can coexist in Ti-6246 if heat treatment and quenching have been performed. In that case, both structures could be distinguished only by SEM analysis and on the basis of the assumption that α′ solely exists in needle shape and α in equiaxed grains or using chemical analyzing techniques as EDS in order to tell both phases apart since α′ should show higher contents of β-stabilizing elements [29,30]. It is consequently reasonable that α″-martensite firstly transforms into α′-martensite due to the high heating rates and the therefore limited opportunities for diffusional processes to stabilize and build the equilibrium α-phase. The α′ → α transformation presumably takes place during reheating to service temperature, which might explain the development of α- and β-phase fractions in the last three analysis steps (Figure 8a).
In Figure 8b, the phase evolution during heating is plotted vs. the temperature up to 840 °C and the decomposition path of α″-martensite after its reformation, which was already shown above, is revealed. However, the immediate and reverse conversion of β and α″ into each other appeared only in the low temperature section until approx. 320–370 °C. For further heating, it can be observed that martensite decomposition again starts at temperatures around 670 °C and further accelerates as heating progresses until no more distinct α″-diffraction lines can be detected at 790 °C. Simultaneously, the α-phase fraction starts to rise in this temperature section.
When comparing both graphs of Figure 8, it becomes apparent that the sequential refinement of Figure 8b includes a few uncertainties. These presumably originate from the higher degree of freedom when including all three phases for Rietveld analyses instead of specially adapted phase compositions based on the manual pre-analysis as it was done for the results of Figure 8a. It is further evident that especially the high temperature data (700 °C and above) cannot be analyzed as straightforwardly as the low temperature data due to gradual changes in the phase composition. Moreover, the orthorhombic crystal structure of α″-martensite with its many refinement parameters allows the Rietveld refinement to severely overestimate the phase fractions. Values of up to 27 vol.% were calculated, notwithstanding the fact that no more martensite decomposition is almost completed and almost no peaks are to be seen in the raw data any more (see Figure 8b, at 790–800 °C). It is reasonable that martensite is refined into the background as very broad peaks with low intensity and therefore overestimated. This procedure necessitates the reassessment of the phase fractions at temperatures of about 700 °C and upwards, which was estimated and visualized by the red and blue fields in Figure 8b.

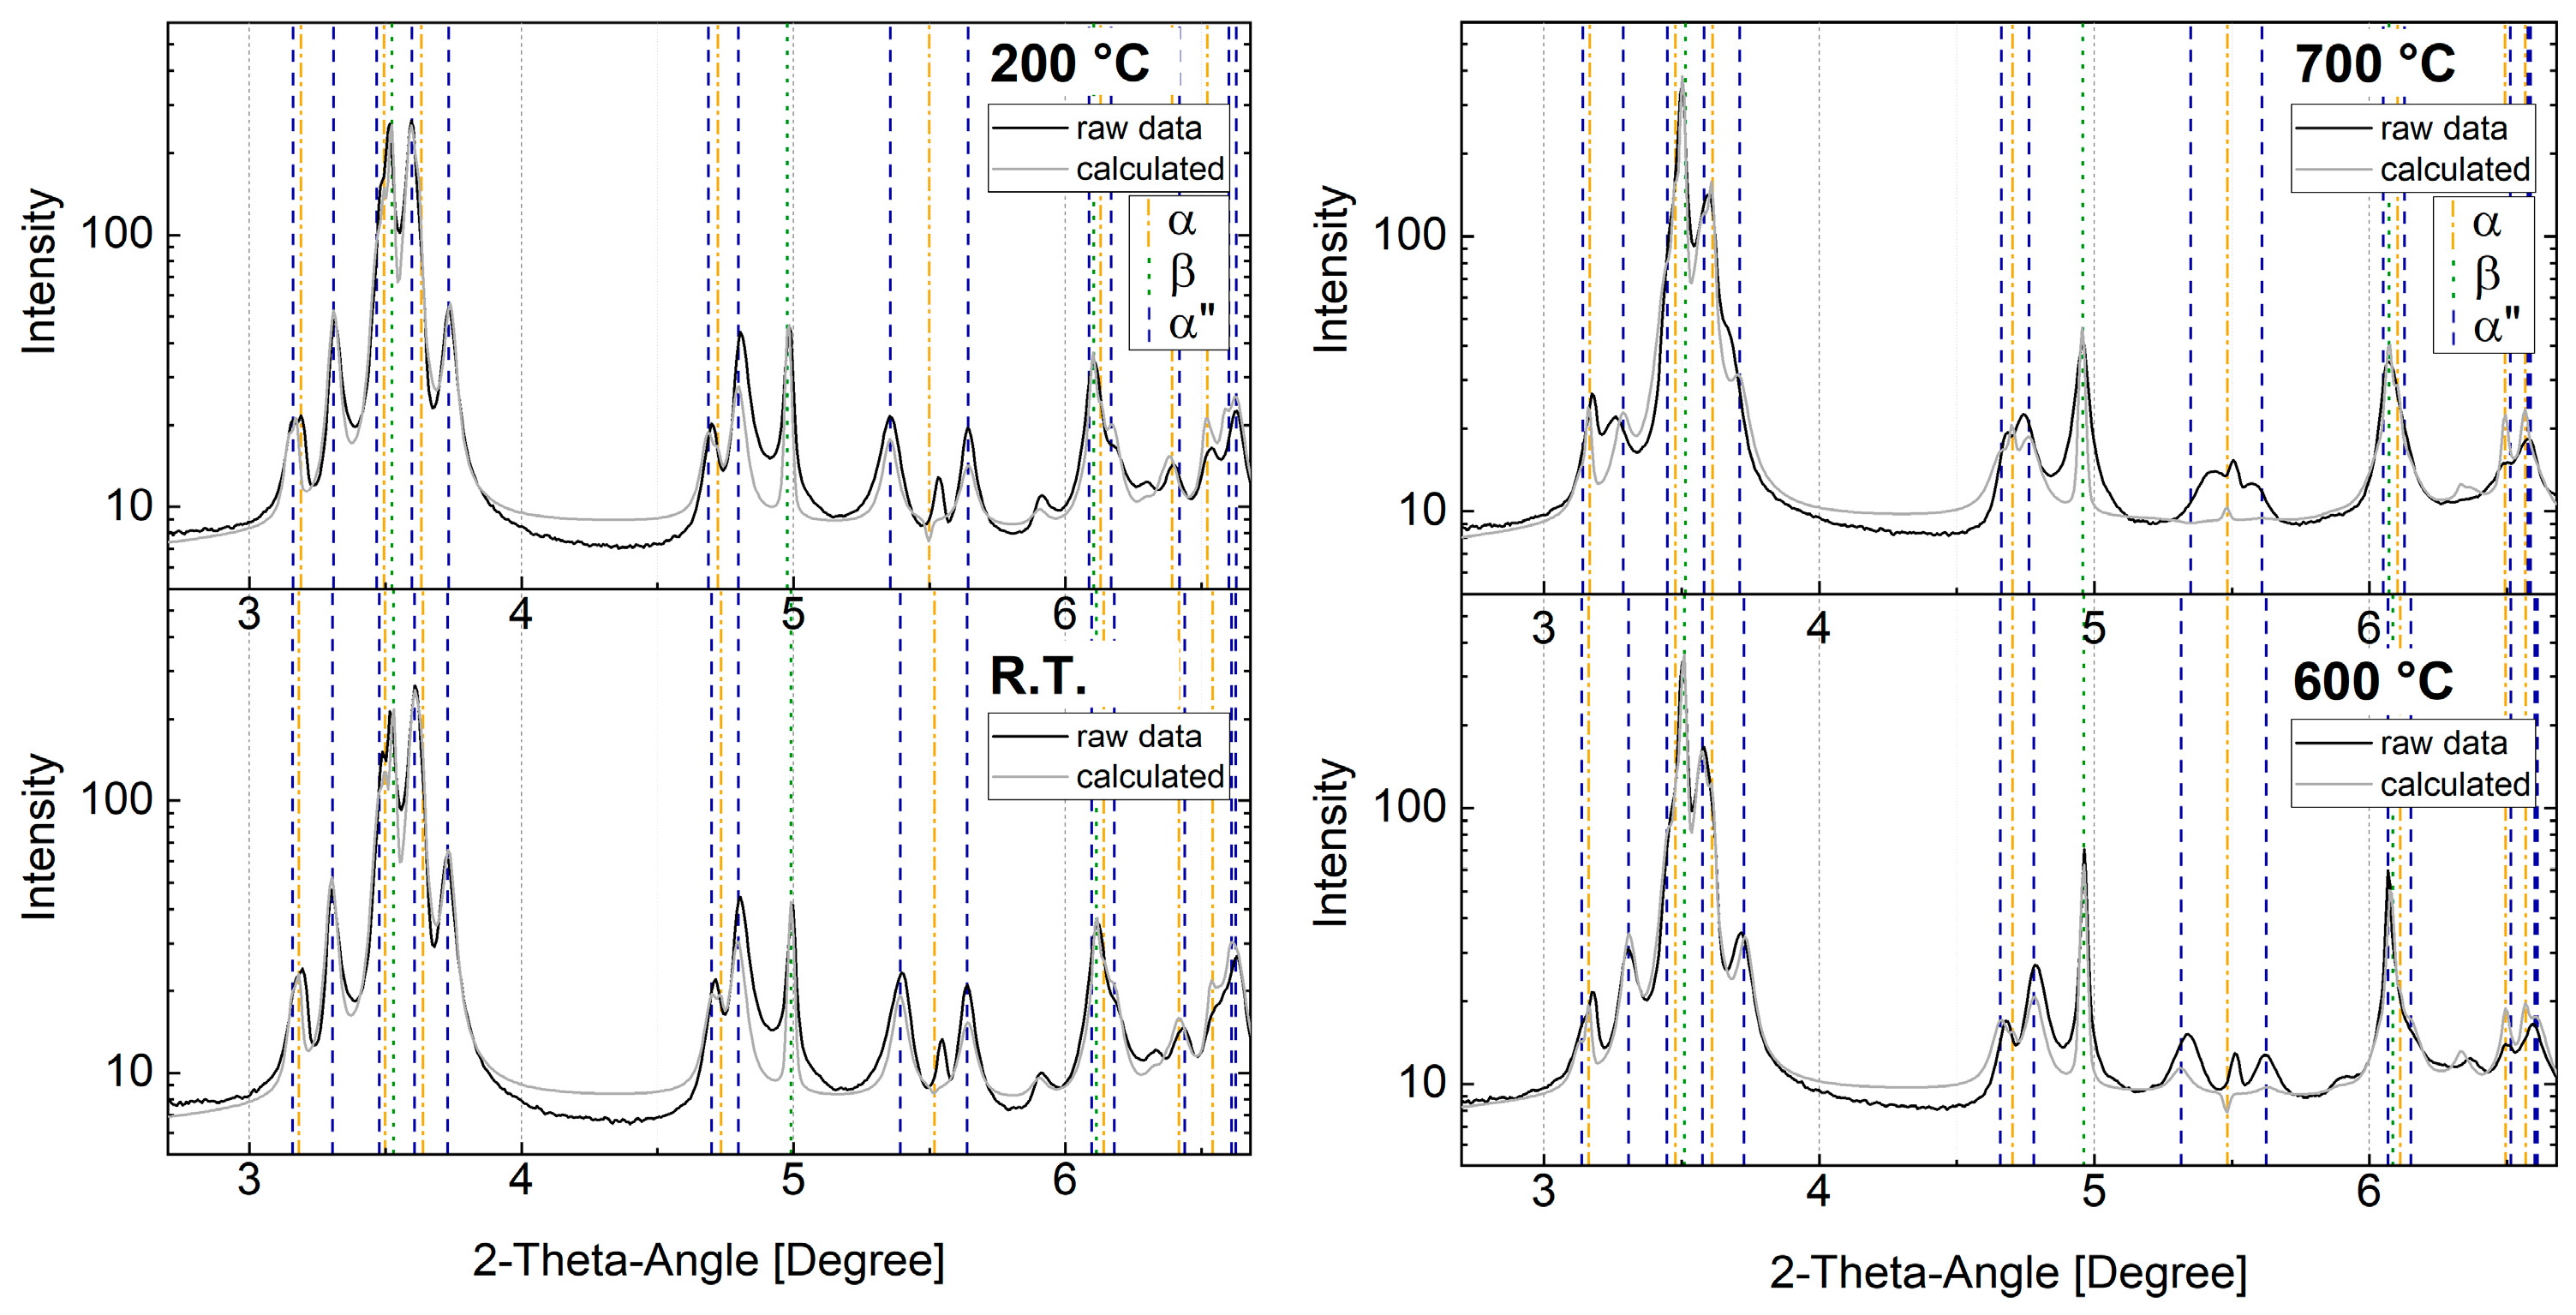
3.2.2. Challenges Regarding Phase Analysis of Ternary α + β + α″ Microstructure

As stated above, various influencing factors must be taken into account for the evaluation of the results obtained by Rietveld refinement. For this purpose, a few indicative diffractograms are compiled in Figure 9.
Two main factors were identified:
i.
The superposition of interference lines of α″-martensite and α-phase. The hexagonal α-phase, especially, has no single distinct diffraction line as every diffraction line is surrounded by at least two martensite diffraction lines (see Figure 9). This effect is further amplified as the heat treatment progresses. Peak broadening takes place most likely due to an increase in lattice strains/dislocation density caused by high cooling rates. Additionally, martensite diffraction lines gradually approach the α-diffraction lines. This may lead to overestimated α″-phase fractions and underestimated α-phase fractions as highlighted in Figure 8;
ii.
A second challenge is the grain coarsening of the parent β-phase, which was found during the evaluation of the Debye–Scherrer rings as well as shown by the SEM images. It affects the peak intensity ratios due to the low grain statistics in the measurement volume and subsequently causes erroneous phase fraction calculation by Rietveld analysis and any other peak fit routines. Two strategies can be applied to tackle this problem: (i) separately evaluate the areas with all three phases as well as the areas where the β-phase can be excluded, and (ii) keep the analyses with all three phases and interpret the results with consideration of the possible and, in this context, reasonable developments. Although strategy one seems to be the more promising solution, on several examinations, no better results could be achieved since the deviations became too large when the results of the evaluation ranges were combined.

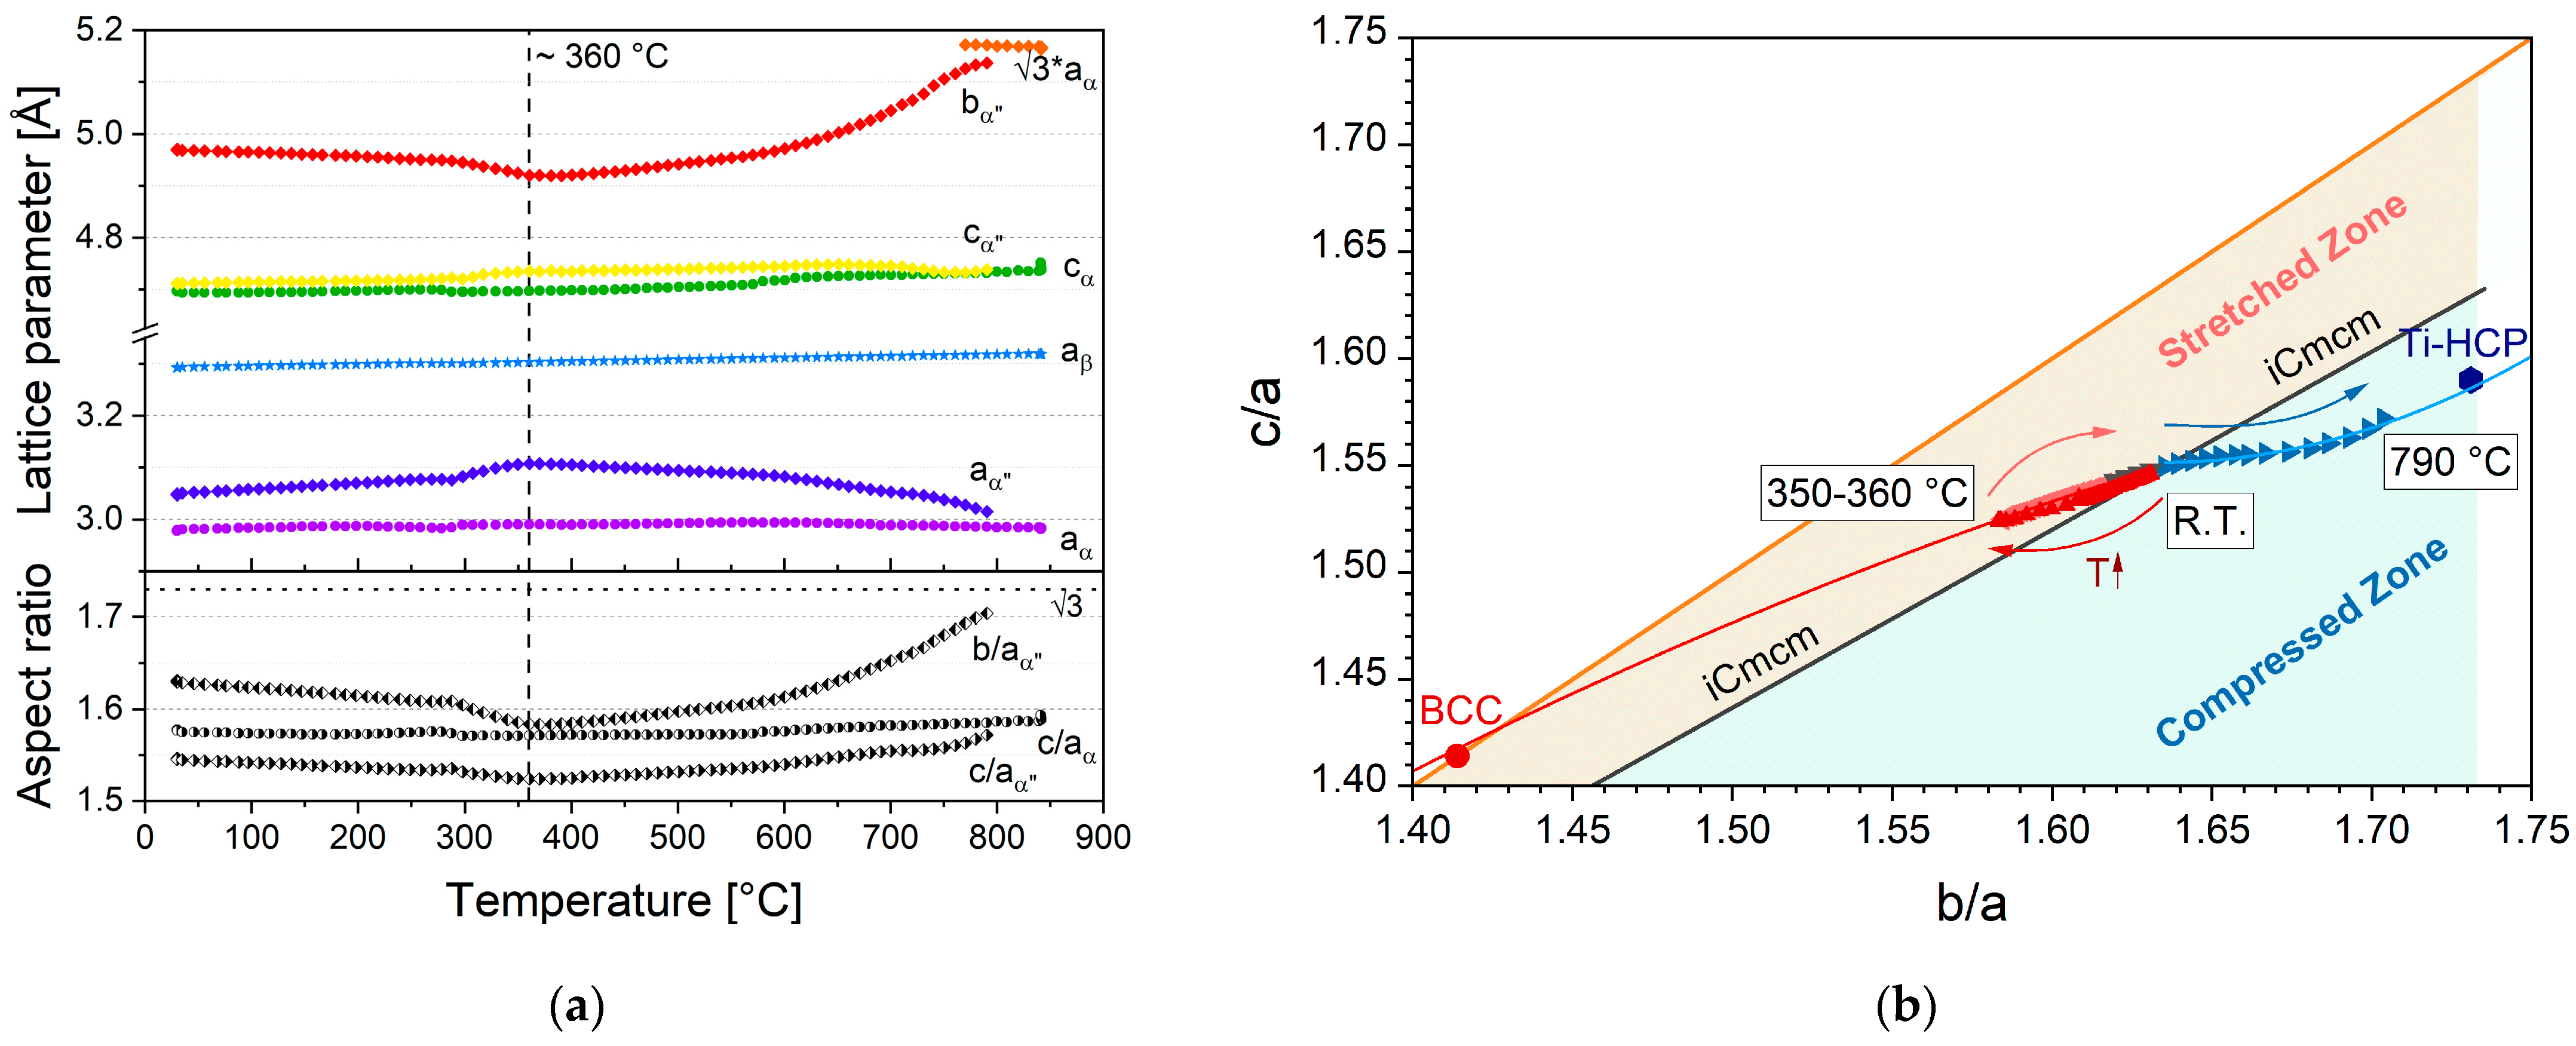
3.2.3. Evolution of Lattice Parameters and α″-Martensite Transformation Path

To understand the phase transformation kinetics more reliably, it is important to consider the development of lattice parameters of all phases with temperature. For this purpose, in Figure 10a, the lattice parameters of the phases α, β and α″ as well as the aspect ratios cα/aα of the α-phase and bα″/aα″ and cα″/aα″ of the α″-martensite phase are plotted as a function of temperature. All three phases are crystallographically linked to each other with the following multipliers: factor √2 for α″-β transformations and √3 for α″-α transformations.
From Figure 10a, it is evident that the lattice parameters of α-Ti and β-Ti slowly increase with temperature. The lattice of α″-martensite changes depending on the lattice plane, with cα″ and aα″ following a positive and bα″ following a negative slope. By reaching temperatures above 350–360 °C, the α″-martensite lattice parameters develop in opposite directions. In more detail, aα″ and cα″ converge aα and cα, respectively, and bα″ approaches the value of 3   ⋅ aα following the rules of crystallography for a hexagonal system such as α-Ti and α′-martensite [15]. With the help of the aspect ratios, it can more precisely be determined whether the α″-martensite unit cell approaches a β-unit cell (√2) or α-unit cell (√3). It can be seen that at the beginning of the reheating, the aspect ratios of α″-martensite drop but still deviate far from √2 as the target value for a complete α″-β transformation. Again, with increasing temperature, the slope inverts and the aspect ratios approach √3. In conclusion, a transformation of α″-martensite to β-Ti and α-Ti is expected. In a study of Bönisch et al. [15], an identical transformation behavior was found. Therein, the transformation path of four Ti-base alloys with varying Nb content was determined. The most appropriate transformation behavior (to the present results for Ti-6246) of all four alloys investigated in [15] can be found for Ti-21Nb. The good conformity of their Ti-21Nb alloy and the Ti-6246 alloy of the present study is further reasonable, since both molybdenum equivalents Moeq (a mathematical approach to compare the number of β-stabilizing elements in a Ti-alloy) are close to 6% [31].
Demakov et al. introduced an even more progressive approach, which is visualized in Figure 10b [16]. Their approach was transferred to Ti-6246 and is discussed by means of these results. In Figure 10b, the aspect ratios bα″/aα″ and cα″/aα″ of the α″-martensite are plotted against each other for a temperature span of R.T.-790 °C, starting from the center of the diagram (marked with R.T.) and ending at the left top with the blue data points. The arrows are added to guide the reader in interpreting the diagram. Additionally, the ideal aspect ratio of the body-centered-cubic β-phase (BCC) and the hexagonal-close-packed α-Ti (Ti-HCP) are plotted. The ideal orthorhombic crystal structure (iCmcm) of α″-martensite (as defined by [16]) is represented by the black linear curve dividing rather β-like (light orange area/stretched zone) from rather α-like (light blue area/compressed zone) unit cells. Without any knowledge about structural relationships of the phases α, β and α″ and its aspect ratios, it can be observed that at room temperature R.T. an ideal orthorhombic unit cell is present (Figure 10b, red data points at R.T. box), which firstly transforms into the stretched, β-like state. From the data of the phase fractions over temperature, it is known that at this point, the α″-martensite content is already decreasing and the β content increasing. Therefore, the data available only consider the residual martensitic unit cells, which withstand the driving force of transformation. One possible explanation for the α″ → β transformation is based on a diffusionless mechanism [20,32]. P. Barriobero-Vila et al. studied martensite decomposition paths and concluded that this transformation behavior is the result of thermal mismatch stresses between the phases β and α″, which can be reduced therewith [32]. Therefore, the lattice strains in Ti-6246 have been calculated based on the proposed equations of [32]. The lowest level of lattice strains is found at approx. 350–360 °C that corresponds roughly with the highest volume fraction of β-Ti. At R.T. prior to fast heating, the lattice straining ε1 based on the mismatch between aα″ and aβ amounts to approx. −7.5%, the strain ε2 based on the mismatch between bα″ and aβ accounts for around 6.7% and the strain ε3 (based on the mismatch between cα″ and aβ) accounts for a rather low value of 1.2%. At the turning point, the lattice strain ε1 amounts to approx. −5.9%. Oppositely, the strain ε2 accounts for around 5.3% and ε3 amounts to approx. 1.4%. Further, P. Barriobero-Vila et al. found in another study that β-formation preferably takes place at martensite twins and boundaries as those are strain-affected regions [20]. There, structural heterogeneities, i.e., local distributions in chemical composition, may as well be present. Areas which are of slightly higher Mo content are therefore less stable and decompose into β, following the observations of [15]. This can cause the lattice parameter to significantly drop as it becomes β-like. Moreover, the growth of these twin-associated grains may proceed along the twin boundaries resulting in an unusual needle-like pattern for the present phases, as shown in Figure 5.
As temperature increases following the fast heating section, the α″-martensite unit cell steadily evolves back into an ideal Cmcm unit cell before performing the transformation into a compressed unit cell approaching the ideal HCP-Ti structure. Both studies [15,20], also proposed mechanisms for martensite stabilization/re-formation. They conclude that the diffusionless α″ → β transformation is suppressed by incipient diffusion. More precisely, small-scale diffusion of Nb (or equivalent β-stabilizing elements) out of the R.T. version of α″-martensite into β is expected to take place, which is linked to the inversion of the lattice parameters/expansion behavior. Simultaneously, enrichment in α-stabilizing elements (Al) may occur. Finally, the transformation of α″-martensite into α-Ti takes place, which is also of a diffusive nature and presumably takes place at martensite plates forming, again, a needle-like structure as visible in Figure 5a (T1) [32].

4. Conclusions

In this in situ High Energy Synchrotron X-Ray study at the HEMS beamline P07B at DESY, the α + β alloy Ti-6246 was subjected to heat treatments with fast heating (100 K/s) and ultra-fast quenching rates (up to ~1500 K/s) in order to produce a martensitic microstructure. Subsequently, the samples were rapidly reheated to service temperatures in order to gather information about the microstructure stability. In an additional heat treatment, the martensitic samples were first exposed to high-temperature tempering in order to intentionally decompose the orthorhombic martensite. Again, fast reheating into the service temperature region was executed in order to characterize the microstructure. Thereby, the decomposition of α″-martensite was characterized on a crystallographic basis using the evolution of phase fractions as well as lattice parameters determined by Rietveld refinement. Additionally, a model for unique martensite characterization as proposed in [16] was applied to discuss the results of the sequential Rietveld refinement of the continuous heating section to the tempering stages.
The following conclusions can be drawn:
i.
The data analysis via Rietveld refinement of heat-treated Ti-6246 with its ternary α-β-α″ microstructure is a challenging endeavor and may be misleading since, especially with the presence of the orthorhombic α″-phase, a high degree of overlapping diffraction lines meets a high degree of freedom due to the large number of refinement parameters;
ii.
Sequential refinements should therefore be critically reviewed and brought into context. In the present study, the calculation of phase fractions was found to be less reliable due to the superposition of diffraction line and grain coarsening. Therefore, the evolution of the lattice parameters was used in order to analyze the ongoing phase transformations. The calculated 2θ-line positions were critically reviewed and found to be reliable;
iii.
The microstructure of Ti-6246 was characterized after each process step of the heat treatments. The H + Q (homogenized at 970 °C and quenched) microstructure mainly consisted of α″-martensite needles and residual β-Ti and α-Ti;
iv.
The reheating to three different temperatures in the range of service temperatures with a holding time of 600 s had different effects. With increasing temperature, the martensite content in the final sample state decreased. The microstructure of the 650 °C sample showed distinct α- and β-grains, which were not observable for both states reheated to lower temperatures (550 °C and 600 °C);
v.
Based on the H + Q microstructure, the phase transformation path of the phases α, β and α″-martensite was characterized during continuous heating up to 550–650 °C and 840 °C. It shows a two-tier nature. In the lower temperature segment (until approx. 370 °C), α″ transforms into β. With further heating, α″ gradually transforms into α and is completely decomposed at 790 °C;
vi.
With the help of the crystal-structure-based model recently proposed by Demakov et al. [16], the α″-martensite transformation pathway could have been graphically reprocessed, highlighting the transformation trends in a very focused manner. It allows the identification of the location of α″-martensite on the b.c.c.-Cmcm-h.c.p. transformation path without extensive crystallographic background.
Hence, the findings of the present in situ study for the alloy Ti-6246 help in understanding and assessing the microstructure development resulting for manufacturing scenarios as, e.g., the L-PBF of Ti-6246 parts, which are martensitic after processing and might be quickly heated up under service conditions to rather high application temperatures.

Author Contributions

Conceptualization, A.-L.O. and J.G.; methodology, A.-L.O. and A.S.; software, A.-L.O.; validation, A.-L.O. and J.G.; investigation, A.-L.O., P.T.M. and A.S.; resources, J.G., A.S. and M.H. (Markus Hoelzel), M.H. (Michael Hofmann); writing—original draft preparation, A.-L.O.; writing—review and editing, J.G. and P.T.M.; visualization, A.-L.O.; supervision, J.G. and M.H. (Michael Hofmann); project administration, J.G.; funding acquisition, J.G. All authors have read and agreed to the published version of the manuscript.

Funding

We acknowledge support by the KIT-Publication Fund of the Karlsruhe Institute of Technology.

Data Availability Statement

Not applicable.

Conflicts of Interest

The authors declare no conflict of interest.

References

  1. John, R.; Buchanan, D.; Jha, S.; Larsen, J. Stability of shot-peen residual stresses in an α + β titanium alloy. Scr. Mater. 2009, 61, 343–346. [Google Scholar] [CrossRef]
  2. Yang, S. HCF Property Improvement through Microstructure Optimization and Shot Peening in (α + β) Ti Alloys. Ph.D. Thesis, Technical University of Clausthal, Clausthal-Zellerfeld, Germany, 2014. [Google Scholar]
  3. Güler, E.; Güler, M.; Uğur, G.; Uğur, Ş. A first-principles study for the elastic and mechanical properties of Ti64, Ti6242 and Ti6246 alloys. Eur. Phys. J. B 2021, 94, 2021. [Google Scholar] [CrossRef]
  4. Sauer, C.; Lütjering, G. Processing, Microstructure and Properties of Ti-6246. In Titanium ’99: Science and Technology, Proceedings of the 9th World Conference on Titanium, Saint-Petersburg, Saint-Petersburg, Russia, 7–11 June 1999; Goryn, I.V., Ushkov, S.S., Eds.; Central Research Institute of Structural Materials: Saint Petersburg, Russia, 2000; Volume 1, pp. 390–397. [Google Scholar]
  5. Armendia, M.; Osborne, P.; Garay, A.; Belloso, J.; Turner, S.; Arrazola, P.-J. Influence of Heat Treatment on the Machinability of Titanium Alloys. Mater. Manuf. Process. 2012, 27, 457–461. [Google Scholar] [CrossRef]
  6. Terlinde, G.; Witulski, T.; Fischer, G. Thermomechanical Treatment of Titanium alloys—Forging of Titanium. In Titanium and Titanium Alloys; Leyens, C., Peter, M., Eds.; WILEY-VCH: Weinheim, Germany, 2003; pp. 289–304. [Google Scholar]
  7. Kapoor, K.; Ravi, P.; Naragani, D.; Park, J.-S.; Almer, J.; Sangid, M. Strain rate sensitivity, microstructure variations, and stress-assisted phase transformation investigation on the mechanical behavior of dual-phase titanium alloys. Mater. Charact. 2020, 166, 110410. [Google Scholar] [CrossRef]
  8. Birosca, S.; Buffiere, J.; Garcia-Pastor, F.; Karadge, M.; Babout, L.; Preuss, M. Three-dimensional characterization of fatigue cracks in Ti-6246 using X-ray tomography and electron backscatter diffraction. Acta Mater. 2009, 57, 5834–5847. [Google Scholar] [CrossRef]
  9. Titanium Engineers. Titanium 6Al-2Sn-4Zr-6Mo Ti 6246 (UNS R56260). Texas. 2016. Available online: http://www.titaniumengineers.com/uploads/1/7/9/5/17957627/6246datasheet.pdf (accessed on 16 July 2019).
  10. Young, M.; Levine, E.; Margolin, H. The aging behavior of orthorhombic martensite in Ti-6-2-4-6. Metall. Trans. 1974, 5, 1891–1898. [Google Scholar] [CrossRef]
  11. Stella, P.; Giovanetti, I.; Masi, G.; Leoni, M.; Molinari, A. Microstructure and microhardness of heat-treated Ti-6Al-2Sn-4Zr-6Mo alloy. J. Alloys Compd. 2013, 567, 134–140. [Google Scholar] [CrossRef]
  12. Pederson, R.; Niklasson, F.; Skystedt, F.; Warren, R. Microstructure and mechanical properties of friction- and electron-beam welded Ti–6Al–4V and Ti–6Al–2Sn–4Zr–6Mo. Mater. Sci. Eng. A 2012, 552, 555–565. [Google Scholar] [CrossRef]
  13. Bönisch, M. Revealing how martensite in Ti-alloys expands and decomposes. Sci. Highlights-Struct. Mater. 2018, 135–136. [Google Scholar] [CrossRef]
  14. Bönisch, M.; Panigrahi, A.; Calin, M.; Stoica, M.; Waitz, T.; Zehetbauer, M.; Skrotzki, W.; Eckert, J. Diffusive and Diffusionless Transformations of Martensitic Ti-Nb Alloys. In Proceedings of the International Conference on Martensitic Transformations ICOMAT 2017, Chicago, IL, USA, 9–14 July 2017. [Google Scholar] [CrossRef]
  15. Bönisch, M.; Panigrahi, A.; Stoica, M.; Calin, M.; Ahrens, E.; Zehetbauer, M.; Skrotzki, W.; Eckert, J. Giant thermal expansion and alpha-precipitation pathways in Ti-alloys. Nat. Commun. 2017, 8, 1429. [Google Scholar] [CrossRef] [Green Version]
  16. Demakov, S.; Kylosova, I.; Stepanov, S.; Bönisch, M. A general model for the crystal structure of orthorhombic martensite in Ti alloys. Acta Crystallogr. 2021, 77, 749–762. [Google Scholar] [CrossRef]
  17. Davis, R.; Flower, H.; West, D. The decomposition of Ti-Mo martensites by nucleation and growth and spinodal mechanisms. Acta Metall. 1979, 27, 1041–1052. [Google Scholar] [CrossRef]
  18. Motyka, M. Martensite Formation and Decomposition during Traditional and AM Processing of Two-Phase Titanium Alloys–An Overview. Metals 2021, 11, 481. [Google Scholar] [CrossRef]
  19. Mur, F.G.; Rodríguez, D.; Planell, J. Influence of tempering temperature and time on the α′-Ti-6Al-4V martensite. J. Alloys Compd. 1996, 243, 287–289. [Google Scholar]
  20. Barriobero-Vila, P.; Oliveira, V.B.; Schwarz, S.; Buslaps, T.; Requena, G. Tracking the α martensite decomposition during continuous heating of a Ti-6Al-6V-2Sn alloy. Acta Mater. 2017, 135, 132–143. [Google Scholar] [CrossRef]
  21. Salvador, C.; Lopes, E.; Ospina, C.; Caram, R. Orthorhombic martensite formation upon aging in a Ti-30Nb-4Sn alloy. Mater. Chem. Phys. 2016, 183, 238–246. [Google Scholar] [CrossRef]
  22. Carrozza, A.; Aversa, A.; Fino, P.; Lombardi, M. A study on the microstructure and mechanical properties of the Ti-6Al-2Sn-4Zr-6Mo alloy produced via Laser Powder Bed Fusion. J. Alloys Compd. 2021, 870, 159329. [Google Scholar] [CrossRef]
  23. Mai, P.; Bormann, T.; Sonntag, R.; Kretzer, J.; Gibmeier, J. Short-Term Heat Treatment of Ti6Al4V ELI as Implant Material. Materials 2020, 13, 4948. [Google Scholar] [CrossRef]
  24. Esin, V.A.; Mallick, R.; Dadé, M.; Denand, B.; Delfosse, J.; Sallot, P. Combined synchrotron X-ray diffraction, dilatometry and electrical resistivity in situ study of phase transformations in a Ti2AlNb alloy. Mater. Charact. 2020, 169, 110654. [Google Scholar] [CrossRef]
  25. Lin, S.; Borggren, U.; Stark, A.; Borgenstam, A.; Mu, W.; Hedström, P. In-Situ High-Energy X-ray Diffraction Study of Austenite Decomposition During Rapid Cooling and Isothermal Holding in Two HSLA Steels. Metall. Mater. Trans. A 2021, 52, 1812–1825. [Google Scholar] [CrossRef]
  26. Toby, B.; Dreele, R.V. GSAS-II: The genesis of a modern open-source all purpose crystallography software package. J. Appl. Crystallogr. 2013, 46, 544–549. [Google Scholar] [CrossRef]
  27. Ji, X.; Gutierrez-Urrutia, I.; Emura, S.; Liu, T.; Hara, T.; Min, X.; Ping, D.; Tsuchiya, K. Twinning behavior of orthorhombic-α” martensite in a Ti-7.5Mo alloy. Sci. Technol. Adv. Mater. 2019, 20, 401–411. [Google Scholar] [CrossRef] [PubMed] [Green Version]
  28. Kaschel, F.R.; Vijayaraghavan, R.K.; Shmeliov, A.; McCarthy, E.K.; Canavan, M.; McNally, P.J.; Dowling, D.P.; Nicolosi, V.; Celikin, M. Mechanism of stress relaxation and phase transformation in additively manufactured Ti-6Al-4V via in situ high temperature XRD and TEM analyses. Acta Mater. 2020, 188, 720–732. [Google Scholar] [CrossRef]
  29. Siemers, C. Researchgate. September 2015. Available online: https://www.researchgate.net/post/Whats-the-difference-in-the-crystal-lattice-between-alpha-and-alpha-primemartensite-in-titanium-alloys (accessed on 18 August 2022).
  30. Bönisch, M. Researchgate. June 2018. Available online: https://www.researchgate.net/post/Whats-the-difference-in-the-crystal-lattice-between-alpha-and-alpha-primemartensite-in-titanium-alloys (accessed on 18 August 2022).
  31. The strengthening molybdenum and aluminum equivalents of alloying elemts in titanium. Titanium’99: Science and Technology. 1999, Volume 1–2, pp. 56–60. Available online: https://www.google.com/url?sa=t&rct=j&q=&esrc=s&source=web&cd=&cad=rja&uact=8&ved=2ahUKEwiBleDh8K39AhWxNOwKHcHQCsUQFnoECAkQAQ&url=https%3A%2F%2Fcdn.ymaws.com%2Ftitanium.org%2Fresource%2Fresmgr%2FZZ-WTCP1999-VOL1%2F1999_Vol.1-2-The_Strengtheni.pdf&usg=AOvVaw1UyTxaSFWEauhtGa4U_e-3 (accessed on 10 August 2022).
  32. Barriobero-Vila, P.; Requena, G.; Warchomicka, F.; Stark, A.; Schell, N.; Buslaps, T. Phase transformation kinetics during continuous heating of a beta-quenched Ti–10V–2Fe–3Al alloy. J. Mater. Sci. 2015, 50, 1412–1426. [Google Scholar] [CrossRef]
Figure 1. Temperature-time-profile of homogenized and reheated samples (D_970_550-650) as well as homogenized, martensite-free samples and reheated sample (M_970_840_600).
Metals 13 00484 g001
Figure 2. Schematic experimental set-up at the HEMS beamline @ DESY showing the final primary beam slit system, the modified dilatometer and the flat panel detector capturing the Debye–Scherrer rings of the diffracted beam in transmission geometry (for detailed information on the set-up with view into the dilatometer chamber with the sample position in relation to the induction coil, see [25]).
Metals 13 00484 g002
Figure 3. SEM image (BSE mode = backscattered electron image) of initial microstructure showing globular α primary and needle-like α sec ondary (dark phase) inside the β-matrix (bright phase).
Metals 13 00484 g003
Figure 4. (a) SEM images (BSE mode) of the homogenized and quenched microstructure and (b) microstructure after tempering, imitating reheating to service temperatures.
Metals 13 00484 g004
Figure 5. (a) SEM images (BSE) of R.T. microstructure in intermediate state after high-temperature tempering (T1) and (b) after reheating to service temperature (T2).
Metals 13 00484 g005
Figure 6. Overview graphs of the averaged phase fractions for the individual R.T. and high-temperature holding stages and the corresponding temperature profiles vs. heat treatment step.
Metals 13 00484 g006
Figure 7. Evolution of α-, β- and α″-martensite phase fractions during continuous, fast heating (100 K/s) to service temperatures 550, 600 and 650 °C.
Metals 13 00484 g007
Figure 8. (a) Overview graph of the phase fractions and temperature profiles vs. heat treatment step (M_970_840_600); (b) Evolution of α-, β- and α″-martensite phase fractions during continuous heating to high-temperature tempering at 840 °C with corrected/expected (for explanation of the correction of phase fraction, see discussion below) phase fractions in the high-temperature range (green, red and blue areas at 750–840 °C).
Metals 13 00484 g008
Figure 9. Examples of in situ diffractograms (raw data) vs. calculated diffraction lines with sequential Rietveld refinement at temperatures of 30 (R.T.), 200, 600 and 700 °C. With the logarithmic representation, the local deviations were intentionally exaggerated for illustration purposes. The graphs highlight the superposition of diffractions lines of the α-phase and α″-martensite as well as the β-phase (with the exception of the β-diffraction line at ~5°). They further show the challenges concerning the exact approximation of the peak intensities caused by grain coarsening. The gradual degradation of α″-martensite into α-Ti (see diffractograms at 600 °C and 700 °C) ultimately triggers the misinterpretation of the α″ → α transformation rates.
Metals 13 00484 g009
Figure 10. (a) Evolution of the lattice parameters of the phases α, β and α″-martensite and the aspect ratios cα/aα of α-phase and bα″/aα″ and cα″/aα″ of α″-martensite during heating to 840 °C (dashed line representing the temperature at the turning point of lattice parameter evolution); (b) Transition path of orthorhombic unit cell from iCmcm (= ideal orthorhombic structure according to [16]) to BCC (stretched-Cmcm) and Ti-HCP (compressed-Cmcm) visualized based on the aspect ratios bα″/aα″ and cα″/aα″ of α″-martensite during continuous heating to 840 °C with polynomial trendlines based on the approach by [16].
Metals 13 00484 g010
Table 1. Crystal structure and R.T. lattice parameters of α, β and α″-martensite in homogenized and quenched Ti-6264.
PhaseCrystal GroupCell Length [Å]
abc
α (hcp)P63/mmc2.9707 4.6880
β (bcc)Im-3m3.2877
α″ (orthorhombic)Cmcm3.03874.97314.7176
Table 2. Heat treatment schedule consisting of homogenization and reheating to service temperatures as well as high-temperature tempering and reheating to service temperatures.
DesignationTemperature [°C]Duration
[s]
Cooling Rate
[°C/s]
H+Q970600Max. −1581
T550-650600Max. −1096
T184030Max. −274
T2600120Max. −204
Disclaimer/Publisher’s Note: The statements, opinions and data contained in all publications are solely those of the individual author(s) and contributor(s) and not of MDPI and/or the editor(s). MDPI and/or the editor(s) disclaim responsibility for any injury to people or property resulting from any ideas, methods, instructions or products referred to in the content.

