Abstract
This study looked into the influence of iron nitrate (Fe(NO3)3 on the corrosion behavior of a 6061 Al alloy treated by a plasma electrolytic oxidation coating (PEO). PEO coatings were fabricated on Al alloy samples under AC conditions utilizing an alkaline-aluminate electrolyte containing 0 and 5 gr of Fe(NO3)3. Surface examination demonstrated that some Fe2O3 particles were effectively integrated into the coating layer produced in a solution containing Fe(NO3)3. In addition, the porosity and the size of micropores made due to plasma activity were significantly reduced after the PEOO treatment of the 6061 Al substrate in an electrolyte containing Fe(NO3)3. Accordingly, the coating formed in the electrolyte with Fe(NO3)3 exhibited superior corrosion resistance to that treated in the electrolyte without Fe(NO3)3.
1. Introduction
Plasma electrolytic oxidation coating (PEO) is an advanced anodizing treatment that forms a ceramic-like coating on the surface of Al and Al alloys [1,2,3]. PEO usually applies eco-friendly alkaline electrolytes, and the coating layers are produced under a high voltage as short-lived discharges happen locally on the coating surface, resulting in a surface conversion to an oxide-based layer [1]. To acquire a broader range of uses and advantageous qualities, such as a multifunctional surface or long-term protection, however, the porous structure of PEO coating is a critical aspect that requires further treatment [4,5]. It was generally recognized that the primary influence on the characteristics of PEO-coated samples was processing parameters, namely electrical parameters and electrolyte composition [1,6,7,8]. Among them, it was stated that the electrolyte composition used during PEO considerably affected the properties of the resultant coatings. For example, it has been shown that after introducing stable metal oxides into the coating layers using electrochemical methods, adding metal oxide nanoparticles or metallic salts to the electrolyte during PEO was an effective technique to improve the protective characteristics of PEO coatings. For instance, potentiodynamic polarization experiments conducted by Arunnellaiappan et al. [9] showed that CeO2 inclusion significantly increased the corrosion resistance of the 7075 Al alloy. Furthermore, incorporating ZrO2 into the coating layers produced by adding potassium fluorozirconate ions to an alkaline solution enhanced the corrosion properties of 6063 Al alloy, as reported by Xiang et al. [10]. The corrosion rate of the 7075 Al alloy may be reduced by adding TiO2 particles to the oxide coating produced in an alkaline-silicate solution [11]. According to Kaseem and Ko [12], the dual inclusion of ZrO2 and MoO2 into the PEO coatings could significantly increase the corrosion resistance of the 7075 Al alloy.
Similarly, the dual incorporation of SiO2/ZrO2 or MoO2/TiO2 was reported to reduce the corrosion rate of the PEO-coated Al alloy [13,14]. Barari et al. [15] observed that adding ZrO2 to the alumina layer significantly improved the corrosion resistance of the aluminum alloy. In general, metallic oxide particles can be incorporated into the PEO via two routes, including metallic salts or directly adding metallic oxide particles into the electrolyte [1]. For instance, Kaseem et al. [16] compared the corrosion properties of Al alloy samples subjected to PEO in an electrolyte containing either V2O5 nanoparticles or NH4VO3 salt. The results showed that the coating produced in an electrolyte with NH4VO3 had higher corrosion resistance than those obtained in an electrolyte with V2O5 particles, which was attributed to the decomposition of VO3- ions during PEO which could trigger the incorporation of a higher fraction of V2O5 along with α-Al2O3.
Particle-based coatings have an extraordinary vivid color, are non-fading, and have outstanding anti-corrosion, super-hydrophobic, and photocatalytic characteristics [17,18,19]. For instance, Dhoke et al. [20] fabricated a unique composite coating including 0.3 wt.% nano-Fe2O3 particles and reported that the presence of nanoparticles not only prevented UV coating degradation but also improved the corrosion protection performance of alkyds-based water-borne coatings. Kim et al. [21] observed that adding iron phosphate to an alkaline-phosphate electrolyte considerably increased the photocatalytic activity of coatings produced on pure titanium using the PEO technique. This was linked to the fact that such an additive would help form a porous layer with a low bandgap due to the incorporation of Fe2O3 into the coating. According to Yin et al. [22], a simple and extensible method for preparing a self-cleaning, underwater writable, heat-insulated, and photocatalytic cellulose membrane for highly efficient oil/water separation and removal of hazardous organic pollutants was proposed by combining Fe2O3 deposition with a stearic acid coating. However, little information was available concerning the role of iron oxide incorporated into the alumina layer on the corrosion behavior of the 6061 Al alloy. Accordingly, this work aimed to fabricate Al2O3/Fe2O3 hybrid composite coatings on the 6061 Al alloy using the PEO method in an alkaline-aluminate electrolyte containing iron nitrate. Structure, composition, and corrosion evaluation were all included while analyzing the properties of the current coatings.
2. Experimental Procedure
In this work, 6061 Al alloy samples with dimensions of 3 × 2 × 1 cm were used as substrates. Before the PEO procedure, the sample was progressively ground with SiC sheets (#400–#1200) and ultrasonically cleaned in ethanol. Under AC conditions, a series of PEO coatings were applied at 60 Hz. As stated in Table 1, the current electrolytes employed in this investigation included base electrolytes KOH and NaAlO2 without and with Fe(NO3)3.9H2O addition. S1 and S2 samples here describe the coatings formed in the alkaline-aluminate electrolyte without and with Fe(NO3)3, respectively. The electrolyte temperature was controlled at 283 K to maintain the electrochemical reactions during the PEO process. A current density of 100 mA/cm2 was applied for 3 min. The PEO-coated samples were cleaned with deionized water before drying in heated air. The samples’ surface morphologies and elemental composition were examined using field-emission scanning electron microscopy (FE-SEM, HITACHI S-4800, Hitachi, Japan) and energy-dispersive spectroscopy (EDS, Horiba Inc.). An image analyzer was used to measure the porosity and pore size at five different sites of each sample. The surface roughness was evaluated by atomic force microscopy (AFM, Park systems NX-10). With a step size of 0.05° and a scan range of 20° to 90°, X-ray diffraction (XRD, RIGAKU, D-MAX 2500) was used to analyze the phase structure. X-ray photoelectron spectroscopy (XPS, VG Microtech, ESCA 2000, VG Microtech, London, UK) was also employed to confirm the chemical composition of the coatings. In three-electrode corrosion cells with a Pt plate as the counter electrode, Ag/AgCl solution as the reference electrode, and the tested sample, which has a surface area of 1 cm2, as a working electrode, potentiodynamic polarization (PDP) and electrochemical impedance spectroscopy (EIS) tests using a potentiostat (GAMRY Interface 1000) were carried out to examine the corrosion behavior of the coatings. The PDP tests were scanned from −250 mV to +400 mV (vs. open-circuit potential) at a scan rate of 1 mV/s. EIS measurements were performed at a frequency ranging from 106 Hz to 0.1 Hz at an interval of 10 points/decade with a 10 mV rms. Prior to PDP and EIS assessments, the electrode was left stabilizing at open-circuit potential for 1 h. Tests were performed at least three times to attain precisely accurate data values.

Table 1.
Chemical compositions of the electrolytes used for the present MAO coatings.
3. Results and Discussion
3.1. Voltage–Time Curves
Figure 1 shows the relationship between the recorded voltage and time during PEO treatments of S1 and S2 samples treated in electrolytes without and with Fe(NO3)3, respectively. Regardless of the kind of electrolyte utilized, the responsive voltage in the early stage of PEO sharply increased with the coating time in accordance with Ohm’s law. It can be noted that both the breakdown voltage (BV) and the final voltage (FV) in the case of the S2 sample were higher than those in the S1 sample. The reason for this behavior is that the iron nitrate in the electrolyte may promote the inclusion of metal oxide, such as Fe2O3, which would raise the electrical resistance in the oxide layer. As reported earlier, the incorporation of metallic oxides, such as SiO2 and ZrO2, into the coating during PEO would lead to an increase in the values of BV and FV [20,21]. The difference in the voltage–time curves for S1 and S2 samples would indicate a change in the coating properties of the coatings.
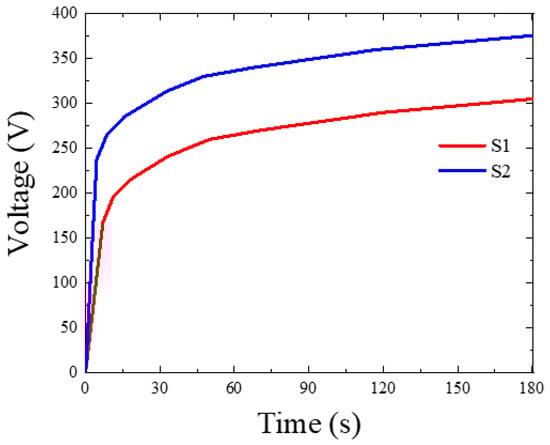
Figure 1.
Voltage–time response during MAO treatment of the S1 and S2 samples.
3.2. Morphologies of the Oxide Layer
Figure 2 depicts the surface morphologies of the S1 and S2 samples (Figure 2a,b). The PEO-coated samples contained a large number of micropores, which were typical of the samples after PEO coating [22,23,24]. The micropores would originate from the molten oxide and gas bubbles discharged from the discharge channels. The surface of the S1 samples had a few microcracks because of the extreme temperature variations that happened during plasma discharges between the coated oxide layer and the electrolyte. The surface of the PEO coating layer changed after adding Fe(NO3)3 to the electrolyte, becoming smooth and dense with fewer micropores and oxide nodules. The porosity and the size of micropores were determined to be ~ 0.84 ± 0.2 µm and ~11.04% ± 0.3%, and ~0.74 ± 0.1 µm and ~8.56% ± 0.2% for the S1 and S2 samples, respectively. From the AFM results shown in Figure 2c,d, the surface of the S2 sample had a lower value of the mean surface roughness (Ra~0.38 μm) in comparison to that in the S1 sample (Ra~0.57 μm), indicating that the addition of Fe(NO3)3 into the electrolyte during PEO not only reduced the pore size and porosity of the coating but also increased the smoothness.
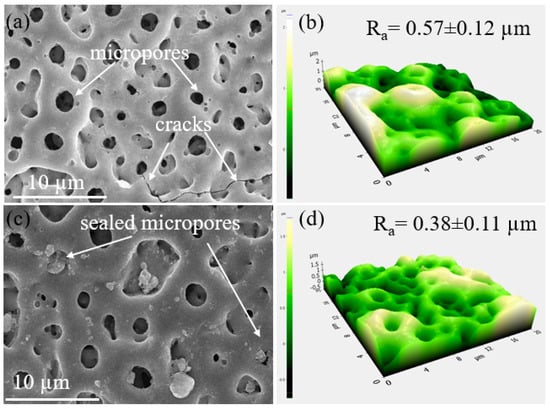
Figure 2.
SEM and corresponding AFM analysis on the surface of the S1 and S2 samples. The images showed the presence of micropores and cracks on the (a,b) S1 and (c,d) S2 samples.
Figure 3a,b present cross-sectional SEM images of S1 and S2 samples. The average thickness was calculated using SEM images obtained from at least ten distinct places, and it was found to be the same for both samples (10.45 ± 0.54), indicating that adding Fe(NO3)3 into the electrolyte did not significantly affect the samples’ thickness. The sample coated with Bath A also displayed some oxide nodules and a rough surface with somewhat coarse pores (Figure 3a). As seen by the cross-section image in Figure 3b, the S2 sample exhibited a reasonably homogenous, less porous structure and fewer micropores. According to the EDS results shown in Figure 3c, Al and O were detected in both samples, while Fe was only discovered in the S2 sample. The distributions of Al, O, and Fe elements are shown in Figure 3d–f.
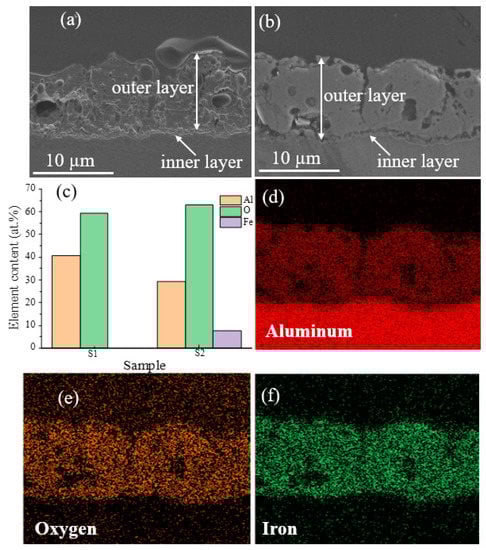
Figure 3.
SEM images of the cross-sectional morphologies of the coatings made on S1 and S2 samples: (a) S1 and (b) S2. (c) EDS area analysis on the surface of S1 and S2 samples. (d–f) EDS mappings on the cross-section of the S2 sample show the presence of Al, O, and Fe, respectively.
The XRD patterns of the S1 and S2 samples are shown in Figure 4a. The primary components of the surface layers of the PEO coatings were the γ-Al2O3 and α-Al2O3 phases. The peaks corresponding to the Al substrate were also visible because the X-rays penetrated the substrate through the porous structure. Additionally, peaks from constitutive compounds containing Fe were difficult to identify, which may be attributable to the melting of the Fe compounds due to the PEO’s high temperature, which reduced their crystallinity [25]. The formation of γ-Al2O3 and α-Al2O3 is described by Equations (1)–(3).
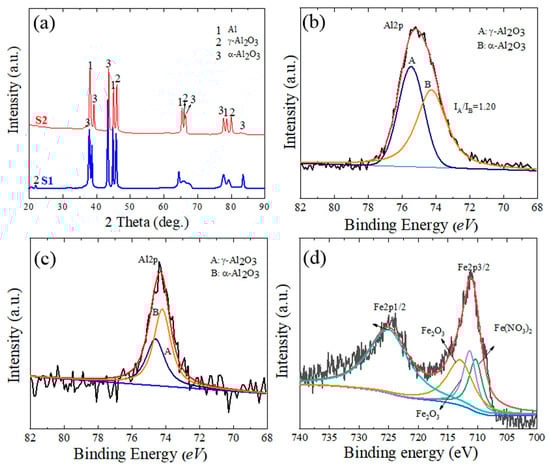
Figure 4.
(a) XRD patterns of the S1 and S2 samples. (b) XPS data of the Al2p spectrum for the S1 sample. (c,d) XPS spectra of Al2p and Fe2p for the S2 sample, respectively.
XPS findings for the Al2p spectrum in the S1 sample and the Al2p and Fe2p spectra in the S2 samples are displayed in Figure 4b–d to confirm the chemical composition of the coating layers. Peak B of the α-Al2O3 phase is represented by the binding energy at 74.2 eV, while peak A of the γ-Al2O3 phase is represented by the binding energy at 74.6 eV [26]. The surface coating of the S1 and S2 samples clearly demonstrates the variation in the binding energy intensities for both α-Al2O3 and γ-Al2O3. The XPS results are consistent with the XRD results in Figure 4a, which reveal that a greater proportion of α-Al2O3 than γ-Al2O3 phase was found in the S2 sample. The amount of the enhanced α-Al2O3 phase content is expressed as the ratio of peak A’s (γ-Al2O3) intensity to peak B’s (α-Al2O3) intensity, or IA/IB. IA/IB was measured as 1.20 ± 0.23 and 0.94 ± 0.15, respectively, for the S1 and S2 samples. The existence of a bigger percentage of the stable α-Al2O3 in the S2 sample would imply that the cooling of molten oxide was slower than the counterpart in the case of the S1 sample. The delayed cooling effect will assist in decreasing the residual stresses created in the coating as well as the likelihood of fracture development. The residual stresses induced in the coating and the possibility of crack formation will be reduced due to the slow cooling effects. The peaks of Fe2p3/2 and Fe2p1/2 in the S2 sample showed that the binding energies of 710.3, 711.3, 712.9, and 725 eV were closely linked to Fe(NO3)3 and Fe2O3 [27,28]. Therefore, it is implied that Fe2O3 was one of the chemical components of the S2 sample. The following reactions (Equations (4)–(7)) can explain the formation of Fe2O3 through different steps, including the phase transformation of Fe(OH)3 to Fe(OOH), which in turn would transfer into Fe2O3 under high temperatures of the PEO process:
3.3. Electrochemical Responses
Figure 5a displays the corrosion findings from the polarization tests conducted on the PEO-coated samples utilizing Baths A and B and measured in a 3.5 wt.% NaCl solution. Using the corrosion current density (icorr), corrosion potential (Ecorr), anodic and cathodic Tafel slopes (βa and βc), and the Stern–Geary equation, the values of polarization resistance (Rp) were calculated [25]. Table 2 contains a summary of these findings.
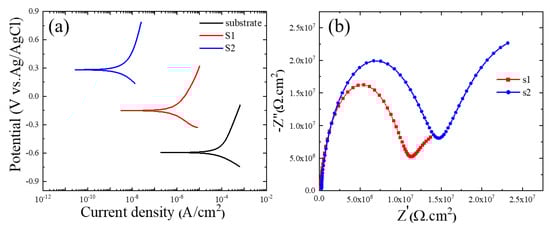
Figure 5.
(a) PDP curves of the 6061 Al alloy, S1, and S2 samples. (b) Nyquist plots of S1 and S2 samples in a 3.5 wt.% NaCl solution.
Table 2.
Results of PDP tests of the bare substrate, S1, and S2 samples immersed in a 3.5 wt.% NaCl solution.
Low icorr and/or high Ecorr of the coating layer may indicate superior corrosion resistance in the typical polarization curves [29]. According to Figure 5a, the icorr of the S2 sample was 2.01 × 10⁻⁹ A/cm2, which was almost two orders of magnitude less than that for the S1 sample (4.90 × 10⁻⁷ A/cm2). Due to this, the S2 sample would demonstrate greater resistance to the transfer of corrosive ions (Cl-) to the Al substrate. This was confirmed by the values of Rp, in which the S2 sample had the highest value of Rp in comparison to the bare substrate and S1 samples. According to Figure 2c,d, the coating layer’s thickness was unaffected by the addition of iron nitrate, suggesting that the less porous layer containing higher fractions of α-alumina along with Fe2O3, which was successfully obtained by the addition of iron nitrate into the electrolyte during PEO, may be the cause of the better corrosion protection. Alumina’s chemical stability was also directly tied to its phase. Therefore, a larger proportion of α-Al2O3 in the S2 sample was crucial in improving corrosion protection.
AC impedance tests were performed in a 3.5 wt.% NaCl solution to obtain a better understanding of the impacts of Fe(NO3)3 on the corrosion behavior of the S1 and S2 samples. The results are shown in Figure 5b as Nyquist plots. According to the results of the Nyquist plots, samples containing Fe(NO3)3 had larger semi-circle loop diameters, as seen in Figure 5b, which suggested more excellent resistance to the corrosive environment. This result was in line with the findings of the potentiodynamic polarization curves in Figure 5a. A model of an equivalent circuit, shown in Figure 6, was used to fit the Nyquist curves. According to the circuit model, Rs stands for the solution resistance between the working electrode and the reference electrode, Ro for the outer layer resistance parallel to CPEo, and Ri for the inner layer resistance parallel to CPEi. A generic CPE was used rather than a capacitive element to achieve a perfect match and consider the surface heterogeneity of PEO coatings (Equation (9)) [30,31,32].
where Z represents the CPE’s impedance, j is the imaginary number, ω is the angular frequency, and n and Y are the CPE’s parameters. The values of n ranged from 0 to 1, with CPE acting as a pure capacitor for n = 1 and a pure resistor for n = 0. The EIS curves were best matched using the suggested equivalent circuit model, and Table 3 contains the corresponding values of the equivalent circuit parameters. In both samples, the value of Ri was higher than that of Ro, which was attributed to the compact structure of the inner layer. Additionally, the formation of a coating layer with less porosity and high fractions of α-Al2O3 and Fe2O3 led to resistance values of both the inner and outer layers in the S2 sample being greater than those in the S1 sample. According to Table 3, the PEO coating/substrate interface smoothed out due to the addition of Fe(NO3)3 since the values of no and ni in the S2 sample were higher than those in the S1 sample. The dielectric behavior of the electrolyte/coating interface could be indicated by the CPE-Yo [33]. The S1 sample had a higher CPE-Yo value than the S2 sample, which was explained by the sample treated with an electrolyte without Fe(NO3)3, which was more porous than the counterpart made with an electrolyte with Fe(NO3)3, which resulted in a greater exposed area. The addition of Fe(NO3)3 to the alkaline-aluminate electrolyte for PEO coating of the 6061 Al alloy sample, however, effectively created a layer with a lower porosity and better homogeneity, as evidenced by the low CPE-Yo value in the S2 sample. These results were in line with the surface morphologies observed in Figure 2.
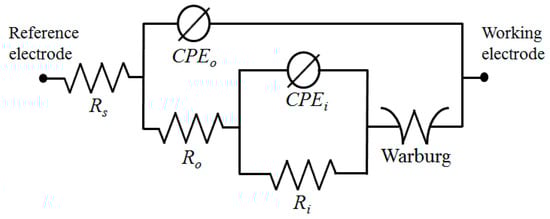
Figure 6.
The equivalent circuit model used for fitting Nyquist plots.
Table 3.
Results of the EIS tests of S1 and S2 samples immersed in a 3.5 wt.% NaCl solution.
4. Conclusions
In this study, the effect of Fe(NO3)3 on the corrosion characteristics of PEO-coated 6061 Al alloy samples was examined. The findings demonstrated how the presence of Fe(NO3)3 caused the incorporation of Fe2O3, which decreased the porosity and the average size of micropores. Additionally, as demonstrated by experiments using PDP and EIS in a 3.5 wt.% NaCl solution, the sample coated in Bath B demonstrated greater corrosion resistance than the counterpart treated in Bath A. This result could be attributed to the presence of Fe(NO3)3 in the electrolyte during PEO, which would promote the formation of a less porous coating containing higher fractions of α-Al2O3 and Fe2O3.
Author Contributions
Formal analysis, M.K.; study design, M.K.; data collection, M.K.; data analysis, M.K.; data interpretation, M.K. and A.F.-a.; resources, M.K. and A.F.-a.; writing—review and editing, M.K. funding acquisition, M.K. All authors have read and agreed to the published version of the manuscript.
Funding
This work was supported by the National Research Foundation of Korea (NRF), funded by the Korean government (MSIT; No. NRF-2022R1A2C1006743).
Data Availability Statement
Data sharing is not applicable.
Conflicts of Interest
The authors declare no conflict of interest.
References
- Kaseem, M.; Fatimah, S.; Nashrah, N.; Ko, Y. Recent progress in surface modification of metals coated by plasma electrolytic oxidation: Principle, structure, and performance. Prog. Mater. Sci. 2021, 117, 100735. [Google Scholar] [CrossRef]
- Fattah-alhosseini, A.; Vakili-Azghandi, M.; Keshavarz, M. Influence of concentrations of KOH and Na2SiO3 electrolytes on the electrochemical behavior of ceramic coatings on 6061 Al alloy processed by plasma electrolytic oxidation. Acta Metall. Sin. Eng. Lett. 2016, 29, 274–281. [Google Scholar] [CrossRef]
- Kaseem, M.; Zehra, T.; Dikici, B.; Dafali, A.; Yang, H.; Ko, Y. Improving the electrochemical stability of AZ31 Mg alloy in a 3.5wt.% NaCl solution via the surface functionalization of plasma electrolytic oxidation coating. J. Magnes. Alloy 2022, 10, 1311–1325. [Google Scholar] [CrossRef]
- Zhu, Z.; Tu, W.; Cheng, Y.; Cheng, Y. The formation of metallic W and amorphous phase in the plasma electrolytic oxidation coatings on an Al alloy from tungstate-containing electrolyte. Surf. Coat. Technol. 2019, 361, 176–187. [Google Scholar] [CrossRef]
- Hussain, T.; Kaseem, M.; Ko, Y. Hard acid-hard base interactions responsible for densification of alumina layer for superior electrochemical performance. Corros. Sci. 2020, 170, 108663. [Google Scholar] [CrossRef]
- Shen, D.; Li, G.; Guo, C.; Zou, J.; Cai, J.; He, D.; Ma, H.; Liu, F. Microstructure and corrosion behavior of micro-arc oxidation coating on 6061 aluminum alloy pre-treated by high-temperature oxidation. Appl. Surf. Sci. 2013, 287, 451–456. [Google Scholar] [CrossRef]
- De Oliveira, F.G.S.; De Oliveira Frutuoso, J.V.; Alves-Junior, C. Controlling plasma electrolytic oxidation of titanium using current pulses compatible with the duration of microdischarges. Results Mater. 2022, 15, 100310. [Google Scholar] [CrossRef]
- Tseng, C.; Lee, J.; Kuo, T.; Kuo, S.; Tseng, K. The influence of sodium tungstate concentration and anodizing conditions on microarc oxidation (MAO) coatings for aluminum alloy. Surf. Coat. Technol. 2012, 206, 3437–3443. [Google Scholar] [CrossRef]
- Arunnellaiappan, T.; Ashfaq, M.; Krishna, L.; Rameshbabu, N. Fabrication of corrosion-resistant Al2O3-CeO2 composite coating on AA7075 via plasma electrolytic oxidation coupled with electrophoretic deposition. Ceram. Int. 2016, 42, 5897–5905. [Google Scholar] [CrossRef]
- Xiang, N.; Song, R.; Zhuang, J.; Song, R.; Lu, X.; Su, X. Effects of current density on microstructure and properties of plasma electrolytic oxidation ceramic coatings formed on 6063 aluminum alloy. Trans. Nonferrous Met. Soc. China 2016, 26, 806–813. [Google Scholar] [CrossRef]
- Bahramian, A.; Raeissi, K.; Hakimizad, A. An investigation of the characteristics of Al2O3/TiO2 PEO nanocomposite coating. Appl. Surf. Sci. 2015, 351, 13–26. [Google Scholar] [CrossRef]
- Kassem, M.; Lee, Y.; Ko, Y. Incorporation of MoO2 and ZrO2 particles into the oxide film formed on 7075 Al alloy via micro-arc oxidation. Mater. Lett. 2016, 182, 260–263. [Google Scholar] [CrossRef]
- Kaseem, M.; Ko, Y. Electrochemical response of Al2O3-MoO2-TiO2 oxide films formed on 6061 Al alloy by plasma electrolytic oxidation. J. Electrochem. Soc. 2016, 163, C587–C592. [Google Scholar] [CrossRef]
- Kaseem, M.; Ko, Y.G. Formation of flower-like structures for optimizing the corrosion resistance of Mg alloy. Mater. Lett. 2018, 221, 196–200. [Google Scholar] [CrossRef]
- Barati, N.; Yerokhin, A.; Golestanifard, F.; Rastegari, S.; Meletis, E. Alumina-zirconia coatings produced by plasma electrolytic oxidation on Al alloy for corrosion resistance improvement. J. Alloys Compd. 2017, 724, 435–442. [Google Scholar] [CrossRef]
- Kaseem, M.; Hussain, T.; Rehman, Z.U.; Banisalman, M.; Ko, Y. Advantage of an in-situ reactive incorporation over direct particles incorporation of V2O5 for a competitive plasma electrolysis coating. Surf. Coat. Technol. 2020, 399, 126200. [Google Scholar] [CrossRef]
- Liu, T.; Liu, Y.; Ye, Y.; Li, J.; Yang, F.; Zhao, H.; Wang, L. Corrosion protective properties of epoxy coating containing tetraaniline modified nano-α-Fe2O3. Prog. Org. Coat. 2019, 132, 455–467. [Google Scholar] [CrossRef]
- Dhoke, S.; Khanna, A. Effect of nano-Fe2O3 particles on the corrosion behavior of alkyd based waterborne coatings. Corros. Sci. 2009, 51, 6–20. [Google Scholar] [CrossRef]
- Kim, Y.; Kim, G.; Ko, Y.; Shin, D. Photocatalytic activity of TiO2 film containing Fe2O3 via plasma electrolytic oxidation. Surf. Eng. 2016, 32, 442–447. [Google Scholar] [CrossRef]
- Fatimah, S.; Kamil, M.; Kwon, J.; Kaseem, M.; Ko, Y. Dual incorporation of SiO2 and ZrO2 nanoparticles into the oxide layer on 6061 Al alloy via plasma electrolytic oxidation: Coating structure and corrosion properties. J. Alloys. Compd. 2017, 707, 358–364. [Google Scholar] [CrossRef]
- Vakili-Azghandi, M.; Fattah-Alhosseini, A. Effects of Duty Cycle, Current Frequency, and Current Density on Corrosion Behavior of the Plasma Electrolytic Oxidation Coatings on 6061 Al Alloy in Artificial Seawater. Metall. Mater. Trans. A 2017, 48, 4681–4692. [Google Scholar] [CrossRef]
- Kaseem, M.; Zehra, T.; Hussain, T.; Ko, Y.; Fattah-Alhosseini, A. Electrochemical response of MgO/Co3O4 oxide layers produced by plasma electrolytic oxidation and post treatment using cobalt nitrate. J. Magn. Alloys. 2022, 30, 749–778. [Google Scholar] [CrossRef]
- Fattah-Alhosseini, A.; Chaharmahali, R.; Keshavarz, M.; Babaei, K. Surface characterization of bioceramic coatings on Zr and its alloys using plasma electrolytic oxidation (PEO): A review. Surf. Interfaces 2021, 25, 101283. [Google Scholar] [CrossRef]
- Kaseem, M.; Zehra, T.; Dikici, B.; Dafali, A.; Fattah-Alhosseini, A. A novel dual-functional layer exhibiting exceptional protection and photocatalytic activity by organic functionalization of plasma electrolyzed layer. J. Magnes. Alloys 2022. [Google Scholar] [CrossRef]
- Kamil, M.; Kaseem, M.; Ko, Y. Soft plasma electrolysis with complex ions for optimizing electrochemical performance. J. Sci. Rep. 2017, 7, 44458. [Google Scholar] [CrossRef] [PubMed]
- Kaseem, M.; Ko, Y. On the compactness of the oxide layer induced by utilizing a porosification agent. Appl. Surf. Sci. 2019, 473, 715–725. [Google Scholar] [CrossRef]
- Li, L.; Hussain, S.; Jia, L.; Lin, D.; Yin, X.; Lin, Y.; Cheng, Z.; Wang, L. FeS2/carbon hybrids on carbon cloth: A highly efficient and stable counter electrode for dyesensitized solar cells. Sustain. Energy Fuels 2019, 3, 1749. [Google Scholar] [CrossRef]
- Yang, S.; Song, X.; Zhang, P.; Sun, J.; Gao, L. Self-assembled α-Fe2O3 mesocrystals/graphene nanohybrid for enhanced electrochemical capacitors. Small 2014, 10, 2270–2279. [Google Scholar] [CrossRef]
- Stern, M.; Geary, A. A theoretical analysis of the shape of polarization curves. J. Electrochem. Soc. 1957, 104, 56–63. [Google Scholar] [CrossRef]
- Fattah-Alhosseini, A.; Chaharmahali, R. Enhancing Corrosion and Wear Performance of PEO Coatings on Mg Alloys using Graphene and Graphene Oxide Additions: A Review. FlatChem 2021, 27, 100241. [Google Scholar] [CrossRef]
- Babaei, K.; Fattah-Alhosseini, A.; Molaei, M. The Effects of Carbon-Based Additives on Corrosion and Wear Properties of Plasma Electrolytic Oxidation (PEO) Coatings Applied on Aluminum and its Alloys: A review. Surf. Interfaces 2020, 21, 100677. [Google Scholar] [CrossRef]
- Vakili-Azghandi, M.; Fattah-Alhosseini, A.; Keshavarz, M. Effects of Al2O3 nano-particles on corrosion performance of plasma electrolytic oxidation coatings formed on 6061 aluminum alloy. J. Mater. Eng. Perform. 2016, 25, 5302–5313. [Google Scholar] [CrossRef]
- Kaseem, M.; Yang, H.; Ko, Y. Toward a nearly defect-free coating via high-energy plasma sparks. Sci. Rep. 2017, 7, 2378. [Google Scholar] [CrossRef] [PubMed]


Disclaimer/Publisher’s Note: The statements, opinions and data contained in all publications are solely those of the individual author(s) and contributor(s) and not of MDPI and/or the editor(s). MDPI and/or the editor(s) disclaim responsibility for any injury to people or property resulting from any ideas, methods, instructions or products referred to in the content. |
© 2023 by the authors. Licensee MDPI, Basel, Switzerland. This article is an open access article distributed under the terms and conditions of the Creative Commons Attribution (CC BY) license (https://creativecommons.org/licenses/by/4.0/).