
Influence of Laser Direct Energy Deposition Process Parameters on the Structure and Phase Composition of a High-Entropy Alloy FeCoNiCrMn

 ,
,  and
and 
Abstract
:1. Introduction
2. Materials and Methods
3. Results
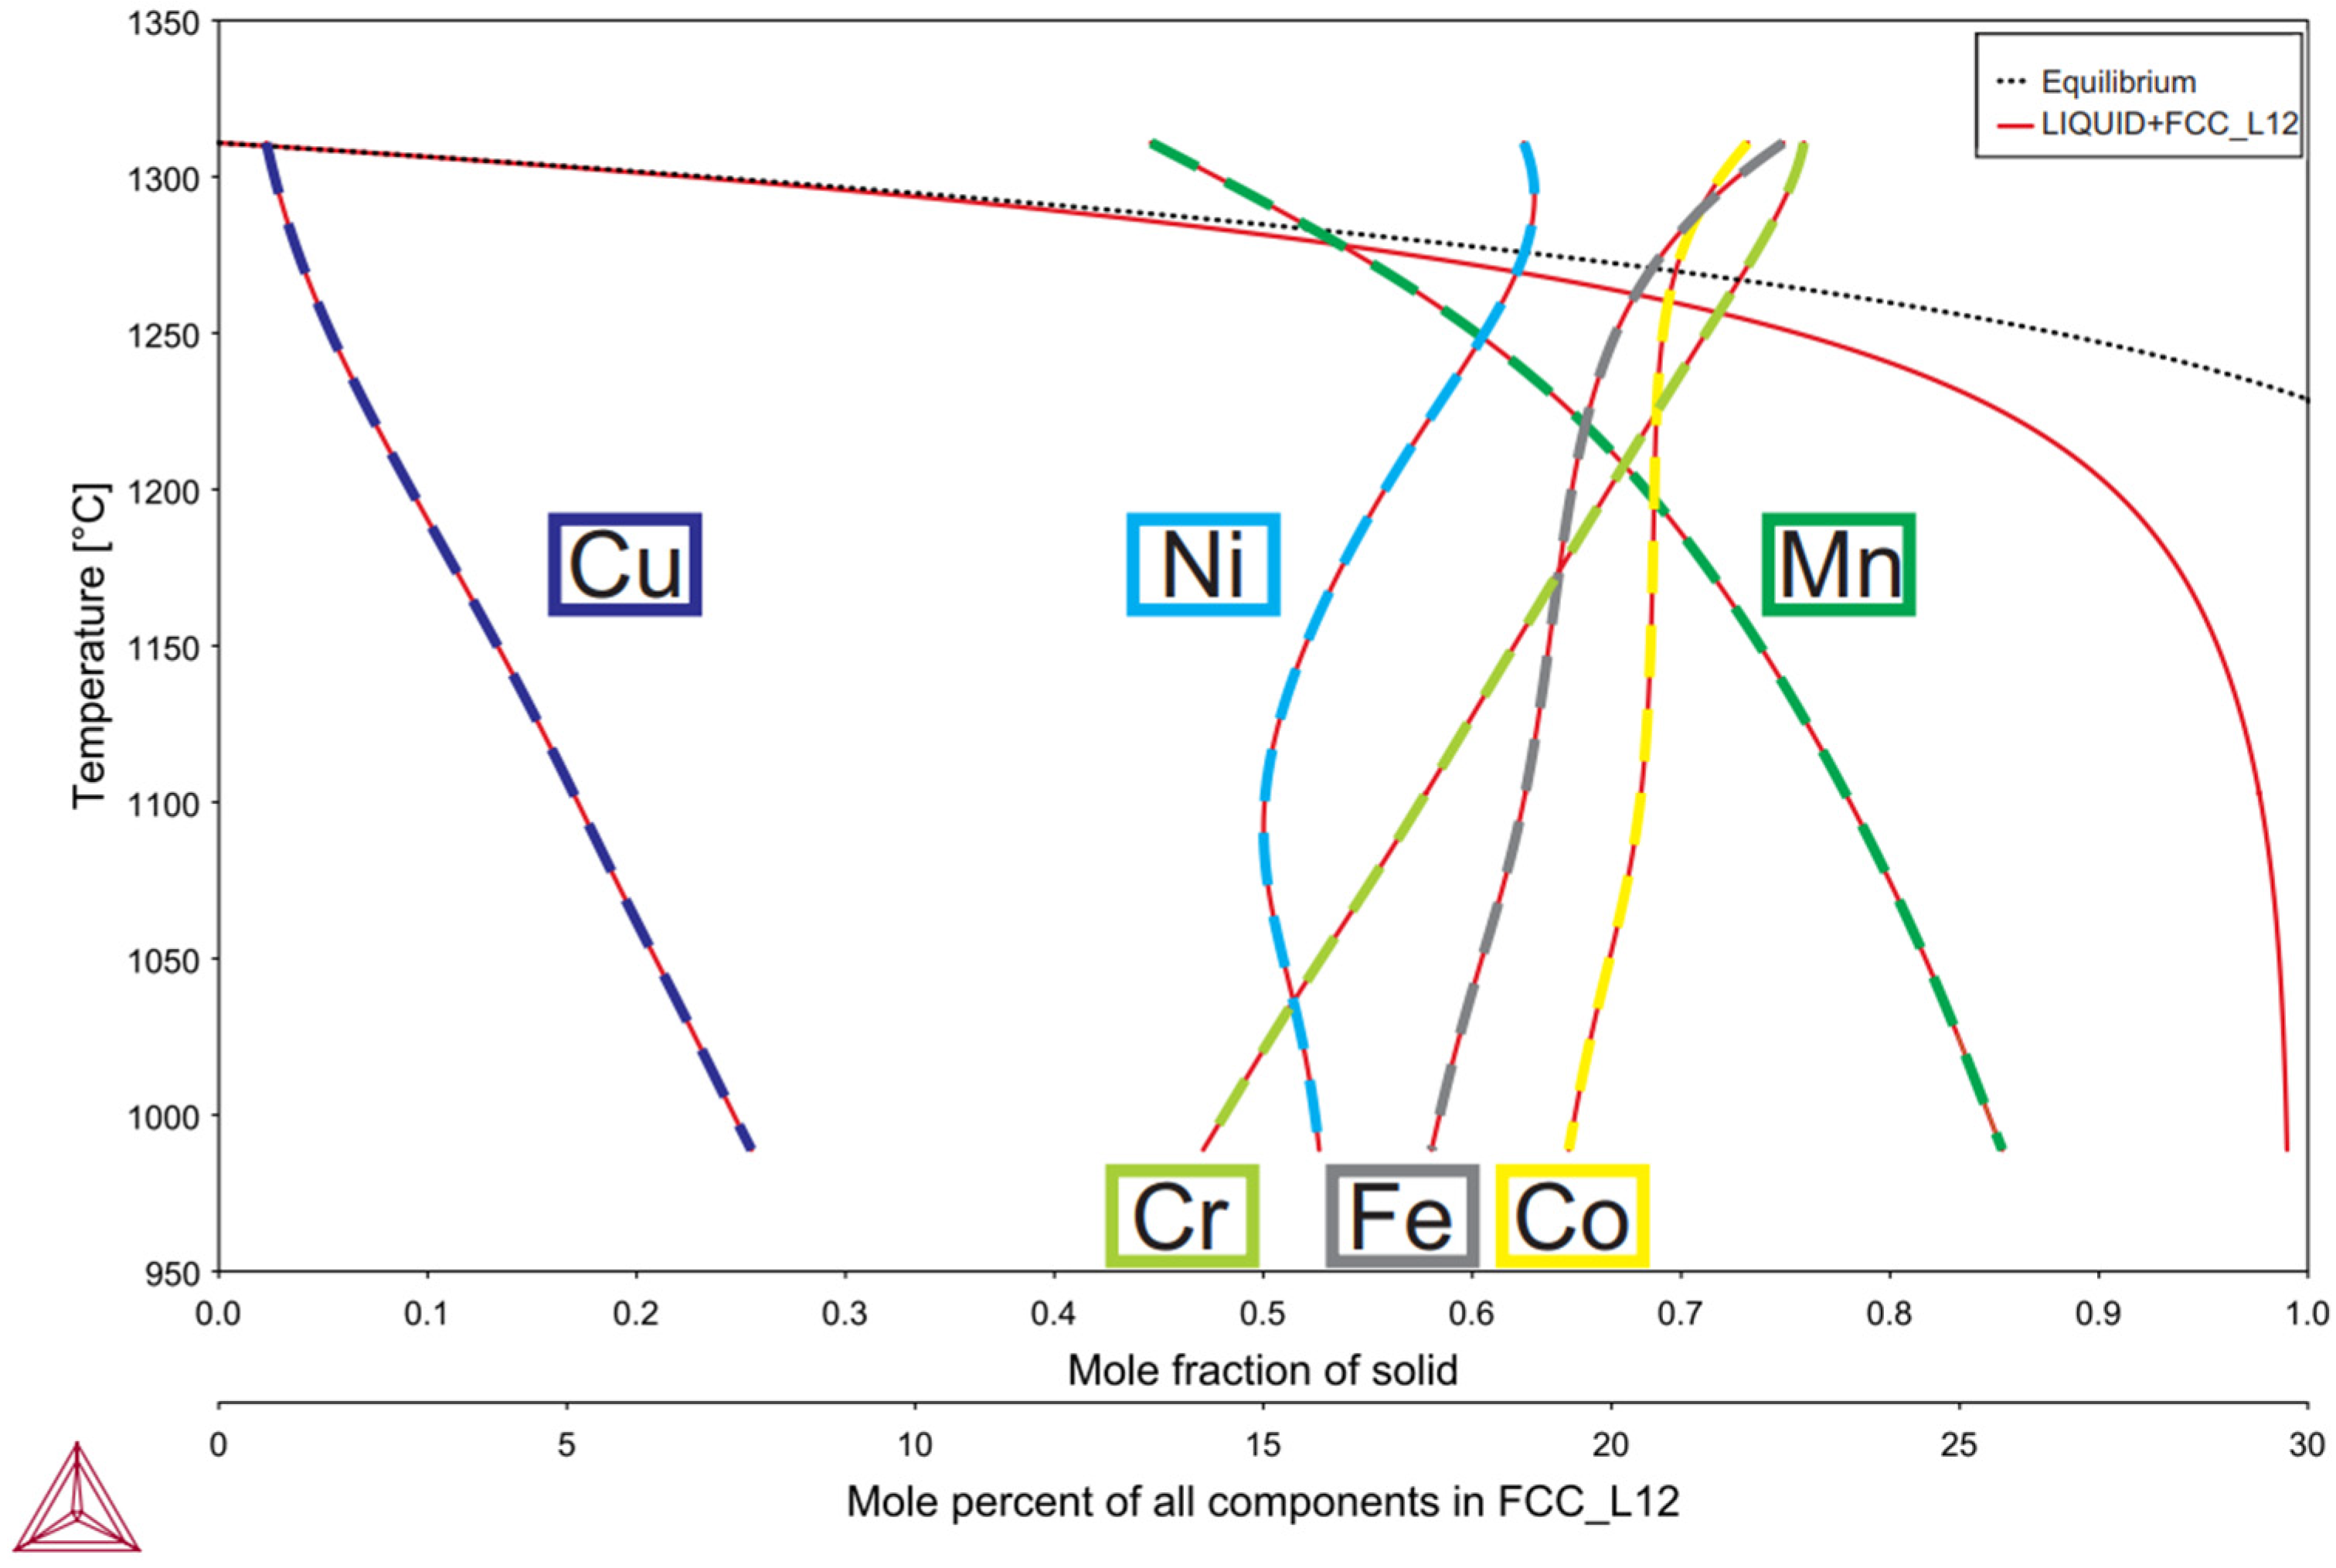
3.1. Modeling
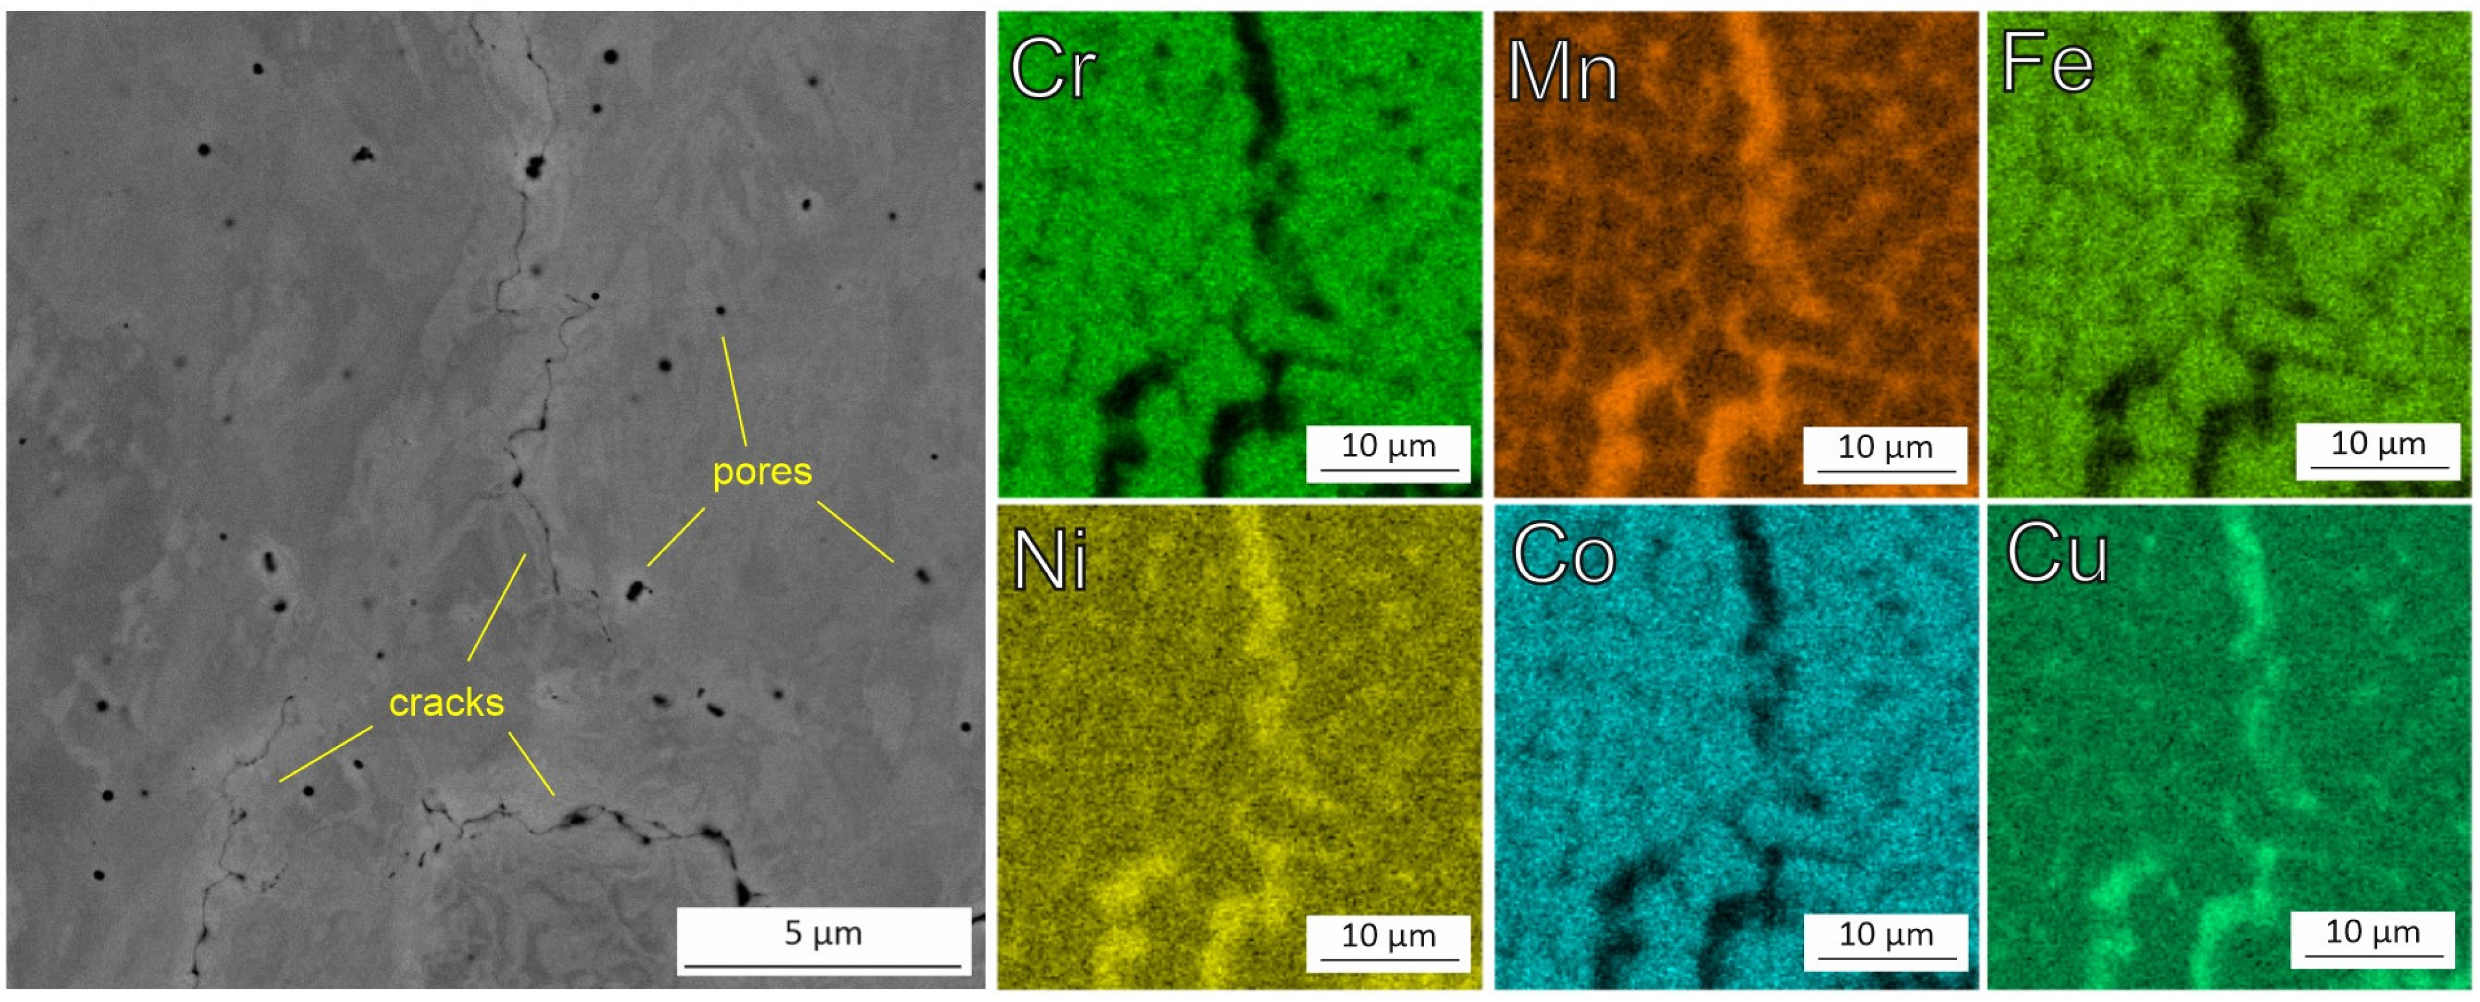
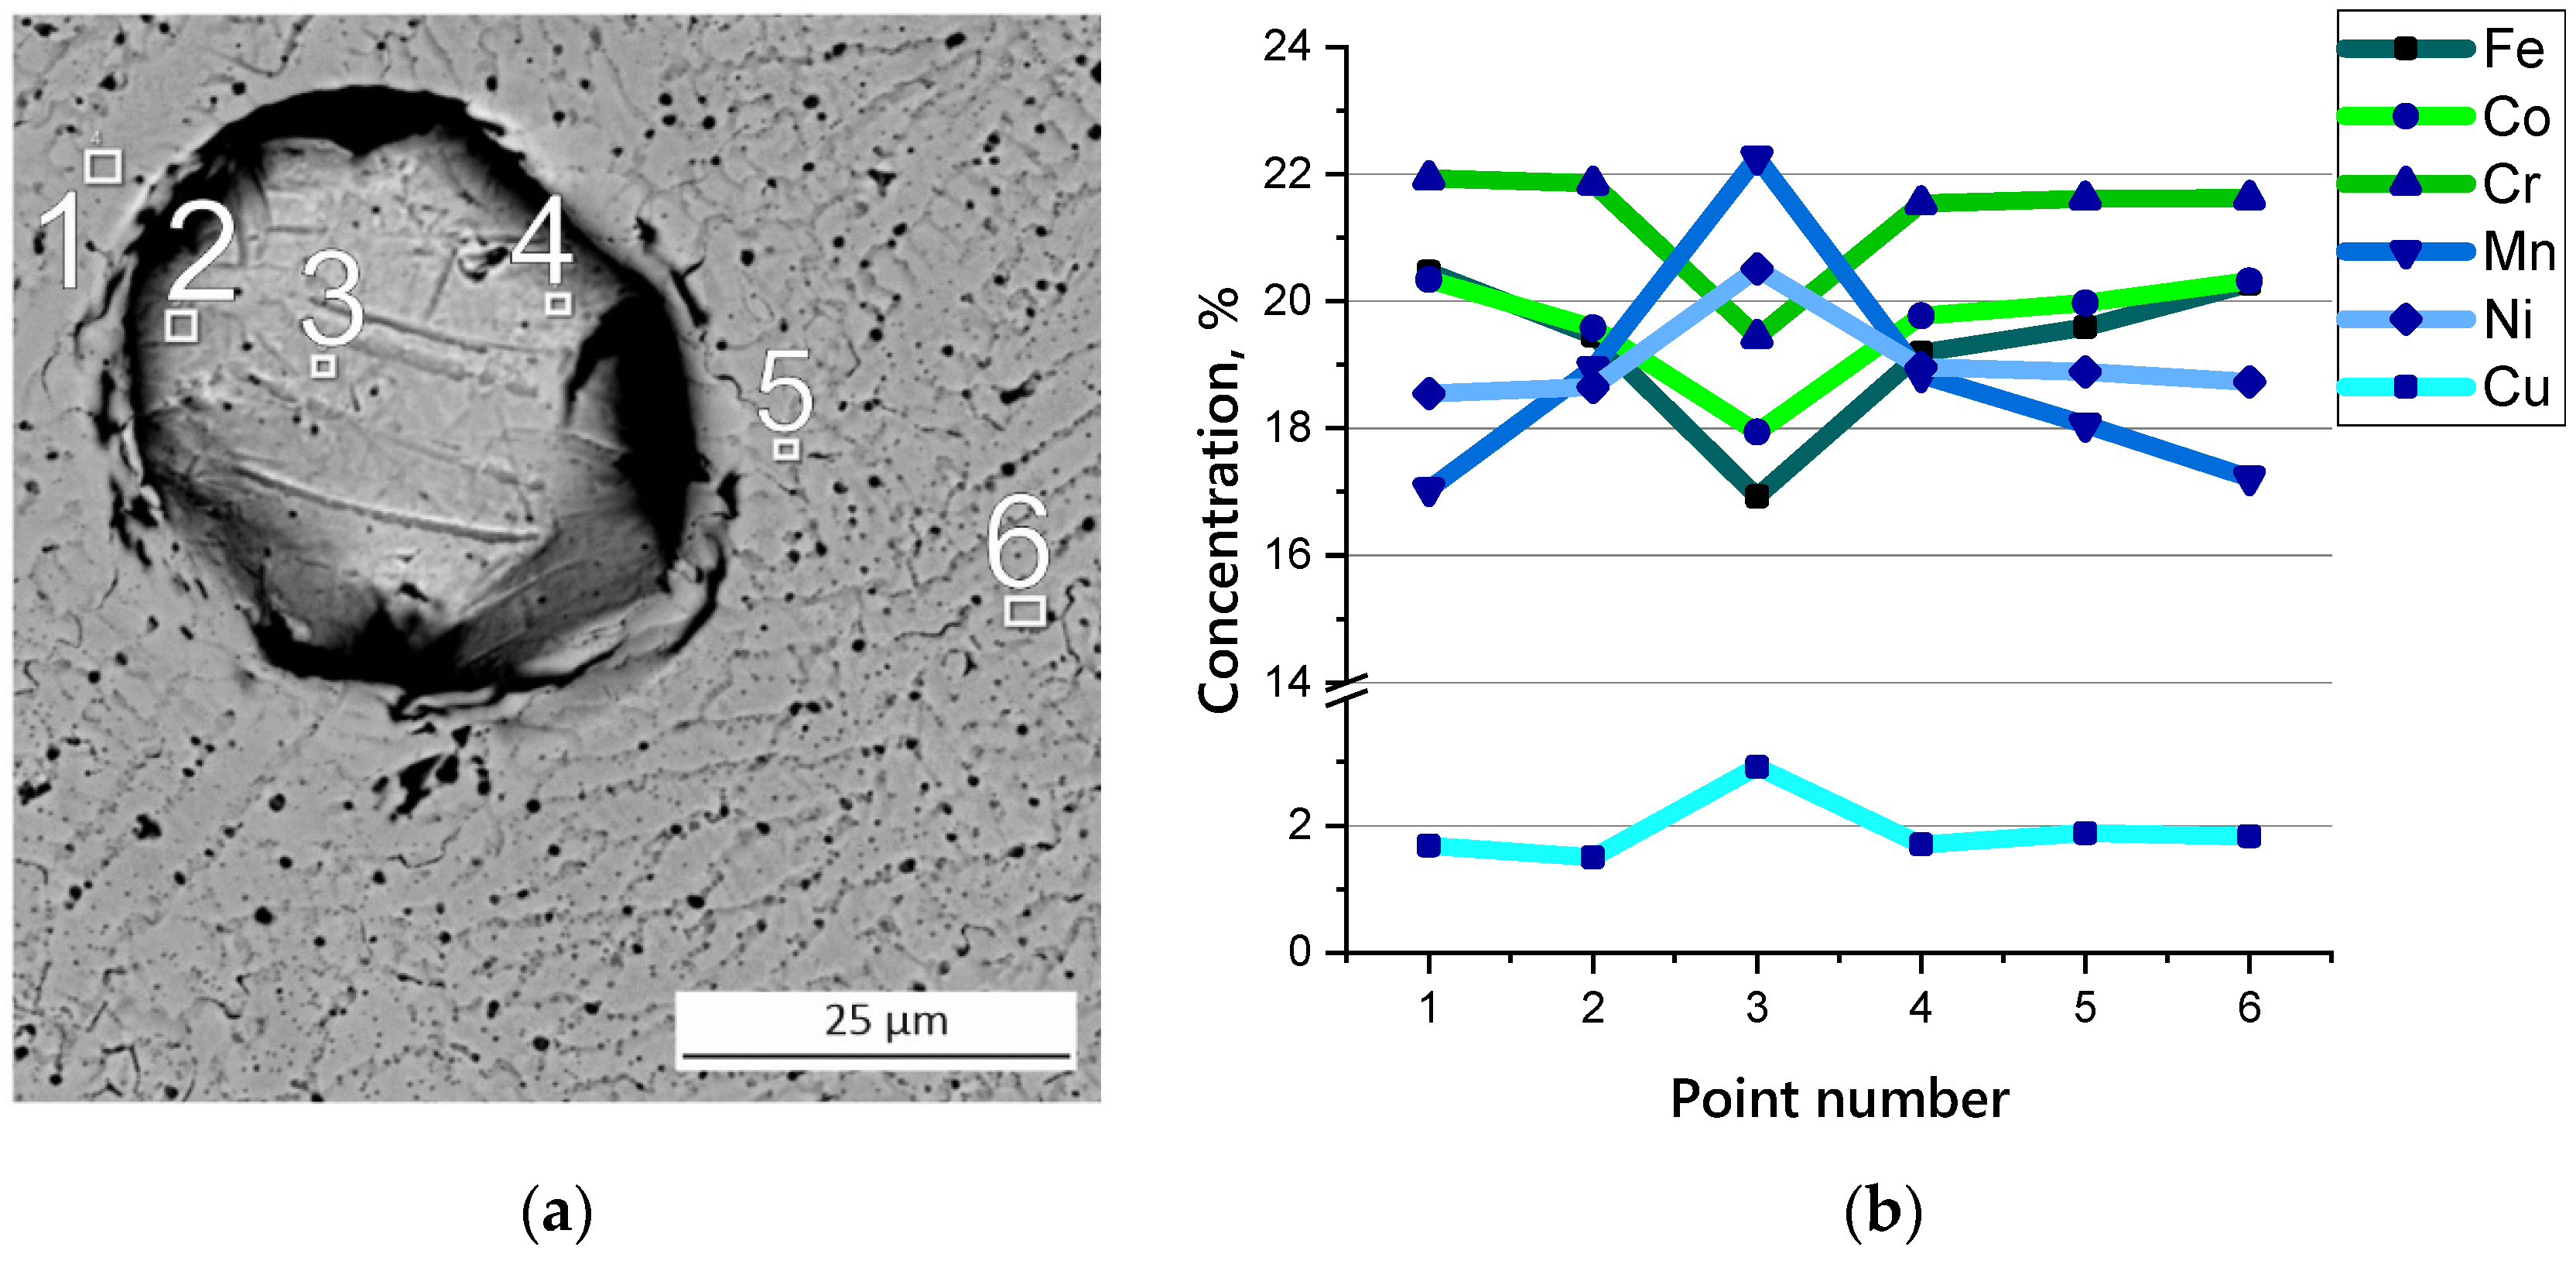
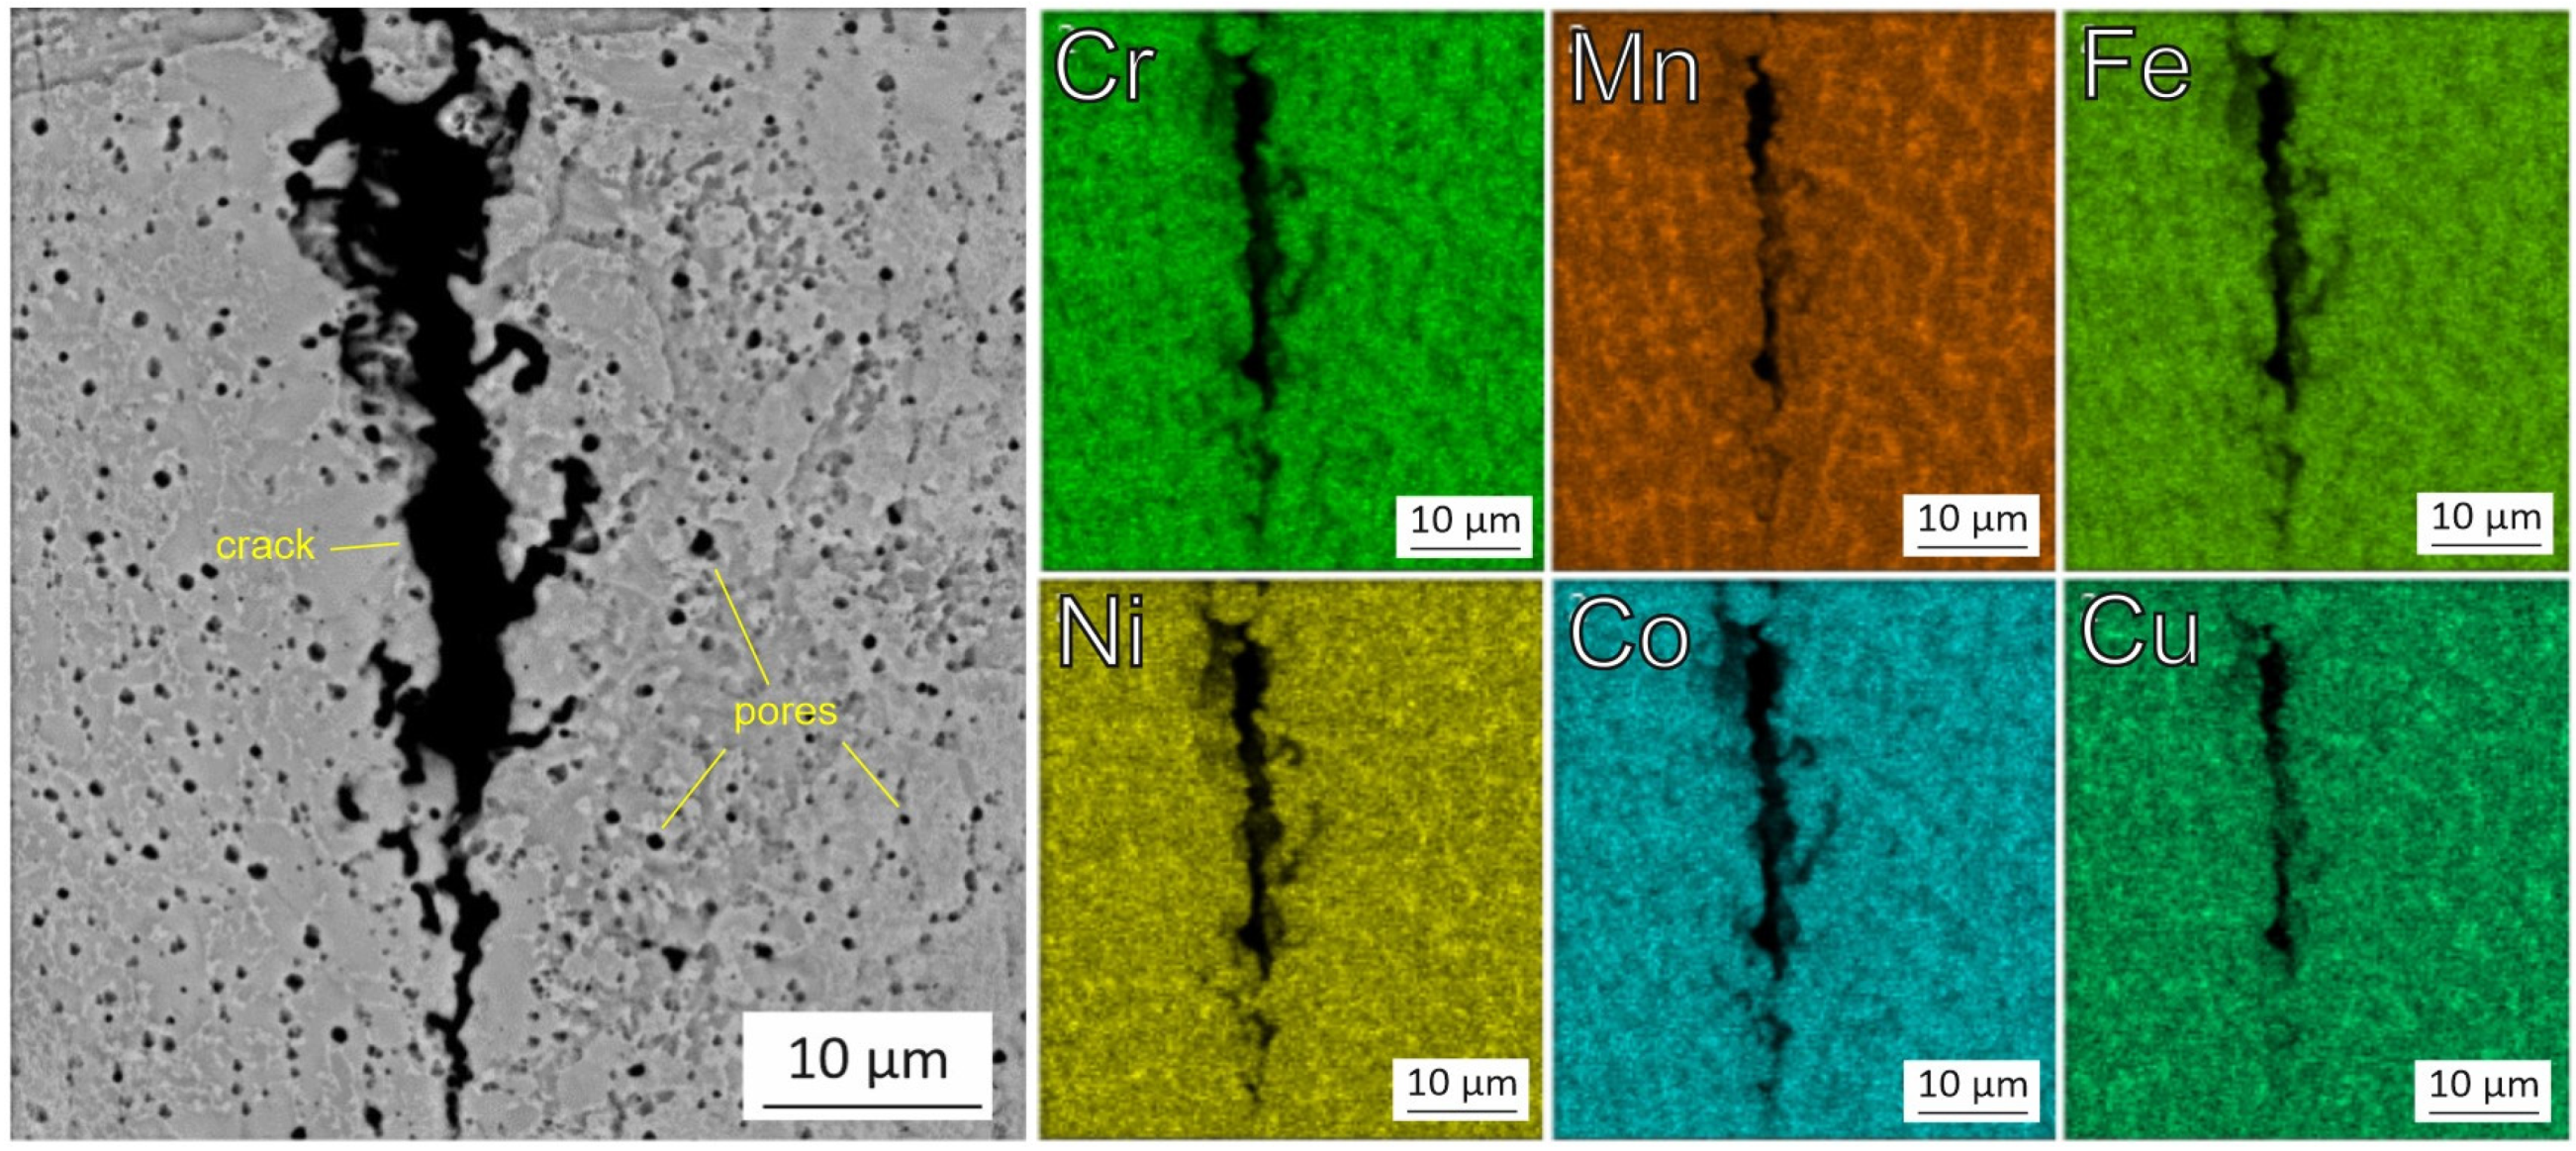
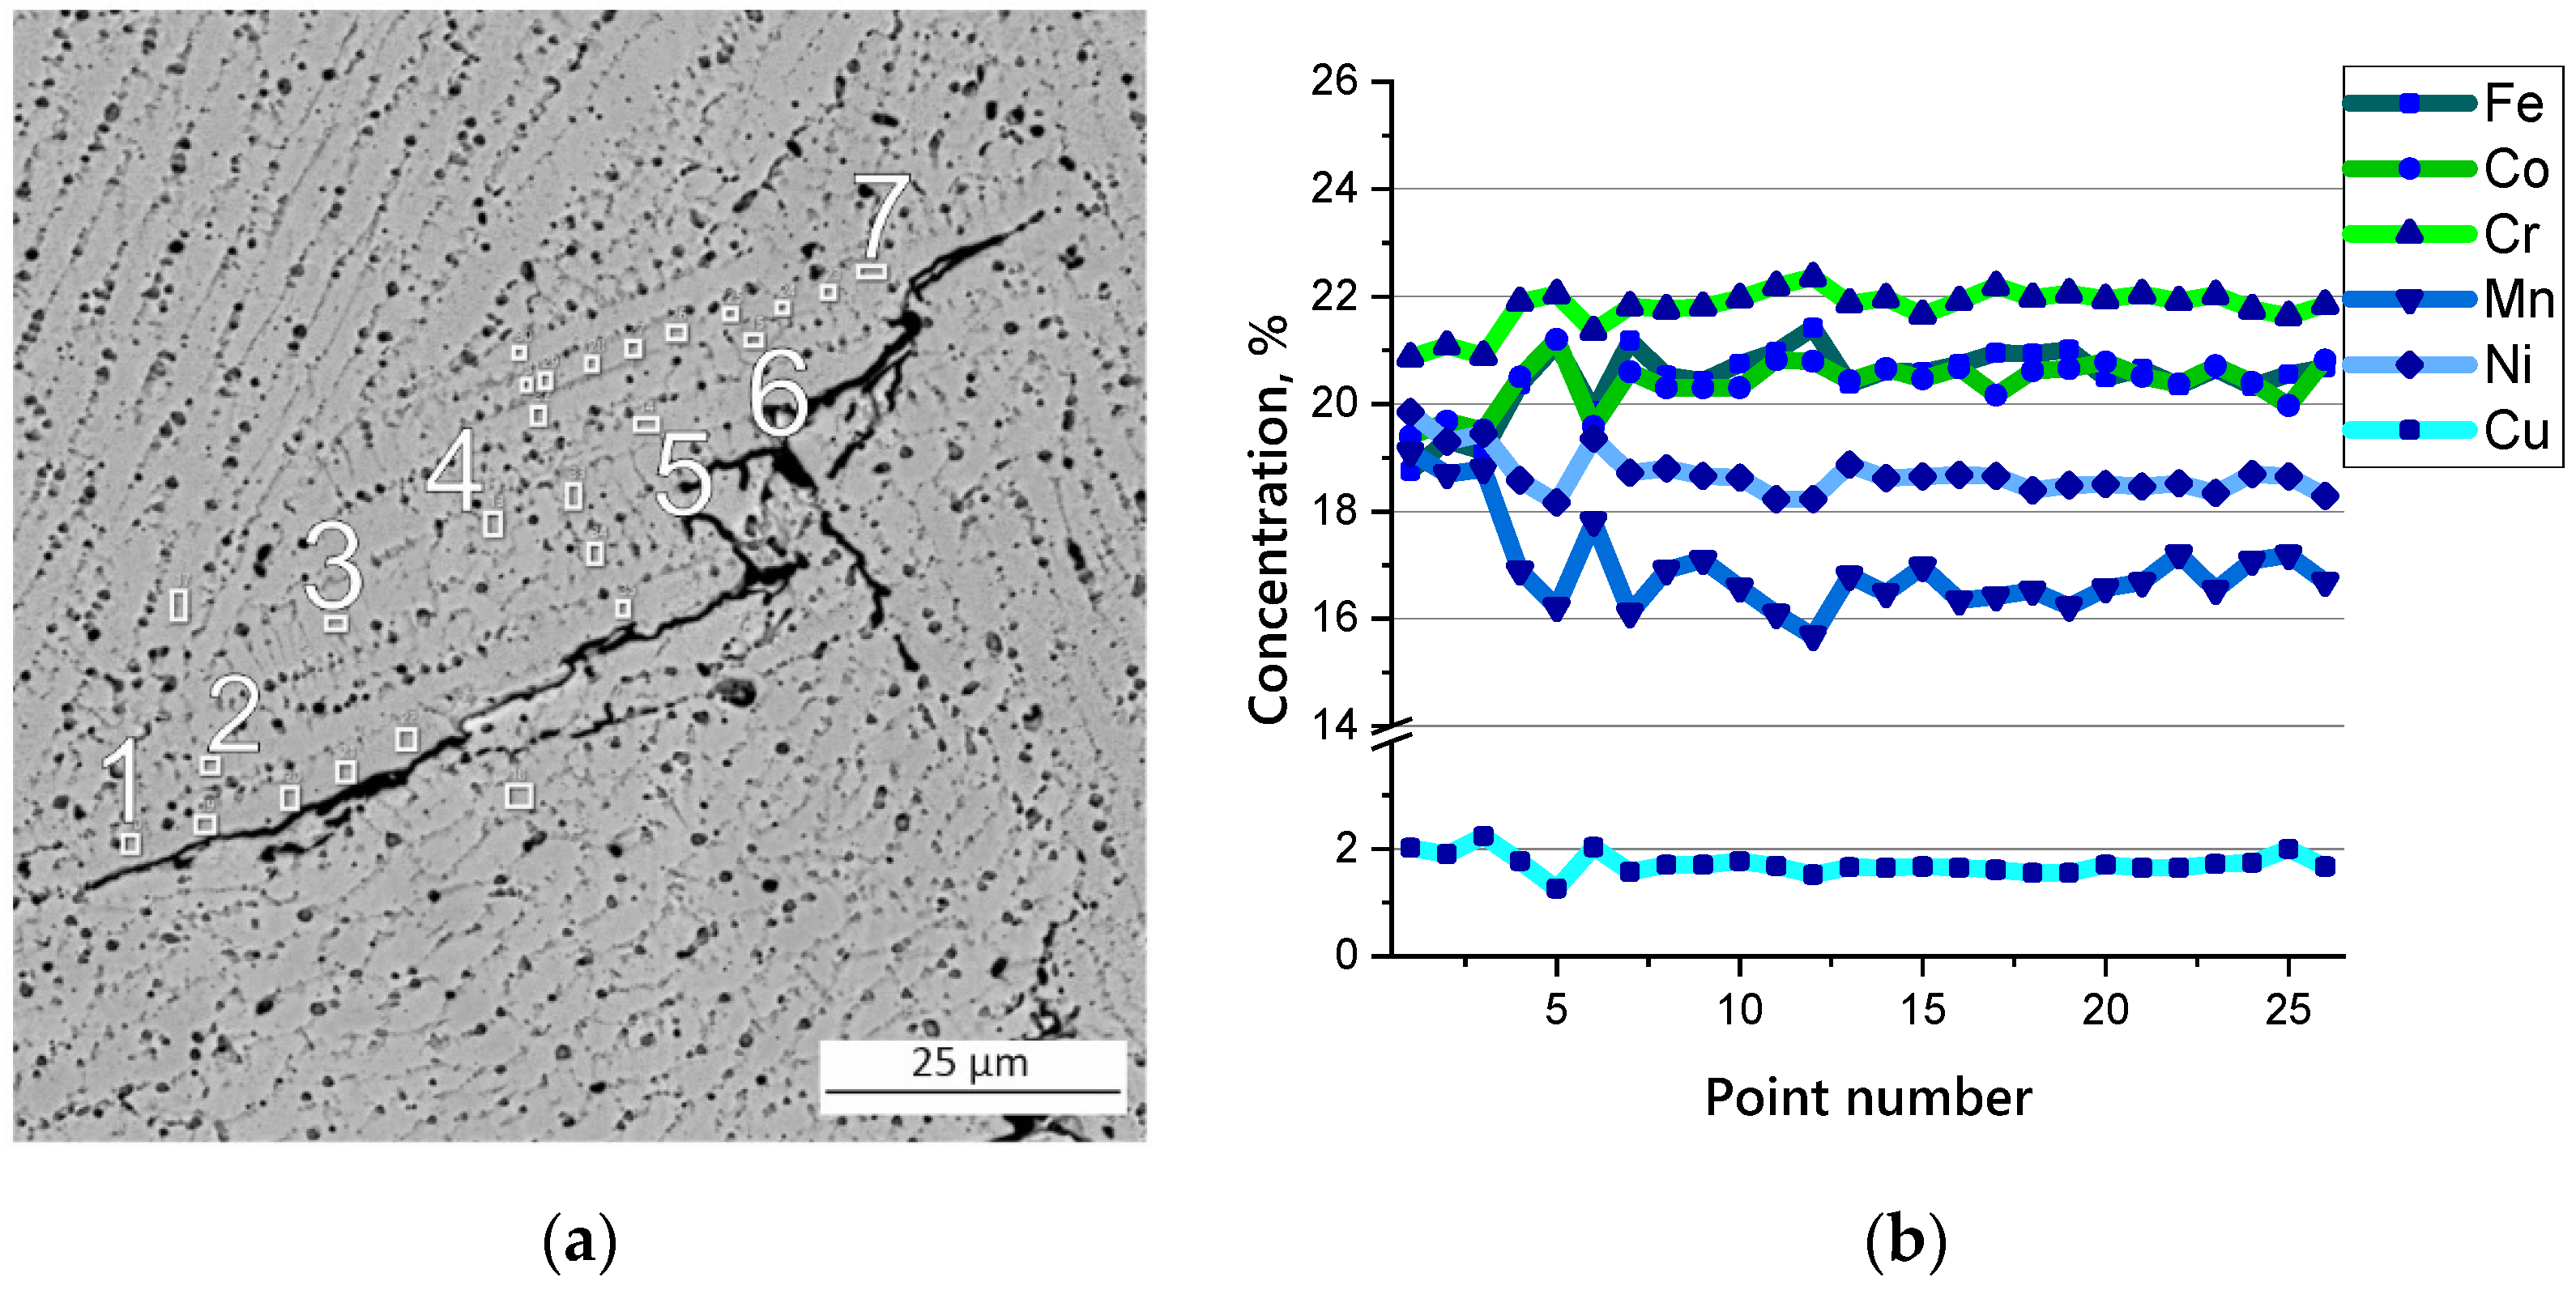
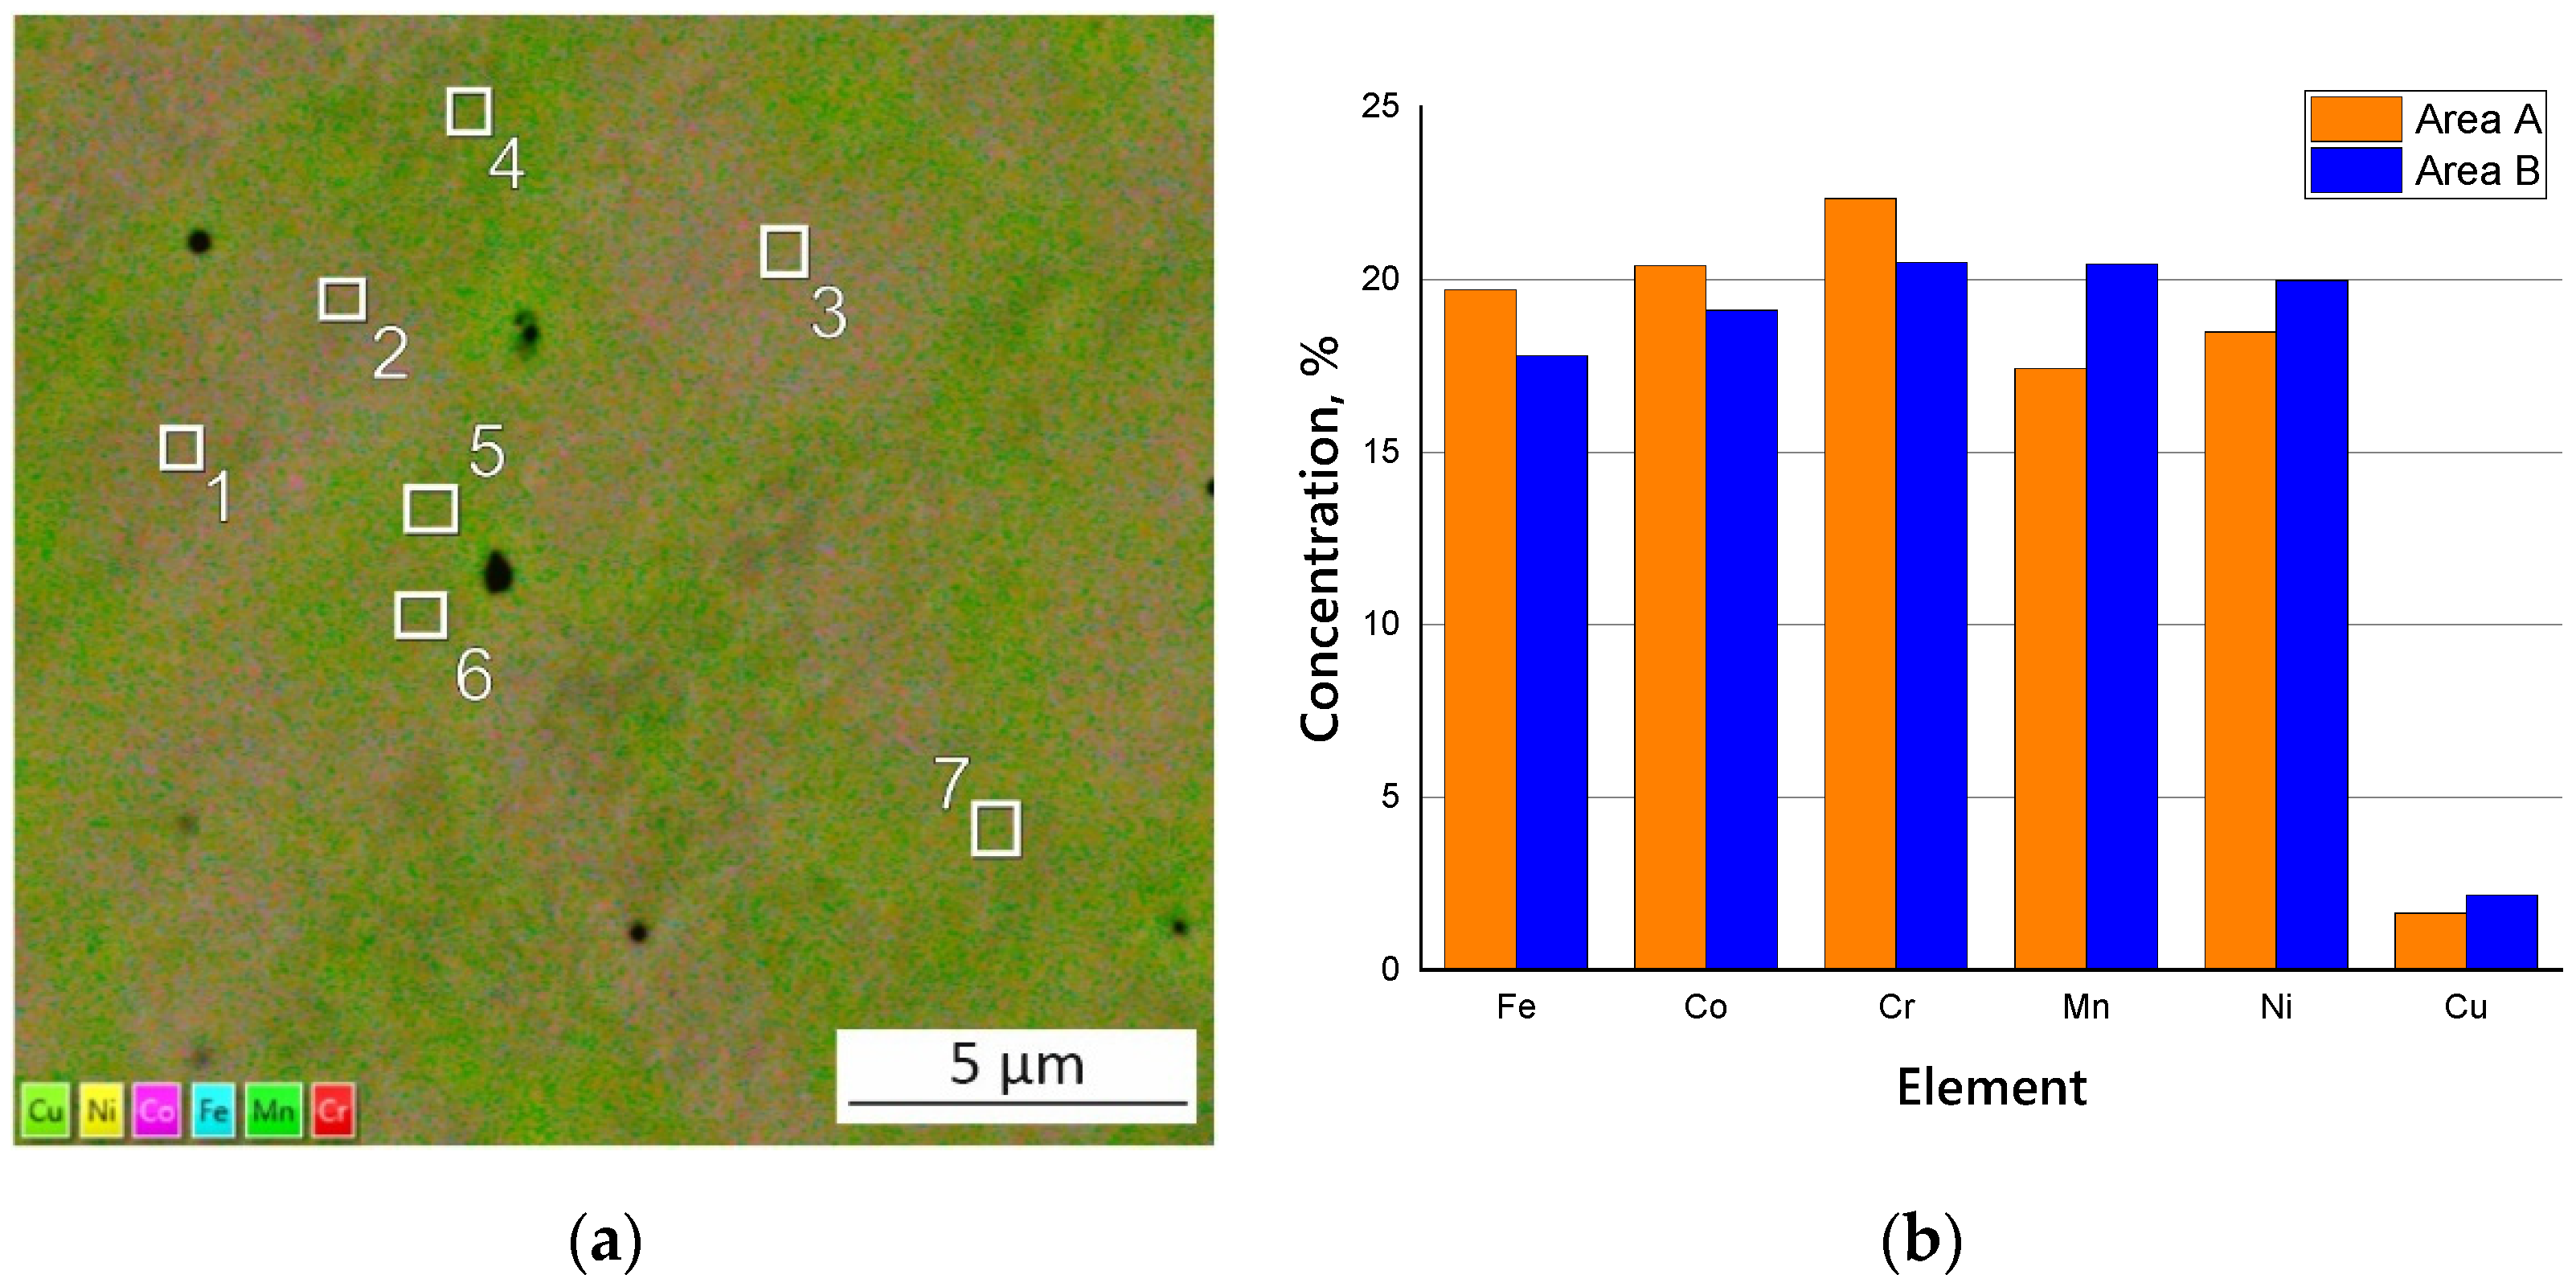
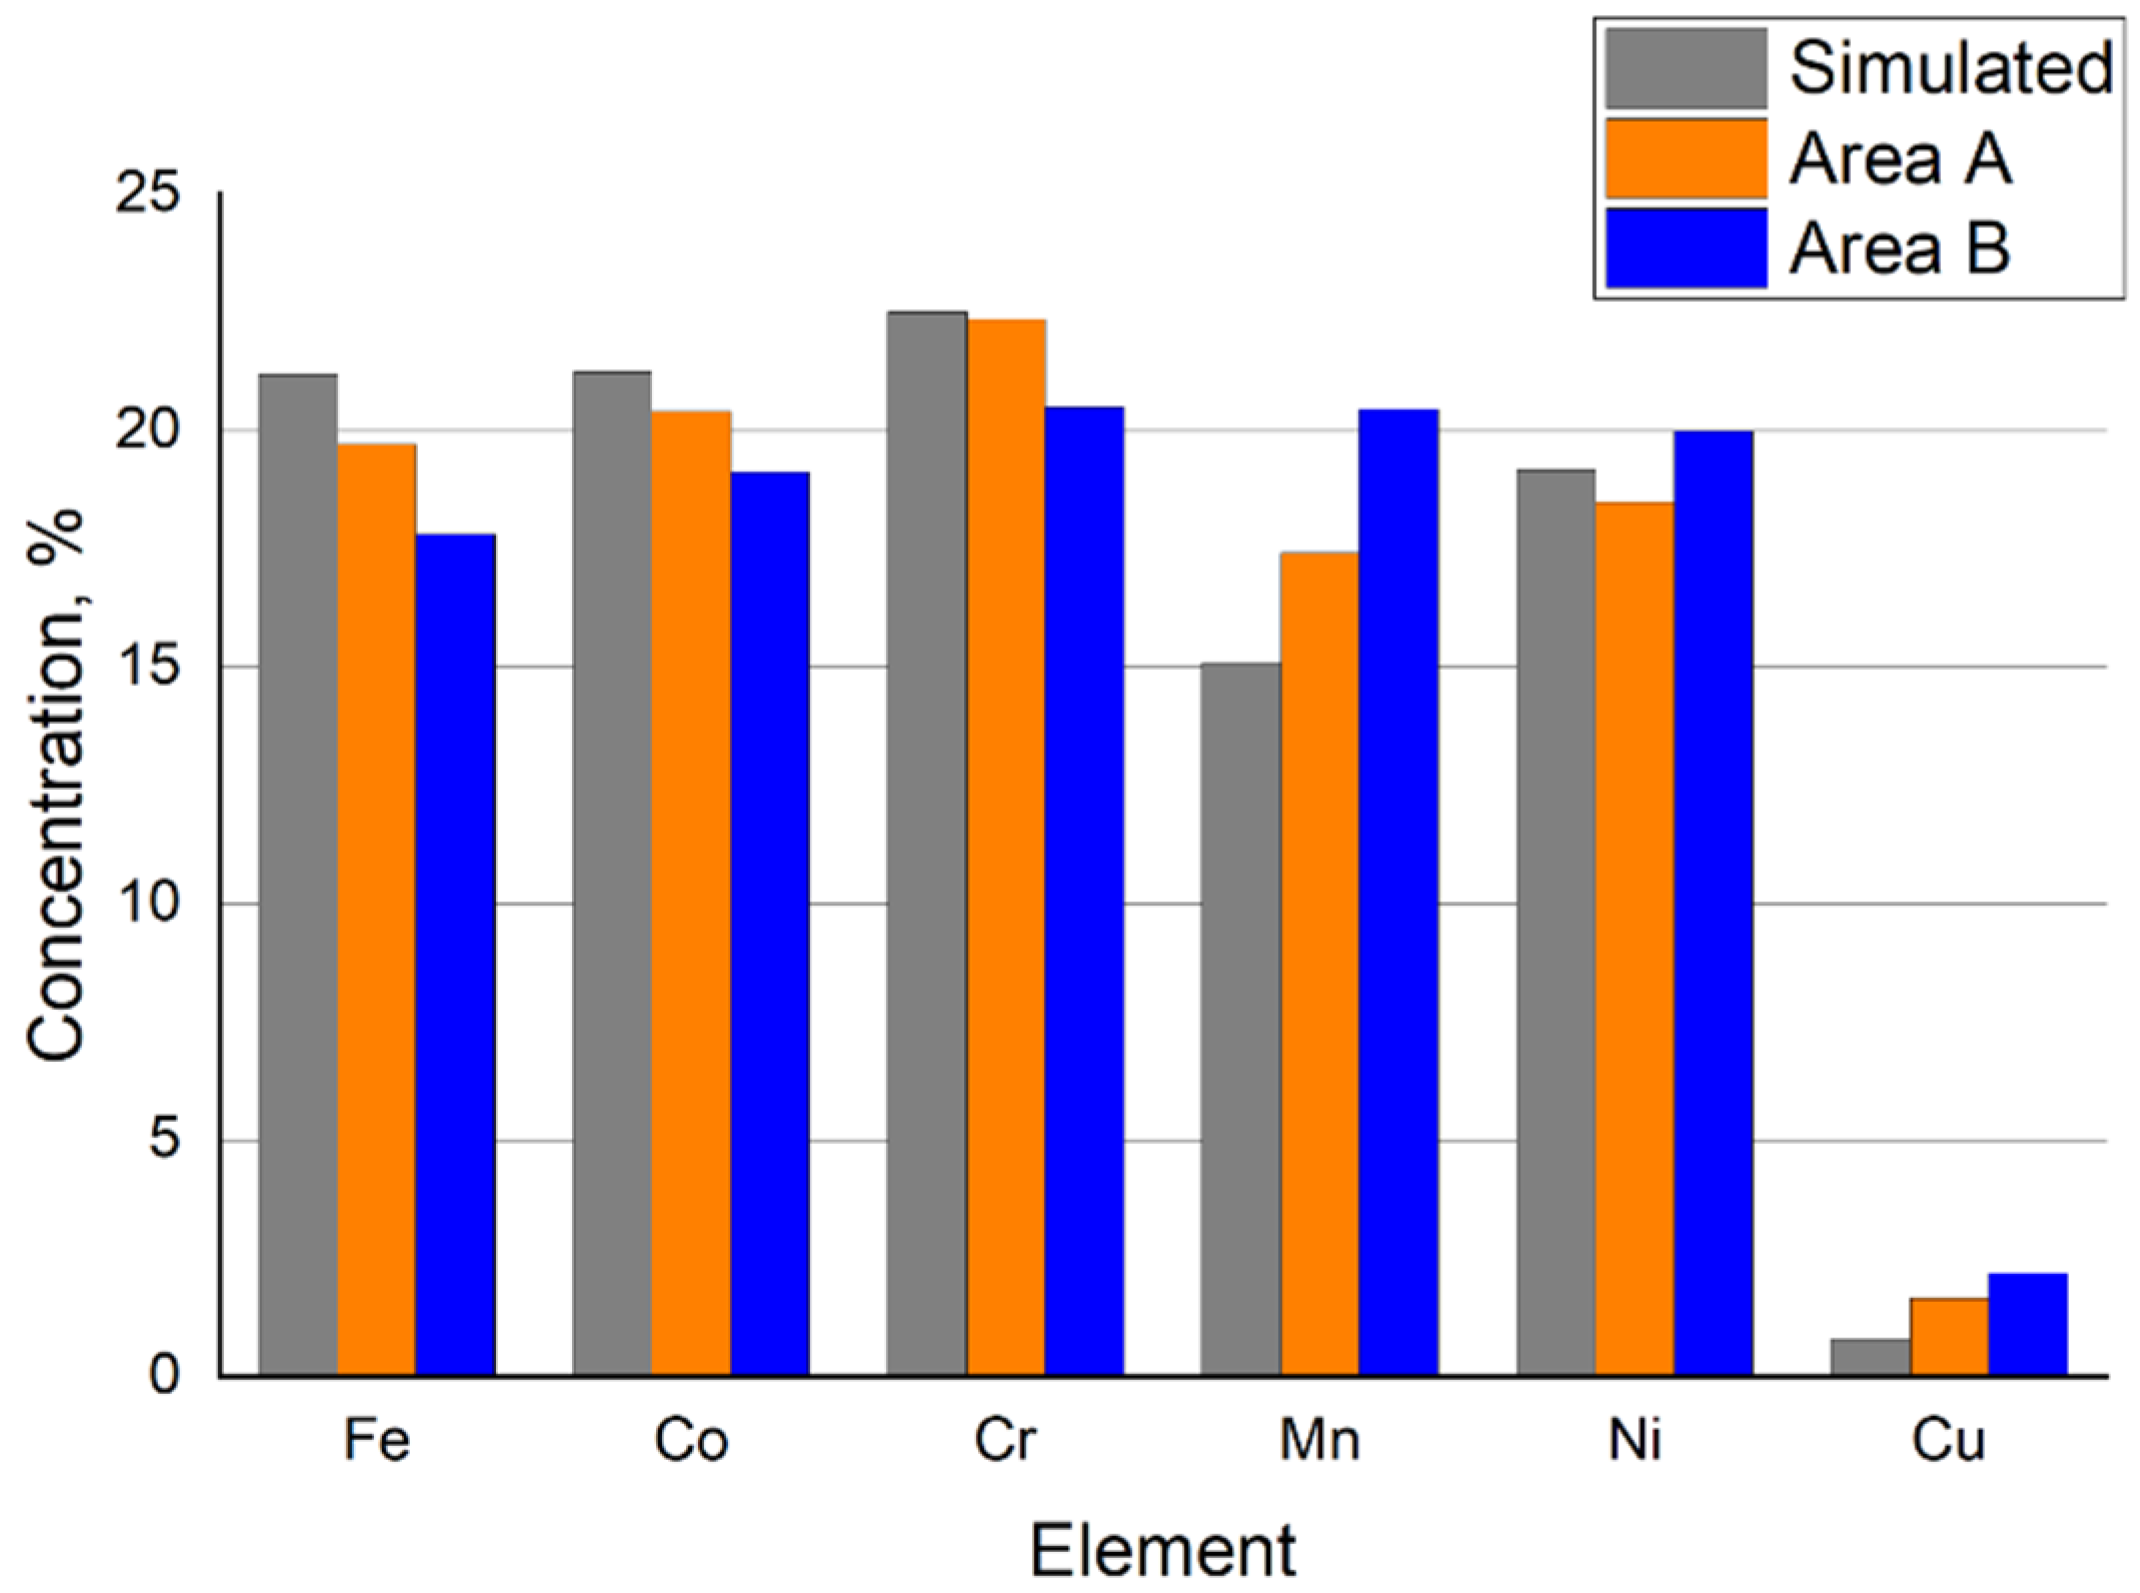
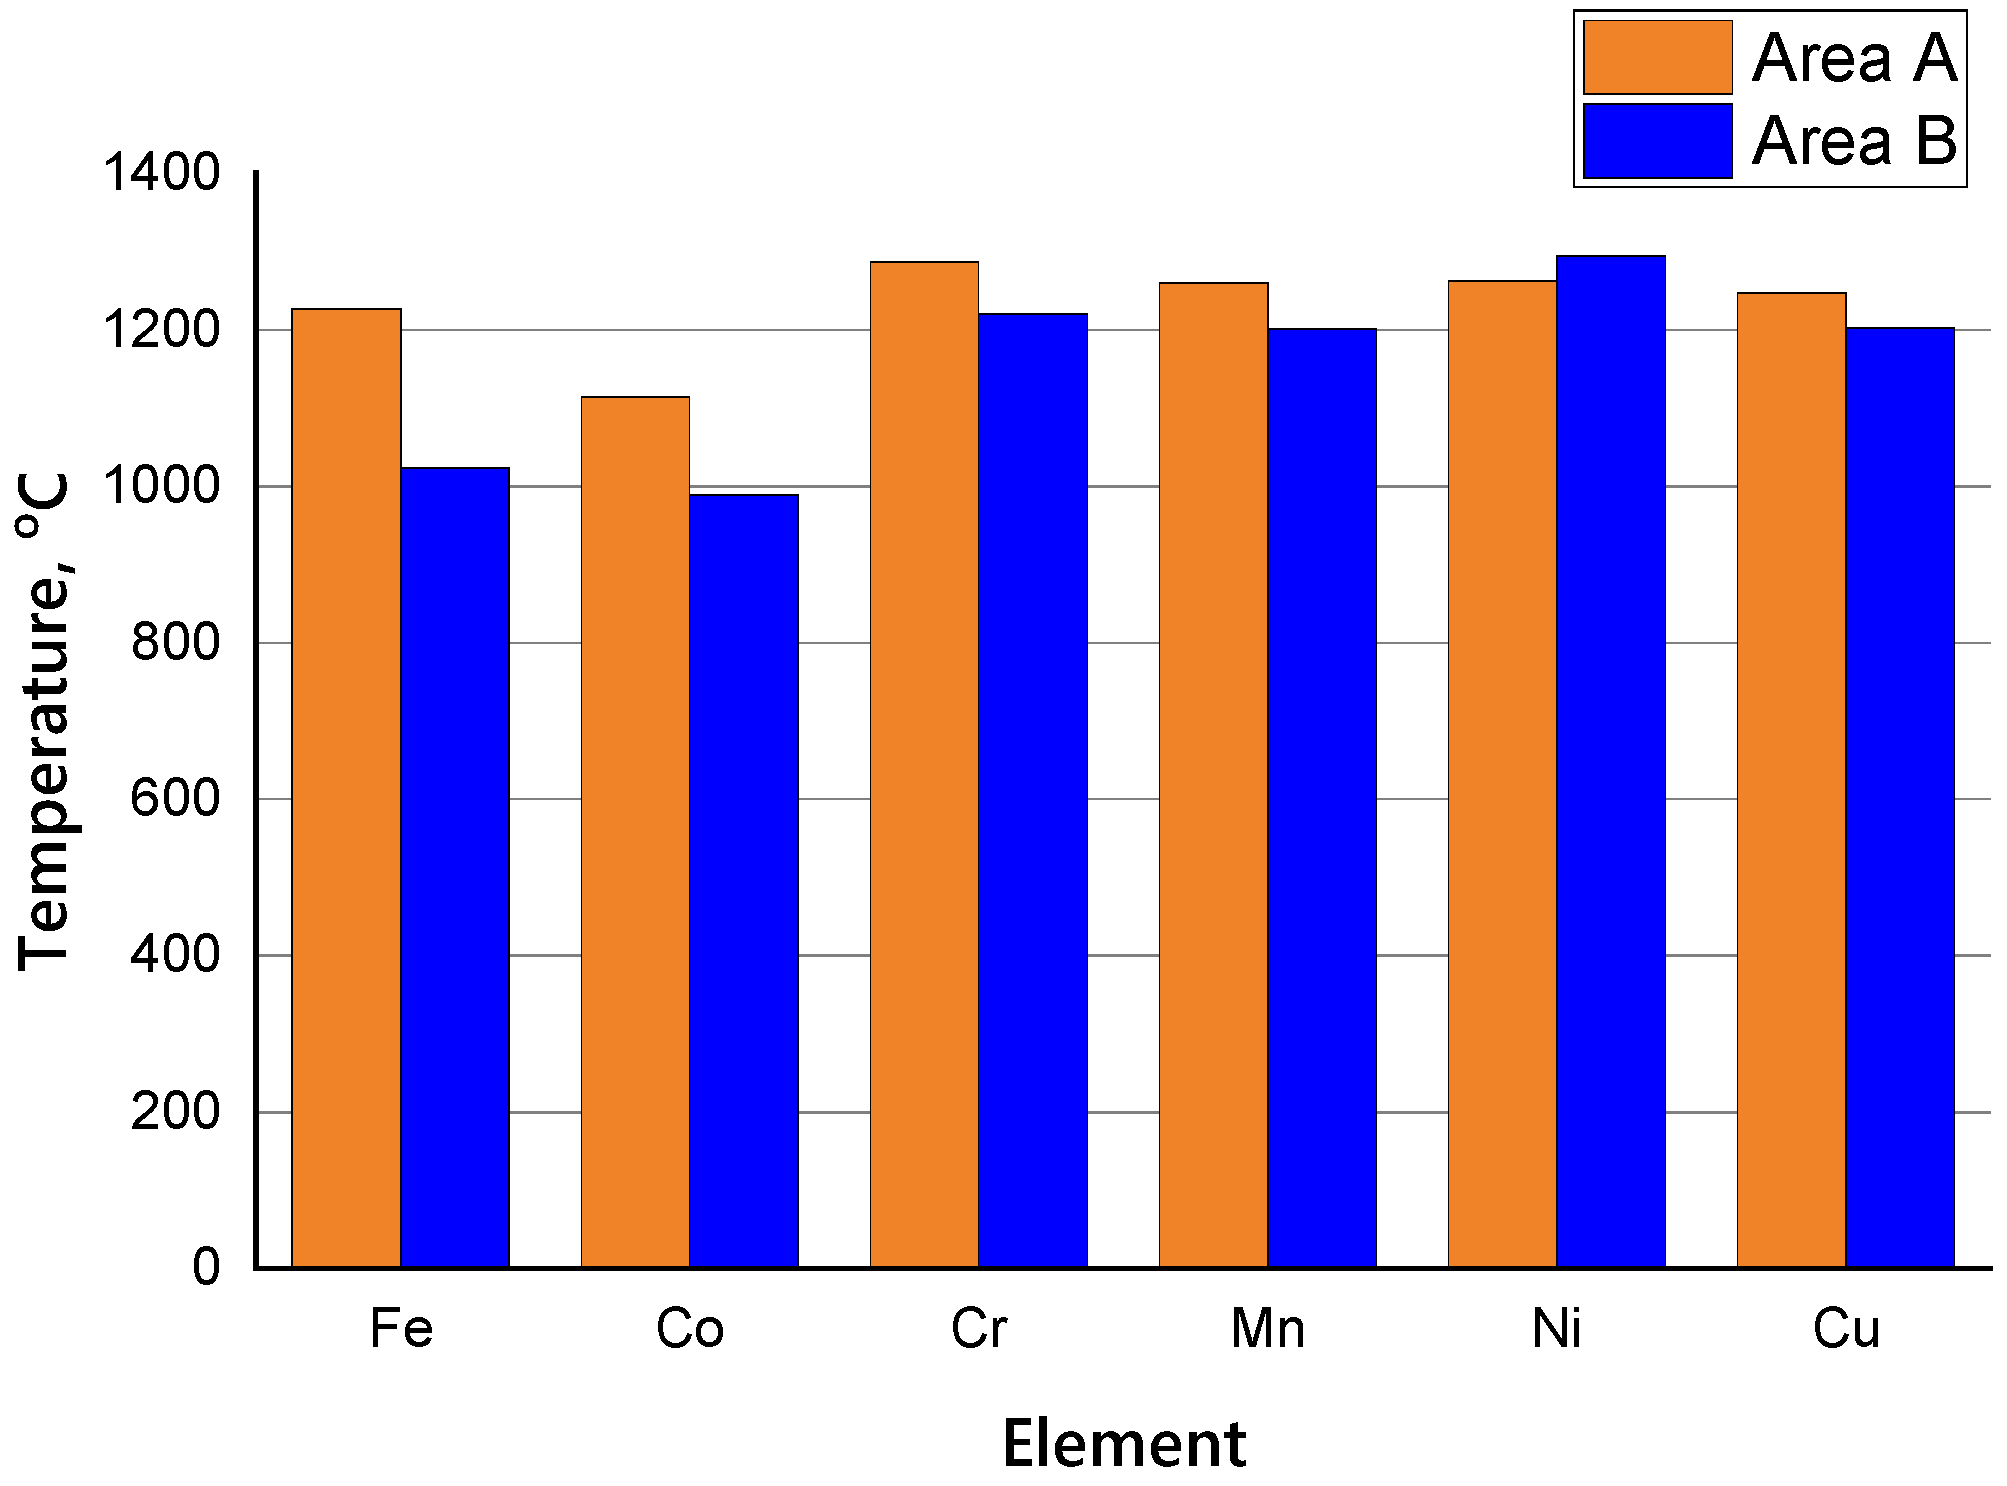
3.2. Microstructure and Chemical Composition of HEA
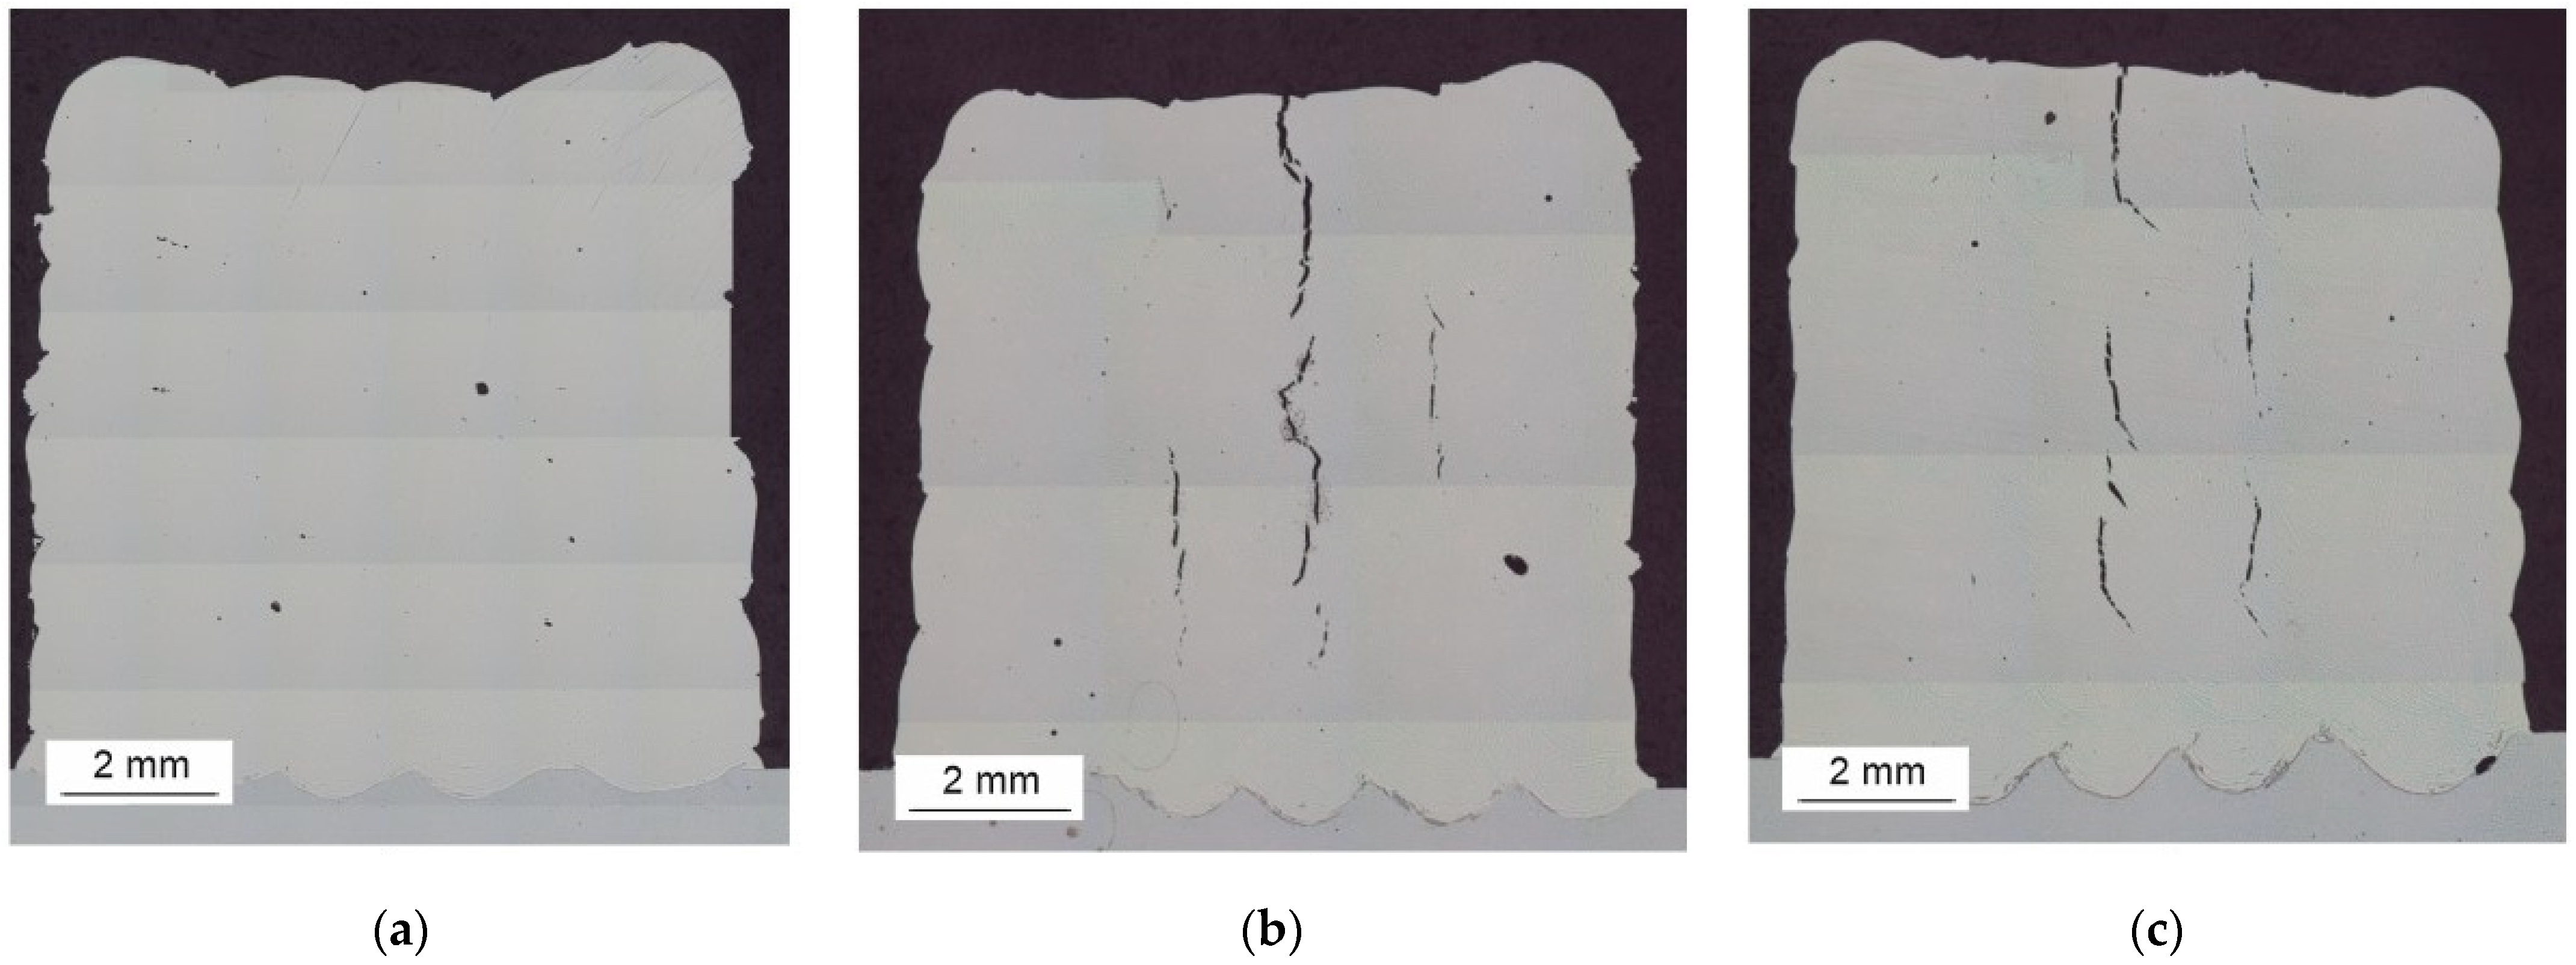
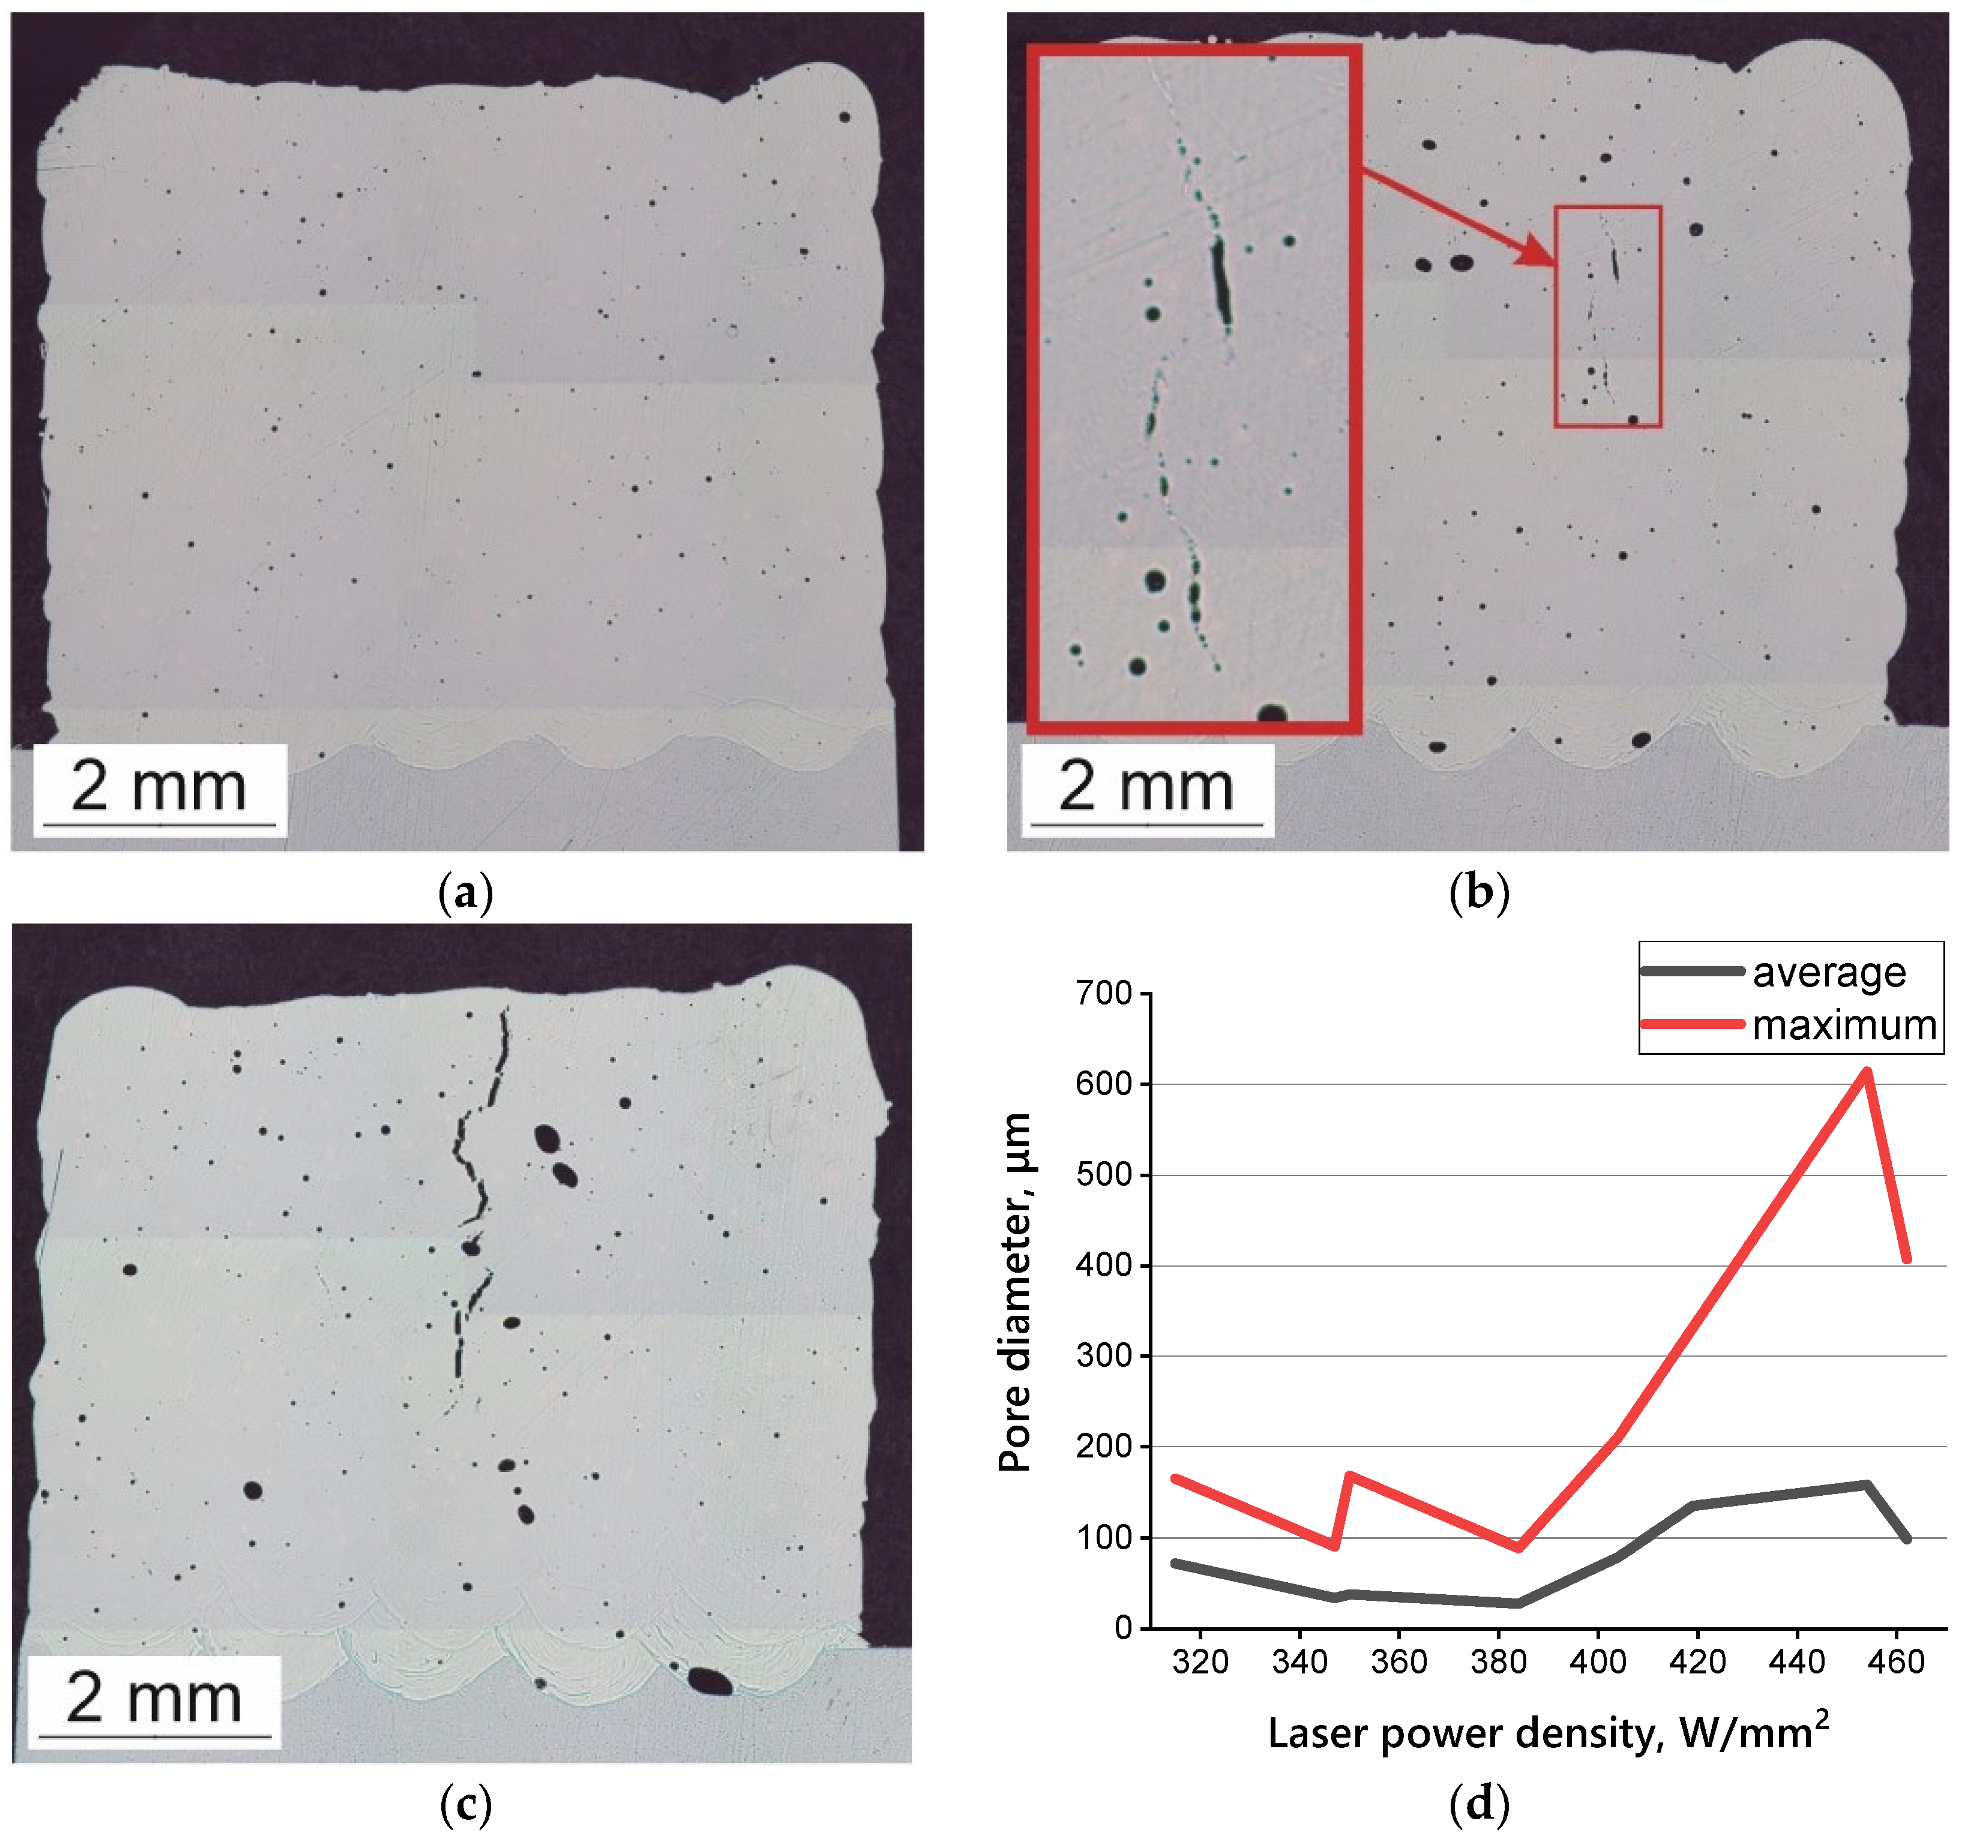
3.3. Macrostructures of HEA
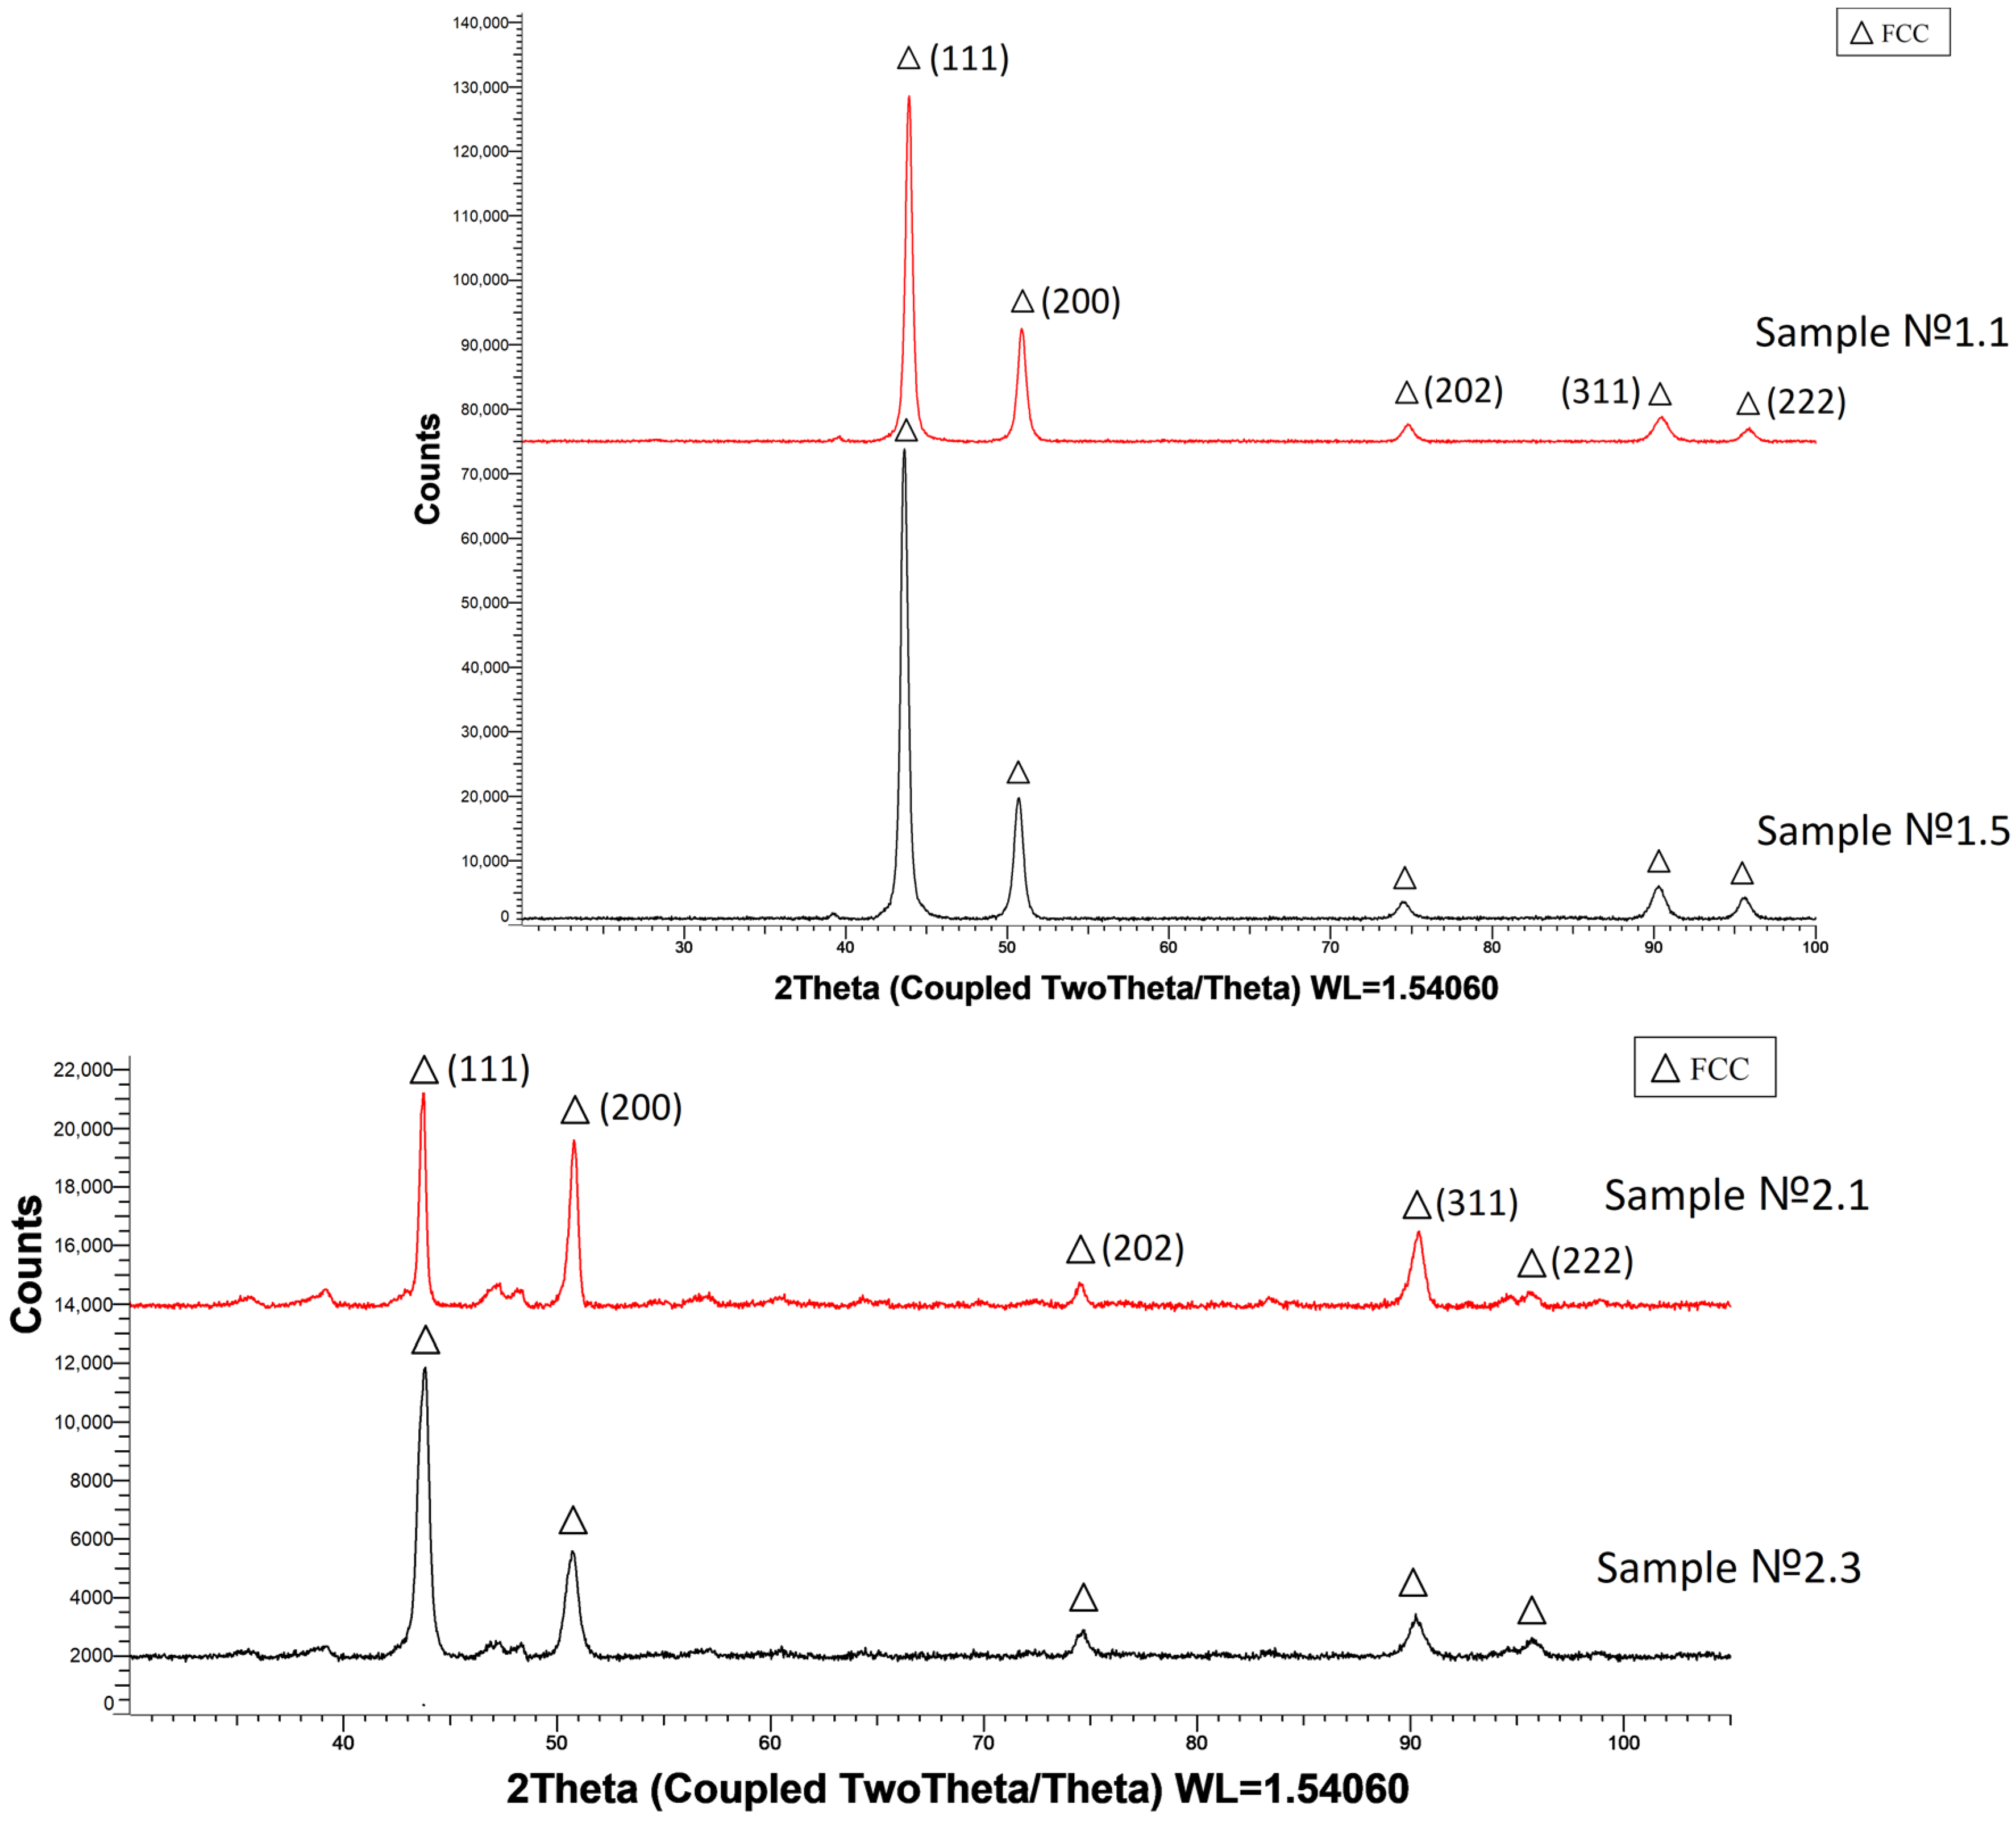
3.4. Phase Composition Analysis
3.5. Microhardness
4. Discussion
5. Conclusions
Author Contributions
Funding
Institutional Review Board Statement
Informed Consent Statement
Data Availability Statement
Conflicts of Interest
References
- Zhang, M.; Peng, Y.; Zhang, W.; Liu, Y.; Wang, L.; Hu, S.; Hu, Y. Gradient Distribution of Microstructures and Mechanical Properties in a FeCoCrNiMo High-Entropy Alloy during Spark Plasma Sintering. Metals 2019, 9, 351. [Google Scholar] [CrossRef] [Green Version]
- Yeh, J.-W.; Chen, S.-K.; Lin, S.-J.; Gan, J.-Y.; Chin, T.-S.; Shun, T.-T.; Tsau, C.-H.; Chang, S.-Y. Nanostructured high-entropy alloys with multiple principal elements: Novel alloy design concepts and outcomes. Adv. Eng. Mater. 2004, 6, 299–303. [Google Scholar] [CrossRef]
- Zhang, Y.; Zuo, T.T.; Tang, Z.; Gao, M.C.; Dahmen, K.A.; Liaw, P.K.; Lu, Z.P. Microstructures and properties of high-entropy alloys. Prog. Mater. Sci. 2014, 61, 1–93. [Google Scholar] [CrossRef]
- He, J.Y.; Wang, H.; Huang, H.L.; Xu, X.D.; Chen, M.W.; Wu, Y.; Liu, X.J.; Nieh, T.G.; An, K.; Lu, Z.P. A precipitation-hardened high-entropy alloy with outstanding tensile properties. Acta Mater. 2016, 102, 187–196. [Google Scholar] [CrossRef] [Green Version]
- Jiang, W.; Zhu, Y.; Zhao, Y. Mechanical Properties and Deformation Mechanisms of Heterostructured High-Entropy and Medium-Entropy Alloys: A Review. Front. Mater. 2022, 8, 530. [Google Scholar] [CrossRef]
- Wang, Z.; Fang, Q.; Li, J.; Liu, B.; Liu, Y. Effect of lattice distortion on solid solution strengthening of BCC high-entropy alloys. J. Mater. Sci. Technol. 2017, 34, 349–354. [Google Scholar] [CrossRef]
- Zhang, Y.; Yan, X.; Ma, J.; Lu, Z.; Zhao, Y. Compositional gradient films constructed by sputtering in a multicomponent Ti–Al–(Cr, Fe, Ni) system. J. Mater. Res. 2018, 33, 3330–3338. [Google Scholar] [CrossRef] [Green Version]
- Sebastian, A.K.; Schroers, J. Metastability in high entropy alloys. Scr. Mater. 2020, 186, 392–400. [Google Scholar]
- Shim, S.H.; Moon, J.; Pouraliakbar, H.; Lee, B.J.; Hong, S.I.; Kim, H.S. Toward excellent tensile properties of nitrogen-doped CoCrFeMnNi high-entropy alloy at room and cryogenic temperatures. J. Alloys Compd. 2022, 897, 163217. [Google Scholar] [CrossRef]
- Rizi, M.S.; Minouei, H.; Lee, B.J.; Toroghinejad, M.R.; Hong, S.I. Effects of carbon and molybdenum on the nanostructural evolution and strength/ductility trade-off in Fe40Mn40Co10Cr10 high-entropy alloys. J. Alloys Compd. 2022, 911, 165108. [Google Scholar] [CrossRef]
- Pogrebnyak, A.D.; Bagdasaryan, A.A.; Yakushchenko, I.V.; Beresnev, V.M. The structure and properties of high-entropy alloys and nitride coatings based on them. Russ. Chem. Rev. 2014, 83, 1027–1061. [Google Scholar] [CrossRef]
- Sreeramagiri, P.; Roy, A.; Balasubramanian, G. Effect of Cooling Rate on the Phase Formation of AlCoCrFeNi High-Entropy Alloy. J. Phase Equilibria Diffus. 2021, 42, 772–780. [Google Scholar] [CrossRef]
- Singh, P.; Smirnov, A.V.; Johnson, D.D. Atomic Short-Range Order and Incipient Long-Range Order in High-Entropy Alloys. Phys. Rev. B. 2015, 91, 204–224. [Google Scholar] [CrossRef] [Green Version]
- Ma, L.; Gao, Z.; Hu, S.; Zeng, Z.; Xu, J.; Wang, J. Effect of Cooling Rate on Microstructure and Mechanical Properties of Al0.3CoCrFeNi High-Entropy Alloy. Mater. Res. Express 2019, 6, 56–540. [Google Scholar] [CrossRef]
- Li, C.; Zhao, M.; Li, J.C.; Jiang, Q. B2 Structure of High-Entropy Alloys with Addition of Al. J. Appl. Phys. 2008, 104, 113–504. [Google Scholar] [CrossRef]
- Chen, J.; Jiang, X.; Sun, H.; Shao, Z.; Fang, Y.; Shu, R. Phase transformation and strengthening mechanisms of nanostructured high-entropy alloys. Nanotechnol. Rev. 2021, 10, 1116–1139. [Google Scholar] [CrossRef]
- Molnár, D.; Vida, A.; Huang, S.; Chinh, N.Q. The effect of cooling rate on the microstructure and mechanical properties of NiCoFeCrGa high-entropy alloy. J. Mater. Sci. 2019, 54, 5074–5082. [Google Scholar] [CrossRef]
- Jablonski, P.D.; Licavoli, J.J.; Gao, M.C.; Hawk, J.A. Manufacturing of high entropy alloys. JOM 2015, 67, 2278–2287. [Google Scholar] [CrossRef]
- Ma, L.; Li, C.; Jiang, Y.; Zhou, J.; Wang, L.; Wang, F.; Tangqing, C.; Xue, Y. Cooling rate-dependent microstructure and mechanical properties of AlxSi0.2CrFeCoNiCu1−x high entropy alloys. J Alloys Compd. 2017, 694, 61–67. [Google Scholar] [CrossRef]
- Lv, Y.; Hu, R.; Yao, Z.; Xu, D.; Liu, Y.; Fan, X. Cooling rate effect on microstructure and mechanical properties of AlxCoCrFeNi high entropy alloys. Mater Des. 2017, 132, 392–399. [Google Scholar] [CrossRef]
- Kalali, D.; Antharam, S.; Hasan, M.; Pidatala, S.K.; Phani, P.S.; Rao, K.B.S.; Rajulapati, K.V. On the origins of ultra-high hardness and strain gradient plasticity in multiphase nanocrystalline MoNbTaTiW based refractory high-entropy alloy. Mater. Sci. Eng. A 2021, 812, 141098. [Google Scholar] [CrossRef]
- Zhou, Y.; Zhang, Z.; Wang, D.; Xiao, W.; Ju, J.; Liu, S.; Xiao, B.; Yan, M.; Yang, T. New trends in additive manufacturing of high-entropy alloys and alloy design by machine learning: From single-phase to multiphase systems. J. Mater. Inform. 2022, 2, 18. [Google Scholar] [CrossRef]
- Perrin, A.E.; Schuh, C.A. Stabilized nanocrystalline alloys: The intersection of grain boundary segregation with processing science. Annu. Rev. Mater. Res. 2021, 51, 68. [Google Scholar] [CrossRef]
- Bennett, J.L.; Kafka, O.L.; Liao, H.; Wolff, S.; Yu, C.; Cheng, P.; Hyatt, G.; Ehmann, K.; Cao, J. Cooling rate effect on tensile strength of laser deposited Inconel 718. Procedia Manuf. 2018, 26, 912–919. [Google Scholar] [CrossRef]
- Pauly, S.; Wang, P.; Kuhn, U.; Kosiba, K. Experimental determination of cooling rates in selectively laser-melted eu-tectic Al-33Cu. Addit. Manuf. 2018, 22, 753–757. [Google Scholar]
- Zhang, J.; Jia, T.; Qiu, H.; Zhu, H.; Xie, Z. Effect of cooling rate upon the microstructure and mechanical properties of in-situ TiC reinforced high entropy alloy CoCrFeNi. J. Mater. Sci. Technol. 2020, 42, 122–129. [Google Scholar] [CrossRef]
- Derimow, N.; Clark, T.; Abbaschian, R. Solidification processing and cooling rate effects on hexagonal Co22Cr18Cu20Mn16Ti24 high-entropy alloys. Mater. Chem. Phys. 2020, 240, 122–188. [Google Scholar] [CrossRef]
- Dada, M.; Popoola, P.; Mathe, N.; Pityana, S.; Adeosun, S.; Aramide, O.; Lengopeng, T. Process optimization of high entropy alloys by laser additive manufacturing. Eng. Rep. 2020, 2, e12252. [Google Scholar] [CrossRef]
- Mahmood, M.A.; Alabtah, F.G.; Hamidi, Y.A.; Khraisheh, M. On Laser Additive Manufacturing of High-entropy Alloys: A Critical Assessment of In-situ Monitoring Techniques and Their Suitability. Mater. Des. 2023, 226, 1111658. [Google Scholar] [CrossRef]
- Gorsse, S.; Hutchinson, C.; Gouné, M.; Banerjee, R. Additive manufacturing of metals: A brief review of the characteristic microstructures and properties of steels, Ti-6Al-4V and high-entropy alloys. Sci. Technol. Adv. Mater. 2017, 18, 584–610. [Google Scholar] [CrossRef] [Green Version]
- Löbel, M.; Lindner, T.; Mehner, T.; Lampke, T. Influence of titanium on microstructure, phase formation and wear behaviour of AlCoCrFeNiTix high-entropy alloy. Entropy 2018, 20, 505. [Google Scholar] [CrossRef] [Green Version]
- Shun, T.-T.; Hung, C.-H.; Lee, C.-F. Formation of ordered/disordered nanoparticles in FCC high entropy alloys. J. Alloys Compd. 2010, 493, 105–109. [Google Scholar] [CrossRef]
- Chen, S.; Xie, X.; Li, W.; Feng, R.; Chen, B.; Qiao, J.; Ren, Y.; Zhang, Y.; Dahmen, K.A.; Liaw, P.K. Temperature effects on the serrated behavior of an Al0.5CoCrCuFeNi high-entropy alloy. Mater. Chem. Phys. 2017, 210, 20–28. [Google Scholar] [CrossRef]
- Sriharitha, R.; Murty, B.; Kottada, R.S. Phase formation in mechanically alloyed AlxCoCrCuFeNi (x = 0.45, 1, 2.5, 5 Mol) high entropy alloys. Intermetallics 2013, 32, 119–126. [Google Scholar] [CrossRef]
- Xiang, S.; Luan, H.; Wu, J.; Yao, K.-F.; Li, J.; Liu, X.; Tian, Y.; Mao, W.; Bai, H.; Le, G.; et al. Microstructures and mechanical properties of CrMnFeCoNi high entropy alloys fabricated using laser metal deposition technique. J. Alloys Compd. 2019, 773, 387–392. [Google Scholar] [CrossRef]
- Stavridis, J.; Papacharalampopoulos, A.; Stavropoulos, P. Quality assessment in laser welding: A critical review. Int. J. Adv. Manuf. Technol. 2017, 94, 1825–1847. [Google Scholar] [CrossRef]
- Gao, X.; Yu, Z.; Hu, W.; Lu, Y.; Zhu, Z.; Ji, Y.; Lu, Y.; Qin, Z.; Lu, X. In situ strengthening of CrMnFeCoNi high-entropy alloy with Al realized by laser additive manufacturing. J. Alloys Compd. 2020, 847, 156563. [Google Scholar] [CrossRef]
- Tong, Z.; Ren, X.; Jiao, J.; Zhou, W.; Ren, Y.; Ye, Y.; Larson, E.A.; Gu, J. Laser additive manufacturing of FeCrCoMnNi high-entropy alloy: Effect of heat treatment on microstructure, residual stress and mechanical property. J. Alloys Compd. 2019, 785, 1144–1159. [Google Scholar] [CrossRef]
- Savinov, R.; Wang, Y.; Wang, J.; Shi, J. Comparison of microstructure and properties of CoCrFeMnNi high-entropy alloy from selective laser melting and directed energy deposition processes. Procedia Manuf. 2021, 53, 435–442. [Google Scholar] [CrossRef]
- Fiocchi, J.; Casati, R.; Tuissi, A.; Biffi, C.A. Laser Beam Welding of CoCuFeMnNi High Entropy Alloy: Processing, Microstructure, and Mechanical Properties. Adv. Eng. Mater. 2022, 24, 2200523. [Google Scholar] [CrossRef]
- Shao, J.; Yu, G.; He, X.; Li, S.; Chen, R.; Zhao, Y. Grain size evolution under different cooling rate in laser additive manufacturing of superalloy. Opt. Laser Technol. 2019, 119, 105662. [Google Scholar] [CrossRef] [Green Version]
- Dong, B.; Wang, Z.; Zhu, H.; Muránsky, O.; Qiu, Z.; Shen, C.; Pan, Z.; Li, H. Low neutron cross-section FeCrVTiNi based high-entropy alloys: Design, additive manufacturing and characterization. Microstruct. J. 2022, 2, 2022003. [Google Scholar] [CrossRef]
- Bocklund, B.; Bobbio, L.D.; Otis, R.A.; Beese, A.M.; Liu, Z.K. Experimental validation of Scheil–Gulliver simulations for gradient path planning in additively manufactured functionally graded materials. Materialia 2020, 11, 100689. [Google Scholar] [CrossRef]
- Bocklund, B.; Bobbio, L.; Otis, R.A.; Beese, A.M.; Liu, Z.-K. Scheil-Gulliver simulations for the design of functionally graded alloys by additive manufacturing using pycalphad. arXiv 2020, arXiv:2001.11611. [Google Scholar]
- Wang, N.; Mokadem, S.; Rappaz, M.; Kurz, W. Solidification cracking of superalloy single- and bi-crystals. Acta Mater. 2004, 52, 3173–3182. [Google Scholar] [CrossRef]
- Wang, C.; Yu, J.; Zhang, Y.; Yu, Y. Phase evolution and solidification cracking sensibility in laser remelting treatment of the plasma-sprayed CrMnFeCoNi high entropy alloy coating. Mater. Des. 2019, 182, 108040. [Google Scholar] [CrossRef]
- Kou, S. A criterion for cracking during solidification. Acta Mater. 2015, 88, 366–374. [Google Scholar] [CrossRef]
- Coniglio, N.; Cross, C.E. Initiation and growth mechanisms for weld solidification cracking. Int. Mater. Rev. 2013, 7, 375–397. [Google Scholar] [CrossRef]


| Cr, % | Mn, % | Fe, % | Co, % | Ni, % | Cu, % |
|---|---|---|---|---|---|
| 21.2 | 18.2 | 19 | 19.7 | 19.8 | 2.2 |
| Series | X | Laser Power, kW | Spot Size, mm | Bead Width, mm | Sample Size, mm | Power Density, W/mm2 |
|---|---|---|---|---|---|---|
| 1.X | 1 | 1.8 | 2.7 | 2.5 | Height: 9 Width: 8 | 315 |
| 2 | 2.0 | 350 | ||||
| 3 | 2.2 | 384 | ||||
| 4 | 2.4 | 419 | ||||
| 5 | 2.6 | 454 | ||||
| 2.X | 1 | 1.2 | 2.1 | 2 | Height: 5.7 Width: 8 | 347 |
| 2 | 1.4 | 404 | ||||
| 3 | 1.6 | 462 |
Disclaimer/Publisher’s Note: The statements, opinions and data contained in all publications are solely those of the individual author(s) and contributor(s) and not of MDPI and/or the editor(s). MDPI and/or the editor(s) disclaim responsibility for any injury to people or property resulting from any ideas, methods, instructions or products referred to in the content. |
© 2023 by the authors. Licensee MDPI, Basel, Switzerland. This article is an open access article distributed under the terms and conditions of the Creative Commons Attribution (CC BY) license (https://creativecommons.org/licenses/by/4.0/).
Share and Cite
Kovalenko, E.; Krasanov, I.; Valdaytseva, E.; Klimova-Korsmik, O.; Gushchina, M. Influence of Laser Direct Energy Deposition Process Parameters on the Structure and Phase Composition of a High-Entropy Alloy FeCoNiCrMn. Metals 2023, 13, 534. https://doi.org/10.3390/met13030534
Kovalenko E, Krasanov I, Valdaytseva E, Klimova-Korsmik O, Gushchina M. Influence of Laser Direct Energy Deposition Process Parameters on the Structure and Phase Composition of a High-Entropy Alloy FeCoNiCrMn. Metals. 2023; 13(3):534. https://doi.org/10.3390/met13030534
Chicago/Turabian StyleKovalenko, Ekaterina, Igor Krasanov, Ekaterina Valdaytseva, Olga Klimova-Korsmik, and Marina Gushchina. 2023. "Influence of Laser Direct Energy Deposition Process Parameters on the Structure and Phase Composition of a High-Entropy Alloy FeCoNiCrMn" Metals 13, no. 3: 534. https://doi.org/10.3390/met13030534