Abstract
Applying fracture mechanics theory to heterogeneous welded joints might lead to an uncertain assessment of fatigue crack propagation behavior and, consequently, an inaccurate estimation of the cyclic loading capacity and fatigue life of welded structures. Combining experimental testing and analytical equations of the marine overmatched welded joints of D32 marine structural steel provided a view of the influence of strength heterogeneity on fatigue crack growth (FCG) behavior under constant cyclic loading. FCG testing was conducted using compact tension specimens under different stress ratios. The effect of residual stress on the FCG behaviors of the heat-affected zones (HAZs) and fusion zones (FZs) of the compact tension (CT) specimens was examined in the overmatched welded joints. Subsequently, the welding residual stresses were removed by post-welding heat treatment (PWHT) to focus the FCGR assessment on the microstructural effect. The results indicated that the FCG rates (FCGRs) of the FZ and HAZ materials obviously varied in as-welded and stress-relieved states. The existence of residual stress in the overmatched welded joints led to a decrease in FCG rates and prolonged the fatigue crack propagation life for the FZs and HAZs. Moreover, the FCGR increased in the base metal (BM), HAZ, and FZ with the increase in the stress ratio. The FCG curves of these materials were fitted to correct the stress ratios using the NASGRO equation. Finally, an analytical analysis of the FCGR based on the NASGRO equation revealed the relationship between different stress ratios for different materials.
1. Introduction
To realize the light weight needed for marine structures, high-strength steel (HSS) or ultra-high-strength steel (UHSS) are often used to fabricate critical welded components to improve the structural loading capacity and energy efficiency of marine structures [1,2,3]. Fatigue failure is inevitable for marine welded structures under the comprehensive service actions of the wind, waves, current, and other loading conditions, which have induced increasingly prominent issues in recent years. The fatigue crack initiation and propagation of welded components can not only lead to insufficient reserve buoyancy due to the destruction of watertightness but can also reduce the ultimate load-bearing capacity by destroying the structural integrity. For the integrity assessment of heterogeneous welded joints, attention is mainly devoted to the effect of geometrical parameters and the mismatch factor on the limit loading, fracture toughness, and crack tip constraint [4,5]. For some welded structures, such as ships, bridges, and offshore platforms, various welded joints have been widely employed to connect components with good structural safety, high efficiency, and service reliability. Some mismatched welded joints are often used to join different welded components with proper ductility and strength. D32 structural steel is employed to fabricate shipbuilding in China, sometimes welding the components using overmatched filler material. Thus, the fatigue performance of the corresponding welded joints is often assessed to meet the needs of structural service safety and reliability. As potential fatigue failure components, it is essential to assess the fatigue performance of marine structural steel welded components and the corresponding HAZs and FZs. Fracture mechanics theory offers an inseparable method to increase the understanding of the FCG behaviors of marine welded steels and their service structures, especially considering the actual stochastic states for different strength grades of steels.
To further investigate the influence of BM and weld material in mismatched welded joints on fatigue crack growth behavior, most studies employed the fracture parameters of the Paris law or expended the Paris law to evaluate the fracture behavior of materials quantitatively. The FCG behavior of HSS welding joints, such as 10CrNi3MoV steel [1], 10Ni5CrMoV steel [6], 25Cr2NiMo1V steel [7], NiCrMoV rotor steel [8], X100 steel [9], DP780 dual-phase steel [10], WNQ570 [11], S690 [12,13], and S960 [14] indifferent environments (a hydrogen gas environment [15] and a seawater environment [16]) was evaluated in the literature. For a reliable assessment of the fatigue life of offshore and marine welded structures, the effects of welding residual stress and the stress ratio during the crack propagations on the FCG behavior of welded joints should be considered. Firstly, residual stress could be partly retained in the extracted fracture mechanics samples and noticeably affect the FCGR of the weldment [6]. The residual stresses would redistribute in the fracture mechanics test of the FCG processing of the weldments or HAZ and finally vanish as the crack propagates [17]. However, the FCG trends are subjected to the state and distribution of residual stress, which is strongly related to the weldment geometries and material properties [6,18,19]. Amir Reza Shahani et al. performed FCG tests on 5083 aluminum TIG welded joints and surveyed the effect of post-weld heat treatment (PWHT) and the removal of the weld reinforcements on the FCGR [18]. The results showed that the FCGR is affected by the weld reinforcements and PWHT due to the redistribution of residual stress. Iman Shakeri et al. investigated the PWHT on the retardation of the FCG behavior of aluminum welded joints under pure mode I overloading conditions. The results showed that PWHT decreases the retardation of crack growth as the compressive residual stress at the crack tip is released by the treatment [20]. Moreover, the compressive residual stress is greatly relieved by PWHT and exerts a notable increase in fatigue life compared with the as-welded joints and failure from the weld root [21]. While the tensile residual stress will accelerate the FCG due to the increases in effective stress intensity factors (SIFs), it should be noted that the residual stress in the FCG test for the CT specimens varies in its distribution within the fatigue crack propagations, and that the residual stress could be kept in a self-equilibrating state between the tensile and compressive regions in the welded specimens. Thus, it is difficult to judge the residual stress field during an FCG test in CT specimens.
The material microstructure can also influence crack nucleation, propagation, and closure behavior, which are essential factors in fatigue crack growth. The material microstructure affects the near-threshold SIF, representing a linear elastic fracture property near the crack growth threshold [22]. Generally, a fine and homogeneous material microstructure has higher near-threshold SIF values than coarse or heterogeneous microstructures. The FCG threshold value (ΔKth) is a critical parameter that drives crack initiation with a maximum permitted load or crack size. It plays a dominant role between cracks remaining dormant and undetectable propagating rates during the component service [23,24,25]. Gray et al. exhibited that the FCGRs of pearlitic eutectoid steels in the near-threshold regime decreased with an increase in grain size under a low stress ratio (0.1) due to crack surface roughness [26]. From the perspective of a material fracture mechanism, the proportion of intergranular cracking in intergranular and transgranular FCG behaviors increases for the coarser grains, causing lower, near-threshold FCGRs [27]. This is because rougher fracture surfaces cause crack closure by inducing the premature contact of crack faces [28]. Thus, FCG behaviors are strongly sensitive to microstructures in the near-threshold region induced by crack closure due to roughness.
On the other hand, some inevitable undercuts or notches in welded joints lead to short fatigue initiation due to the local stress concentration. The crack propagation life becomes the dominant stage for the whole fatigue failure process. Furthermore, the structural service life can be predicted by the crack propagation properties of materials according to the Paris law (da/dN = C·(ΔK)m). The constant material parameters C and m are obtained from FCGR tests conducted on homogenous or heterogeneous microstructures. Recently, the FCG behaviors of low-activation martensitic steels with different tempered martensitic structures under a stress ratio R = 0.1 were investigated [28]. The results showed that the FCGRs were close, indicating that they are not sensitive to microstructural variations in the crack growth regime. However, the fatigue crack in the second regime is prone to changing direction, further exerting FCG retardation and causing a lower level of the FCGR, especially for the heterogeneous welded specimens [19,29]. The microstructure difference could increase crack-path asperities, causing FCG retardation and a lowered FCGR [30,31,32].
Combined with the finite element (FE) simulation results for the residual stress field, the FCGRs could be corrected with different empirical FCG laws, such as the Walker equation, the Harter T-method, and the NASGRO equation, which are based on the Paris law [33]. The results showed that the NASGRO equation is capable of expressing the best predictions compared to the Walker equation and the Harter T-method. The NASGRO model can evaluate the predictive capabilities of FCG behavior in crack initiation and propagation regimes. The residual stress effect on the FCGR could be illustrated by the effective crack tip stress ratio from the empirical crack growth laws. For most FCGR estimations of weldments, FE calculations that incorporate the residual welding stresses, combined with the elastic fracture mechanics theory, are typical methods of analyzing FCG behavior in welds [21,34]. The NASGRO equation for the description of crack propagation can be used to express the ΔKeff under different stress ratios. The effect of crack closure could be further incorporated into the equation. This model would deal with the FCG behavior for different regimes over the whole life of the engineering components. Since the cyclic number in the crack growth stage is dominant for the whole fatigue life of welded joints, exploring the fatigue mechanism and predicting the fatigue life accurately is effective for examining the FCG behavior of welded joints. However, the tested FCGR material data might not represent the FCG behavior of welded joints due to the difference in the residual stress state and the lack of initial crack information. It could provide a reference for a fatigue assessment of welded marine structures designed by practical engineering.
To estimate the residual life of welded components using the fracture mechanics theory, the present work focused on the FCG behavior of D32 marine structural steels and their overmatched weldments by considering the residual stress and stress ratio. In this paper, we aimed to obtain a group of fracture characteristic parameters using a proper, predictable model to predict the FCG properties by taking into account different stress ratios in the welded joints. First, the material microstructure, tensile properties, and fatigue crack growth were analyzed in detail. The FCG tests of CT specimens made using BM, HAZ, and FZ materials were conducted considering PWHT processing under different stress ratios. In contrast, the recommended standard codes for the base metal and weldments were added to discuss the specimens’ fatigue crack propagation resistance for the as-welded and PWHT states. Subsequently, the effect of the stress ratios on the FCGR for different zones was examined and corrected using the NASGRO equation. Finally, the primary conclusions were summarized. This study provides valuable experimental data for the safe design and life prediction of welded marine structures.
2. Materials, Tests, and Methodologies
2.1. Materials and Samples
The D32 low-alloy marine structural steel employed to investigate the FCG behavior in our study is widely used in shipbuilding and in marine structures. It demonstrates great comprehensive strength and ductility performance. A higher strength filler material (JQ501-1) was selected to join the 12 mm thickness plate through a gas metal arc welding (GMAW) process. The corresponding wire (wire diameter Φ 1.2 mm) was used. Multipass butt-welded joints with a double V-grooved design were prepared to extract the FCG test specimens. The chemical compositions of the base metal (BM) and overmatched filler material are provided in Table 1. Figure 1 shows the engineering and true stress–strain curves of the base metal and the obtained overmatched welded joints in ambient air at a strain rate of 3 × 10⁻³/s. Two specimens extracted from the directions parallel and perpendicular to the rolling direction were used to compare the basic mechanical properties shown in this figure. The properties of tensile strength, σb, and 0.2% proof strength, σ0.2, are compared in Table 2. The results show that the stress–strain curves of the base metal demonstrate a slight discrepancy for the specimens extracted from different directions. In light of the higher strength filler metal in the fabricated plate, the yield strength of the weldments is higher than the base metal, meaning that the welded joint demonstrates an overmatched state.

Table 1.
Nominal chemical composition of the BM and filler metal (JQ501-1).
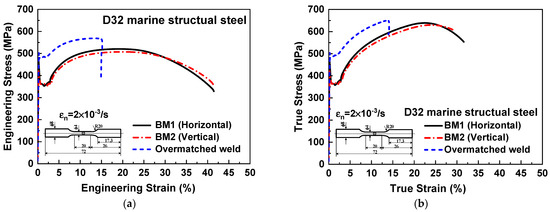
Figure 1.
Engineering (a) and true (b) stress-strain curves of the BM and the overmatched weldment.
Table 2.
Mechanical properties of test materials for BM and filler metal (JQ501-1).
The overmatch-welded plate is presented in Figure 2a. Compact tension (CT) specimens for the FCG tests were fabricated by electron discharge machining (EDM) processing from the corresponding welded steel plates along the parallel welding direction, following the ASTM E647 standard. As can be seen from the figure, the notch tips of the CT specimens extracted from the plate originate from the base metal (BM), the heat-affected zone (HAZ), and the fusion zone (FZ). The prefabricated notch direction was perpendicular to the welding direction of the plate. The shape and dimension of the CT specimens are shown in Figure 2b. Note that the final thickness, B, of the CT specimens was fabricated to 8 mm.
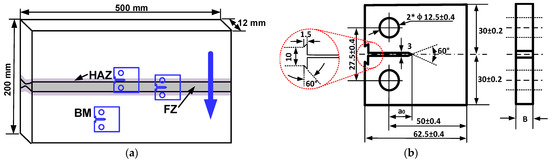
Figure 2.
The preparation process of the CT specimens. (a) Schematic diagram of CT specimens from the welded plate; (b) geometry and dimensions of CT specimen (mm).
To investigate the effect of residual stress on the FCGR of the CT specimens, as-welded CT specimens and residual-stress-released CT specimens were produced to compare the discrepancy between the FCGR results. A stabilized microstructure of the notch tip and the elimination of the residual stress effect in the CT specimens was necessary to compare the FCGRs of different zones. Thus, post-welding heat treatment (PWHT) was carried out for some of the welded CT specimins at 550 °C for 4 h, followed by cooling in the furnace.
2.2. Experimental Procedures
A servo-hydraulic strength machine, MTS 809, was used for the FCG tests, which were performed under constant, sinusoidal waveform cyclic loadings based on the ASTM-E647-2013 standard in air condition [35]. The fatigue crack growth test device is presented in Figure 3. The strain was examined by a linear variable extension meter connected to an amplifier to obtain the global deformation of the specimens. The first test was the load–amplitude constant (ΔP—constant) test, and the relationship between the stress intensity factor range (ΔK) and the FCG rate (da/dN) was subsequently obtained under the test frequencies of, 10–15 Hz. Since an initial crack with a length of 6 mm, machined by wire-EDM processing, could affect the initial FCGR results through residual stress, pre-cracking was also carried out in CT specimens prior to the FCG testing to eliminate the potential existing residual stress and blunt tips induced by the machining work caused by the wire-EDM processing. A 1–2 mm length crack was pre-cracked using the K—decreasing test method. Thus, the total crack length was approximately 8 mm before the FCG test. Afterward, FCG testing of the base metal and weldments was conducted to obtain the FCGR under constant loading conditions at stress ratios of 0.1 and 0.4. The corresponding stress intensity factor (SIF), ∆K, was calculated using the compliance method for CT specimens, as shown in Equation (1) [35].
where α = a/W, a represents the crack size, B represents the thickness of the specimen, W represents the specimen width, and ΔP represents the applied load range. The crack growth rate, da/dN, can be computed using the seven-point incremental polynomial technique, which is based on the ASTM E647 standard.
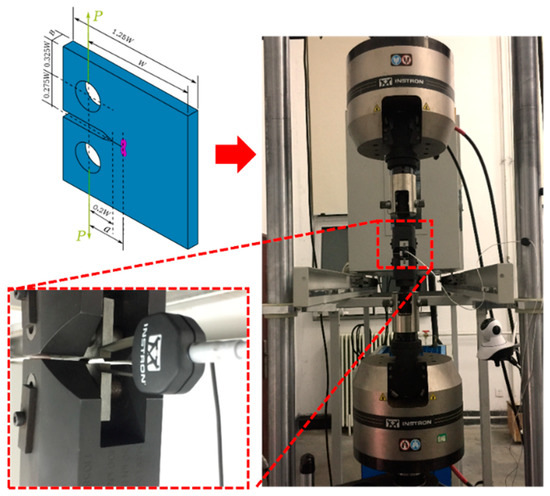
Figure 3.
The device of fatigue crack growth tests.
2.3. Fatigue Crack Growth Model
The Paris law converts all crack stages to stable crack growth without describing the change in the Kth value when the fatigue crack resistance is evaluated.
where da/dN represents the FCG rate, C and m represent the material constants, and ∆K represents the stress intensity factor range. Based on the variants of the Paris law, the fatigue limit was studied by assuming an equal relationship between the ∆K and the ∆Kth values. The accurate ∆Kth equation can further describe crack propagation and development [36]. In order to illustrate the effect of residual stress fields on the FCG behavior, an effective stress intensity factor should be determined considering the stress ratio, which is presented as follows:
where ∆K = Kmax − Kmin, R = Kmin/Kmax. The fatigue life can be estimated by:
The fatigue crack propagation threshold (∆Kth) is an intrinsic material parameter that distinguishes the application range of the elastic–plastic and linear elastic fracture mechanics, corresponding to the stages of the mechanically short and long cracks. The fatigue crack propagation threshold equation considers microstructural thresholds and crack closure as the following function of crack length:
where Y represents the geometrical factor and ai represents the initial crack length.
On the other hand, the NASGRO equation comprehensively considers nearly eleven material parameters. These parameters can better consider the stages of crack growth, as in the following equation:
where Kmax = ∆K/(1 − R) represents the maximum SIF under cyclic loading, KIc represents the plane strain fracture toughness, and ∆K represents the SIF range. C and m represent the crack growth constant and the Paris exponent, respectively, and p and q are empirical constants: p controls the shape of the fracture stage, and q controls the mechanically short crack stage. Finally, f is related to the crack closure state, which can be presented as follows:
where Ai represents the parameters calculated by mechanical parameters. By converting Equation (4), Kth is the fatigue threshold, as follows:
The least squares method was used to fit the fatigue crack propagation results by the NASGRO equation. The fit of the experiment data at the rapid fracture propagation stage was not considered by setting p = 0. Thus, the fatigue crack growth rate could be rewritten as a continuous function according to different stress ratios. In addition, the stress state, α, and the ratio of maximum stress to rheological stress were set to 0.3 and 2.5 separately during the calculation of Ai and f. The initial crack, a, was set to 0.038 mm. The Kth obtained by the fitting procedure can reflect the change of the material properties in different areas.
3. Results
Generally, the FCG curve of a tested material can be divided into two stages: the fatigue crack threshold stage and the stabilized fatigue crack stage. The FCGR of the BM and the weldments in the crack propagation stage can be expressed as two formulations: a simplified Paris law and a two-stage Paris law in BS 7910 [37]. The standard recommends the relevant information for the fatigue crack growth assessment in the engineering application [38]. The difference between the simplified and two-stage Paris laws lies in the specific characteristic stages. The simplified law mainly clarifies the FCG behavior of the second stage, while the two-stage Paris law demonstrates two stages with corresponding reference lines. The simplified Paris law is more convenient for facilitating the comparison procedure than the two-stage Paris law used in our study. The corresponding parameters are presented in Table 3. As reference curves for FCGR data, the Paris law curves for the BM and weldment from the BS7910 guidelines were used in comparison with the experimental data in the following figures, which were determined with a high survival probability and a high confidence level.
Table 3.
Simplified fatigue crack growth constants recommended by the BS7910.
3.1. The Effect of Residual Stress on FZ and HAZ
The residual stresses in the welded CT specimens will redistribute during the FCG test and finally vanish with the crack propagation. The residual stress effects and the subsequent redistribution have been compared using the experimental data analysis presented in Figure 4. Since the residual stress can be eliminated by PWHT processing, the tested CT specimens were divided into two types according to the initial stress state, as-welded state, and stress-relieved state. Figure 4 shows the FCGR results of the FZ and HAZ at the as-welded and stress-relieved states under a stress ratio of 0.1. As can be seen in Figure 4a,b, the FCG trends from the FZ and HAZ CT specimens fall below the BS 7910 reference lines over the entire ΔK experimental data range based on the simplified law, indicating a lower FCGR level. However, the stress-relieved CT specimens extracted from the FZ and HAZ had a larger FCGR than the as-welded CT specimens, indicating that the residual stress positively affects the FCGR.
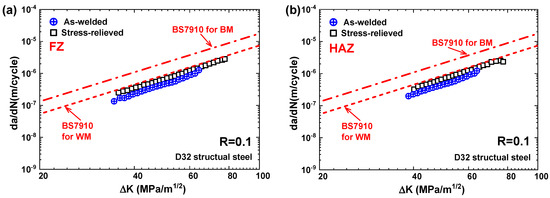
Figure 4.
FCGR data of D32 structural steel in FZ (a) and HAZ (b) considering the effect of residual stress.
Figure 5 shows the relationship between the crack length, a, and the fatigue life, N, of the HAZ and FZ specimens extracted from the overmatched welded joints in as-welded and stress-relieved states. The specimens were subjected to constant fatigue at stress ratios of 0.1 and 0.4. As can be seen from Figure 5a, the initial crack length (after pre-cracking) of all the FCG test specimens at a stress ratio of 0.1 was approximately 8 mm. The pre-crack length of HAZ specimens in the stress-relieved state was slightly higher. The maximum fatigue loadings for stress ratios of 0.1 and 0.4 reached 22 KN and 28.3 KN, respectively. Observing the crack growth trends under different states demonstrates that the fatigue life of the FZ specimens in the as-welded state is longer than the specimins in the stress-relieved state. The same situation can be observed in Figure 5b. The compressive residual stress in the HAZ and FZ specimens extracted from the overmatched welded joints could positively affect their fatigue life. Thus, it is necessary to eliminate the residual stress in CT specimens to evaluate the effect of the local microstructure in welded joints on the FCGR and fatigue life for different materials.
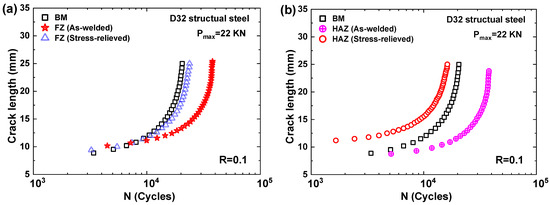
Figure 5.
FCG length and fatigue life relationship of FZ (a) and HAZ (b) considering the effect of residual stress at a stress ratio of 0.1.
3.2. The Effect of Stress Ratio on FCGR for Different Materials
Figure 6a,b show the FCGRs for the BM, HAZ, and FZ from the overmatched D32 welded joints with different R ratios (0.1 and 0.4). The FCG curves in the Paris region demonstrate the discrepancy of the different materials, showing a slight strength effect on the FCGR for the BM, HAZ, and FZ under different stress ratios after residual stress relief. The FCGR guidelines from the BS 7910 standard codes were added to the figures and compared with the results of the experimental data on the BM and filler metals in Figure 6. In Figure 6a, the FCGR curves of the BM specimens at stress ratio 0.1 are slightly higher than the curves of the FZ and HAZ. As can be seen in Figure 6, most of the FCG curves obtained from the tests on the BM, HAZ, and FZ fall close to each other, and the recommended curves for the weldments in BS 7910 are significantly lower than the recommended curve for the BM. However, in Figure 6b, the FCGR curve of the FZ material is higher than the FCGR curves of the BM and HAZ at the initial stage of fatigue crack propagation at a stress ratio of 0.4. This demonstrates more considerable variations with an increasing material strength compared with the BM and HAZ in the overmatched welded joints. It must also be noted that the BS7910 curves presented in this study for comparison purposes were based on the mean curves proposed in BS7910 for the subsequent fracture assessment of welded structures.
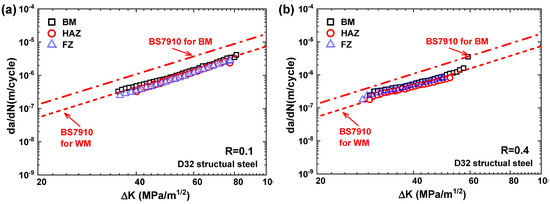
Figure 6.
Comparison of FCGR data for different zone in overmatched D32 welded joints at stress ratios 0.1 (a) and 0.4 (b).
On the other hand, the fact that the D32 marine structural steel specimens and HAZ and FZ specimens from the overmatched welded joints tested in our study were subjected to PWHT exerted an impact on the FCG behavior of the material due to the relaxation of potential residual stresses in those specimens. The FCGR results for the same materials (BM, HAZ, and FZ) at different stress ratios are presented in Figure 7. The comparison of FCG trends from the CT specimens at stress ratios of 0.1 and 0.4 shows that some variations can be observed in the FCG behavior of different steels tested under various loading conditions. The FCGR curves at the stress ratio of 0.4 are higher than at the stress ratio of 0.1 in Figure 7a. The same trends for the HAZ and FZ materials can be observed in Figure 7b,c. It can be observed in these figures that the curves of SIFs with an FCGR for the BM, HAZ, and FZ in our study vary approximately near the recommended curve for WM from BS 7910.
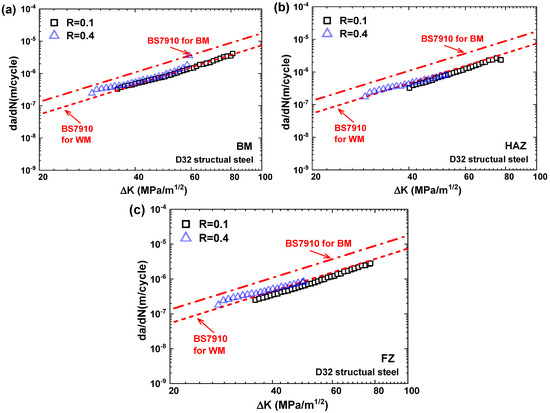
Figure 7.
Comparison of FCGR data for BM (a), HAZ (b), and FZ (c) at the stress ratios of 0.1 and 0.4.
Figure 8 shows the relationships of different materials (BM, HAZ, and FZ) between crack length, a, and fatigue life, N, at stress ratios of 0.1 and 0.4, respectively, collected from the FCGR tests. As can be seen from this figure, the initial crack length (after pre-cracking) for all FCG test specimens was approximately 10 mm except for the HAZ specimens, which were pre-cracked to slightly higher values. According to the observation from the comparison of the crack growth trends under different stress ratios, the maximum fatigue loadings for stress ratios 0.1 and 0.4 reached 22 KN and 28.3 KN, respectively. The results show that under Pmax = 22 kN, a longer fatigue life was observed in FZ specimens compared to BM and HAZ specimens. However, when the applied load level was increased to Pmax = 28.3 kN at a stress ratio of 0.4, the fatigue life for the three tested materials was nearly the same. It should be noted that the residual stress in the HAZ and FZ CT specimens was relieved by post-welding heat treatment.
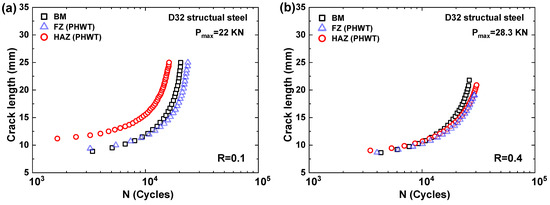
Figure 8.
FCG length and fatigue life relationship of different materials at stress ratio 0.1 (a) and 0.4 (b).
The above FCGR experimental data from the BM, HAZ, and FZ for the different states were fitted according to the Paris law. The initial test condition and the power law constants are summarized in Table 4. According to the Paris law constants, the fatigue crack propagation behavior can be evaluated by considering the discrepancy of material fracture properties. The higher value of R2 from the BM and FZ specimens indicates that the results of the fitting state described in the experimental data were more accurate and had less variation in FCG behavior than the HAZ specimens. This differences between FCG behavior for different specimen orientations might be associated with the variations in global mechanical strength, local material microstructure, and residual stress distribution during initial and crack propagation processing.
Table 4.
Summary of the calculated Paris constants for the different FCGR data of materials in different zones (Units: ΔK in MPa × m1/2, da/dN, in m/cycle).
3.3. The Modified FCG Model for the Tested Data
As the FCG data in the near-threshold region were not generated from the fatigue tests, some material parameters must be predicted according to the NASGRO manual [39]. According to the NASGRO model, the parameters could be determined to obtain a better correlation for different stress ratios and constant cyclic loadings. From the present fatigue tests on D32 marine steel and its weldments, the KIc = 23 MPa/m0.5 was set for the welded plates. Other parameters for the model are summarized in Table 5. These determined parameters can be used to estimate adequate fitting curves for the investigated materials at different stress ratios. Two fatigue crack propagation rate curves, according to the NASGRO equation and the corresponding stress ratios of 0.1 and 0.4, are illustrated in Figure 9. Figure 9a shows the results of the BM FCG fitting curves compared with the tested data. Although there were differences in the FCGR between the stress ratios of 0.1 and 0.4, the fitting curves can demonstrate the variation in the tested data with the variation in the stress ratio based on the NASGRO model. A similar phenomenon can be found in the HAZ and FZ relevant results, what are presented in Figure 9b,c. Thus, the fitted curves from the NASGRO equation are in good agreement with the FCGR test data.
Table 5.
The fitting parameters in the NASGRO model for the tested materials.
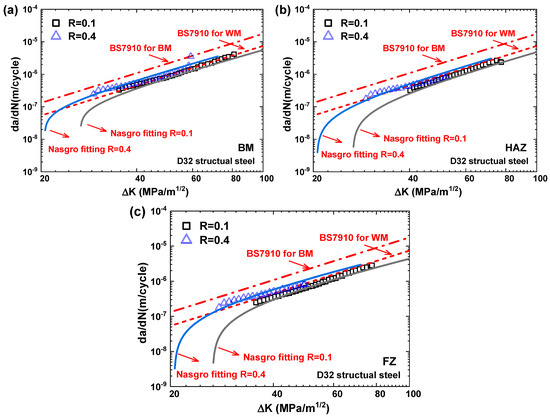
Figure 9.
The FCGR fitting results for different stress ratio and materials by NASGRO model. (a) shows the results of the BM FCG fitting curves compared with the tested data. Although there were differences in the FCGR between the stress ratios of 0.1 and 0.4, the fitting curves can demonstrate the variation in the tested data with the varia-tion in the stress ratio based on the NASGRO model. A similar phenomenon can be found in the HAZ and FZ relevant results, what are presented in (b,c).
The tested and predicted relationships of different materials (BM, HAZ, and FZ) between crack length, a, and fatigue life, N, are compared in Figure 10. It can be seen in Figure 10a that the fitting curves based on the NASGRO model are in good agreement with the tested data at a stress ratio of 0.1. The predicted trend of fatigue crack growth of HAZ with the fatigue life is faster than the other two materials, which is consistent with the tendency of the tested data. Similar results at a stress ratio of 0.4 can be observed in Figure 10b.
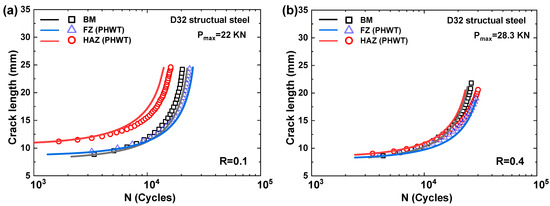
Figure 10.
Comparison between the predicted and tested crack growth data by the NASGRO model for different materials and stress ratios.(a) Stress ratio R = 0.1; (b) Stress ratio R = 0.4.
4. Discussion
The stress intensity range is typically regarded as the driving force during the fatigue crack growth of materials, indicating that the FCG resistance is correlated with the material’s fracture toughness. According to the results of these experiments, the FCGR is not only dependent on fracture toughness; it is also linked to the intrinsic material strength [40]. Given the residual stress state and different microstructures, the impacts of both strength and mismatch ratio on the FCG behaviors for welded joints have not been thoroughly investigated. This work exhibited the welding residual stress effect on FCGRs in the overmatched welded joint at different nominal R ratios. Based on the fracture mechanics theory, The relationship between the fatigue characteristics and fatigue strength of the welded joints should be elucidated for the fracture mechanics theory.
To predict the fatigue propagation life for various welded joints or welded components, one can use the FCG characteristics for the BM and its corresponding weldments. In previous investigations of the FCGR for 10CrNi3MoV steel welded joints, considering different mismatched ratios, the residual stress effect on the FCGR was studied by PWHT processing [1]. The findings showed that the FCGR of E-WM and U-WM was considerably influenced by residual stress in the extracted CT specimens. Due to compressive residual stresses, the as-welded FCGR of an evenmatched weldment is lower than in the PWHT state. Moreover, due to the influence of tensile residual stress on the fatigue crack tip, the FCGR in an undermatched weldment in an as-welded condition is marginally lower than in the PWHT state. In previous research, the residual stress was generally treated by the total stress intensity factor near the crack tip, and the component was presented by the residual stress intensity factor (Kres) and combined into both the maximum and the minimum applied stress intensity factors. Thus, a positive value, which means a larger mean stress ratio, will enhance the fatigue crack growth rates and the effective stress intensity factor. It is necessary to determine the Kres to illustrate the effect of residual stress on fatigue behavior. The residual stress could use the superposition method to correct the stress intensity factor based on elastic fracture mechanics. The variation in residual stress during FCG processing in particular can be tracked with the fatigue crack growth quantitatively [41,42]. However, the residual stress could also be reflected by comparing the final FCGR data from different states.
The FCGRs are rectified by using the effective ratio from the NASGRO model to account for variations in the fracture properties between the as-welded and stress-relieved states. With more material constants included in the Paris law, the NASFRO model could provide a good prediction of FCG rates for various R ratios in the short crack growth and the fast crack growth regimes. To demonstrate the difference in FCGR for different materials, Li et al. proposed a new FCGR model by considering the material strength and fracture toughness parameters [43]. Thus, the FCGR could be quantitatively predicted by the relationship between strength and toughness. The equation could be further applied to estimate the FCG properties for a weldment involving the model. On the other hand, for the fatigue life estimation of the welded joint, it conservatively assumes that the applied stress range is an entirely tensile state. Though the experimental data can deduce the compressive residual stress state in CT specimens, the FCG behavior of materials of different regions in the overmatched welded joint can be estimated by the tested FCGR results. According to the fatigue performance of marine K-type welded components and considering the residual stress effect, tensile residual stresses play a significant role in fatigue crack propagation under applied compressive stresses [44]. The effect of residual stress on fatigue life should consider the nominal loading state for welded structures, combining the fracture properties of the material.
In the future, further investigations of the stress–strain field of the crack tip that take into account the microstructure and residual stress state using digital image correlations and a multi-physical model should be conducted to validate the FCGR considering different environments, such as low-temperature and corrosive environments. On the other hand, the microstructure of the material should be analyzed by combining it with the fracture properties.
5. Conclusions
Fatigue tests were conducted for D32 marine structural steel and their overmatched welded joints at different stress ratios. The effects of the residual stress state and materials of distinct regions extracted from the welded joints on the FCGRs were investigated. Differences in FCG behavior in the BM and distinct regions of the welded joint were studied in detail. The conclusions are summarized as follows:
- (1)
- Differences in FCG behavior were found for the HAZ and FZ in the as-welded and stress-relieved states. The stress-relieved CT specimens for the FZ and HAZ had a larger FCGR than the as-welded CT specimens, indicating that the residual stress in the D32 overmatched welded joint positively affects the FCGR;
- (2)
- The stress ratio seemed to exhibit no noticeable difference in the BM material, while it had sensitivity to some degree for the HAZ and FZ materials in the stress-relieved state. The FCG of these materials was expedited with an increase in the stress. Differences in the fatigue crack growth rates due to microstructures in the crack path should be further examined;
- (3)
- Satisfactory FCGR fitting curves for the BM and the regions from overmatched welded joints can be obtained based on the NASGRO equation. This could offer some adequate information for the fatigue life prediction in engineering welded components. Further investigations of stress–strain field of the crack tip that consider the microstructure and residual stress state using digital image correlations and a multi-physical model should be conducted to validate the FCGR in the future.
Author Contributions
Author Contributions: Conceptualization, W.S.; methodology, Z.M. and J.X.; software, X.W.; Test, G.Z. and W.S.; data curation, C.L.; writing, Z.M. and G.Z.; supervision, F.B. All authors have read and agreed to the published version of the manuscript.
Funding
The research project was supported by the National Natural Science Foundation of China (Grant no. 52105403), the Natural Science Foundation of Jiangsu Province (grant no. BK20200174), the Postdoctoral Science Foundation of China (2021M702753), Xuzhou Basic Research Program of Science and Technology (KC21037), and the Qinglan project of Jiangsu province.
Institutional Review Board Statement
Not applicable.
Informed Consent Statement
Not applicable.
Data Availability Statement
The data presented in this study are available on request from the corresponding author.
Conflicts of Interest
The authors declare no conflict of interest.
References
- Song, W.; Wang, P.; Wan, D.; Qian, G.; Correia, J.; Berto, F. Fatigue crack growth behavior of Ni-Cr-Mo-V steel welded joints considering strength mismatch effect. Int. J. Fatigue 2021, 151, 106389. [Google Scholar] [CrossRef]
- Venezuela, J.; Zhou, Q.; Liu, Q.; Li, H.; Zhang, M.; Dargusch, M.S.; Atrens, A. The influence of microstructure on the hydrogen embrittlement susceptibility of martensitic advanced high strength steels. Mater. Today Commun. 2018, 17, 1–14. [Google Scholar] [CrossRef]
- Dwivedi, S.K.; Vishwakarma, M. Effect of hydrogen in advanced high strength steel materials. Int. J. Hydrogen Energy 2019, 44, 28007–28030. [Google Scholar] [CrossRef]
- Štefane, P.; Naib, S.; Hertelé, S.; De Waele, W.; Gubeljak, N. Crack tip constraint analysis in welded joints with pronounced strength and toughness heterogeneity. Theor. Appl. Fract. Mech. 2019, 103, 102293. [Google Scholar] [CrossRef]
- Alexandrov, S.; Kontchakova, N. Influence of anisotropy on limit load of weld-strength overmatched cracked plates in pure bending. Mater. Sci. Eng. A 2004, 387–389, 395–398. [Google Scholar] [CrossRef]
- Wang, Q.; Yan, Z.; Liu, X.; Dong, Z.; Fang, H. Understanding of fatigue crack growth behavior in welded joint of a new generation N-Cr-Mo-V high strength steel. Eng. Fract. Mech. 2018, 194, 224–239. [Google Scholar] [CrossRef]
- Zhu, M.L.; Xuan, F.Z.; Wang, G.Z. Effect of microstructure on fatigue crack propagation behavior in a steam turbine rotor steel. Mater. Sci. Eng. A 2009, 515, 85–92. [Google Scholar] [CrossRef]
- Liu, S.D.; Zhu, M.L.; Zhou, H.B.; Wan, D.; Xuan, F.Z. Strain visualization of growing short fatigue cracks in the heat-affected zone of a Ni–Cr–Mo–V steel welded joint: Intergranular cracking and crack closure. Int. J. Press. Vessel. Pip. 2019, 178, 103992. [Google Scholar] [CrossRef]
- Ronevich, J.A.; Song, E.J.; Feng, Z.; Wang, Y.; D’Elia, C.; Hill, M.R. Fatigue crack growth rates in high pressure hydrogen gas for multiple X100 pipeline welds accounting for crack location and residual stress. Eng. Fract. Mech. 2020, 228, 106846. [Google Scholar] [CrossRef]
- Li, S.; Kang, Y.; Zhu, G.; Kuang, S. Microstructure and fatigue crack growth behavior in tungsten inert gas welded DP780 dual-phase steel. Mater. Des. 2015, 85, 180–189. [Google Scholar] [CrossRef]
- Zong, L.; Shi, G.; Wang, Y. Experimental investigation and numerical simulation on fatigue crack behavior of bridge steel WNQ570 base metal and butt weld. Constr. Build. Mater. 2015, 77, 419–429. [Google Scholar] [CrossRef]
- De Jesus, A.M.P.; Matos, R.; Fontoura, B.F.C.; Rebelo, C.; Simões Da Silva, L.; Veljkovic, M. A comparison of the fatigue behavior between S355 and S690 steel grades. J. Constr. Steel Res. 2012, 79, 140–150. [Google Scholar] [CrossRef]
- Liu, X.; Chung, K.F.; Ho, H.C.; Xiao, M.; Hou, Z.X.; Nethercot, D.A. Mechanical behavior of high strength S690-QT steel welded sections with various heat input energy. Eng. Struct. 2018, 175, 245–256. [Google Scholar] [CrossRef]
- Lukács, J.; Dobosy, Á. Matching effect on fatigue crack growth behaviour of high-strength steels GMA welded joints. Weld. World 2019, 63, 1315–1327. [Google Scholar] [CrossRef]
- Todoshchenko, O.; Yagodzinskyy, Y.; Yagodzinska, V.; Saukkonen, T.; Hänninen, H. Hydrogen effects on fracture of high-strength steels with different micro-alloying. Corros. Rev. 2015, 33, 515–527. [Google Scholar] [CrossRef]
- Mehmanparast, A.; Brennan, F.; Tavares, I. Fatigue crack growth rates for offshore wind monopile weldments in air and seawater: SLIC inter-laboratory test results. Mater. Des. 2017, 114, 494–504. [Google Scholar] [CrossRef]
- Lam, Y.C.; Lian, K.S. The effect of residual stress and its redistribution of fatigue crack growth. Theor. Appl. Fract. Mech. 1989, 12, 59–66. [Google Scholar] [CrossRef]
- Shahani, A.R.; Shakeri, I.; Rans, C.D. Effect of residual stress redistribution and weld reinforcement geometry on fatigue crack growth of butt welded joints. Int. J. Fatigue 2020, 139, 105780. [Google Scholar] [CrossRef]
- Xiong, Y.; Hu, X.X. The effect of microstructures on fatigue crack growth in Q345 steel welded joint. Fatigue Fract. Eng. Mater. Struct. 2012, 35, 500–512. [Google Scholar] [CrossRef]
- Shakeri, I.; Shahani, A.R.; Rans, C.D. Fatigue crack growth of butt welded joints subjected to mixed mode loading and overloading. Eng. Fract. Mech. 2021, 241, 107376. [Google Scholar] [CrossRef]
- Barsoum, Z.; Barsoum, I. Residual stress effects on fatigue life of welded structures using LEFM. Eng. Fail. Anal. 2009, 16, 449–467. [Google Scholar] [CrossRef]
- Xu, T.; Feng, Y.; Song, S.; Wang, D. Fatigue crack propagation behaviour of steels with different microstructures. Mater. Sci. Eng. A 2012, 551, 110–115. [Google Scholar] [CrossRef]
- Ritchie, R.O. near-threshold fatigue-crack propagation in steels. Int. Met. Rev. 1979, 24, 205–228. [Google Scholar] [CrossRef]
- Ritchie, R.O.; Suresh, S. Some considerations on fatigue crack closure at near-threshold stress intensities due to fracture surface morphology. Metall. Trans. A 1982, 13, 937–940. [Google Scholar] [CrossRef]
- Newman, J.C. A crack opening stress equation for fatigue crack growth. Int. J. Fracture 2000, 24, 131–135. [Google Scholar] [CrossRef]
- Gray, G.T.; Williams, J.C.; Thompson, A.W. Roughness-Induced Crack Closure: An Explanation for Microstructurally Sensitive Fatigue Crack Growth. Metall. Trans. A 1983, 14, 421–433. [Google Scholar] [CrossRef]
- Kowathanakul, N.; Yu, Q.; Zhu, C.; Li, X.; Minor, A.M.; Ritchie, R.O. Fatigue-crack propagation behavior in a high-carbon chromium SUJ2 bearing steel: Role of microstructure. Int. J. Fatigue 2022, 156, 106693. [Google Scholar] [CrossRef]
- Liang, M.; Zhao, Y.; Zheng, M.; Mao, X. Effect of tempering time on fatigue crack growth behavior of CLAM steel. J. Nucl. Mater. 2018, 510, 437–445. [Google Scholar] [CrossRef]
- Ke, L.; Li, Y.; Chen, Z.; Feng, Z.; Yan, B.; Zhu, F.; Yuan, P. Effect of microstructure on fatigue crack growth behavior of surface- and middle-layer materials of thick high-strength bridge steel plates. Fatigue Fract. Eng. Mater. Struct. 2023, 46, 485–500. [Google Scholar] [CrossRef]
- Zhang, Y.; Wang, S.; Xu, G.; Wang, G.; Zhao, M. Effect of Microstructure on Fatigue-crack Propagation of 18CrNiMo7-6 high-strength Steel. Int. J. Fatigue 2022, 163, 107027. [Google Scholar] [CrossRef]
- Wang, Q.; Chen, S.; Lv, X.; Jiang, H.; Rong, L. Role of δ-ferrite in fatigue crack growth of AISI 316 austenitic stainless steel. J. Mater. Sci. Technol. 2022, 114, 7–15. [Google Scholar] [CrossRef]
- Zhang, L.; Zhong, H.; Li, S.; Zhao, H.; Chen, J.; Qi, L. Microstructure, mechanical properties and fatigue crack growth behavior of friction stir welded joint of 6061-T6 aluminum alloy. Int. J. Fatigue 2020, 135, 105556. [Google Scholar] [CrossRef]
- Servetti, G.; Zhang, X. Predicting fatigue crack growth rate in a welded butt joint: The role of effective R ratio in accounting for residual stress effect. Eng. Fract. Mech. 2009, 76, 1589–1602. [Google Scholar] [CrossRef]
- Barsoum, Z. Residual stress analysis and fatigue of multi-pass welded tubular structures. Eng. Fail. Anal. 2008, 15, 863–874. [Google Scholar] [CrossRef]
- ASTM E647; Standard Test Method for Measurement of Crack Growth Rates. ASTM International: West Conshohocken, PA, USA, 2015.
- Steimbreger, C.; Gubeljak, N.; Vuherer, T.; Enzinger, N.; Ernst, W.; Chapetti, M. Effect of welding processes on the fatigue behaviour of ultra-high strength steel butt-welded joints. Eng. Fract. Mech. 2022, 275, 108845. [Google Scholar] [CrossRef]
- BS7910; Guide to Methods for Assessing the Acceptability of Flaws in Metallic Structures. British Standards Institution: London, UK, 2015.
- Zhang, Y.-H.; Doré, M. Fatigue crack growth assessment using BS 7910:2013—Background and recommended developments. Int. J. Press. Vessel. Pip. 2018, 168, 79–86. [Google Scholar] [CrossRef]
- NASGRO. Fracture Mechanics and Fatigue Crack Growth Analysis Software (Version 6.0); reference manual; NASA Johnson Space Center and Southwest Research Institute: San Antonio, TX, USA, 2010. [Google Scholar]
- Wei, L.; Pan, Q.; Huang, H.; Feng, L.; Wang, Y. Influence of grain structure and crystallographic orientation on fatigue crack propagation behavior of 7050 alloy thick plate. Int. J. Fatigue 2014, 66, 55–64. [Google Scholar] [CrossRef]
- Donald, J.K.; Lados, D.A. An integrated methodology for separating closure and residual stress effects from fatigue crack growth rate data. Fatigue Fract. Eng. Mater. Struct. 2007, 30, 223–230. [Google Scholar] [CrossRef]
- James, M.; Maciejewski, K.; Wang, G.; Ball, D.; Bucci, R. A methodology for partitioning residual stress effects from fatigue crack growth rate test data. Mater. Perform. Charact. 2016, 5, 194–214. [Google Scholar] [CrossRef]
- Li, H.F.; Zhang, P.; Wang, B.; Zhang, Z.F. Predictive fatigue crack growth law of high-strength steels. J. Mater. Sci. Technol. 2022, 100, 46–50. [Google Scholar] [CrossRef]
- Acevedo, C.; Nussbaumer, A. Effect of tensile residual stresses on fatigue crack growth and S–N curves in tubular joints loaded in compression. Int. J. Fatigue 2012, 36, 171–180. [Google Scholar] [CrossRef]


Disclaimer/Publisher’s Note: The statements, opinions and data contained in all publications are solely those of the individual author(s) and contributor(s) and not of MDPI and/or the editor(s). MDPI and/or the editor(s) disclaim responsibility for any injury to people or property resulting from any ideas, methods, instructions or products referred to in the content. |
© 2023 by the authors. Licensee MDPI, Basel, Switzerland. This article is an open access article distributed under the terms and conditions of the Creative Commons Attribution (CC BY) license (https://creativecommons.org/licenses/by/4.0/).