3.1. Mineral Phase Reconstruction Procedure
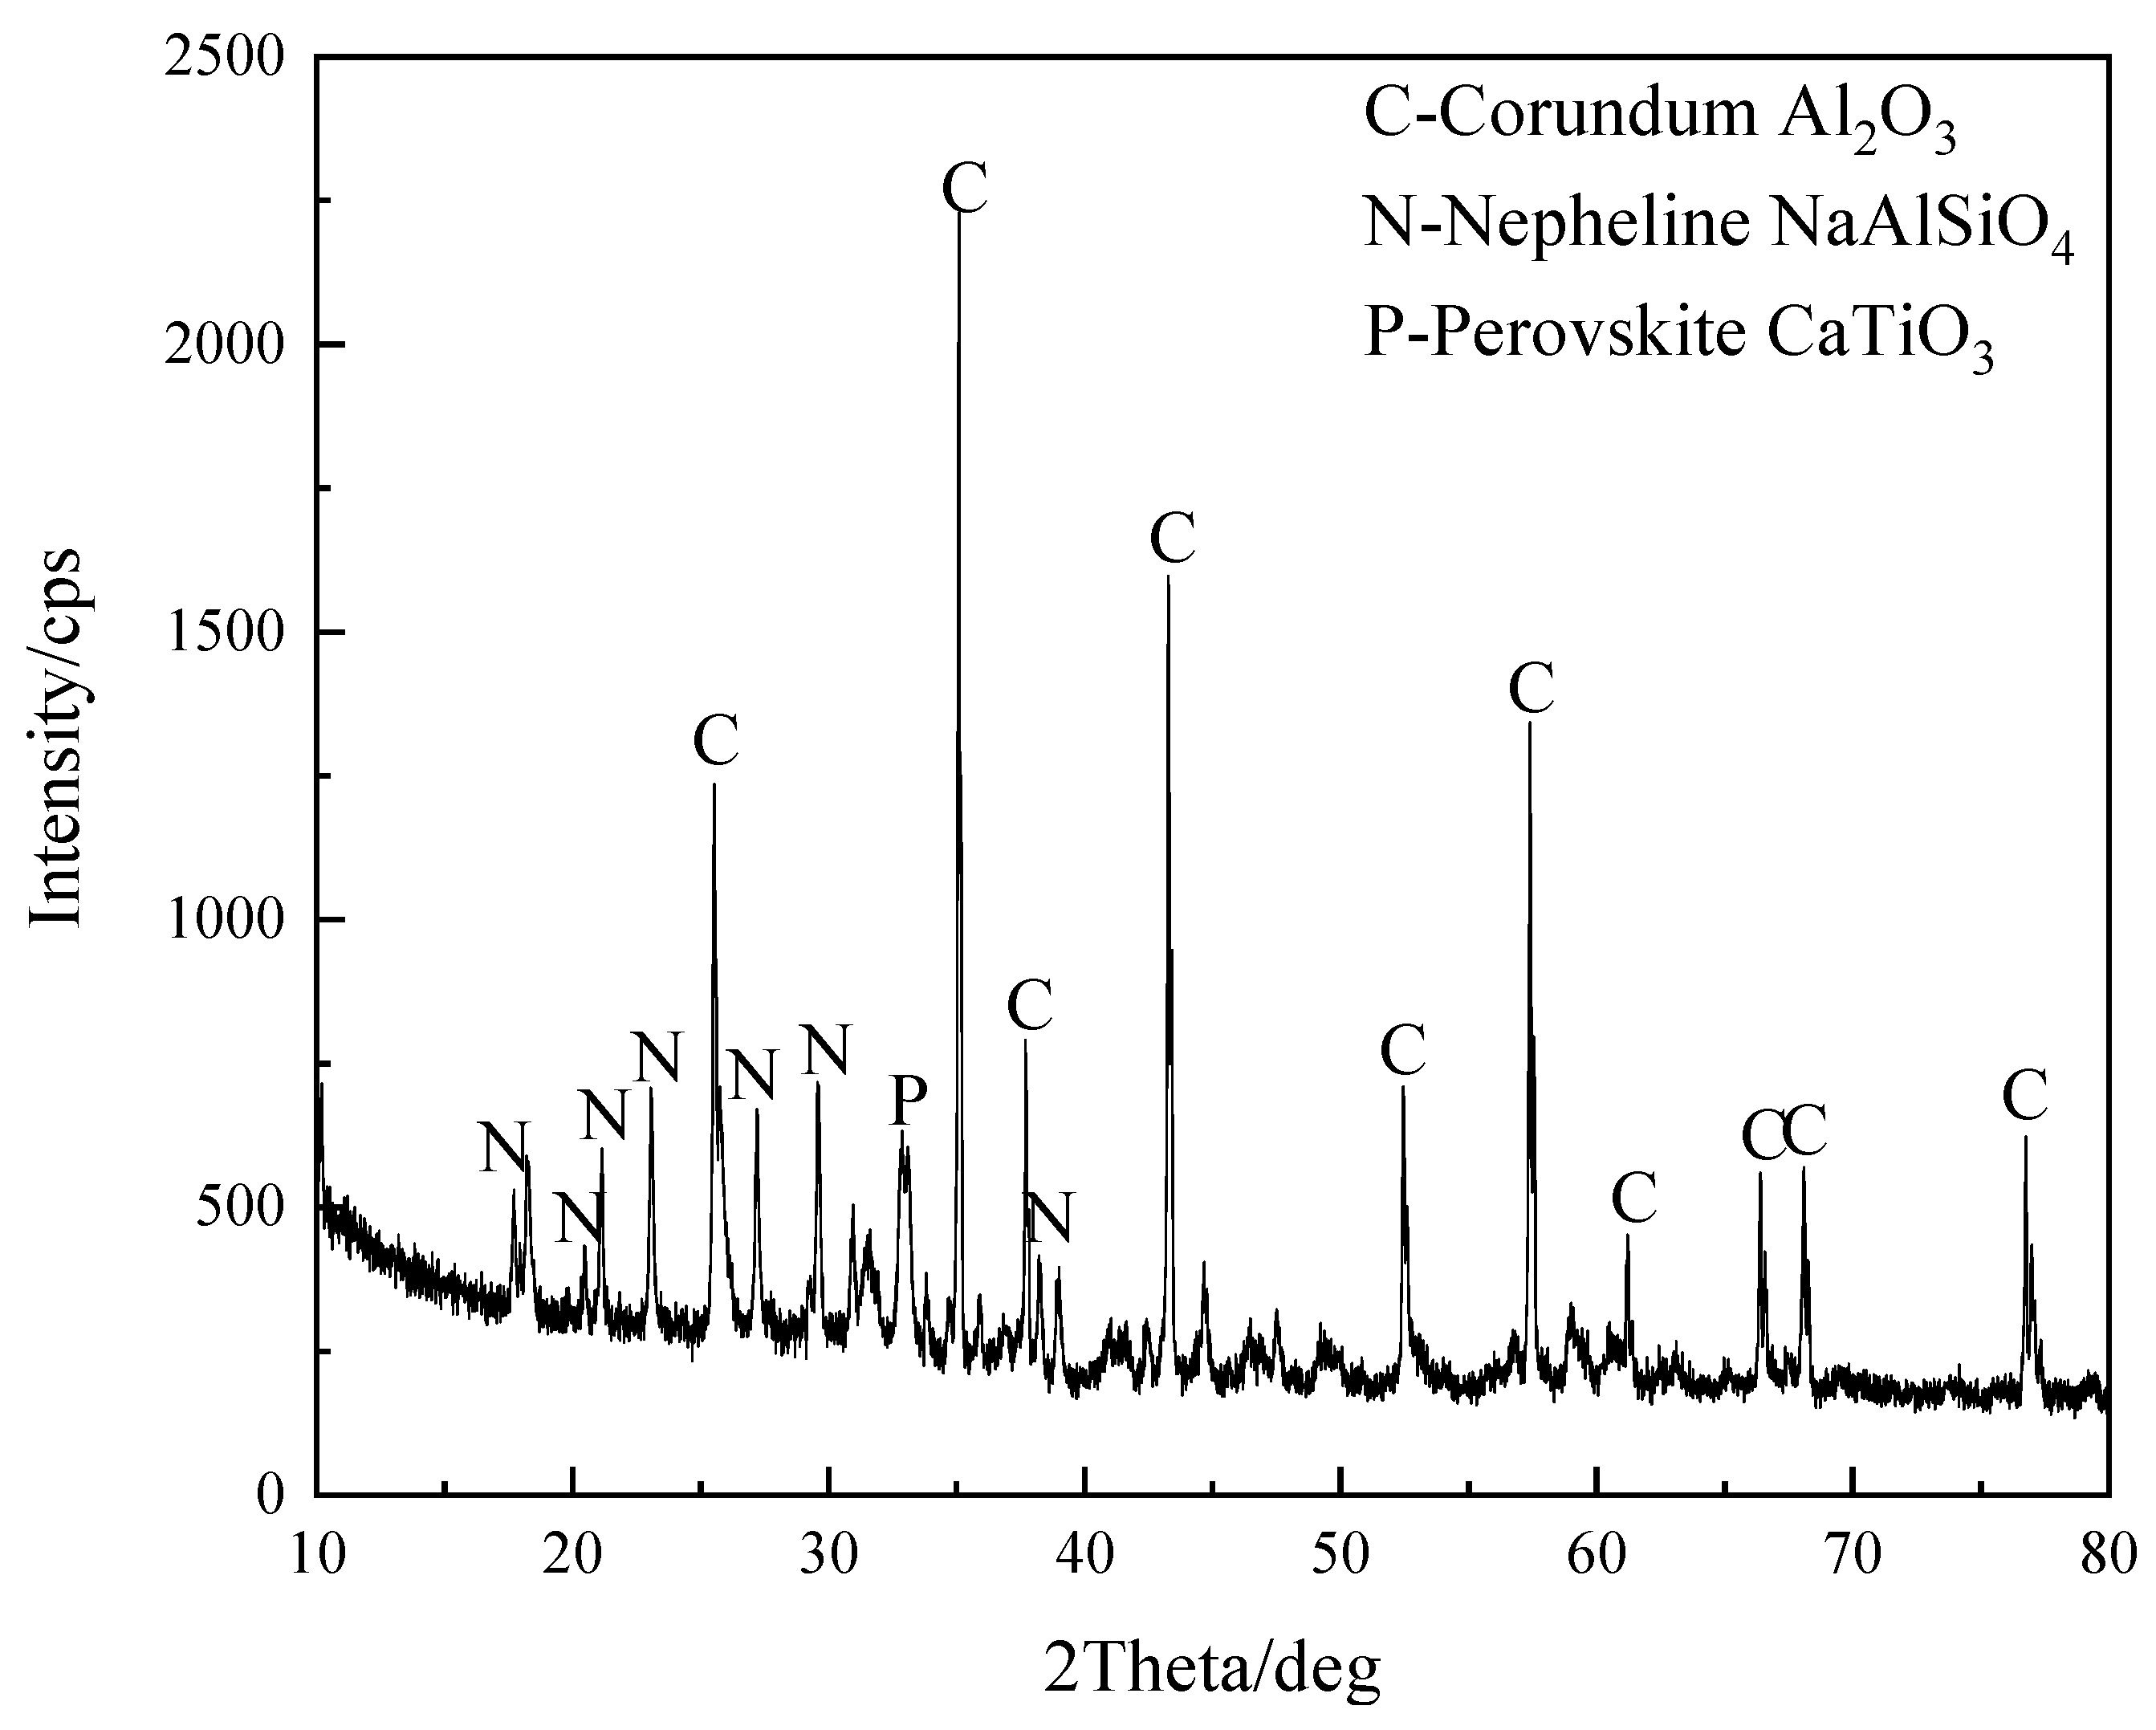
In the SSS, aluminum exists mainly as corundum (Al
2O
3) and nepheline (NaAlSiO
4) phases. Hence, the detailed reactions between Al-bearing minerals with Na/Ca additives are demonstrated in this study. Equations (2)–(9) show the possible reactions during the reconstruction process of Al
2O
3 and NaAlSiO
4, and FactSage 8.0 software (Thermfact/CRCT, Montreal, QC, Canada; GTT-Technologies, Herzogenrath, Germany) was used to calculate the changes in the Gibbs free energy of the reactions, and the results are shown in
Figure 4. According to the thermodynamic calculations, Al
2O
3 reacts preferentially with Na
2O or NaOH, forming than NaAlSiO
4. The Gibbs free energy (Δ
rG
mθ) of Equations (2)–(5) is negative, indicating that the reaction can occur during the range of modification temperatures. Compared with Al
2O
3, the NaAlSiO
4 reacts preferentially with CaO or Ca(OH)
2, and the Δ
rG
mθ of Equations (6) and (7) are negative. The Δ
rG
mθ values of Equations (8) and (9) decrease as the temperature increases, indicating that the reaction is more favorable at high temperatures. Considering the separation of Al and Si in the subsequent alkaline leaching process, Na and Ca bearing additives are used together.
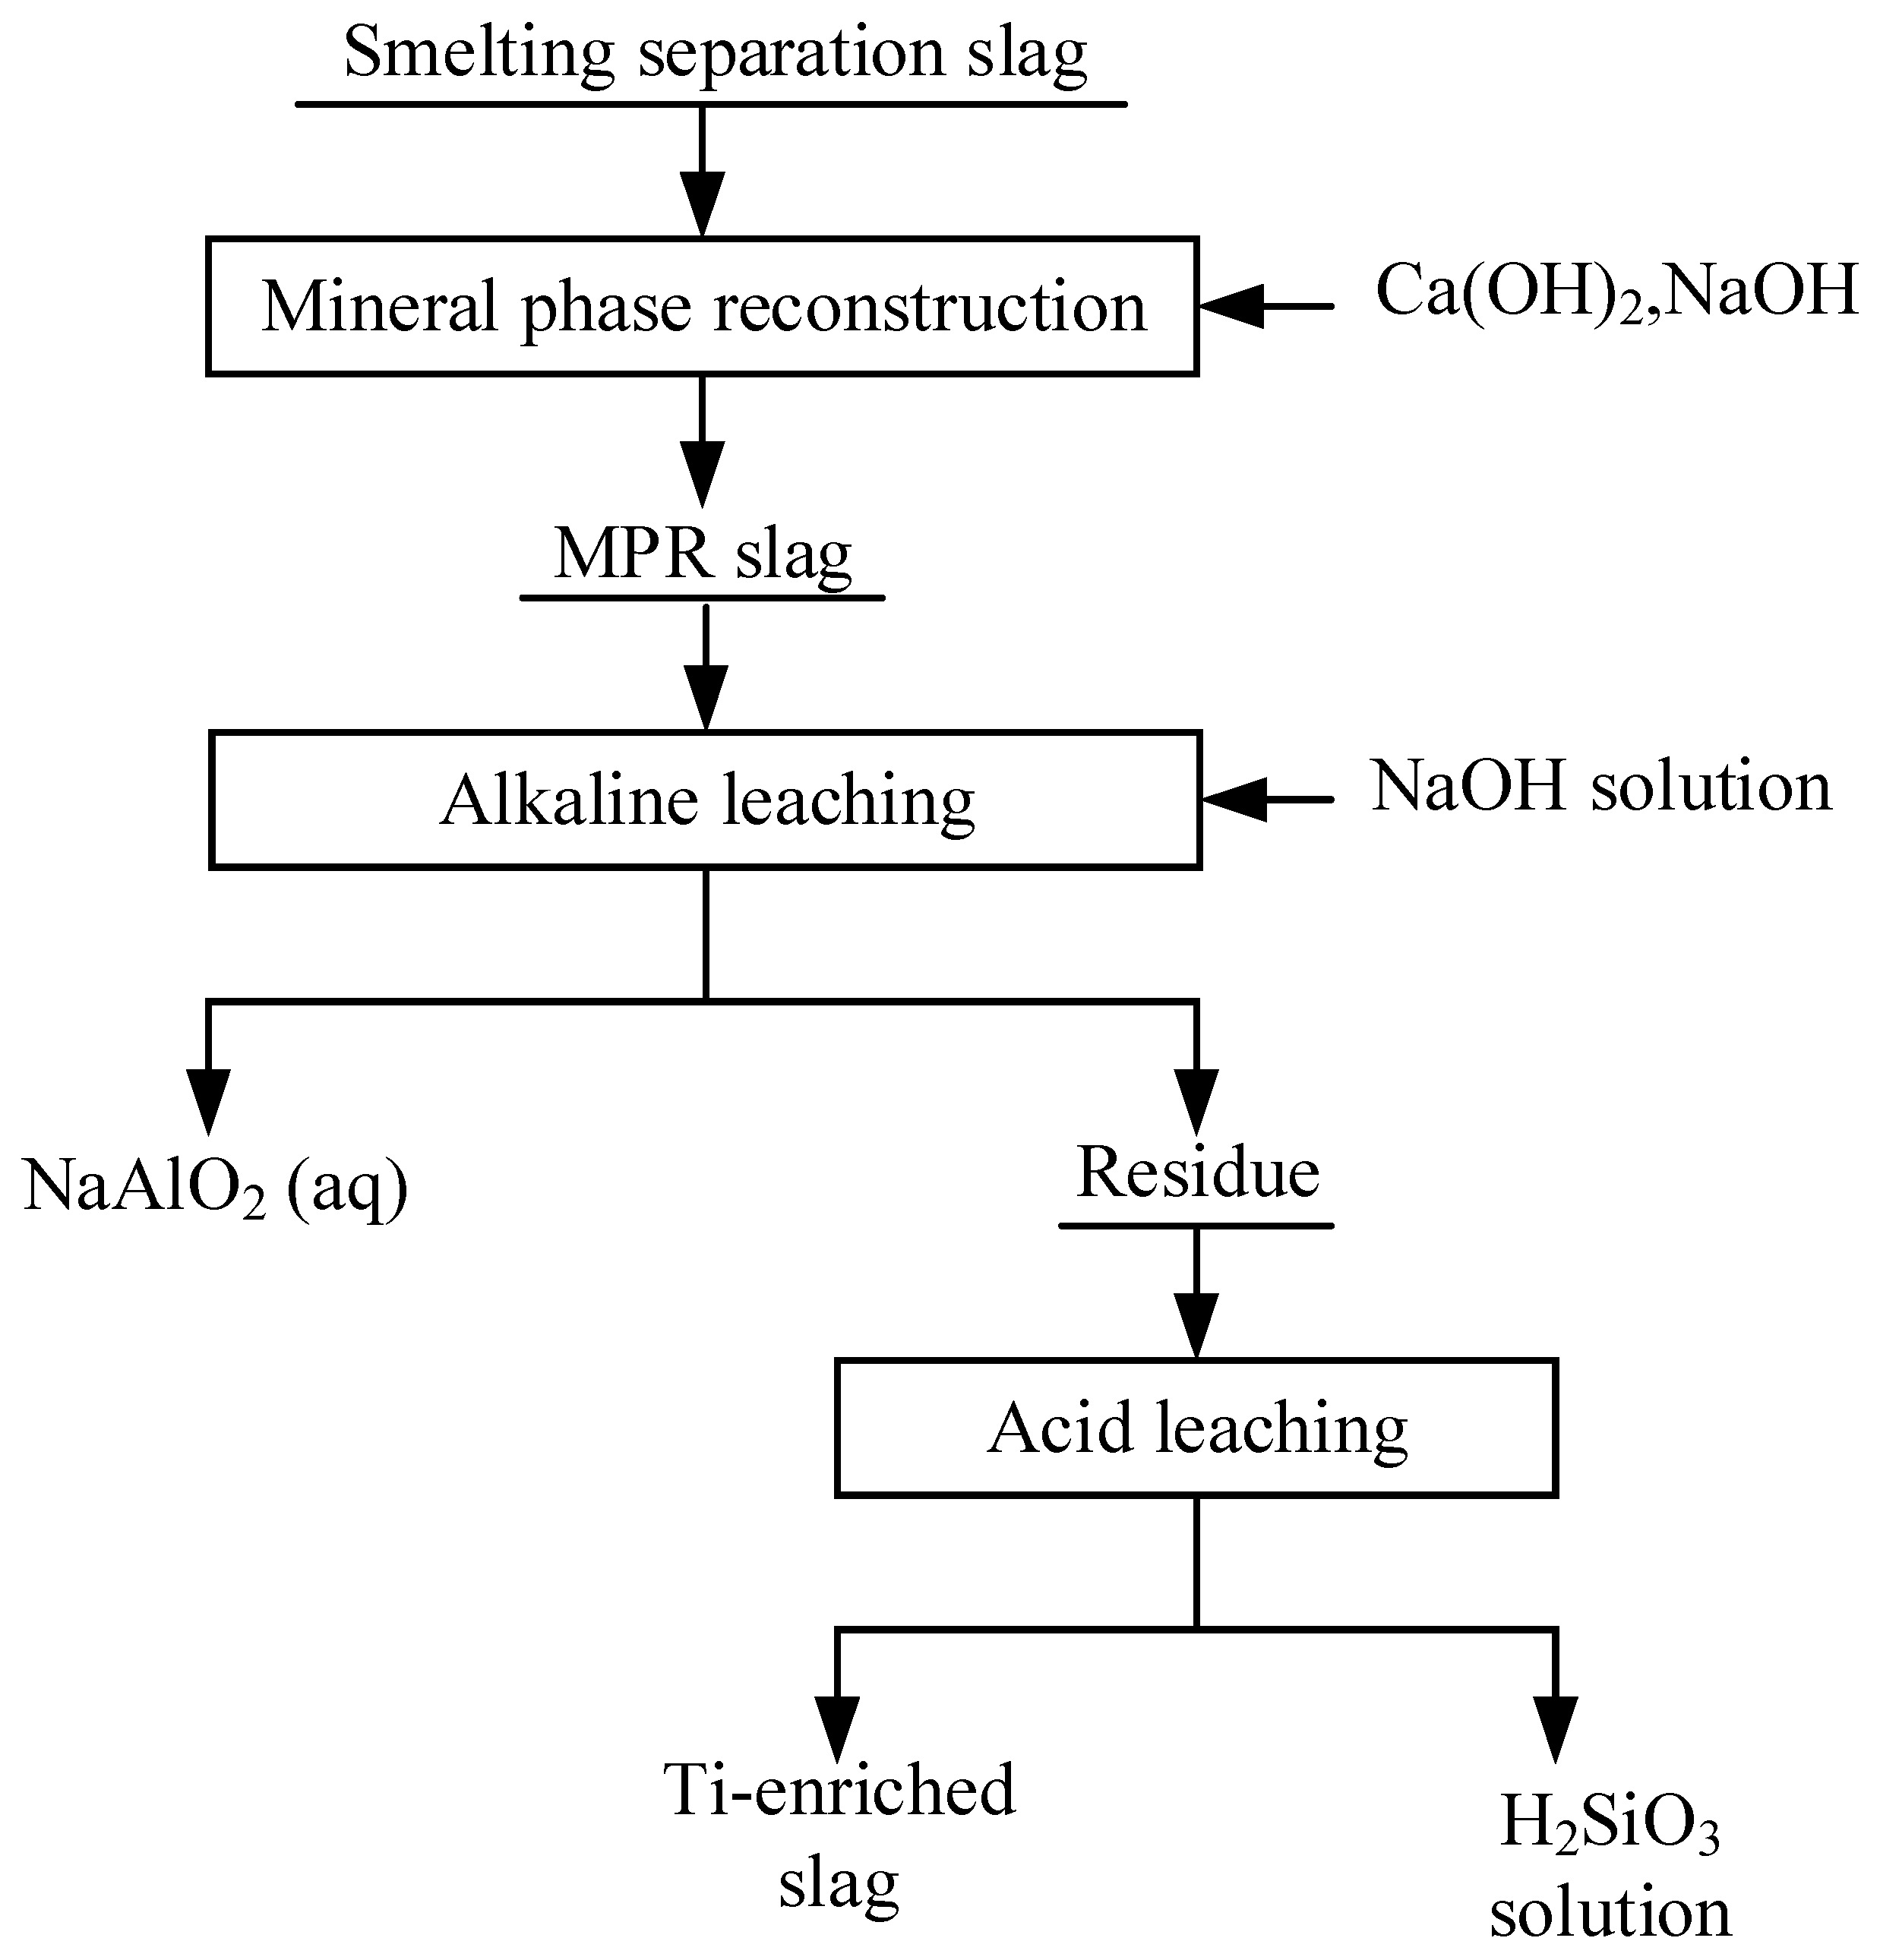
As aluminum mainly exists as corundum (Al2O3) and nepheline (NaAlSiO4) phases, it is difficult to extract Al2O3 from the SSS by direct leaching. In this paper, Na and Ca-bearing additives were added to the slag to reconstruct the mineral phases of Al-bearing and Si-bearing minerals and selectively extract Al2O3. The roasted slags prepared at different conditions were leached at 95 °C for 2 h in an alkaline solution with a concentration of 2 mol/L and with a liquid-to-solid ratio of 10 mL/g.
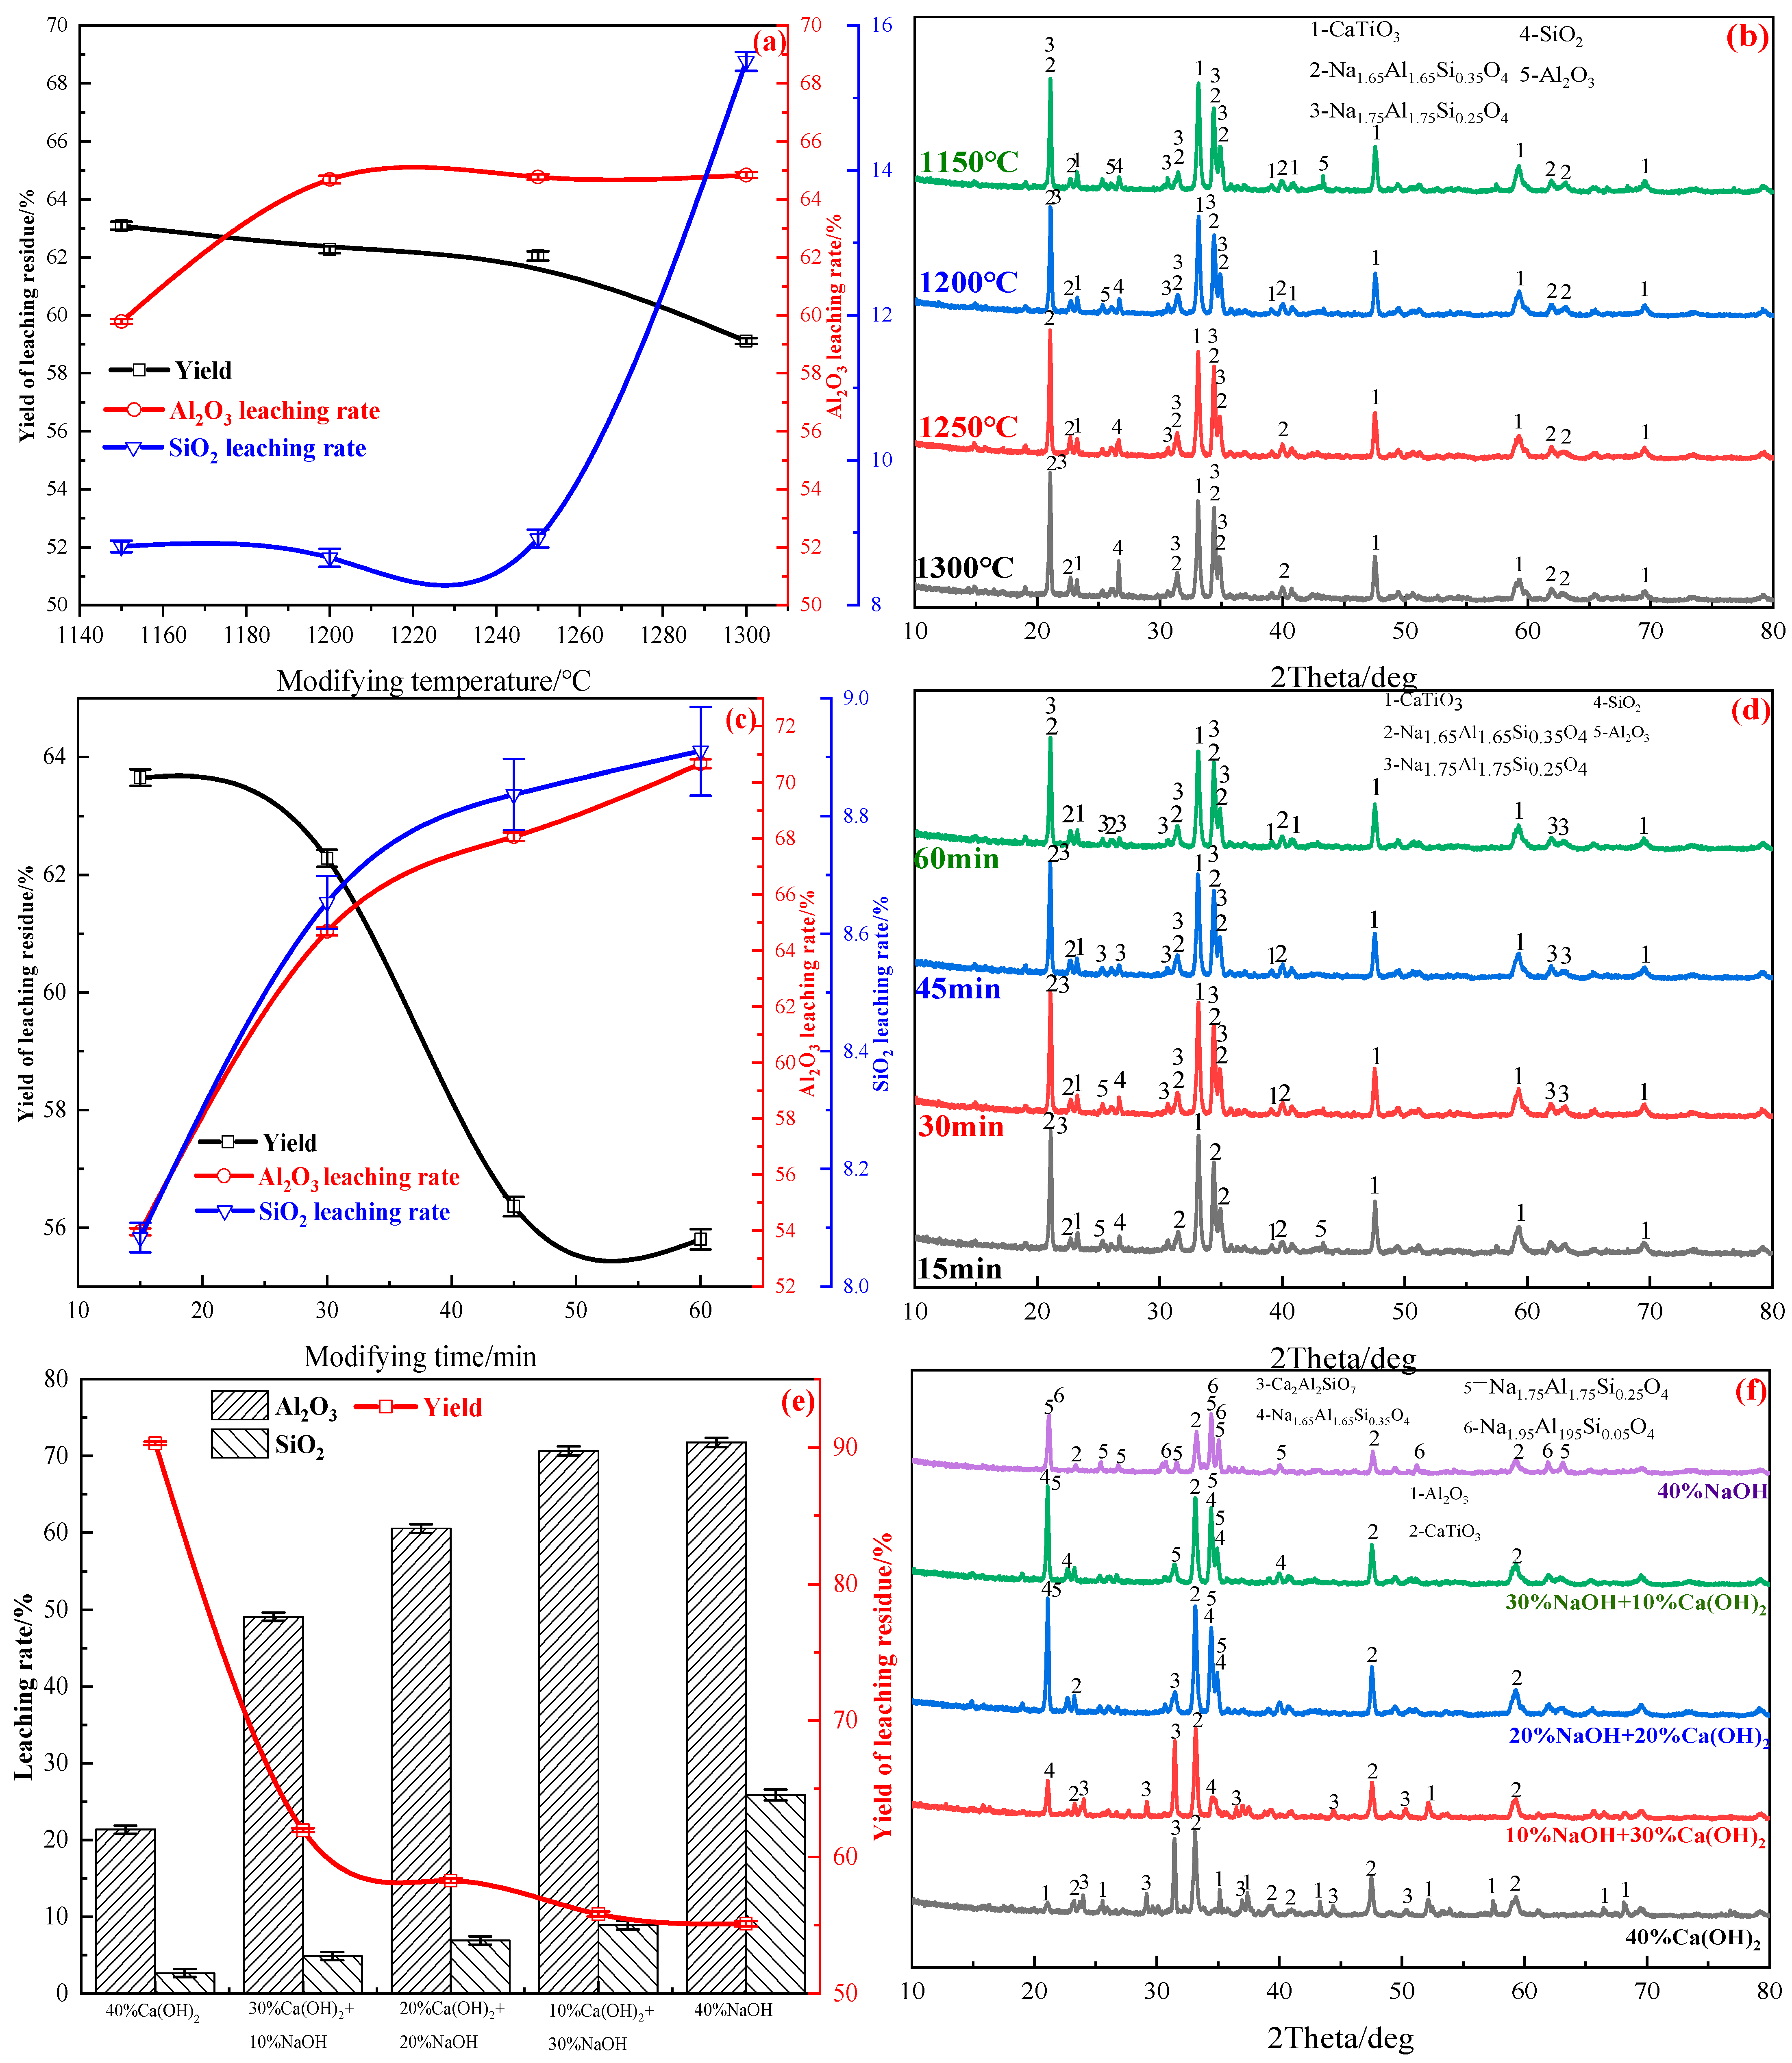
The effect of roasting temperature on the leaching ratio of Al
2O
3 and SiO
2 is shown in
Figure 5a. As shown in
Figure 5a, the yield of the alkaline leaching residue decreases from 63.10 to 59.12% with a temperature increase from 1150 to 1300 °C. Meanwhile, the leaching rate of Al
2O
3 and SiO
2 increases from 59.78 and 8.84% to 64.83 and 15.49%, respectively.
Figure 5b shows that the content of Al
2O
3 decreases with elevating the temperature from 1150 to 1250 °C, indicating that most Al-bearing minerals achieve the mineral phase reconstruction, increasing the Al
2O
3 leaching rate. As the temperature increases from 1250 to 1300 °C, the content of SiO
2 increases due to the mullite decomposition. Meanwhile, the increase in the SiO
2 leaching rate results in poor Al extraction selectivity by alkaline leaching. Therefore, the recommended optimal roasting temperature is 1200 °C.
Figure 5c shows the effect of roasting duration on the Al
2O
3 extraction. The yield of alkaline leaching residue decreases from 63.65 to 55.81%, prolonging the roasting time from 15 to 60 min. Meanwhile, the leaching rate of Al
2O
3 increases from 53.96 to 70.66%, as shown in
Figure 5c. The content of Al
2O
3 decreases with prolonging the duration from 15 to 60 min, meaning that a long roasting time is beneficial to improve the transformation of corundum (Al
2O
3) and nepheline (NaAlSiO
4) to sodium aluminate (NaAlO
2), as shown in
Figure 5d. Overall, the suggested optimal roasting time is 60 min.
The effect of additives on the Al
2O
3 extraction is shown in
Figure 5e. The yield of the alkaline leaching residue decreases from 90.30 to 55.10% with an increase of the NaOH dosage from 0 to 40%. Meanwhile, the leaching rate of Al
2O
3 and SiO
2 increases from 21.34 and 2.65% to 71.75 and 25.8%, respectively.
Figure 5f shows that the mineral phases of the roasted slag obtained at a 40% Ca(OH)
2 dosage are Ca
2Al
2SiO
7, Al
2O
3, and CaTiO
3. Increasing the NaOH dosage to 10%, the diffraction peak intensity of Al
2O
3 and Ca
2Al
2SiO
7 decreases, while the diffraction peak of Na
1.65Si
1.65Al
0.35O
4 appears. By further increasing the NaOH dosage to 20%, the diffraction peak intensity of Ca
2Al
2SiO
7 keeps decreasing, while the diffraction peak of Al
2O
3 disappears. At 30% NaOH and 10%Ca(OH)
2, the mineral phases of the modified slag are Na
1.65Si
1.65Al
0.35O
4, Na
1.75Si
1.75Al
0.25O
4, and CaTiO
3. The diffraction peak of Na
1.65Si
1.65Al
0.35O
4 is transformed to Na
1.95Si
1.95Al
0.05O
4 with an additive content of 40% NaOH. Increasing the NaOH dosage is beneficial to promoting the reconstruction of Al-bearing minerals. However, when only NaOH is added, the leaching rate of SiO
2 is 25.80%, indicating that solely adding NaOH disrupts the selective extraction of aluminum. Therefore, the recommended optimal additive contents are 30% NaOH and 10% Ca(OH)
2.
The MPRS was obtained by roasting the SSS at 1200 °C for 60 min with 30% NaOH and 10% Ca(OH)
2. The mineral phases of the MPRS determined are shown in
Figure 5f. The main mineral phases are Na
1.65Al
1.65Si
0.35O
4, Na
1.75Al
1.75Si
0.25O
4, and CaTiO
3. The mineral phases of Al
2O
3 and SiO
2 in these phases in the MPRS are listed in
Table 4. Compared with the SSS, the soluble Al
2O
3 increases in the MPRS, and the silicate content changes slightly, indicating that adding Ca
2+ and Na
+ can promote the transformation of corundum (Al
2O
3) and nepheline (NaAlSiO
4) phases to soluble Al
2O
3. The detailed mechanism of the modification process is described as follows:
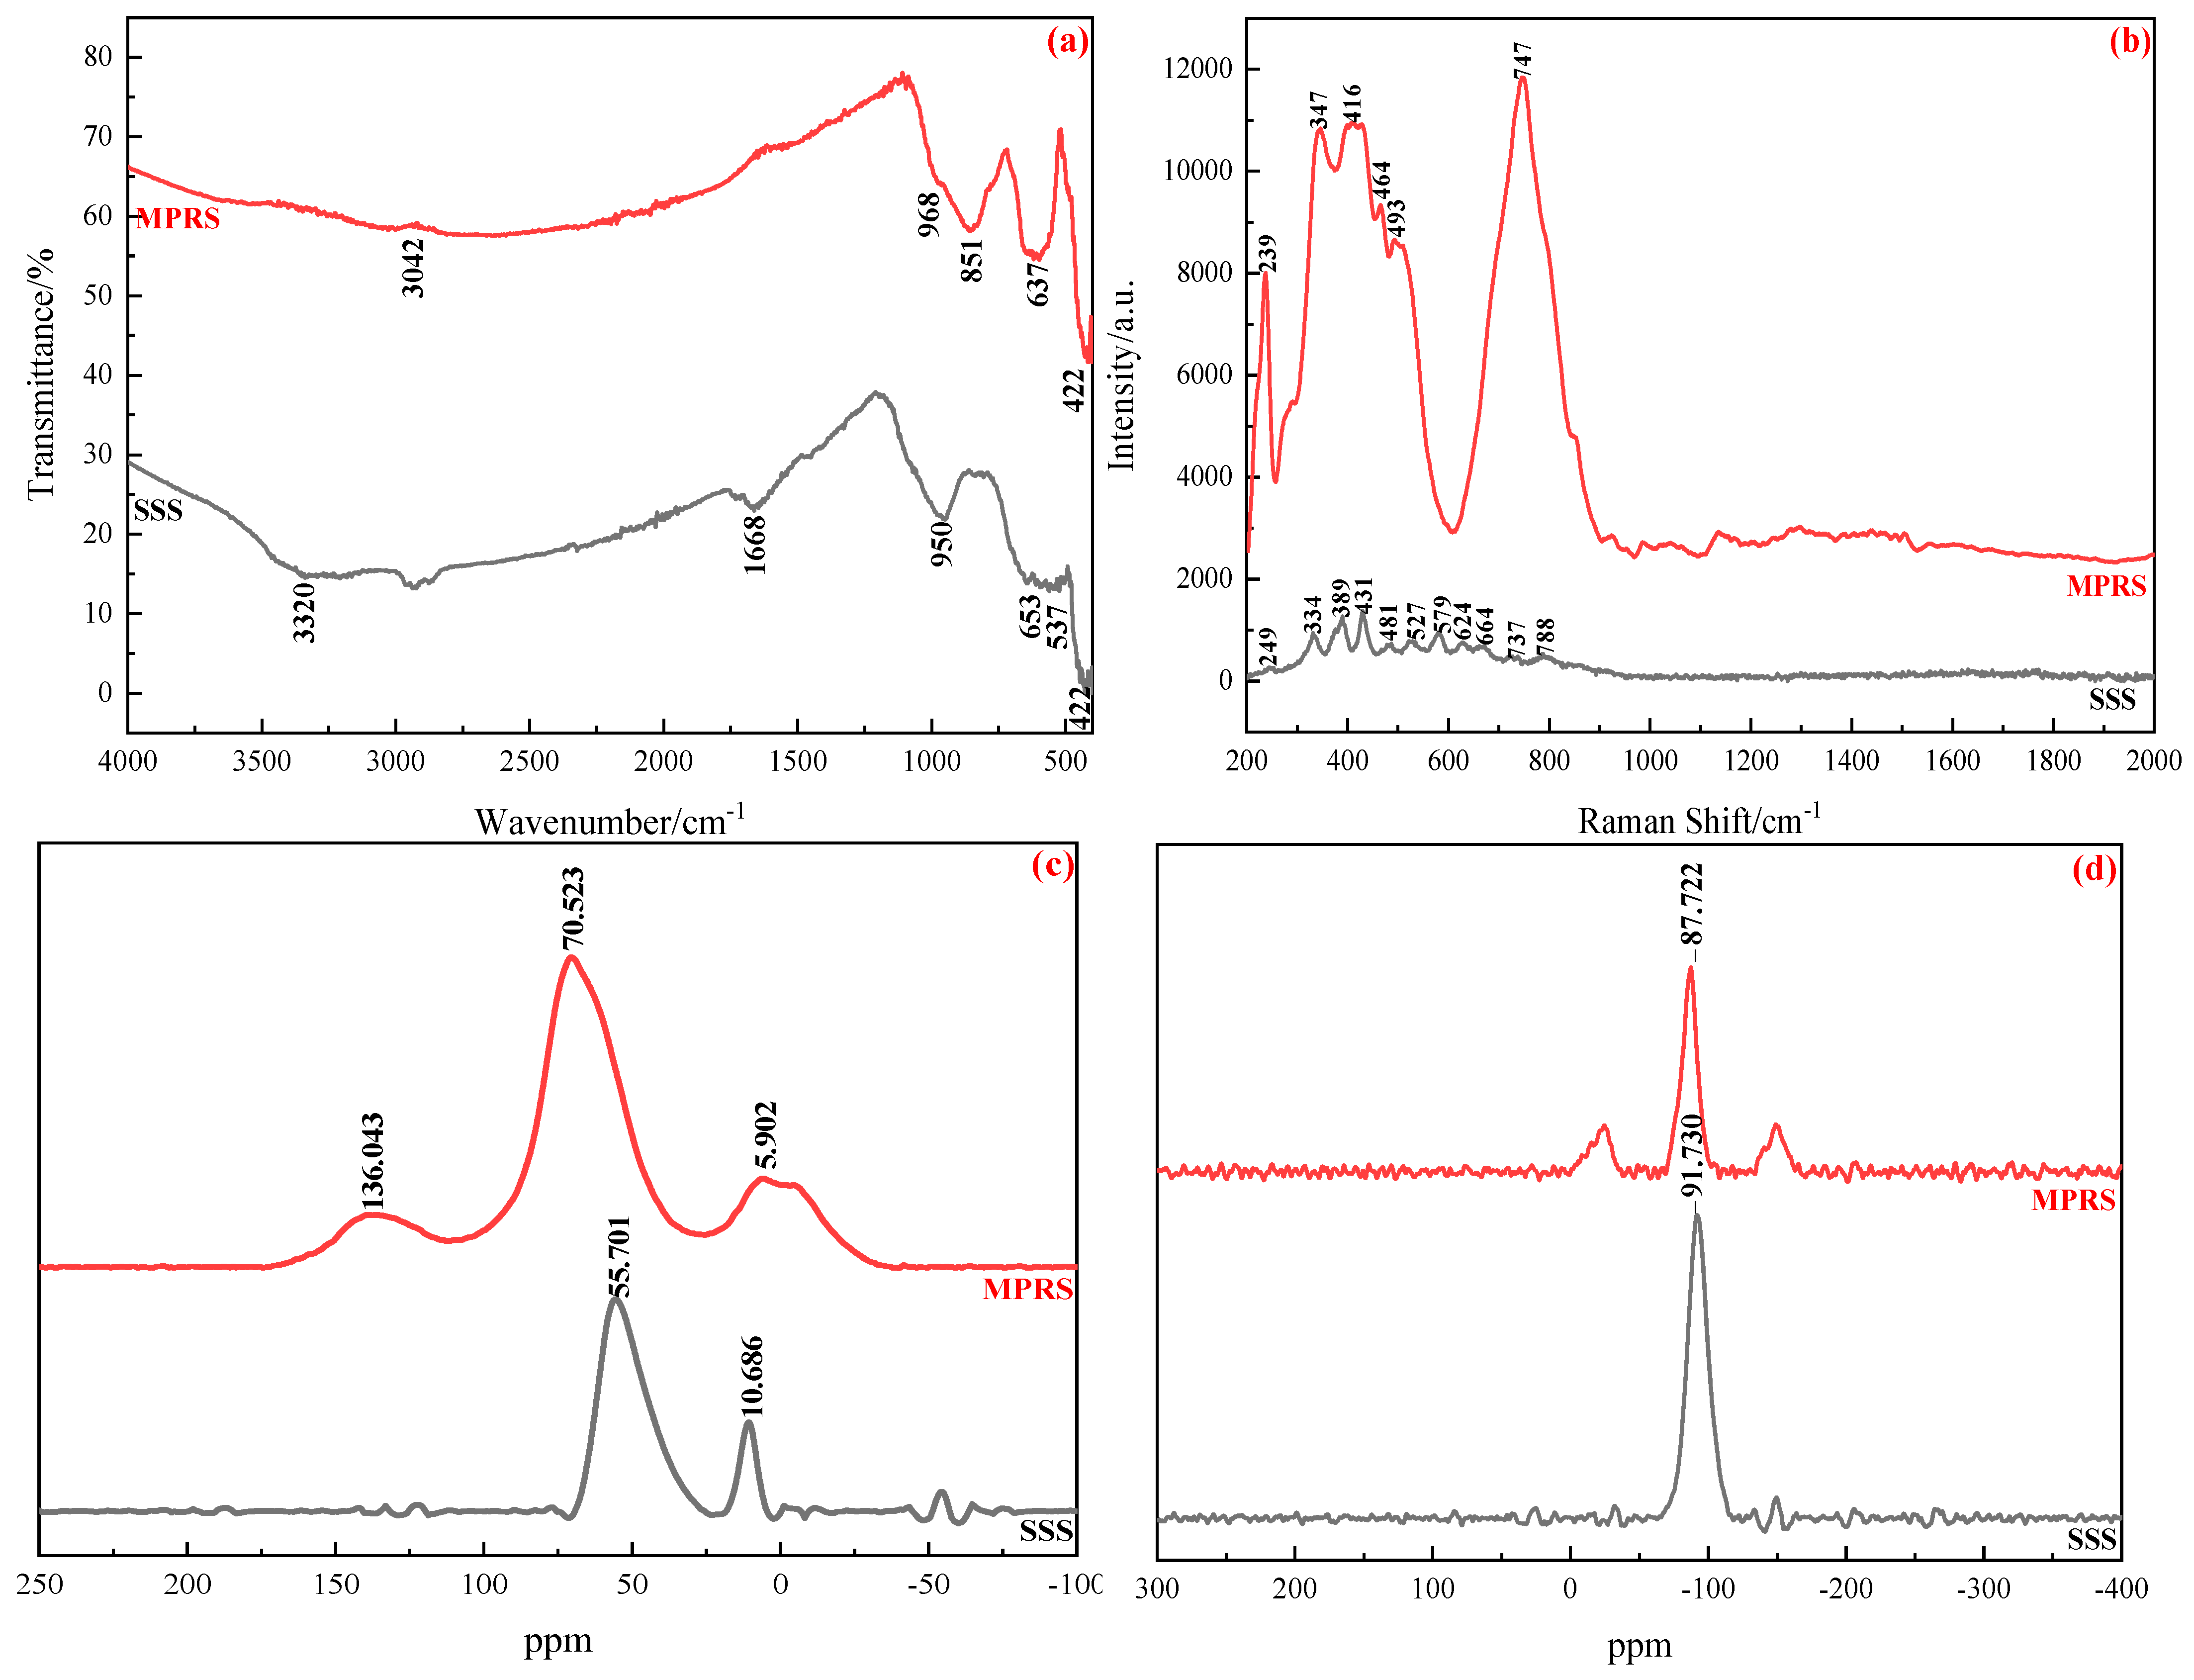
The functional groups of the SSS and MPRS were examined by FTIR spectroscopy (
Figure 6a). The peaks at 3320 and 1668 cm
−1 belong to the stretching vibration of the O-H band in hydroxyl groups and water absorbed on the surface of SSS, respectively. The absorption peaks at 950 and 422 cm
−1 are related to the antisymmetric vibration of Si-O and the bending vibration of Si-O-Si, respectively. The vibration peaks at 537 and 653 cm
−1 originate from the vibration of Ti-O-Al and the stretching vibration peaks of Al-O in the aluminum oxide octahedron [AlO
6]. In the FTIR spectrum of the MPRS, the absorption peak at 968 cm
−1 belongs to the antisymmetric vibration of Si-O; a small shift exists compared to that of SSS due to the influence of Ca
2+ and Na
+ from the additives, indicating that the Si-O network is gradually split and depolymerized, forming Si-O-Ca after modifying. The absorption peak at 851 cm
−1 is related to the symmetric stretching vibration of Al-O-Al, indicating that the amount of Al
3+ participating in the formation of sodium aluminate is increased, facilitating the dissolution of Al
2O
3 in the leaching process [
23,
24,
25].
Raman spectroscopy was applied to get better insight into the functional groups of the two slags, and the results are shown in
Figure 6b. The peaks at 334 and 389 cm
−1 belong to the stretching vibration of Si-O in the SSS. The peaks at 431 and 481 cm
−1 are related to the Si-O-Si bending vibration, cation participation, and its long-range-ordered framework vibration. The peaks in the range of 524–700 cm
−1 belong to the antisymmetric stretching vibration of Al-O. Compared with the wavenumber shifts of SSS, the wavenumber shifts of Al-O disappear. The width and intensity of Ti-O, Si-O, and Al-O-Si vibration peaks increase with the addition of Ca
2+ and Na
+, implying that the activities of Al
2O
3 and SiO
2 increase, increasing the leaching rates of Al
2O
3 and SiO
2 [
26,
27].
Figure 6c,d show the MAS NMR spectra of
27Al and
29Si in the two slags. The chemical shifts of
27Al in the SSS are 55.70 ppm and 10.69 ppm, the former assigns to 4-coordinated (tetrahedral) Al, and the latter belongs to 6-coordinated (octahedral) Al species. The chemical shift of
29Si is −91.73 ppm, which belongs to the Q
3 layer groups. Compared with the SSS, an increase of the 4-coordinated Al content and a corresponding decrease for Al in 6-coordinated appear in the MS, indicating that alumina becomes more active. The chemical shift of
29Si in the MPRS belongs to the Q
2 chain-shaped structure. The different chemical shifts represent the silicon Q
n environments, where n is the number of bridging oxygen atoms linked to other Si atoms for each Q(SiO
4) unit [
28,
29]. The difference in the Si structure between SSS and MPRS indicates that the polymerization degree of the MPRS is lower than that of the SSS. Meanwhile, the Ca-O-Si bond is formed. The results agree with the FTIR spectra.
In summary, the addition of Ca2+ and Na+ has a significant influence on the structural change of the SSS and is conducive to the transformation of corundum and nepheline to sodium aluminate and calcium silicate.
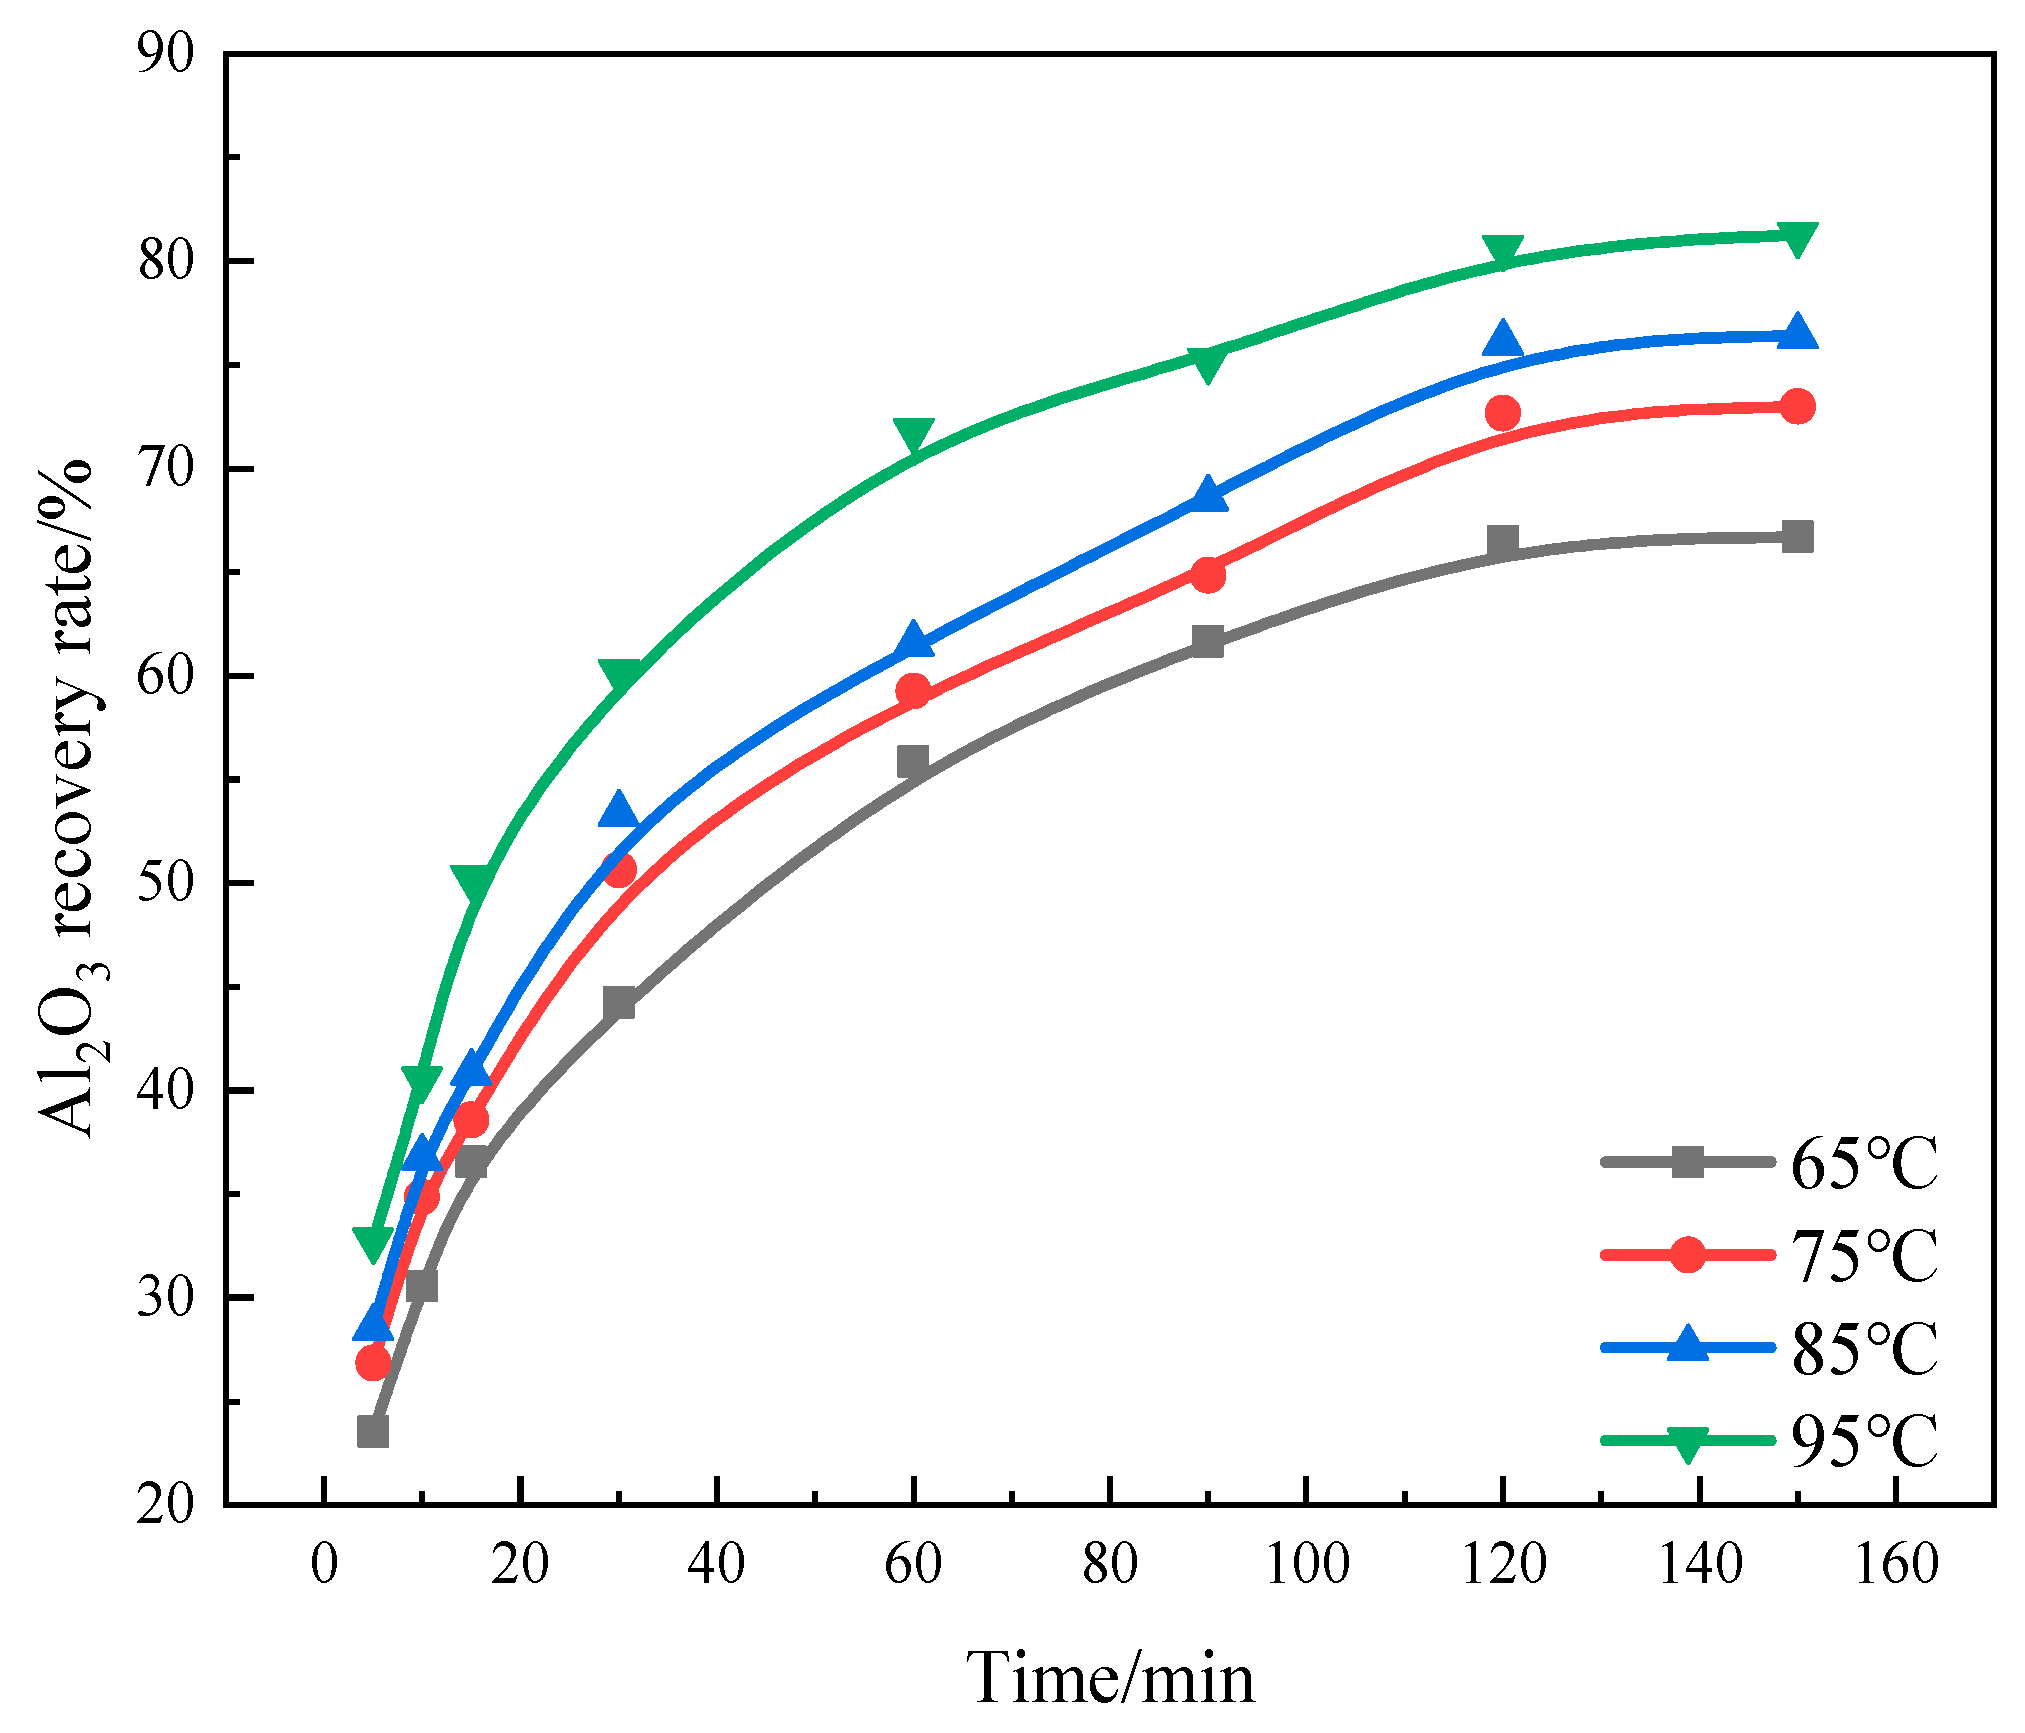
3.2. Alkaline Leaching of the MPR Slag
The effect of leaching temperature is examined in the ranges from 65 to 95 °C at a NaOH concentration of 4 mol/L, a liquid-to-solid ratio of 10 mL/g, and a 75%-particle size less than 200 mesh. The results are shown in
Figure 7. It can be seen that prolonging the leaching time positively impacts the Al
2O
3 recovery rate. The Al
2O
3 recovery is 66.50% at a leaching temperature of 65 °C for 120 min. Meanwhile, the recovery of Al
2O
3 is 80.66% at a leaching temperature of 95 °C, indicating that high temperature is conducive to the extraction of Al
2O
3.
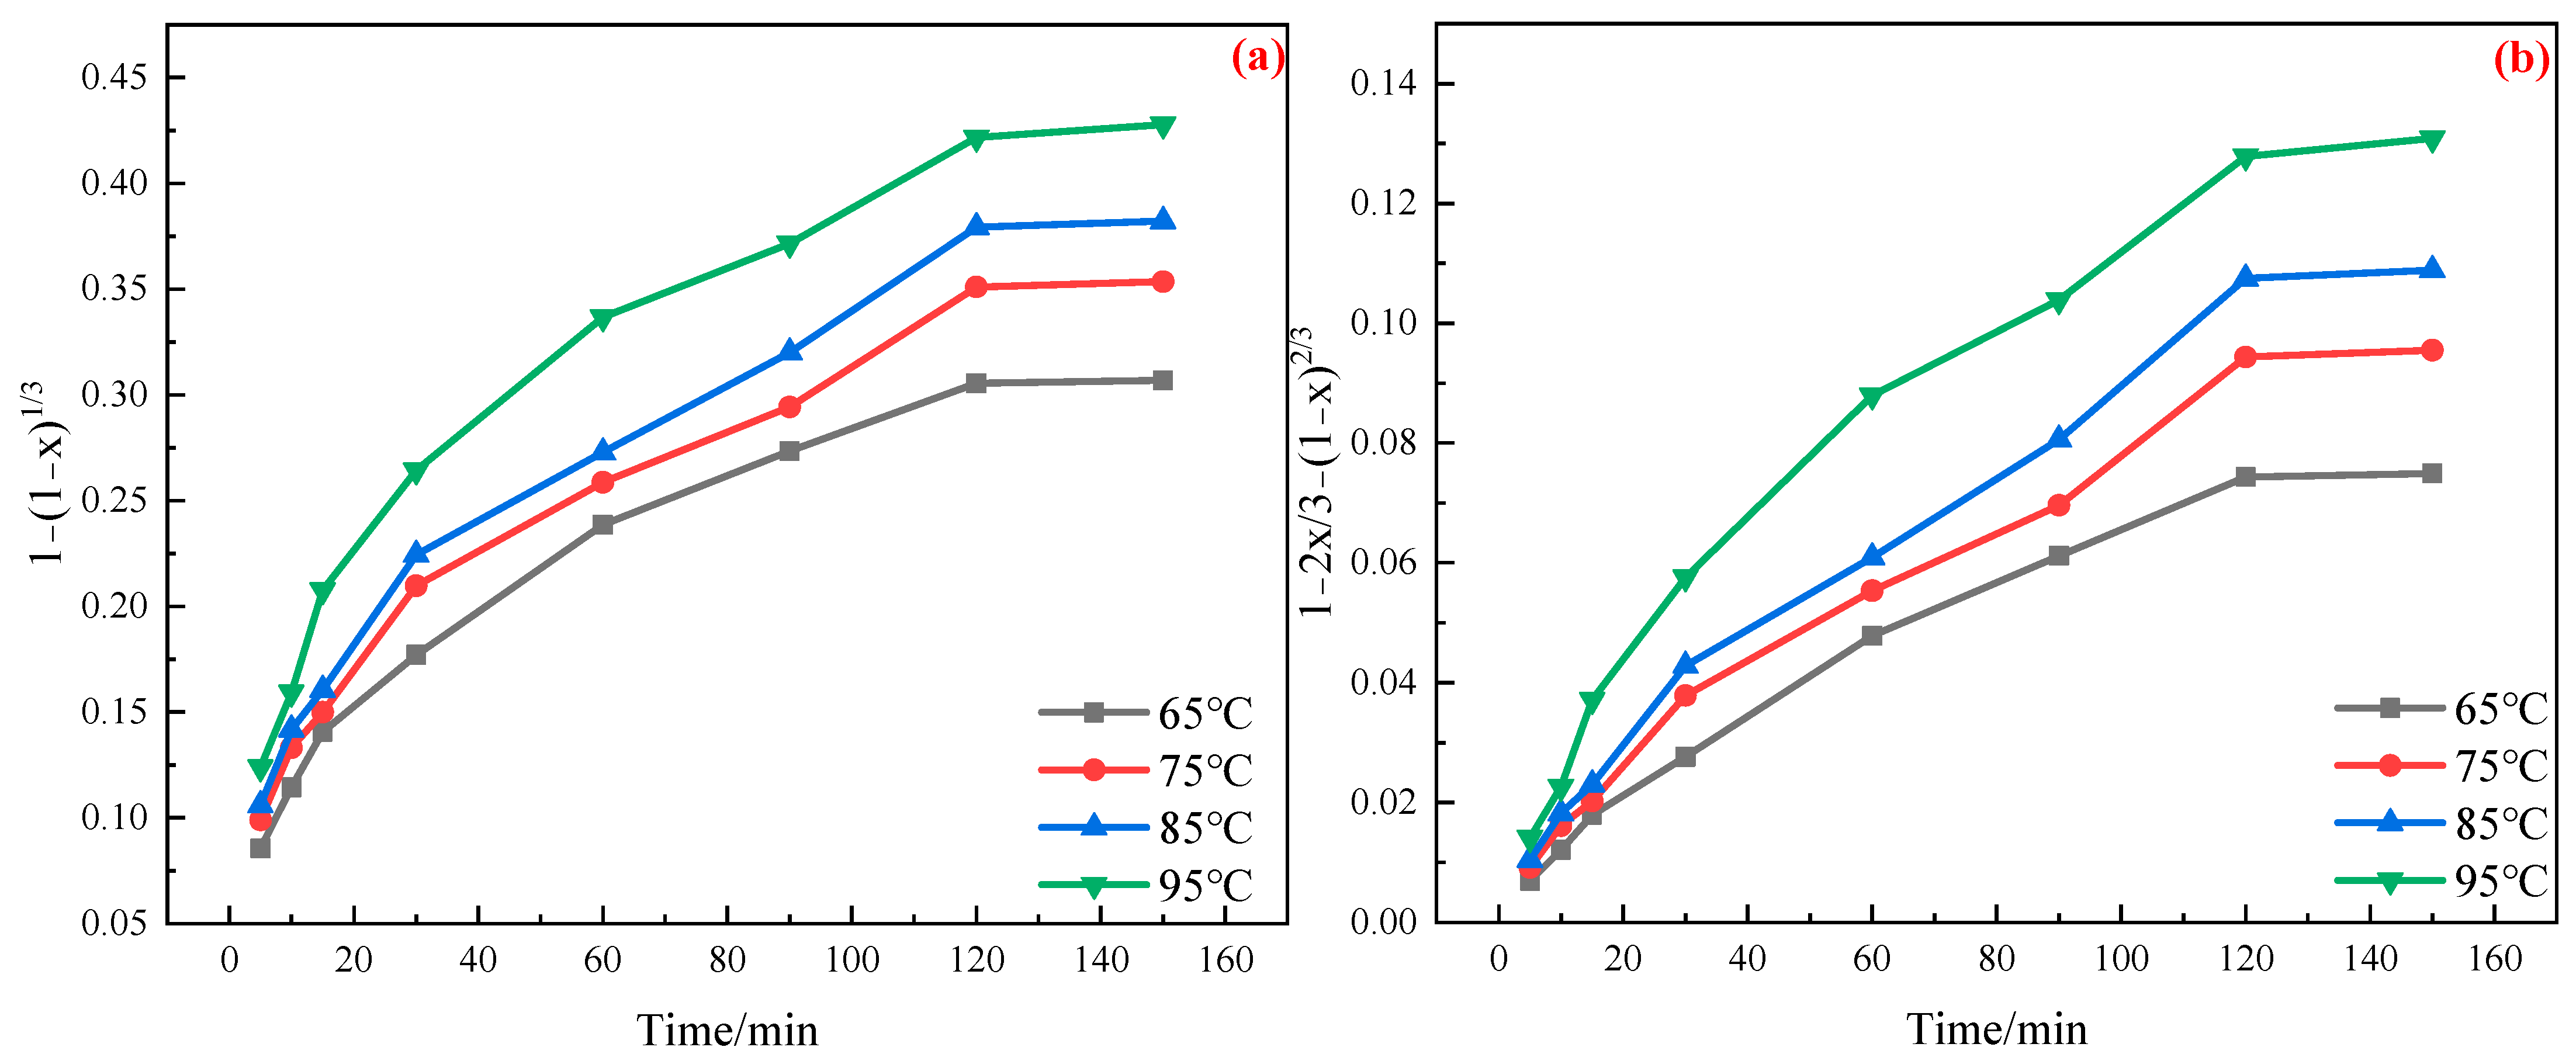
According to the experimental data from
Figure 7, the plots of 1 − (1 − x)
1/3 − t and 1 − 2x/3 − (1 − x)
2/3 − t are depicted in
Figure 8, and the G(a)-t correlation coefficient is shown in
Table 5. The plot of 1 − 2x/3 − (1 − x)
2/3 − t exhibits an excellent linear relation, indicating that the leaching process is controlled by internal diffusion.
To calculate the apparent activation energy, the plot of lnk-1/T should be a straight line with a slope of -E/R and an intercept of lnk
0. According to the Arrhenius equation and
Table 5, the linear fitting between lnk-1/T was calculated and presented in
Figure 9. The apparent activation energy of the leaching process is 16.21 kJ/mol, which agrees with the results presented in the reference [
30] when the reaction process is controlled by internal diffusion. According to the results in
Figure 7, the following kinetic expression can be derived to describe the leaching process: 1 − 2x/3 − (1 − x)
2/3 = [1.61 × 10
−2 × exp(−1949.72/T)] × t.
The leaching process was controlled by the internal diffusion of the liquid reactant through the reaction interface. Some parameters were optimized, such as alkaline concentration, leaching temperature, time, liquid-to-solid ratio, and particle size, to improve the Al2O3 extraction.
Fixing the liquid-to-solid ratio at 10 mL/g and a 75% particle size less than 200 mesh, the MPR slag was leached at 95 °C for 120 min. The effect of the alkaline concentration on the recovery of Al
2O
3 is illustrated in
Figure 10a. The yield of leaching residue decreases from 59.49 to 47.70% with an increase in the alkaline concentration from 2 to 4 mol/L. Meanwhile, the leaching rates of Al
2O
3 and SiO
2 increase from 70.66 and 8.93% to 80.66 and 10.29%, respectively. The Al
2O
3 content in leaching residue decreases from 17.57 to 14.78%. However, the SiO
2 content increases from 10.90 to 13.71%. Further increasing the alkaline concentration has a slight impact on the indexes. The dissolution rate of sodium aluminosilicate increases with the alkaline concentration. However, increasing the alkaline concentration further has little effect on the dissolution rate of sodium aluminosilicate, although it raises the operation cost. Therefore, the recommended optimal alkaline concentration is 4 mol/L.
As shown in
Figure 10b, the leaching temperature is 65 °C, and the leaching residue yield is 64.12%. The corresponding leaching rates of Al
2O
3 and SiO
2 are 66.50 and 8.97%, respectively, and the grade of Al
2O
3 and SiO
2 is 19.05 and 10.35%, respectively. By increasing the temperature to 95 °C, the yield decreases to 47.70%. The leaching rates of Al
2O
3 and SiO
2 increase to 80.66 and 10.29%. Meanwhile, the grade of Al
2O
3 and SiO
2 is 14.78 and 13.71%, respectively. The leaching rate of sodium aluminosilicate increases with the leaching temperature, enhancing the leaching rate of Al
2O
3. Therefore, the proposed optimal leaching temperature is 95 °C.
The effect of leaching time on the recovery of Al
2O
3 is illustrated in
Figure 10c. The yield decreases from 61.59 to 47.70% with an increase in the leaching time from 60 to 120 min. The leaching rates of Al
2O
3 and SiO
2 increase from 71.82 and 9.26% to 80.66 and 10.29%, respectively. Prolonging the leaching time to 150 min, these indexes change slightly. Therefore, the proposed optimal leaching time is 120 min.
As shown in
Figure 10d, the leaching rate of Al
2O
3 increases rapidly as the liquid-to-solid ratio raises from 3 to 10 mL/g. Moreover, as the liquid-to-solid ratio increases, the content of NaOH increases, and the particles possess a higher contact area to react with NaOH. Therefore, the optimal liquid-to-solid ratio is 10 mL/g.
It can be seen from
Figure 10e that the leaching rates of Al
2O
3 and SiO
2 increase from 80.66 and 10.29% to 84.91 and 13.40%, respectively, with the particle size increasing from 75 to 90%, passing through a 200 mesh. According to the dynamic model, the leaching process is controlled by internal diffusion. When the particle size is refined, the diffusion rate increases, and the energy barrier required for the reaction decreases. Therefore, the optimal particle size is set at 90%, passing through a 200 mesh.
The main chemical composition of various leaching residues is presented in
Table 6. The content of TiO
2 and CaO of the alkaline leaching residue is 17.97 and 16.81%, respectively, exhibiting high utilization values. However, there is no effective measure to recover calcium and titanium from RM. In addition, it also contains 12.71% Al
2O
3, 14.58% SiO
2, and 14.54% Na
2O, respectively. According to the acid solubility difference between perovskite and gangue, the subsequent acid leaching can further remove Al
2O
3 and SiO
2 to enrich TiO
2. Keeping the liquid-to-solid ratio at 10 mL/g, the leaching is performed at 30 °C for 30 min using 20 wt.% HCl to remove Al
2O
3 and SiO
2, while CaO and TiO
2 remain in the residue. The acid-leaching residue contains 46.53% TiO
2 and 37.21% CaO. The main impurities in TiO
2 were 6.04% Fe, 4.8% Al
2O
3, and 0.81% SiO
2. To compare the mineral phase composition before and after acid leaching, XRD patterns are presented in
Figure 11. Before acid leaching, the main mineral phase is perovskite. In addition, there is a small amount of NaAlSi
3O
8. However, the diffraction peaks of NaAlSi
3O
8 disappear after acid leaching, indicating that SiO
2 is removed. Additionally, the diffraction peaks of perovskite exhibit increased intensities, indicating that perovskite is purified by removing Al
2O
3, SiO
2, and Na
2O.
Figure 12 shows the microstructures of different leaching residues. It can be seen that the alkaline-leaching residue is mainly spherical and has good dispersion. The acid-leaching residue is severely agglomerated and the particle size is decreased.
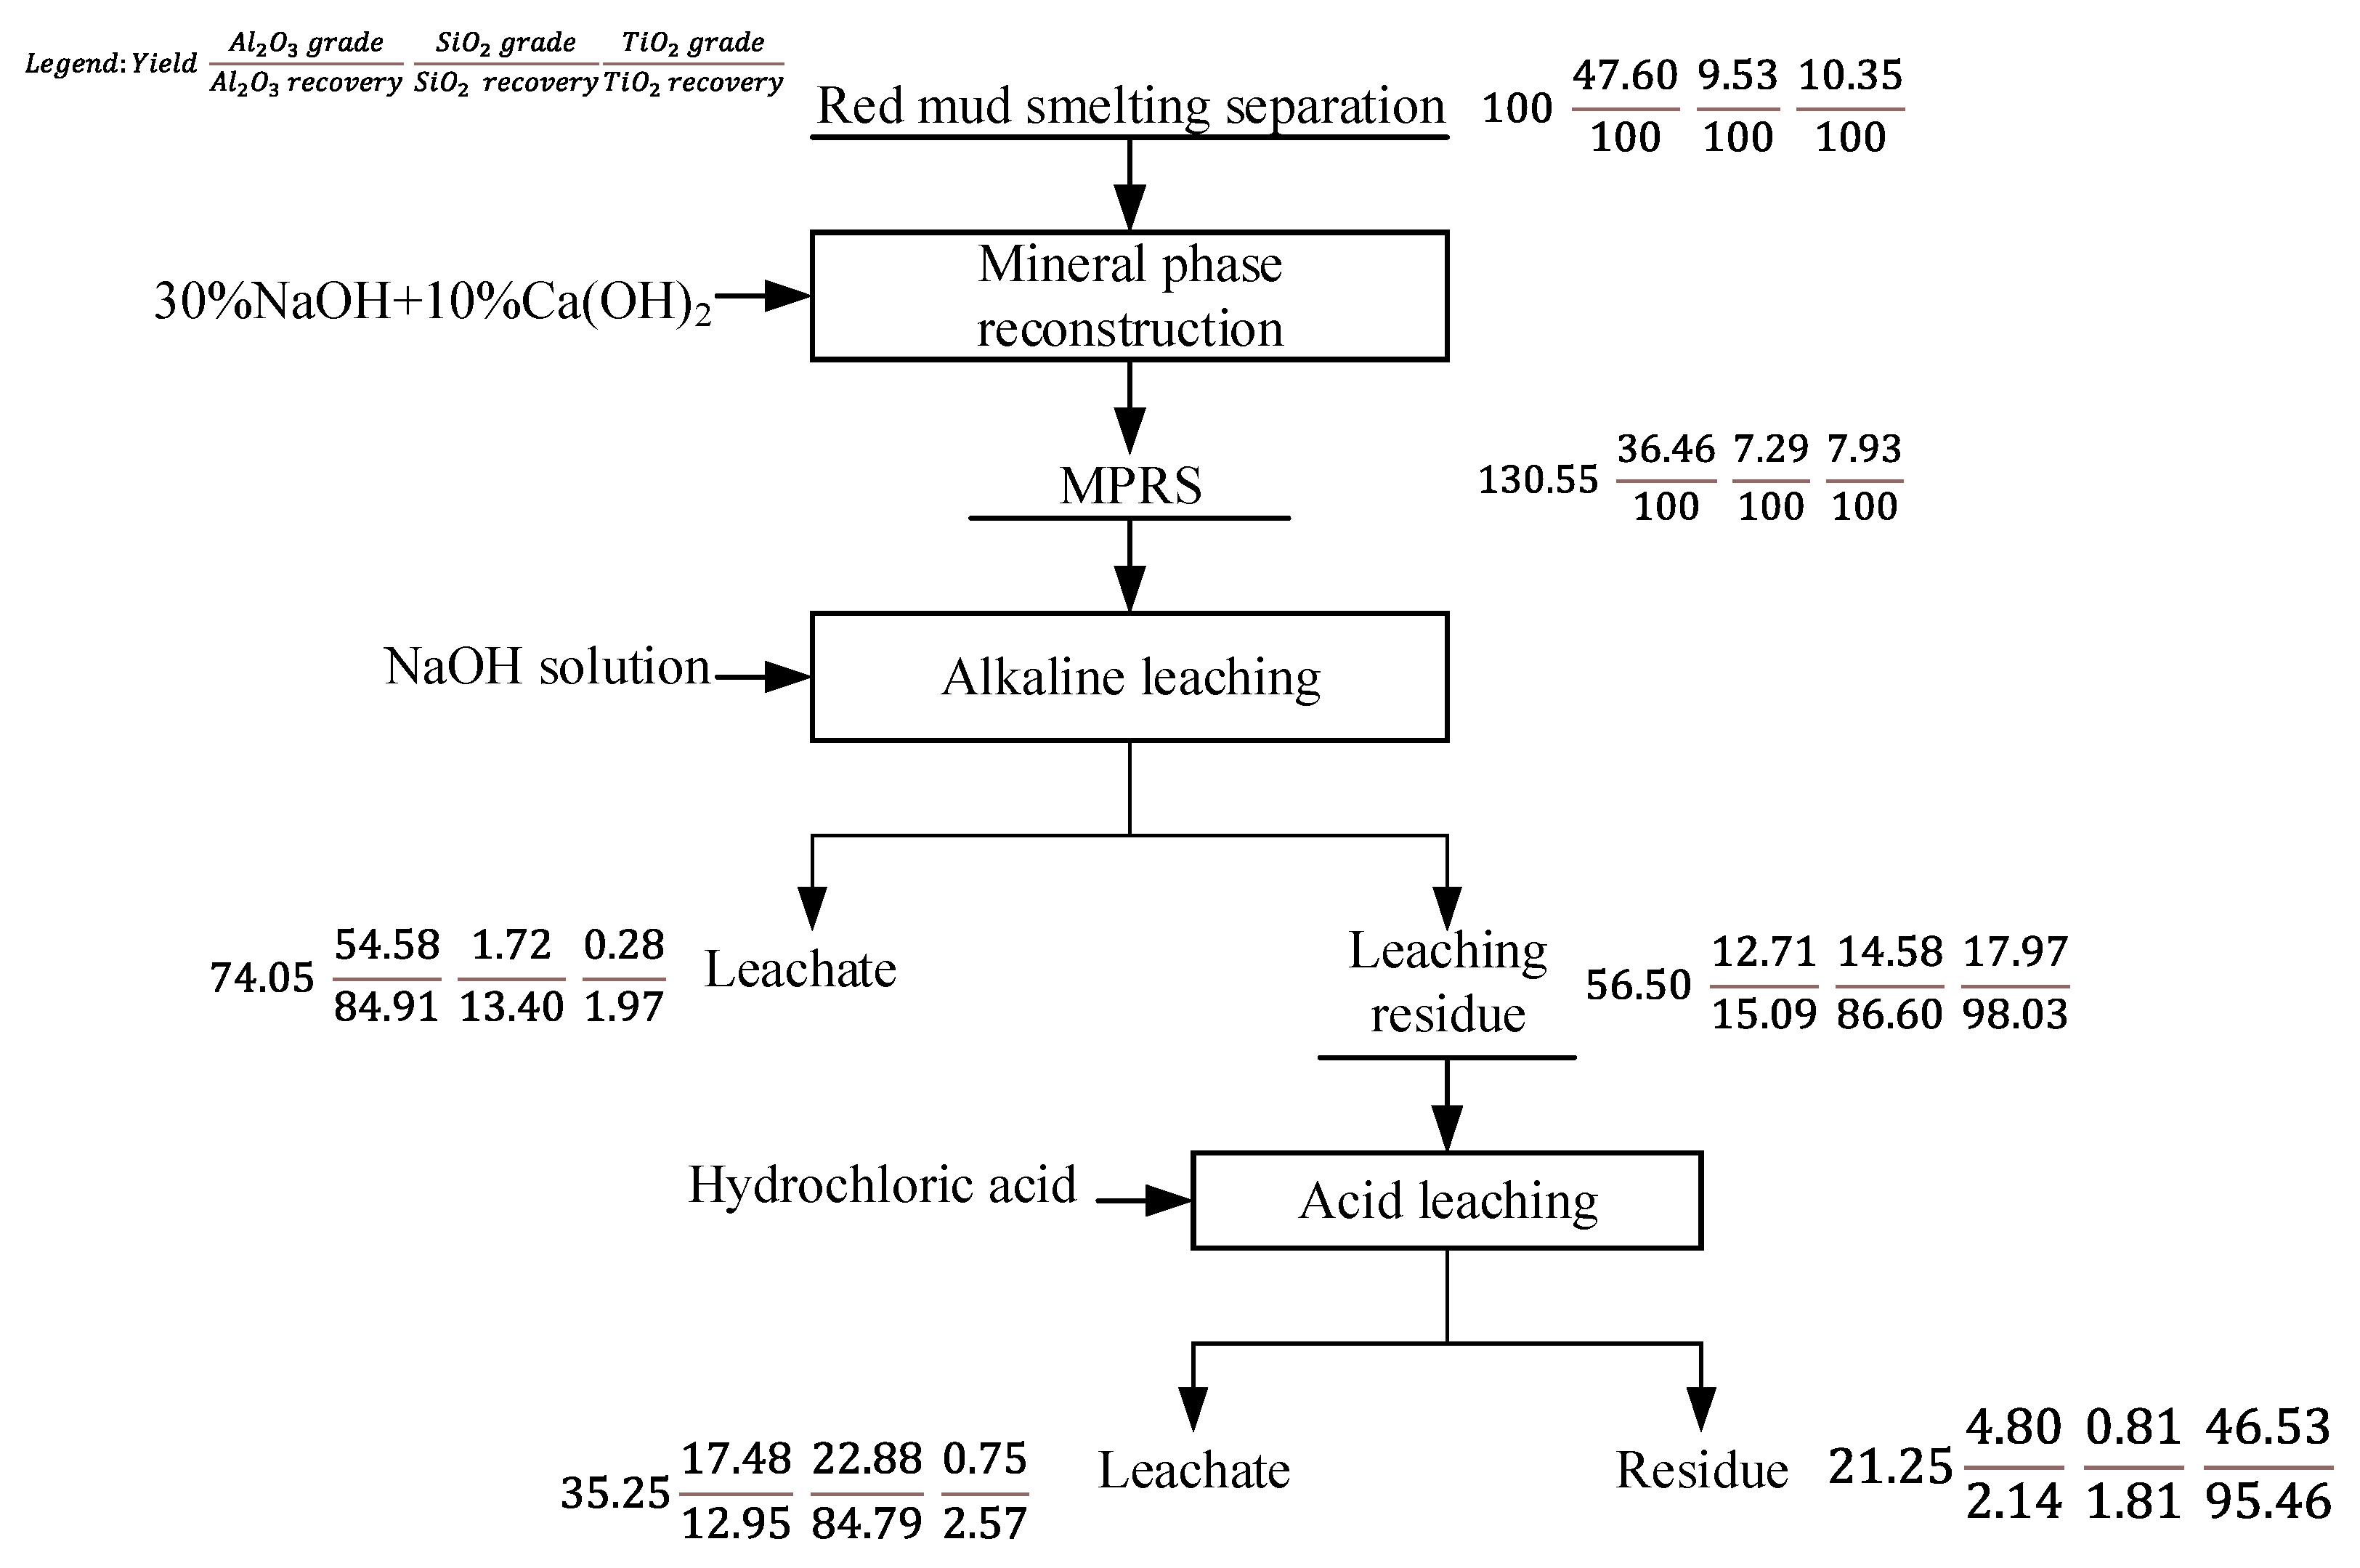
From the above research, we proposed a novel process for the recovery Al
2O
3 and TiO
2 from red mud smelting separation slag, including mineral phase reconstruction-alkaline leaching to extract Al
2O
3 and hydrochloric acid leaching to recover TiO
2. The elements balance in the full flowsheet are presented in
Figure 13. The Al
2O
3 is extracted in sodium aluminate solution at an overall Al
2O
3 extraction of 84.91% after alkaline leaching and TiO
2 is recovered in perovskite concentrate assaying 46.53% TiO
2 at an overall TiO
2 recovery of 95.46%.


