Article

Effect of Particle Size Distribution on the Printing Quality and Tensile Properties of Ti-6Al-4V Alloy Produced by LPBF Process

1
Key Laboratory for Light-Weight Materials, Nanjing Technology University, Nanjing 211816, China
2
FalconTech Co., Ltd., Wuxi 214145, China
*
Authors to whom correspondence should be addressed.
Metals 2023, 13(3), 604; https://doi.org/10.3390/met13030604
Submission received: 13 February 2023 / Revised: 10 March 2023 / Accepted: 14 March 2023 / Published: 16 March 2023
(This article belongs to the Section Additive Manufacturing)

Abstract

:
The efficiency of the fabrication and the cost of feedstock materials are important constraining factors for a wider application of the laser powder bed fusion (LPBF) process in the industry. Therefore, it is necessary to investigate the feasibility of using different particle size distributions (PSD) combined with higher layer thickness for achieving higher building efficiency and cost-effectiveness. This paper focuses on the effect of PSD (0–53, 15–53, 15–75, and 15–105 μm) on the print quality and mechanical properties of the LPBF-processed Ti-6Al-4V at a layer thickness of 60 μm. The results show that volumetric energy density (VED) range, which allows the coarse powder to reach full density, becomes relatively narrower but is still capable of producing fully dense parts when the parameters are properly adjusted. Among the fully dense specimens, the surface roughness varies slightly with the increase of VED and PSD. In the case of proper parameter selection, specimens made of coarse powder can still achieve low surface roughness. Only slight differences in mechanical performance are found for specimens produced using different PSD powders as they have almost identical microstructures. The issue of the anisotropic mechanical properties of the as-built specimens is resolved after annealing treatment at 800 °C for 2 h. This study provides a guideline for producing high-quality Ti-6Al-4V parts using a higher layer thickness and coarser powders.

1. Introduction

Laser powder bed fusion (LPBF), as a powder-bed-based additive manufacturing (AM) technology, allows for producing complicated-geometry components with high dimensional accuracy, low surface roughness, and low material waste [1,2]. In LPBF, the high-energy laser beam melts the metal alloy powder in the designed two-dimensional cross-section which facilitates layer-by-layer printing from the bottom up [3,4,5]. Ti-6Al-4V is the widest-used titanium alloy in LPBF technology, because of its high strength, low density, and excellent corrosion resistance, which has made it an important raw material for aerospace and other applications [6,7,8,9].
As LPBF uses alloy powders as raw material, the properties of the metal powder are crucial for the final manufactured part. The powder properties, such as particle granulometry, particle morphology, and impurity content, have a significant impact on the spreading performance, the packing ability, the effective powder thermal conductivity, the laser interaction with the material, and thus the dynamics of the melt pool [10,11]. As one of the basic characteristics of powders, particle size distribution (PSD) is generally considered to be a key quality metric for many powder handling processes including the LPBF process [12]. Generally, the powder with high sphericity and proper PSD facilitates good packing density and flowability, thus enabling the fabrication of parts with high density and good mechanical properties. The proper PSD here refers to the powder used having a good particle size range without too many fine particles (<10 μm) or coarse particles (>75 μm) corresponding to the commonly used layer thickness of 30–50 μm [13]. A powder size of 15–53 µm is commonly used by the LPBF process, and it is not advisable to pursue a very fine powder or coarse powder. If the PSD is not well selected (very fine or coarse particles), the printability, part density, surface quality, as well as the mechanical performance of the materials produced can be significantly affected [14,15,16]. Fine particles can be easier to be molten in respect to the coarser particle, generally increasing powder bed packing density and favoring part densification and surface quality [17,18]. On the other hand, very fine powders present lower flowability, caused by their higher tendency towards cohesion and agglomeration due to stronger inter-particle attractive forces, and an increased oxidation content. As reported by Balbaa et al. [19], inferior densification levels were achieved in the case of fine AlSi10Mg powder (0–20 μm) compared to the case of coarse powder due to its lower powder bed packing density and higher oxygen content. Pleass and Jothi [20] characterized and processed three IN625 powders with different PSDs and determined that the fine powder was not processable owing to poor flowability. Meanwhile, the presence of large powder particles within the powders can also present challenges to the LPBF process. A study by Soltani-Tehrani et al. [17] found that the coarse powder led to more manufacturing defects (e.g., pores or lack of fusion) due to an inferior packing density and a relatively lower laser absorption rate. Similar observations were also reported in the LPBF-processed 316L by Günther et al. [13]. In addition, PSD affects the surface finish because powders with coarser particles result in a rougher surface due to the adhered large particles to the surface [21]. The influences of PSD on microstructure and mechanical properties were far less significant than part density, surface roughness, and accuracy of printed parts [19,22,23,24]. Soltani-Tehrani et al. [17] reported negligible variations in microstructure, UTS, and YS between specimens made from fine and coarse Ti-6Al-4V powder batches. A different view has also been put forward by Liu et al. [25], finding that 316L stainless steel powders with a narrower PSD provide better flowability, producing parts with higher UTS and higher hardness. Based on the above studies, PSD has a considerable influence on the LPBF process, while some of the results are contradictory, and the direction relationship between the PSD and part density, surface quality, and mechanical properties has not been established.
Since the powder layer thickness is directly dictated by the powder particle size, it is vital to choose appropriate processing parameters including layer thickness to achieve high-quality prints and improve manufacturing efficiency [26]. Increasing the layer thickness is an efficient way to enhance the structuring speed without rising production costs [27]. However, the part porosity and surface quality can be affected. For instance, Pal et al. [28] and Gordon et al. [29] investigated the relationship between VED and the porosity of Ti-6Al-4V at layer thicknesses of 25 μm and 30 μm. This showed that the VED reached full densification in the range of 49–97 J/mm3 at a layer thickness of 25 μm and 56–83 J/mm3 at a layer thickness of 30 μm. Panwisawas et al. [30] and Qiu et al. [31] reported an increased porosity of Ti-6Al-4V specimens when using layer thicknesses higher than 40 μm for a layer thickness range of 20–120 μm. A study by Nguyen et al. [32] found that the surface roughness of the Inconel 718 specimens increased from 3.5 μm to 12.3 μm as the layer thickness increased from 20 μm to 50 μm. Till now, the feasibility of combing a large layer thickness (e.g., no less than 60 μm) with large PSD is not well understood for LPBF Ti-6Al-4V.
Hence, this work aims to explore the application possibility of a wider PSD powder at a relatively higher layer thickness of 60 μm so as to improve the building efficiency and reduce the cost of powder feedstock. Besides, this work attempts to establish the relationship between forming window, surface roughness, and mechanical properties of Ti-6Al-4V parts using powders with different PSDs (0–53, 15–53, 15–75, and 15–105 μm). The 15–53 μm powder was employed as a reference group for this study as it is the most widely used powder PSD. The 0–53 μm powder was used to study the impacts of fine powder size, while the 15–75 μm and 15–105 μm powders were designed to explore the potential for using coarser powders in industrial production. The porosity, surface quality, and microstructural changes were analyzed using optical microscope (OM), three-dimensional profiler, and scanning electron microscope (SEM). The tensile properties of the specimens made from these four different powders were evaluated in both the as-build and annealed states.

2. Materials and Methods

2.1. Feedstock Powder

The Ti-6Al-4V powders used in this study were produced by a gas atomization process and provided by FALCONTECH (Wuxi, China). Four types of gas-atomized Ti-6Al-4V powders with different PSDs were selected as the feedstocks. The morphology of powders was observed using a TESCAN S8000 GMH SEM (TESCAN, Brno, Czech). As shown in Figure 1a–d, the powders are mostly spherical or spherical-like with some satellites attached to the surface. The PSDs of these four groups of powders were measured by laser diffraction technique using a CILAS 990 and the results are presented in Figure 1e. All of these four powders (0–53, 15–53, 15–75 and 15–105 μm) show a Gaussian distribution with mean particle sizes of 33, 35, 45, and 59 µm, respectively. In the following text, they are termed as T1, T2, T3, and T4 powder, individually. The corresponding specimens made from these four powders are named T1, T2, T3, and T4 specimens.
The flow behavior of powders was assessed using the Hall flowmeter method. In this technique, powder flowability refers to the time required for 50 g powder to flow freely through a standard funnel. Apparent density is the mass per unit volume of powder after it has been subjected to free falling. Tapping density is defined as the mass per volume of powder after vertical agitation until no significant settling occurs. Each value was measured three times and then averaged.

2.2. LPBF Process

The LPBF process was carried out using a BLT S210 machine (Bright Laser Technologies, Xi’an, China) equipped with an ytterbium fiber laser (IPG YLR-500, Karlsruhe, Germany). A schematic illustration of the LPBF Ti-6Al-4V specimens and their geometries is shown in Figure 2. To assess the processing window for these four types of powders, a range of laser parameters was used to fabricate cubes with a dimension of 10 × 10 × 15 mm3. The key processing parameters are listed in Table 1. At the laser power of 280 W, the scan speeds varied from 600 to 1800 mm/s. For a given scan speed of 1200 mm/s, the laser power changed from 200 to 400 W. A constant layer thickness of 60 μm and hatch spacing of 0.1 mm were employed. The volumetric energy density (VED) defined as the laser energy exposed to per unit volume was calculated by the following equation [33]:
E v = P V h l     ( J / mm 3 )
where P is the laser power, V is the laser scanning velocity, h   is the hatch spacing, and l is the layer thickness. The VED varied from 25.9–77.8 J/mm3 in the current study.
Based on the experimental results of porosity measurement, nine sets of laser parameters that allow the production of high-density parts were selected to assess their impacts on the surface roughness. As demonstrated in Table 2, the laser power ranges from 240 to 320 W, while the scan speed varies from 900 to 1500 mm/s. For the surface roughness measurements, both cubic and pyramidal specimens were produced. The former was used for testing the roughness of the top surface (X–Y plane), while the latter was used for evaluating the roughness of side surface with different angles as displayed in Figure 2b,c. Only the T2 and T4 powders were selected as the feedstocks to assess the PSD on the roughness of side surface based on the pyramid model.
To evaluate the effect of PSD on the mechanical properties of Ti-6Al-4V alloy, these four types of powders were fabricated using the same optimized laser process parameters. A laser power of 280 W and a scan speed of 1200 mm/s were selected to produce tensile test samples. As illustrated in Figure 2a, the tensile specimens were oriented in parallel and perpendicular to the build direction.
In order to minimize oxidation of the Ti-6Al-4V samples, the entire fabrication process was carried out under a high-purity argon atmosphere with an oxygen content below 100 ppm. The specimens were printed on the Ti-6Al-4V plates. The LPBF laser scanning direction was alternated by 67° between two adjacent layers to reduce residual stress and interlayer defects.
The printed parts were removed from the substrate by electrical discharge wire-cutting. The tensile test specimens were annealed at 800 °C for 2 h in a vacuum oven followed by furnace cooling.

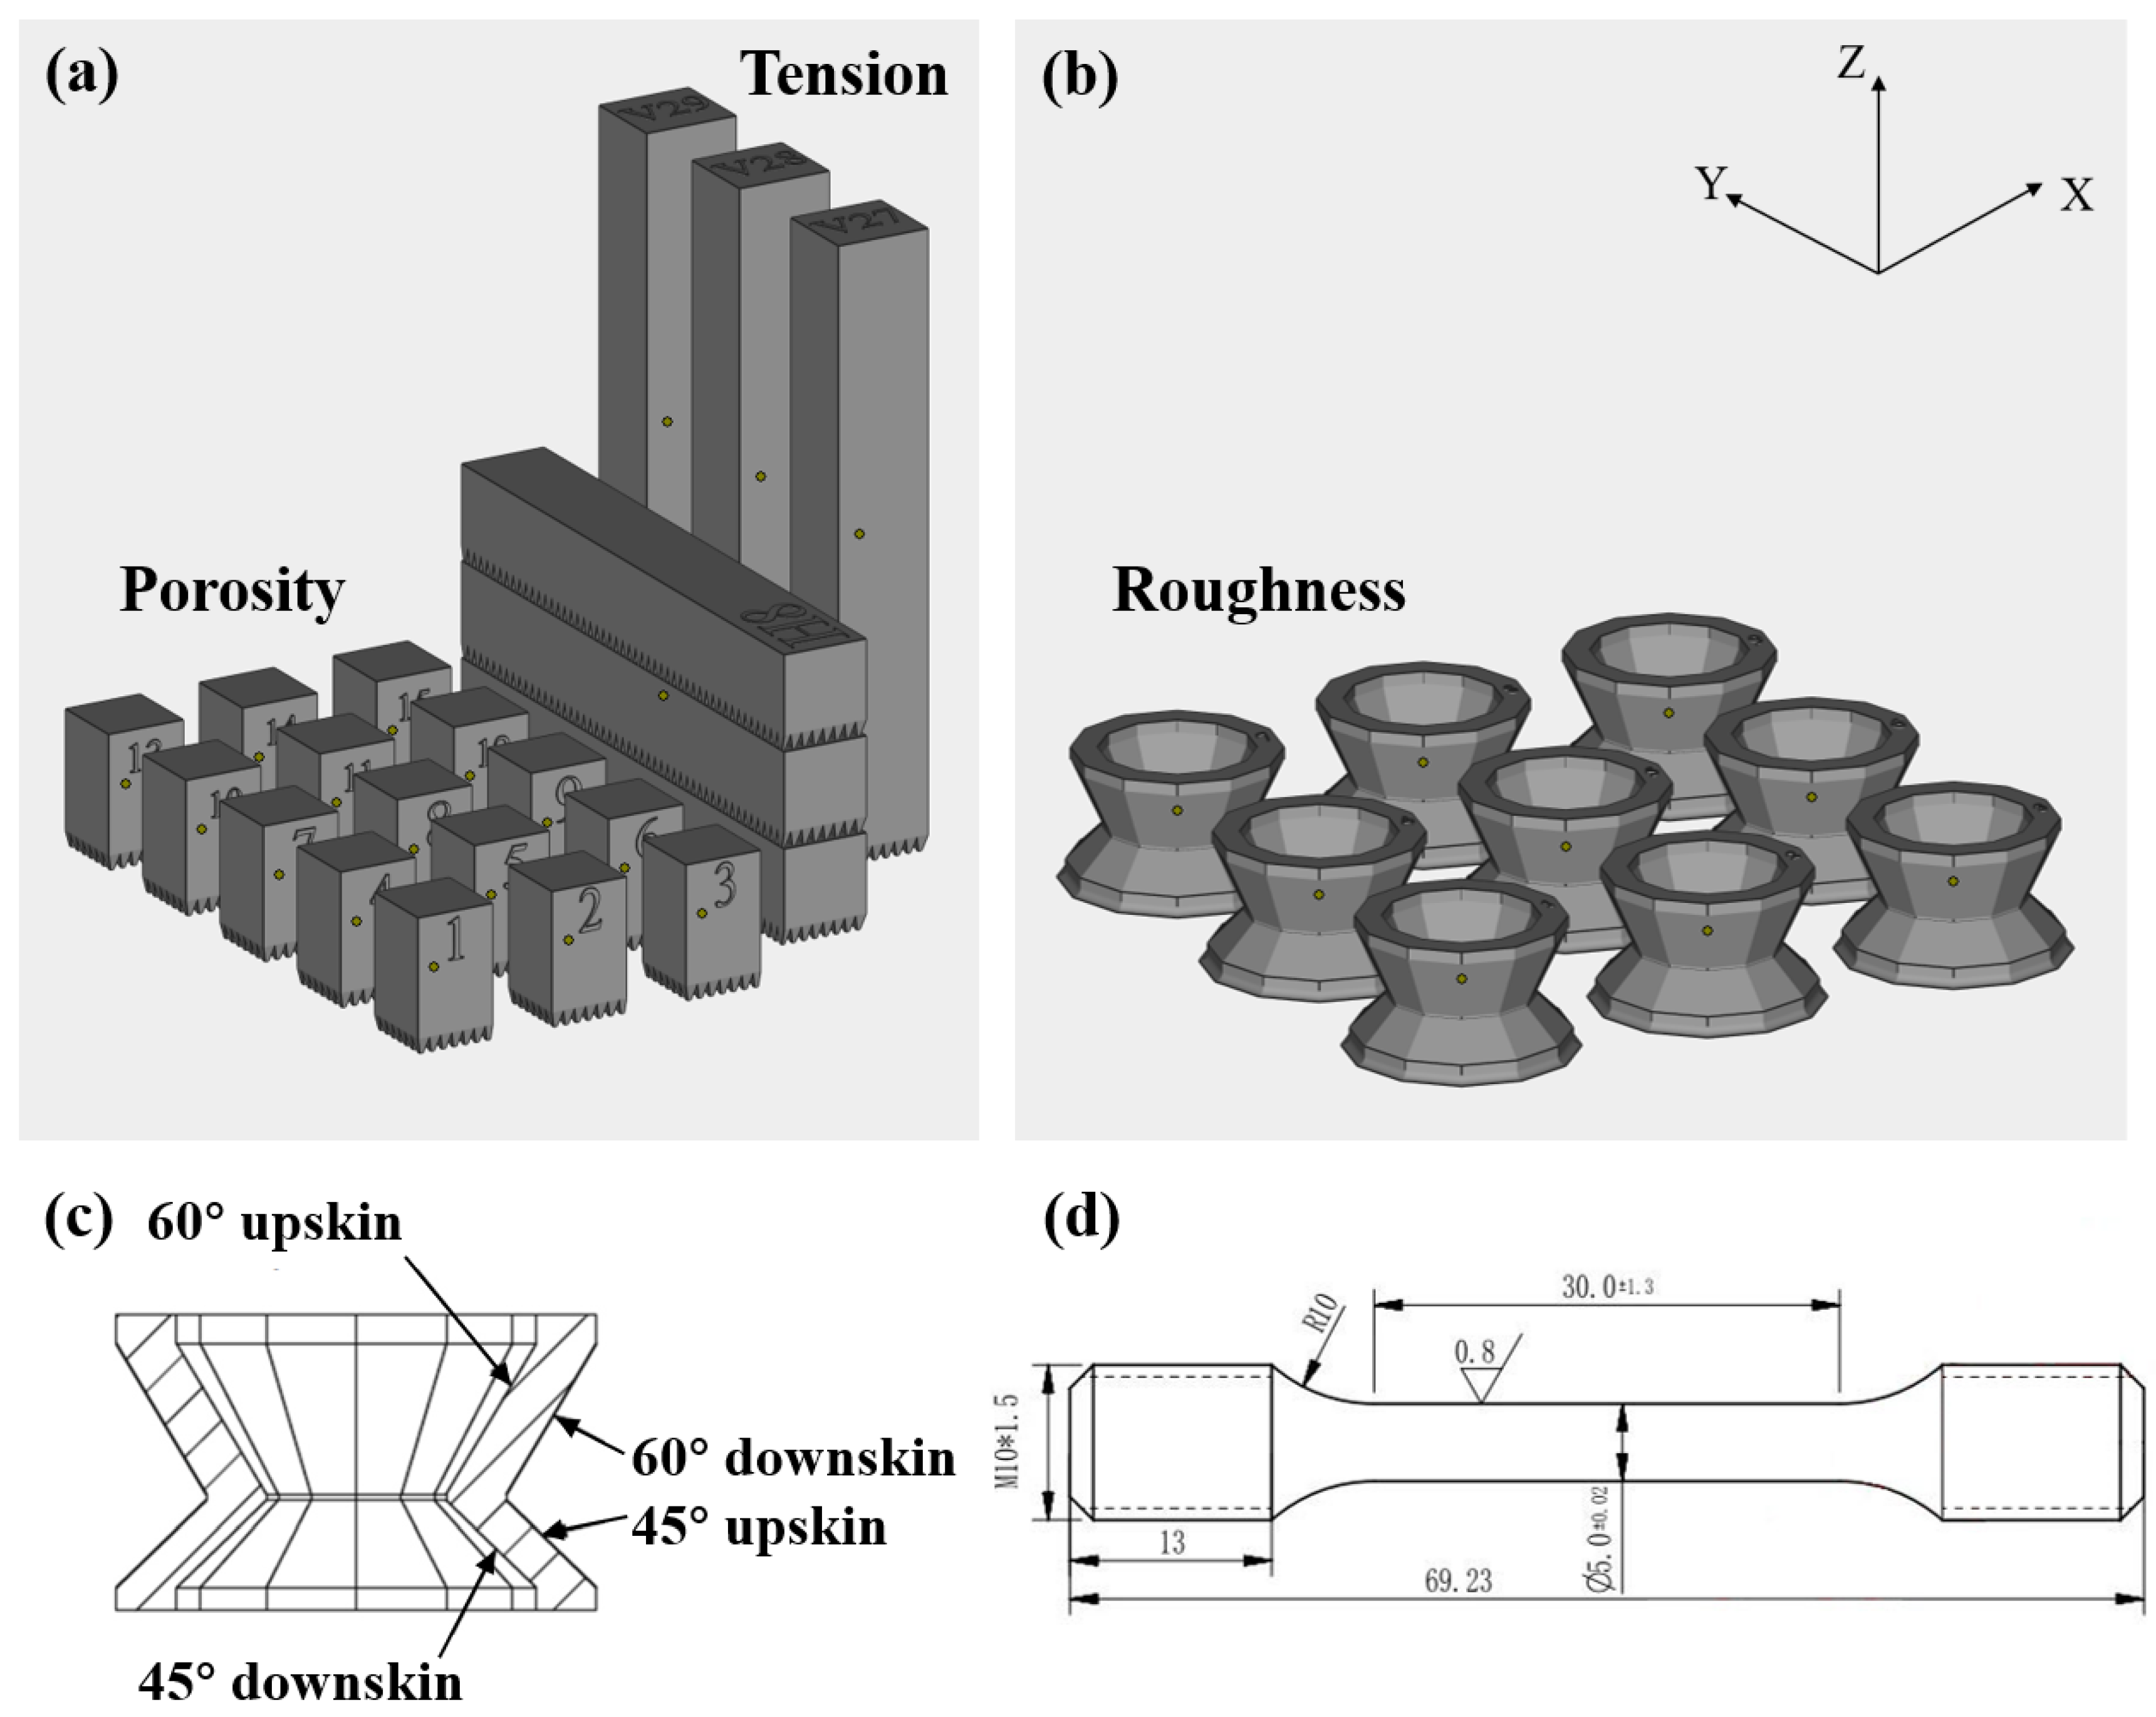
2.3. Material Characterization

The as-built and annealed Ti-6Al-4V specimens were sectioned parallel to the build direction for microstructural evaluation by electrical discharge wire-cutting. A conventional mechanical polishing method was used to grind and polish the sections along the build direction. A mixture of H2O2 solution and OPS (oxide polishing suspensions) (1:5 volume ratio) was used for the final polishing step. Optical micrographs (OM) were taken by the Axio Observer 3 Materials. The porosity of the specimens was measured by analyzing at least of five OM images using Image-J software (NIH, Bethesda, MD, USA). In accordance with quantitative stereology, the relative density of a specimen is considered to be equivalent to the percentage area of relative density in the measured section [34]. To reveal the grain morphology, the polished specimens were etched in a solution of 2 mL HF, 6 mL HNO3 and 92 mL H2O for 20 s. Microstructure analysis was performed using SEM (TESCAN S8000 GMH) in the backscattered electron (BSE) mode.
The pyramid specimens for surface roughness measurement consist of 48 individual sections. The roughness of the sample was evaluated by tactile profilometry using the DEKTAK XT 3D surface profiler (Bruker, Karlsruhe, Germany). With the test surface rotated vertical to the probe, the Ra value was acquired for a given position within an evaluation area of 2 × 2 mm2. Three repetitive measurements were performed on each test surface. The surface morphologies of the cubes and pyramid specimens were observed by using SEM.

2.4. Tensile Test

Two groups of rectangular bodies horizontal and vertical to the build direction were machined to the dimension size for the tensile test, as illustrated in Figure 2c. Tensile tests were performed on an MTS C43.504 type machine (MTS, Eden Prairie, MN, USA) with a crosshead speed of 1 mm/min. The fracture morphologies of the tensile specimens were analyzed by SEM.

3. Results and Discussion

3.1. Flowability

As can be seen from Table 3, all these four types of powders can flow freely in the Hall flowmeter, and the time to drain 50 g of powder decreases as the average powder size increases, indicating an improved flowability for the coarse powders. The superior flowability of the coarse powders compared to the fine powders is mainly due to the enhanced Van der Waals forces in the fine powders, electrostatic adsorption, and increased capillary forces on the powder surface [35]. The Hausner ratio values also show the same tendency as the data collected by the Hall flowmeter [36]. The flow properties of the four powders do not vary greatly, all falling within the range of good flowability [37].

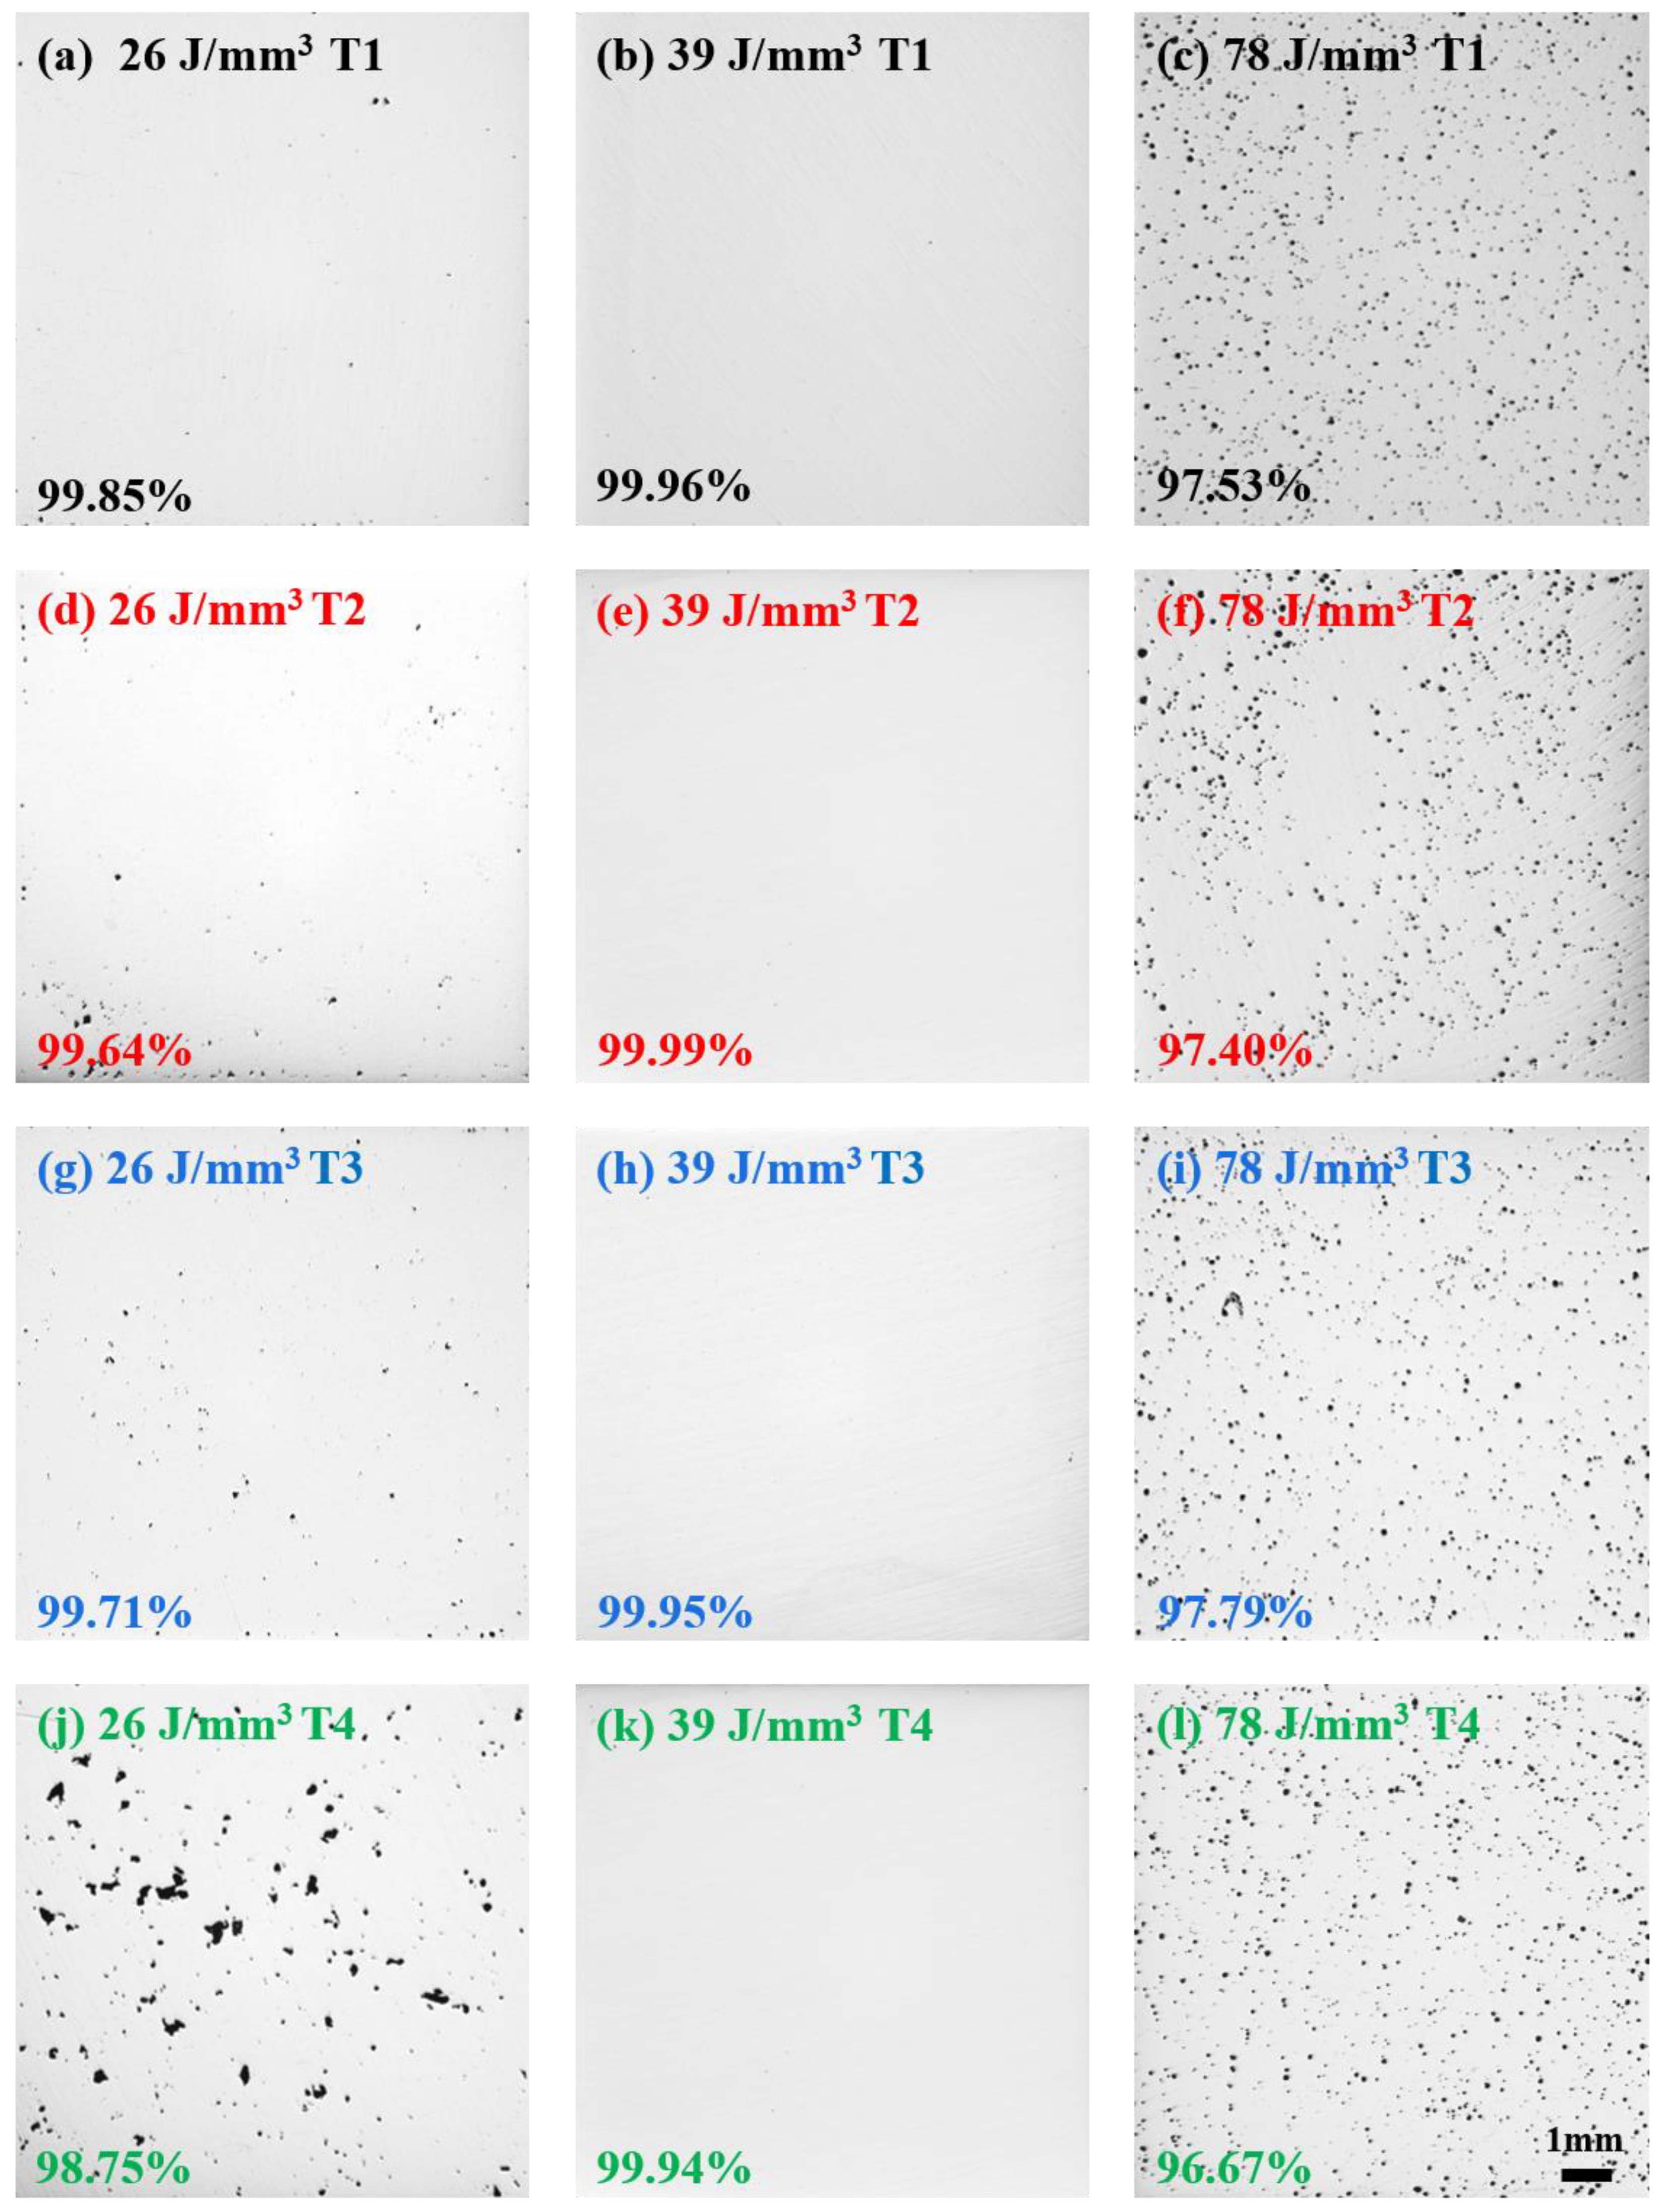
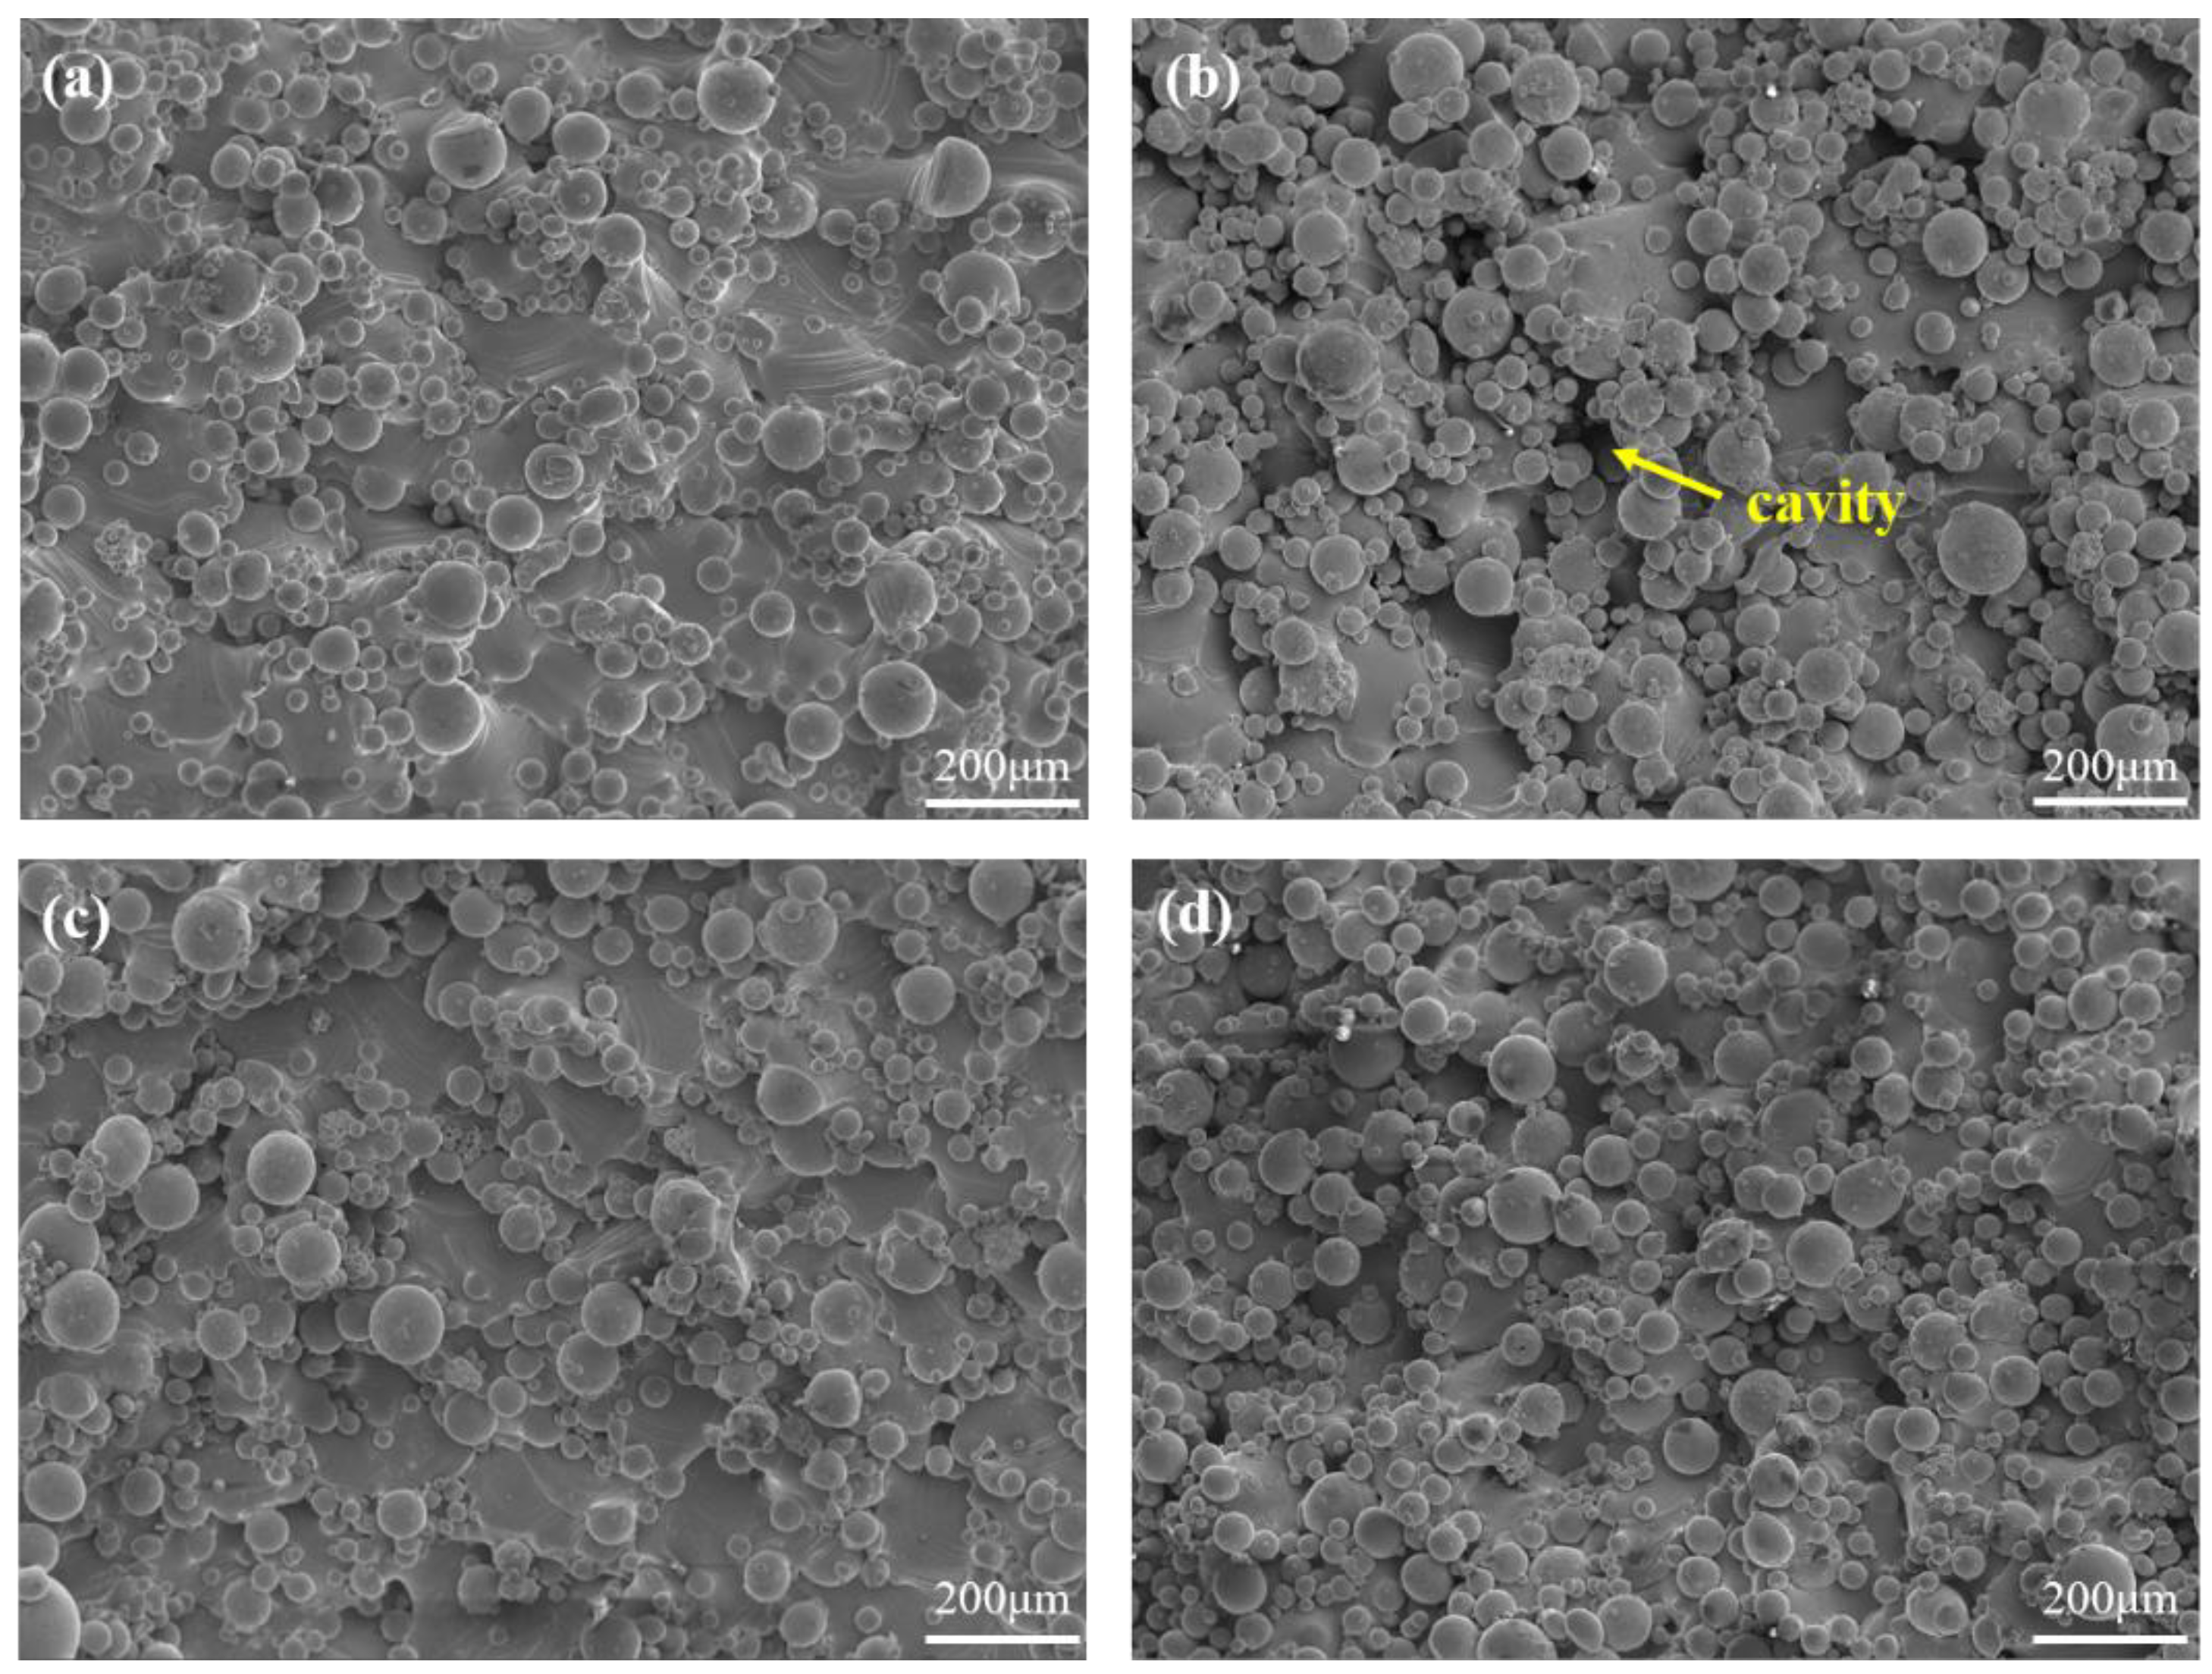
3.2. Relative Density

Figure 3 shows the relative density of the as-built specimens as a function of VED. As the VED increases from 26 to 78 J/mm3, the densities of specimens produced from the first three powders change similarly, all increasing from approximately 99.7% to near full density (>99.9%) and then decreasing to approximately 96.5% when further increasing the VED. It is interesting to note that the density variation of the T4 specimens is more sensitive to the changes in VED compared to the other three powders, especially at low VEDs and high VEDs. The results are likely due to the fact that the droplets and powder spatter caused by high energy density will also have a negative impact on the density of the sample. T4 powder has a high proportion of large particles, the spattering of these large particles may cause more obvious defects compared to small particle size powder [38]. Here, the process window is defined as the VED allowing for producing specimens with a density higher than 99.9%. The T1, T2, and T3 powders exhibit similar process windows with the VED ranging from 26 to 58 J/mm3. In comparison, the T4 powder has a narrower process window with the VED varying from 39 to 58 J/mm3. Although the use of T4 powders requires more critical processing parameters, it can be seen from Figure 3 that proper VED range allows to produce a nearly full-density product, which can meet the requirements of industrial manufacturing. Herein, the VED range for achieving full densities in this study at a layer thickness of 60 μm is significantly lower than those for the layer thicknesses of 25 μm and 30 μm in previous studies [28,29].
Figure 4 displays OM images of representative specimens produced using four different powders at different VEDs as shown in Table 1. A big difference in porosity level is observed on the specimens produced from these four powders at the same VED of 26 J/mm3. The porosity of the T4 specimen is approximately four times higher than the other three groups and there is also a significant increase in pore size. The pores are irregular, indicating a lack of fusion defect (LOF) due to the low laser energy. A main reason for this phenomenon is that the larger particles cannot be completely melted at lower VED as they required a higher input of laser energy or time for laser-material interaction [29]. At low VED, the laser is only able to vaporize surface spatters of the large particles. The recoil pressure presses the powder clusters downwards into the melt pool, causing discontinuities of laser tracks and preventing full dense solidification. Large spatters also contaminate the orbital surroundings and form large agglomerates, which contributes to more LOF defects [39]. These defects are commonly featured by their generous size and irregular shape [40]. At the VED of 39 J/mm3, fully dense samples are obtained regardless of the PSD of the powder. At a higher VED of 78 J/mm3, however, all the specimens produced from these four powders exhibit keyhole defects with comparable porosity and defect size. This defect formation is mainly due to the recoil pressure generated by laser evaporation of the metal, which is large enough to open a deep, high aspect ratio vapour depression as the VED increases [41].
The above results show that using the VED in the range of 39–58 J/mm3 is capable of producing fully dense parts for all these four powders. Based on that, it is necessary to investigate the influence of PSD on the surface roughness of the LPBF-processed parts within the process window (39–58 J/mm3).

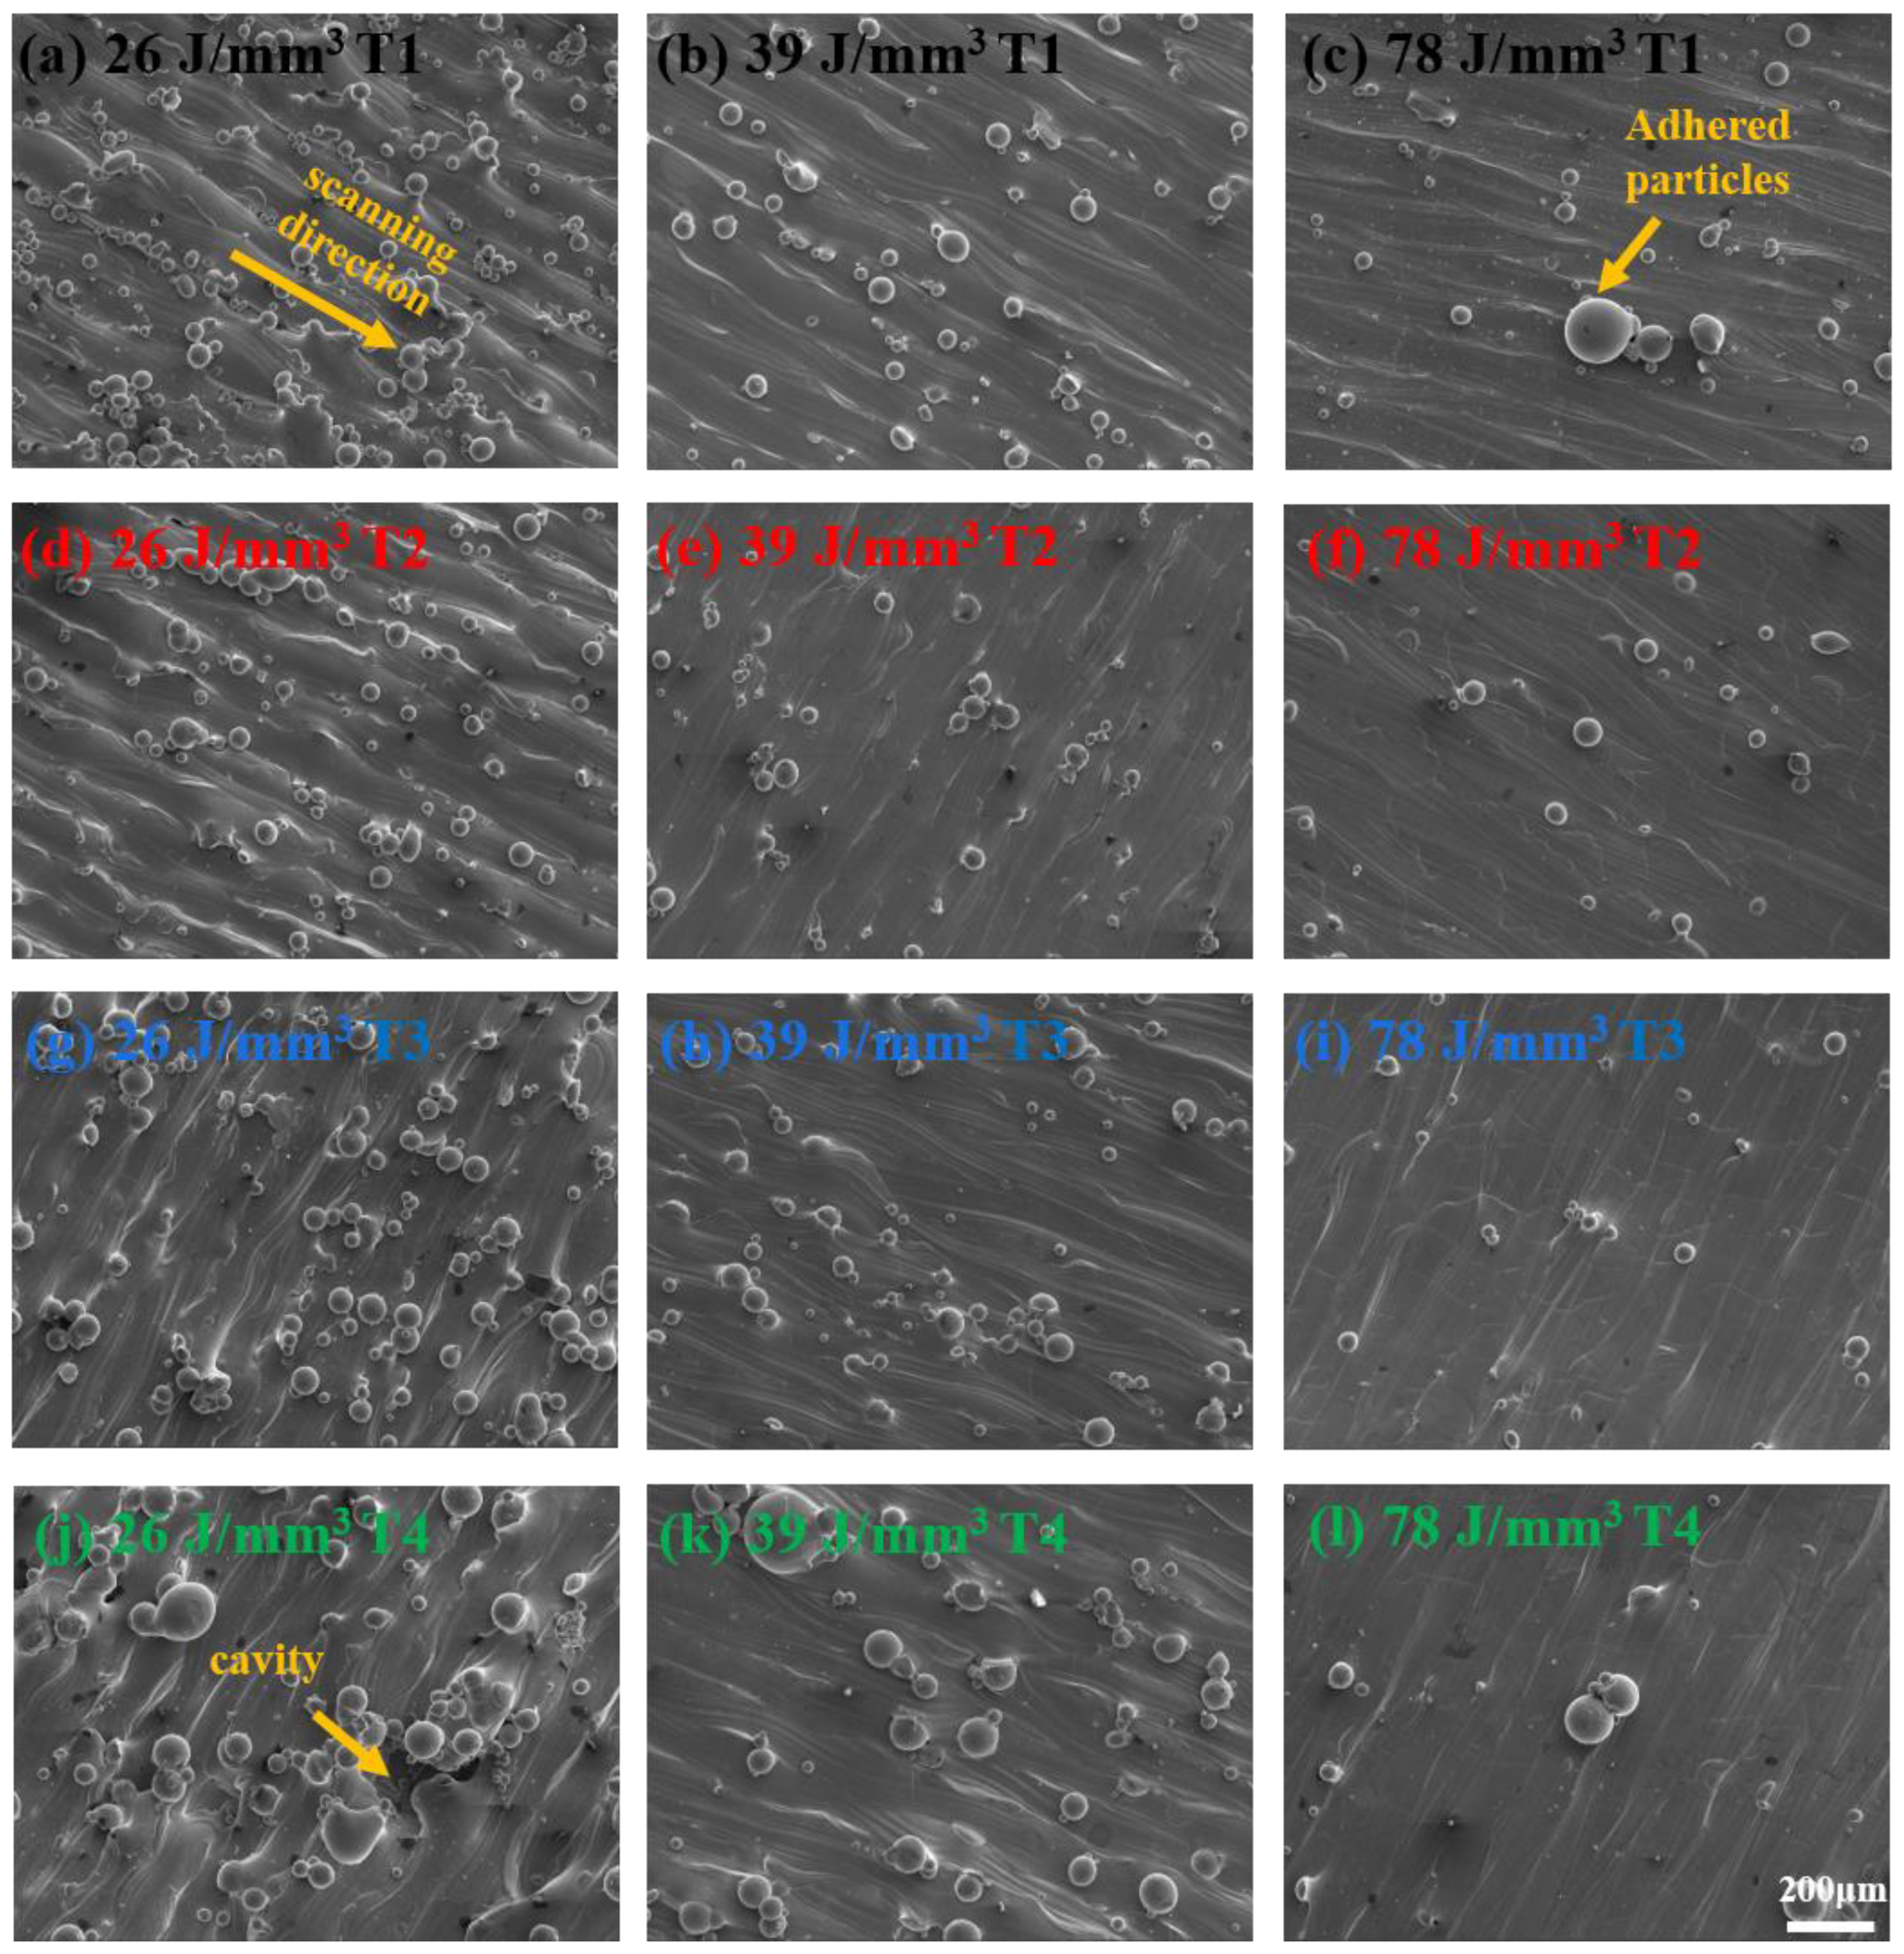
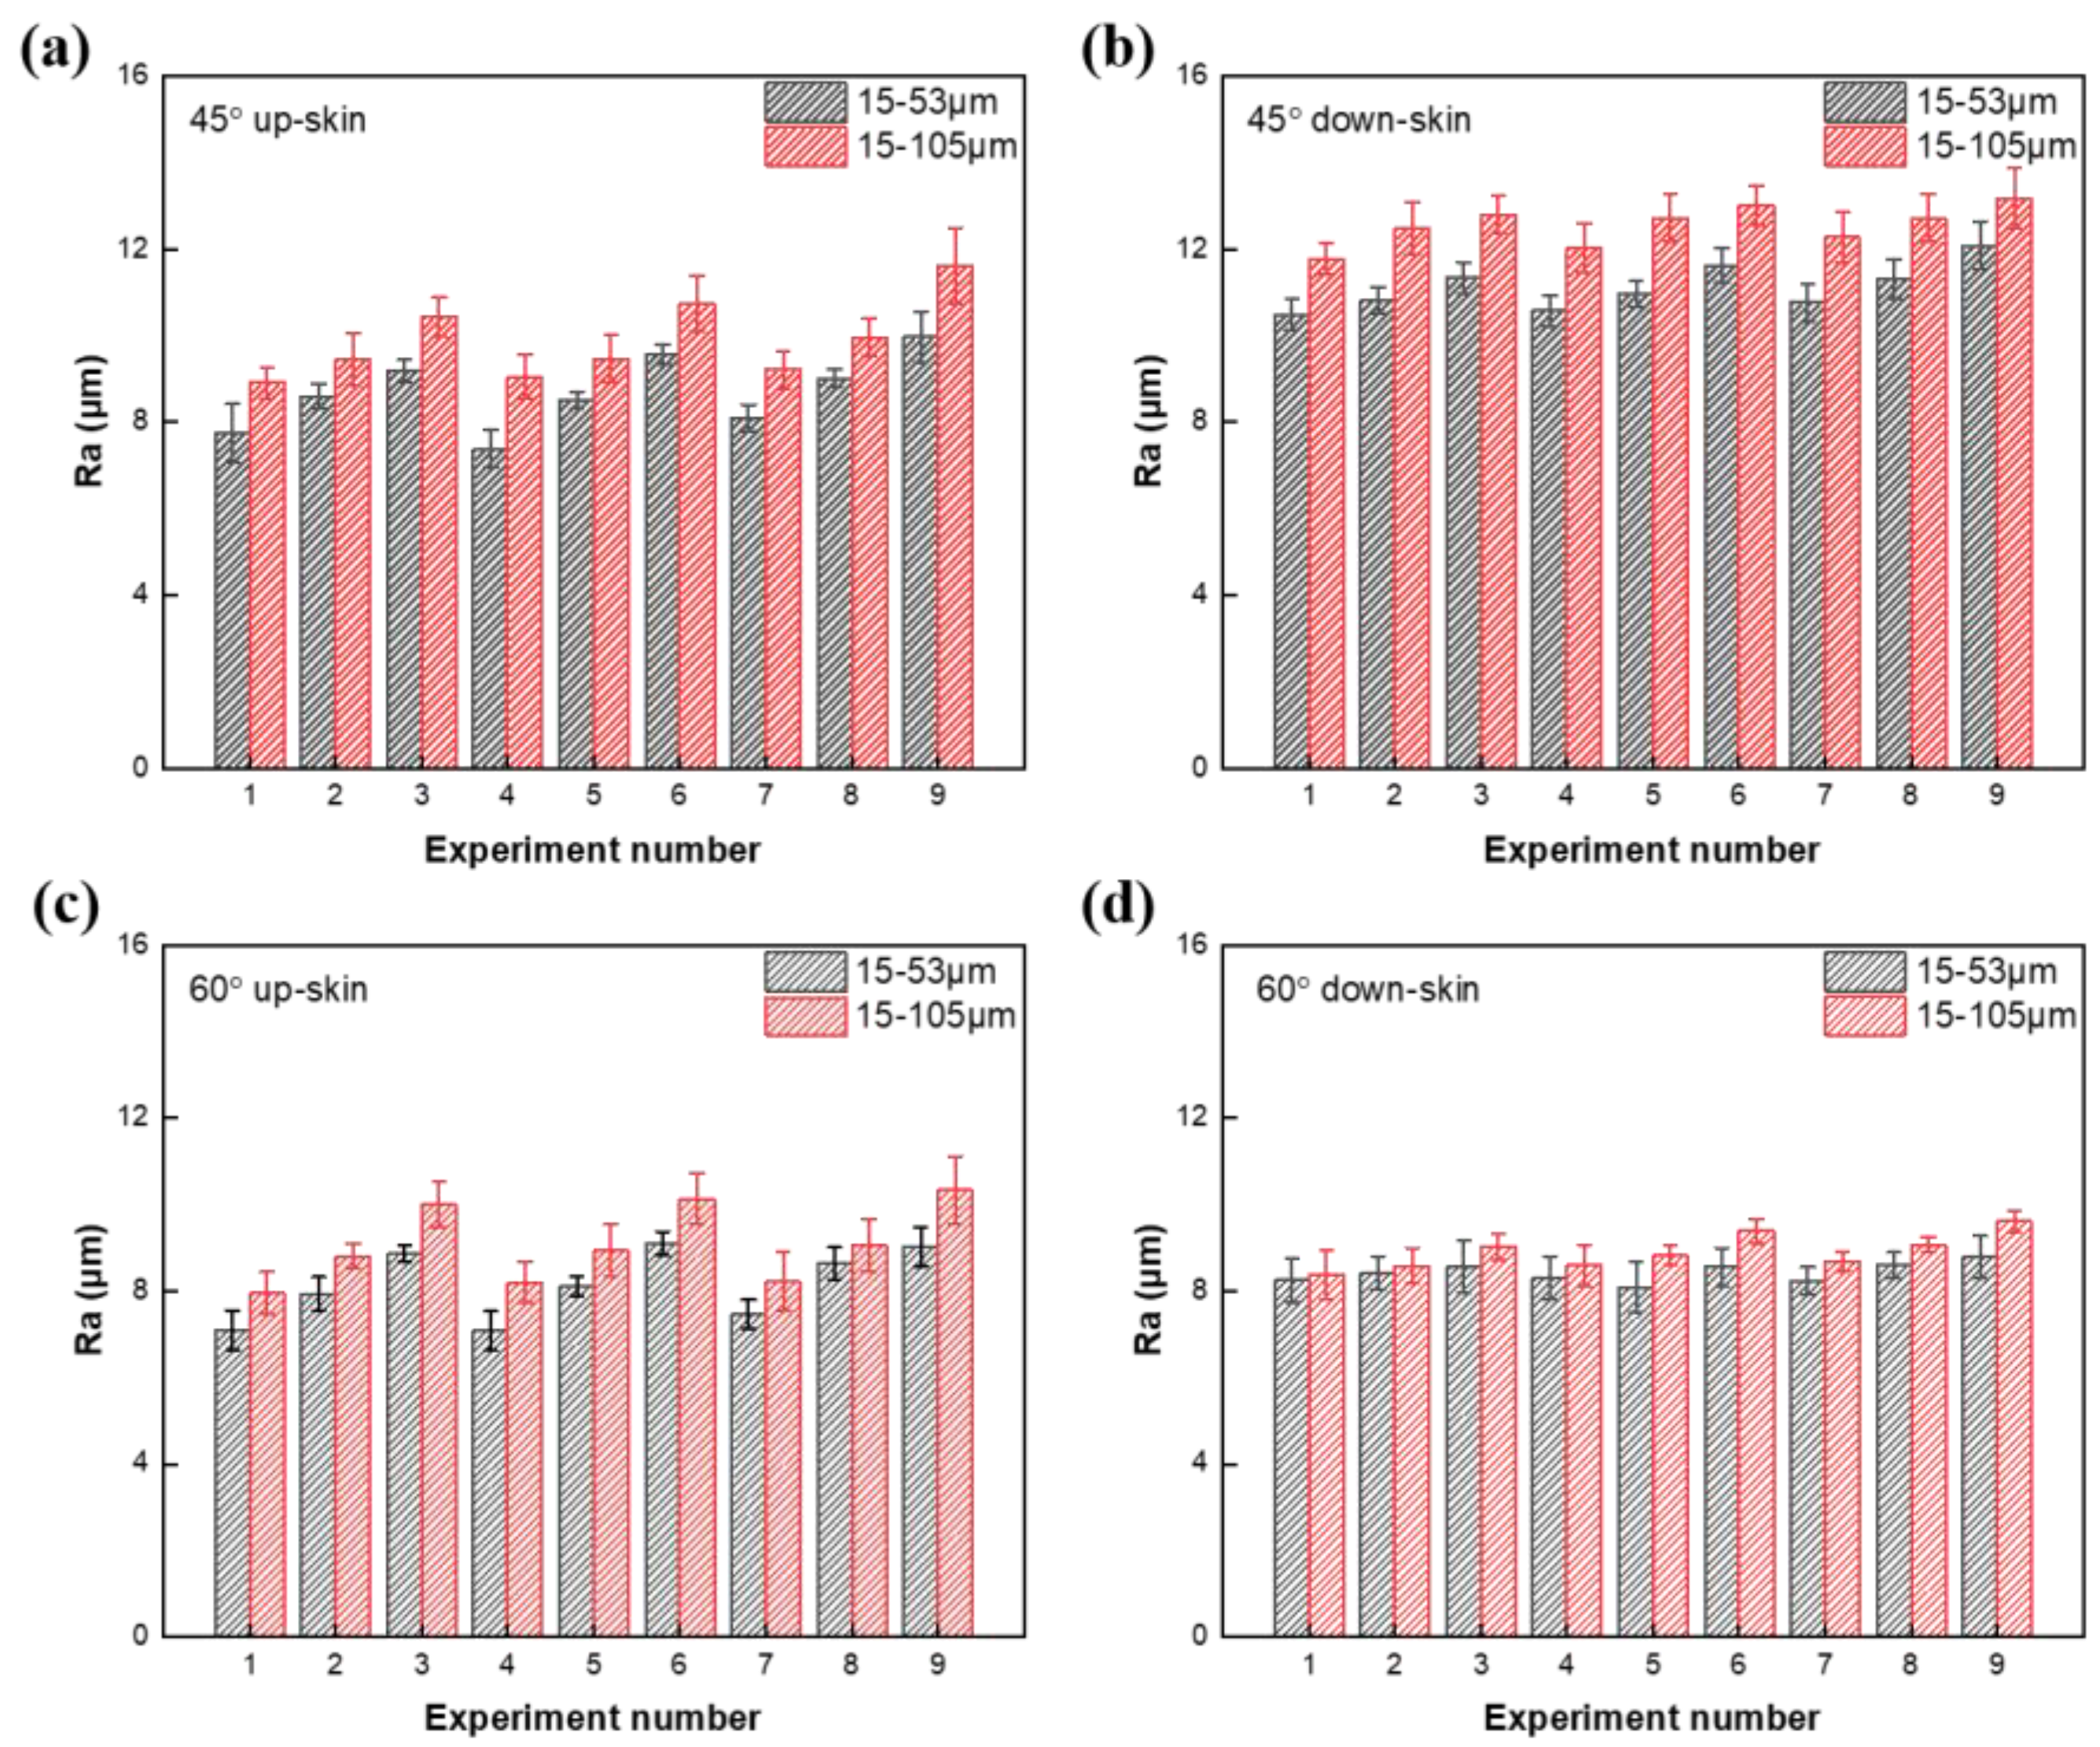
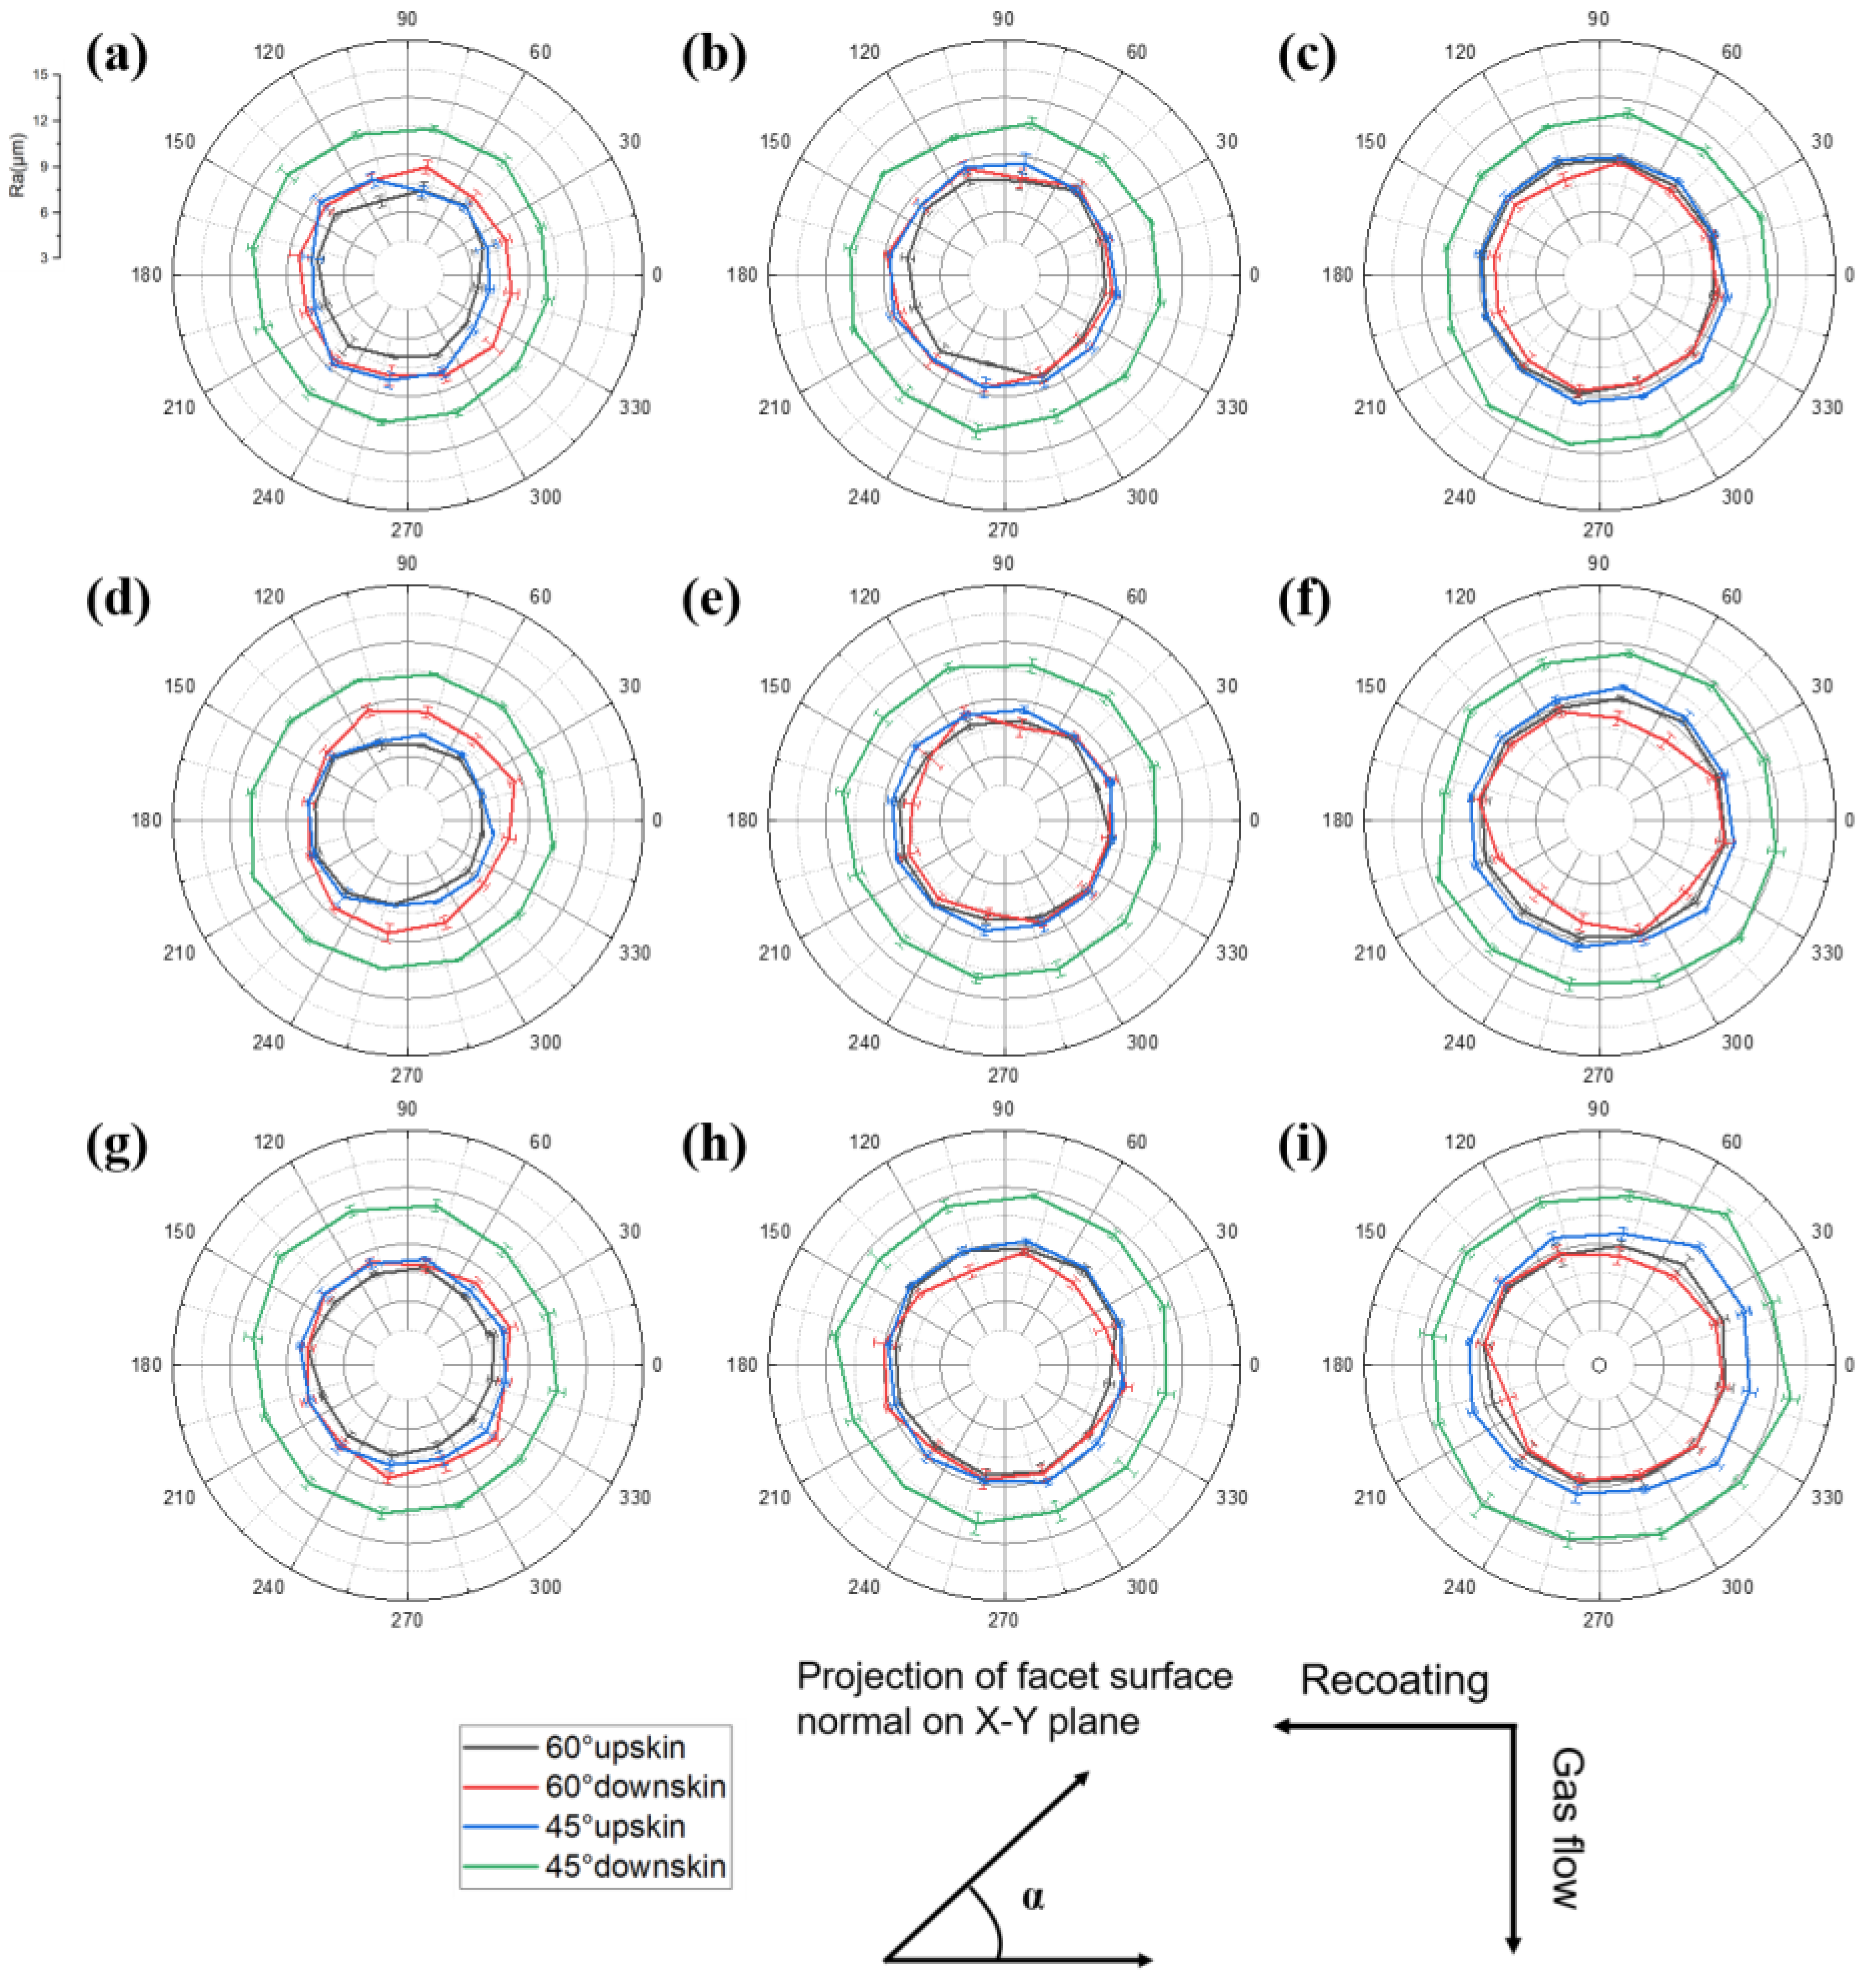
3.3. Surface Roughness

As the components are manufactured in a layer-by-layer manner in the LPBF process, the top surface of each layer serves as the substrate for the deposition of the next powder layer. The surface characteristics of the top layer, therefore, play a significant role in the powder spreading process and affect the density of recoated powder bed [19]. Figure 5 shows the top surface morphology of the cubic specimens made using different powders at different VEDs. A qualitative comparison of the surfaces shows that the top surface quality gradually deteriorates as the VED decreases. In the case of high VED (78 J/mm3), powder particles can be fully melted by the laser beam, resulting in a very smooth surface with well-welded tracks. Only a small number of adhered particles are observed between the tracks. In this case, little difference in top surface morphology can be found for the specimens using different powders. When the VED decreases to 39 J/mm3 and 26 J/mm3, the top surface becomes rugged as a large number of unmelted powder particles adhered to the surface, and the laser tracks seem to be not fully overlapped. The specimens fabricated using coarser powder (T3 and T4) exhibit poorer surface quality compared to the T1 and T2 powders as more unmelted large particles are attached to the surface. At lower energy densities, most of the larger particles are difficult to melt completely and this LOF defect accumulates layer by layer and gradually deteriorates the surface quality. As a consequence, a large number of voids are shown in Figure 5j. Faster laser scanning speeds at a fixed laser power can reduce the presence of adhering particles, but excessively high scanning speeds can lead to unstable melt pool formation and deteriorate surface finish. This is because the elongated pools formed at high scanning speeds are more susceptible to the effects of plateau-Rayleigh instability. The presence of large particles in the coarse powder also further reduces the stability of the melt pool and deteriorates the surface finish [42,43].
Figure 6 shows the Ra values measured on inclined surfaces of the pyramid specimens with different manufacturing parameters. Due to the staircase effect during LPBF [44], Ra values are generally lower for the up-skin surface compared to the down-skin surface. Furthermore, the variation of Ra values with experimental numbering is similar for different inclination angles of the up-skin and down-skin surfaces. Among these fully dense specimens, the surface roughness varies between 8 and 12 μm. That is, with the increase of VED and PSD, the increase of Ra is not obvious. Ra values measured from the individual facets of the T4 specimen are plotted in Figure 7. The distance and angle between the laser origin and the sample surface have little effect on the roughness as the Ra values do not show a dependence on the sample position. This differs somewhat from the results of Chen et al. [45]. This could be explained by the narrower forming area of the equipment used in this study and the fact that the size of the model itself was reduced by 40% compared to the reference model [45]. The reduction in overall sample size may have resulted in a reduced position dependence of Ra.
Figure 8 shows surface morphologies of the up-skin and down-skin sides of the T4 specimen at different angles using a laser of 280 W and a scan speed of 1200 mm/s. It can also be seen more clearly that the down-skin surface has more cavities and worse overall roughness compared to the up-skin surface. For the lower skin surface, the fusion zone is supported by the underlying powder bed, and local heat dissipation is significantly slower due to the limited contact between the powder particle surfaces and the insulating air gaps between the particles [46]. As a result, large melt pools are more likely to form and extend into the powder bed under the influence of gravity and capillary forces. These larger melt pools allow more semi-molten powder particles to adhere to the surface, creating a raised edge [47,48]. The results of this pyramidal specimen roughness test show that a satisfying surface quality can be achieved with a layer thickness of 60 μm. In addition, the roughness can be further improved during manufacturing by using an outline scan strategy, especially on the down-skin surface.

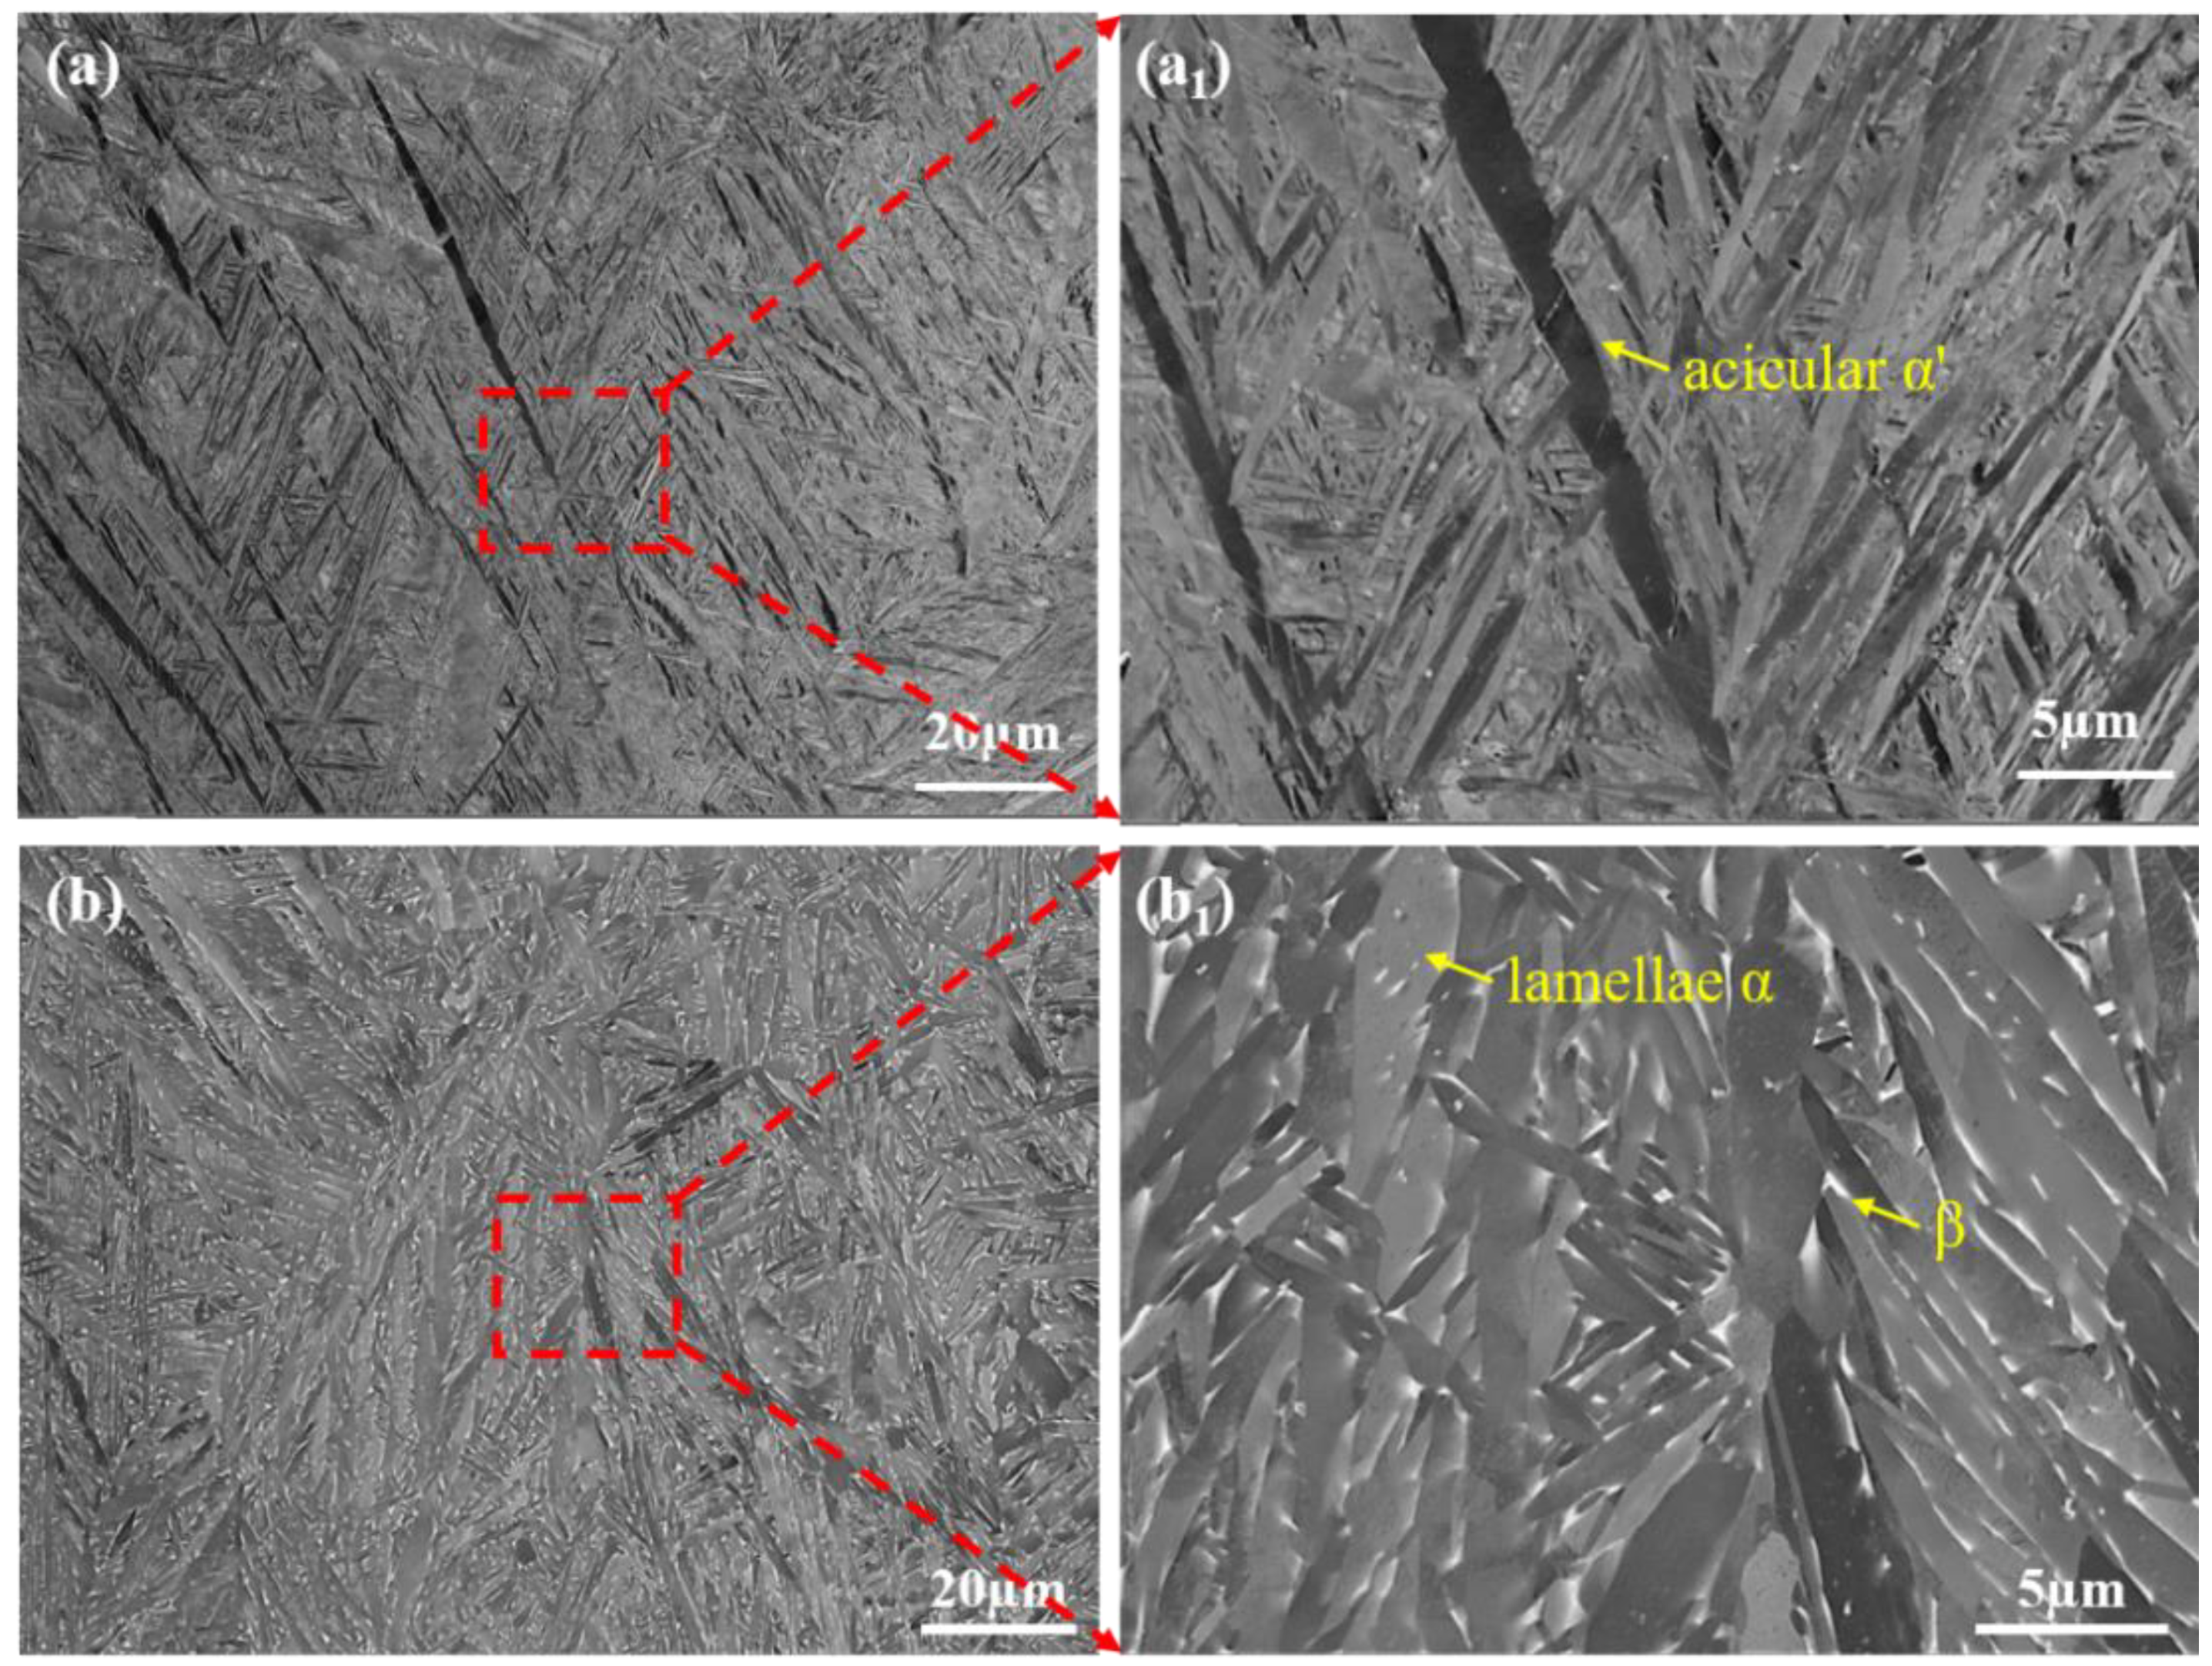
3.4. Microstructural Characterization

Figure 9a–d show the OM images of the vertical section of the specimens made from different powders. The elongated columnar grains with lengths of hundreds of micrometers are presented along the build direction. The elongated grains are prior β-phase grains due to the epitaxial growth through multiple deposited layers as a result of the large temperature gradient, as reported in the previous studies [49,50]. In addition, a large number of fine acicular martensites form within the columnar prior β grains. There is bare difference in the microstructure of the specimens fabricated from these four different powders, as the average PSD of all these four powders is less than the layer thickness, and the consistency of the powder flow made the spreading of the powders comparable. Therefore, these four powders underwent a similar remelting/solidification process and thermal history during the manufacturing process, and exhibit almost identical microstructures at the optimum parameters.
Figure 10 shows the BSE images taken from the T4 specimen in the as-built state and after annealing heat treatment. The as-built specimen is featured by the acicular α′ martensite in columnar prior β grains due to the rapid cooling in the melt pool (103~105 K/s) and high-temperature gradients (104~105 K/cm) [51,52]. Another study by Soltani-Tehrani et al. [17] also demonstrated that the differences in phase composition and microstructure between specimens of different PSDs were minimal. The presence of a non-equilibrium structure in the as-built state can be modified via annealing treatment. As shown in Figure 10b, the morphology and structure of the α’ phase change from the original acicular shape to lamellas and a portion of α phase has transformed into β phase after two-hour annealing treatment at 800 °C. Hence, the β-phase content and martensitic lath width of the annealed specimens showed a significant increase, as depicted in Figure 10b.

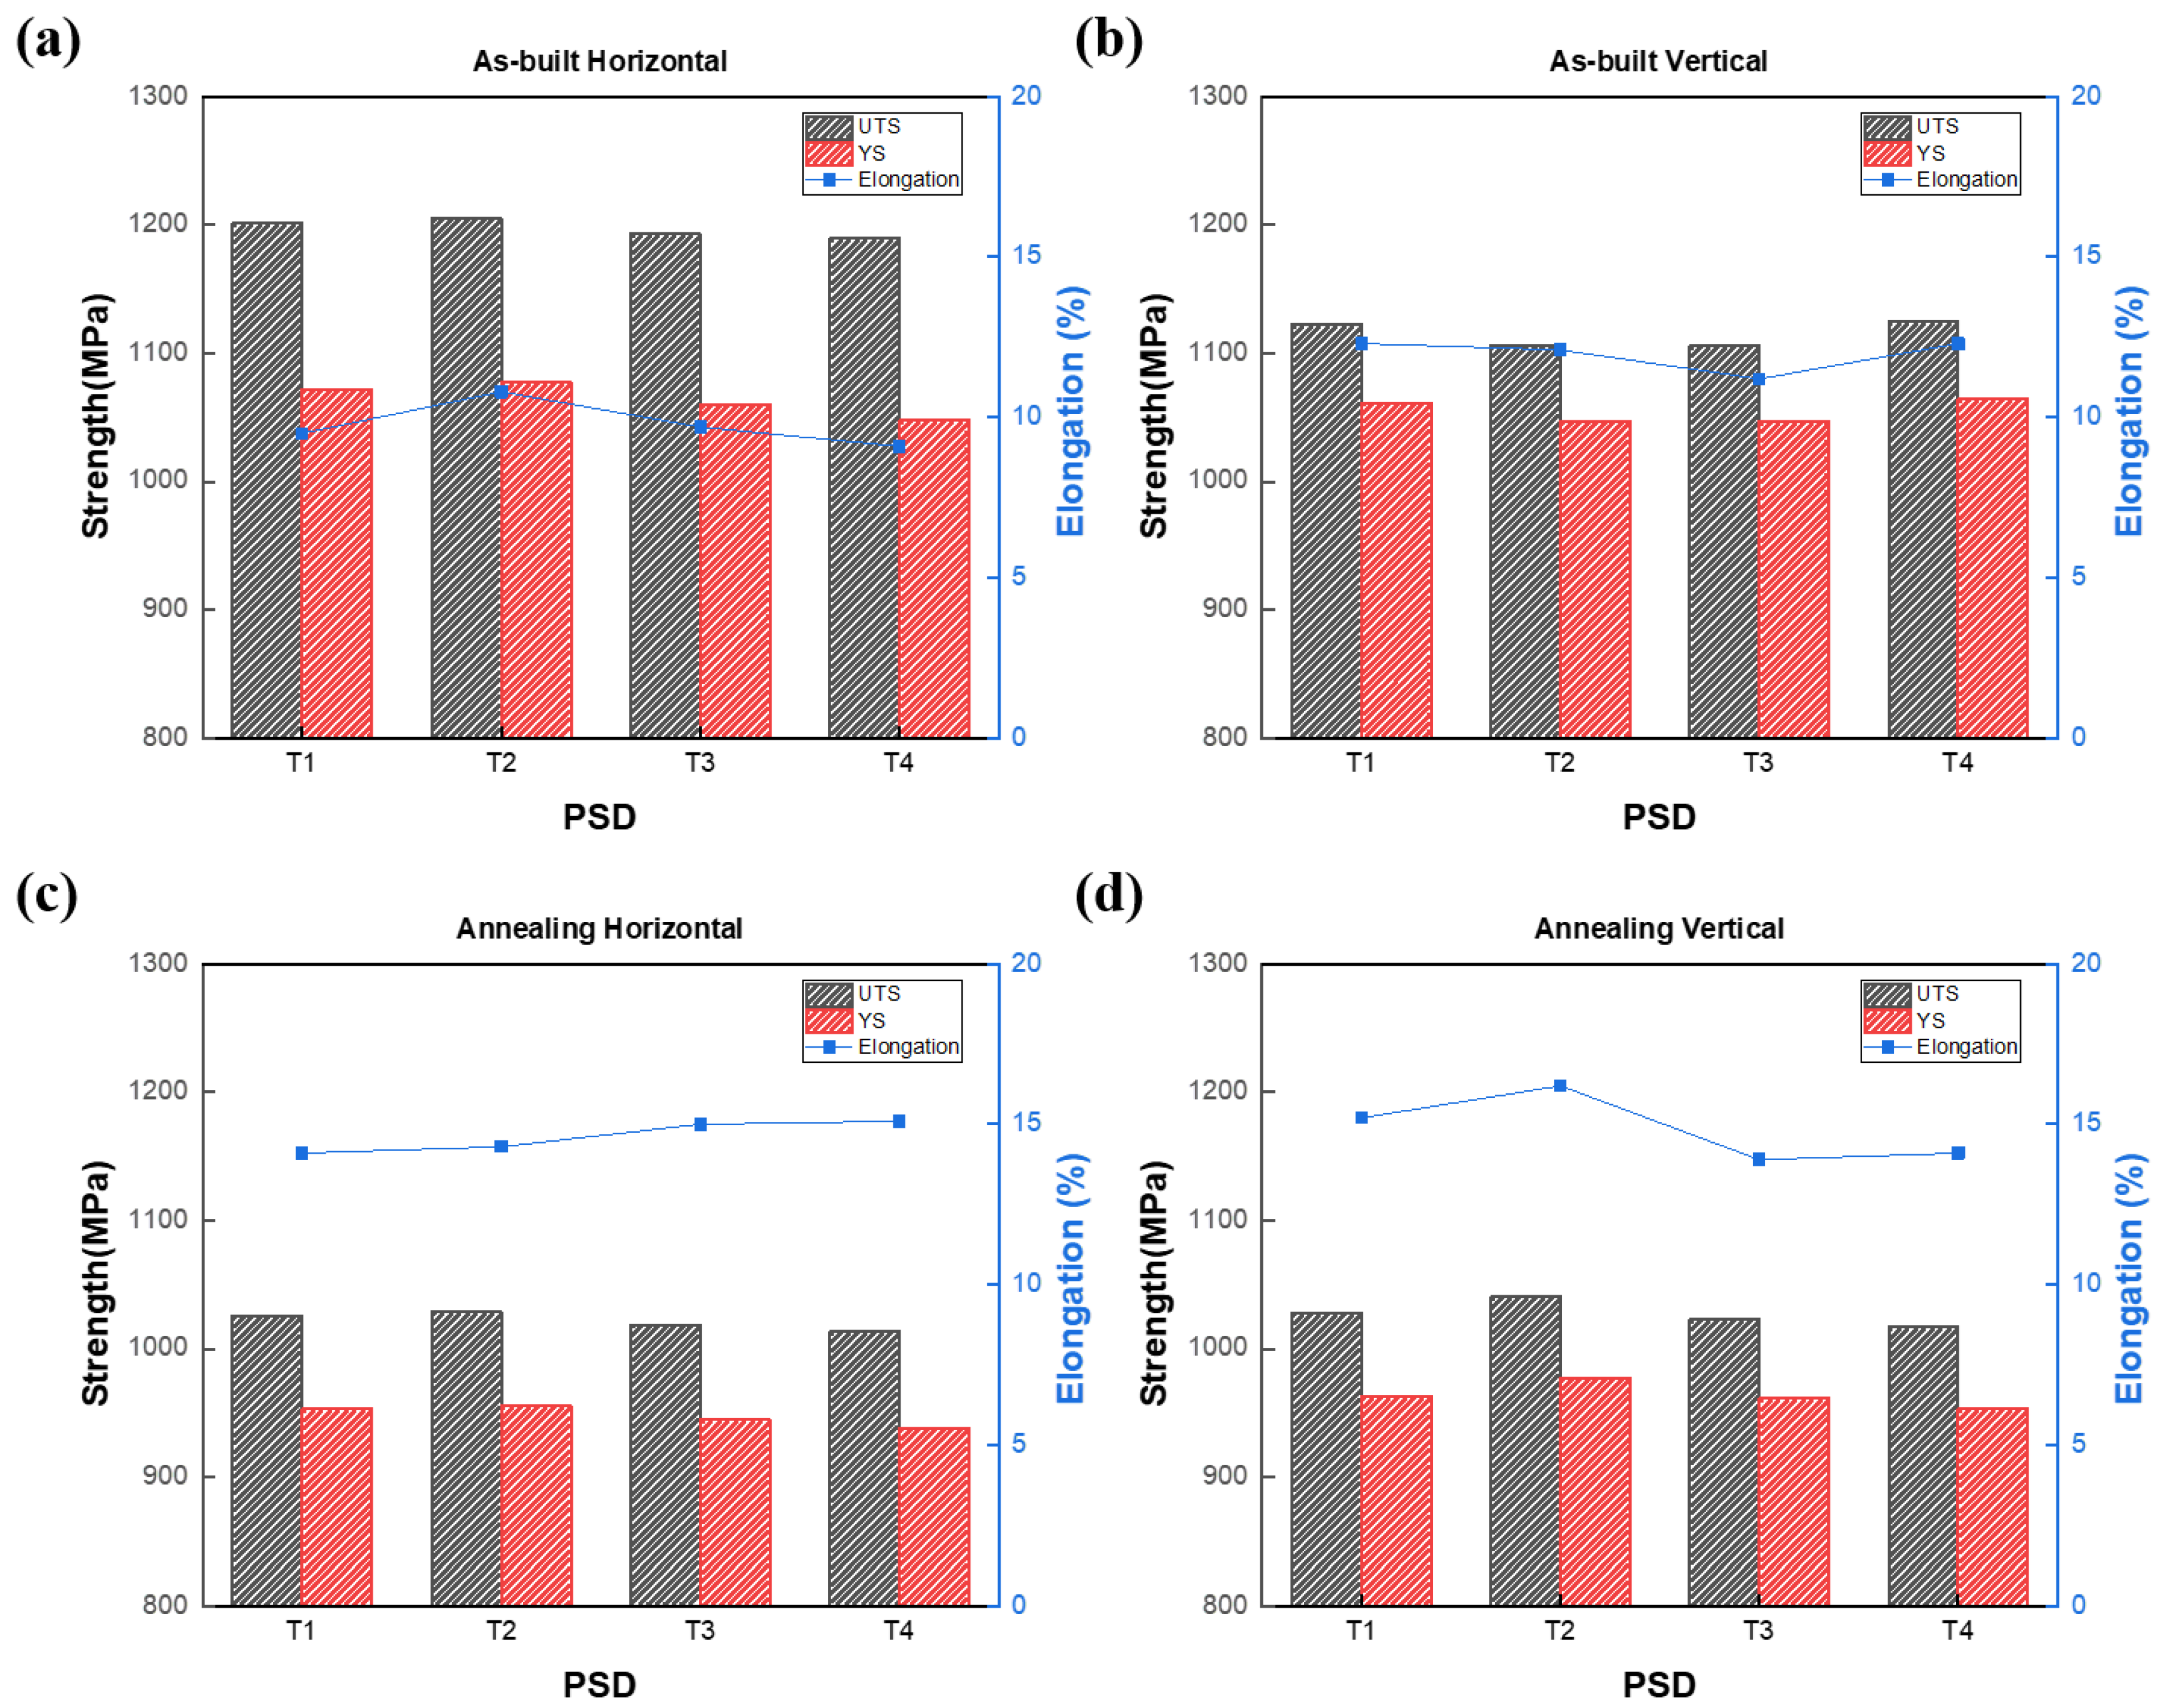
3.5. Mechanical Properties

The tensile properties of the as-built and annealed Ti-6Al-4V specimens fabricated using different powders are shown in Figure 11 and the YS, UTS and fracture elongation values are presented in Table 4. It should be noted that the tensile test specimens were machined to exclude the influence of surface roughness on the tensile properties, therefore only the effect of microstructure was considered. The tensile properties of these four types of specimens show almost the same performance in both the as-built and annealed states. This is mainly due to the virtually identical microstructure they share. The as-built specimens exhibit considerable anisotropy in tensile property between the horizontal and vertical directions. The average YS and UTS are 1200 MPa and 1064 MPa along the horizontal direction, which are approximately 30 MPa and 100 MPa higher than their vertical counterparts, respectively. Conversely, the fracture elongation of the horizontal specimens is 18% lower than that of the vertical specimens. This anisotropy in tensile properties is improved by annealing treatment at 800 °C for 2h. After annealing treatment, the YS and UTS decrease from 1197 MPa and 1064 MPa to 1022 MPa and 948 MPa in the horizontal direction and decline from 1115 MPa and 1055 MPa to 1027 MPa and 964 MPa in the vertical direction, while the fracture elongation increased from 9.8% to 14.6% in the horizontal direction and from 12.0 to 14.9% in the vertical direction.
The anisotropy in tensile property could originate from the microstructure anisotropy (columnar prior-β grains along the as-built direction) and the difference in residual stress and texture. Firstly, influenced by the temperature gradient, the β-columnar crystals grow oriented in the building direction during LPBF. When the specimen is tensioned in the X–Y direction, the force direction of the specimen is almost perpendicular to the direction of the prior β-columnar grain boundaries. This makes it easier for dislocations to accumulate at the grain boundaries under stress conditions in the specimen, greatly hindering dislocation slip and thus achieving a higher tensile strength [53]. Secondly, residual stresses are also an influential factor in the anisotropy of the tensile strength. Provided that the effect of phase transformation on residual stresses is excluded, the fact that each deposited layer introduces a certain number of residual stresses makes the level of residual stresses and the potential susceptibility to cracking increase the higher the number of layers of prepared specimens [54]. The result is that the vertical specimens show a worse tensile strength relative to the horizontal specimens. Thirdly, the texture may affect the activation of the slip system by altering the Schmid factor (SF), leading to variations between the tensile strengths of specimens in different orientations [55]. Ren et al. [56] experimental results show that the percentage of ΣSF (0.4 to 0.5) is higher in vertical specimens than in horizontal specimens, which also matches the lower yield strength. On the other hand, the anisotropy of specimen plasticity is mainly caused by impurity elements and defects that often accumulate at grain boundaries, which makes horizontal specimen plastic deformation more resistant [49].
The two-hour annealing treatment at 800 °C is accompanied by the weakening and reduction of grain boundaries and the gradual melting of columnar crystals. The gradual homogenization of the specimens after annealing weakens the effect of microstructure and texture on the anisotropy of the specimen in terms of tensile strength and elongation. At the same time, the residual stresses in the specimens are released after the heat treatment, which further reduces the anisotropy of the tensile strength.
The fracture characteristics of the horizontal specimen shown in Figure 12a indicate that the edges of the fracture are dominated by ductile fracture, while in the middle of the fracture there are a large number of cleavage steps, which are dominated by brittle fracture. The fracture form is along the crystal fracture with low plasticity. In contrast, the central part of the fracture of the vertical specimen shown in Figure 12c consists of an equiaxed toughness nest and a destructive step, which is consistent with the characteristics of the so-called quasi-destructive fracture mode in a similar report [57]. Due to the preferential nucleation of the crack at the prior β grain boundary and the large amount of plastic flow during crack extension, the dimples are elongated in the tensile direction [58]. As a consequence of this, vertical specimens built parallel to the prior β grain boundary tend to generate more dimples fracture features during crack extension. After the annealing heat treatment, the prior β grain boundaries are gradually reduced, and the microstructure of the specimens is more homogeneous than in the as-built state. Therefore, the anisotropy of the mechanical properties of the specimens gradually decreases and they all show a large number of dimples at the fracture.

4. Conclusions

In this study, the main purpose of this study is to explore the application possibility of wider PSD powder under higher layer thickness. The effect of PSD on the print quality and mechanical properties of LPBF Ti-6Al-4V with a layer thickness of 60 μm was investigated by evaluating the porosity, surface roughness, microstructure, and mechanical properties of the specimens. The following conclusions can be drawn from this study:
(1)
The process window (VED range) that allows for the successful fabrication of fully dense parts using the coarse powders (T4 powder: 15–105 μm) is relatively narrower compared to the other three powders due to the higher laser energy required for completely melting the large particles. Nevertheless, a high density of over 99.9% was still achieved in the VED range of 39–58 J/mm3 at the layer thickness of 60 μm. This suggests that coarser powders can still be used for fabricating dense specimens when the parameters are properly regulated.
(2)
Among these fully dense specimens, the surface roughness varies slightly with the variation of VED and PSD. In the case of proper parameter selection, specimens made of coarse powder can still achieve a low surface roughness, which is comparable to the case at layer thickness of 30 μm. The down-skin surface and the lesser formation angle decrease the forming quality due to the step effect.
(3)
The fully dense specimens fabricated using four different powders demonstrated comparable tensile properties. The anisotropy in tensile properties of the as-built Ti-6Al-4V can be fully improved by annealing treatment at 800 °C for 2 h. The tensile properties, with UTS > 1000 MPa, YS > 900 MPa, and elongation > 10% in the annealed state, meet the application criteria for industrial production.

Author Contributions

Methodology, X.C. and X.J.; Writing—original draft, M.X.; Writing—review & editing, Q.C.; Supervision, X.X.; Funding acquisition, G.F. All authors have read and agreed to the published version of the manuscript.

Funding

This research was funded by Ministry of Science and Technology of China (2022YFB3707105), National Science Foundation of China (52204390), and Priority Academic Program Development of Jiangsu Higher Education Institutions (PAPD).

Data Availability Statement

Data are only available on request due to private restrictions.

Acknowledgments

The authors would like to thank the financial support from the Ministry of Science and Technology of China (2022YFB3707105), the National Science Foundation of China (No. 52204390) and Priority Academic Program Development of Jiangsu Higher Education Institutions (PAPD).

Conflicts of Interest

The authors declare no conflict of interest.

References

  1. Zhang, J.; Song, B.; Wei, Q.; Bourell, D.; Shi, Y. A review of selective laser melting of aluminum alloys: Processing, microstructure, property and developing trends. J. Mater. Sci. Technol. 2018, 35, 270–284. [Google Scholar] [CrossRef]
  2. Liu, X.; Hu, R.; Zou, H.; Yang, C.; Luo, X.; Bai, J.; Ma, R. Investigation of cracking mechanism and yield strength associated with scanning strategy for an additively manufactured nickel-based superalloy. J. Alloys Compd. 2023, 938, 168532. [Google Scholar] [CrossRef]
  3. DebRoy, T.; Wei, H.L.; Zuback, J.S.; Mukherjee, T.; Elmer, J.W.; Milewski, J.O.; Beese, A.M.; Wilson-Heid, A.; De, A.; Zhang, W. Additive manufacturing of metallic components—Process, structure and properties. Prog. Mater. Sci. 2018, 92, 112–224. [Google Scholar] [CrossRef]
  4. Khairallah, S.A.; Anderson, A.T.; Rubenchik, A.; King, W.E. Laser powder-bed fusion additive manufacturing: Physics of complex melt flow and formation mechanisms of pores, spatter, and denudation zones. Acta Mater. 2016, 108, 36–45. [Google Scholar] [CrossRef] [Green Version]
  5. Mower, T.M.; Long, M.J. Mechanical behavior of additive manufactured, powder-bed laser-fused materials. Mater. Sci. Eng. A 2016, 651, 198–213. [Google Scholar] [CrossRef]
  6. Liu, S.; Shin, Y.C. Additive manufacturing of Ti6Al4V alloy: A review. Mater. Des. 2018, 164, 107552. [Google Scholar] [CrossRef]
  7. Shipley, H.; McDonnell, D.; Culleton, M.; Coull, R.; Lupoi, R.; O’Donnell, G.; Trimble, D. Optimisation of process parameters to address fundamental challenges during selective laser melting of Ti-6Al-4V: A review. Int. J. Mach. Tools Manuf. 2018, 128, 1–20. [Google Scholar] [CrossRef]
  8. Tan, C.; Weng, F.; Sui, S.; Chew, Y.; Bi, G. Progress and perspectives in laser additive manufacturing of key aeroengine materials. Int. J. Mach. Tools Manuf. 2021, 170, 103804. [Google Scholar] [CrossRef]
  9. Rovetta, R.; Ginestra, P.; Ferraro, R.M.; Zohar-Hauber, K.; Giliani, S.; Ceretti, E. Building Orientation and Post Processing of Ti6Al4V Produced by Laser Powder Bed Fusion Process. J. Manuf. Mater. Process. 2023, 7, 43. [Google Scholar] [CrossRef]
  10. Strondl, A.; Lyckfeldt, O.; Brodin, H.; Ackelid, U. Characterization and Control of Powder Properties for Additive Manufacturing. JOM 2015, 67, 549–554. [Google Scholar] [CrossRef]
  11. Ali, U.; Mahmoodkhani, Y.; Shahabad, S.I.; Esmaeilizadeh, R.; Liravi, F.; Sheydaeian, E.; Huang, K.Y.; Marzbanrad, E.; Vlasea, M.; Toyserkani, E. On the measurement of relative powder-bed compaction density in powder-bed additive manufacturing processes. Mater. Des. 2018, 155, 495–501. [Google Scholar] [CrossRef]
  12. He, Y.; Hassanpour, A.; Bayly, A.E. Combined effect of particle size and surface cohesiveness on powder spreadability for additive manufacturing. Powder Technol. 2021, 392, 191–203. [Google Scholar] [CrossRef]
  13. Spierings, A.B.; Levy, G. Comparison of Density of Stainless Steel 316L Parts Produced with Selective Laser Melting Using Different Powder Grades. Solid Free Fabr. Proc. 2009, 342–353. Available online: https://www.icvr.ethz.ch/ConfiguratorJM/publications/Comparison_129067143709656/Spierings__2009____Comparison_of_density_of_316L_parts_produced_with_SLM_using_different_powder_grades.pdf (accessed on 12 February 2023).
  14. Tan, J.H.; Wong, W.L.E.; Dalgarno, K.W. An overview of powder granulometry on feedstock and part performance in the selective laser melting process. Addit. Manuf. 2017, 18, 228–255. [Google Scholar] [CrossRef] [Green Version]
  15. Olakanmi, E. Selective laser sintering/melting (SLS/SLM) of pure Al, Al–Mg, and Al–Si powders: Effect of processing conditions and powder properties. J. Mater. Process. Technol. 2013, 213, 1387–1405. [Google Scholar] [CrossRef]
  16. Yánez, A.; Fiorucci, M.P.; Martel, O.; Cuadrado, A. The Influence of Dimensions and Powder Recycling on the Roughness and Mechanical Properties of Ti-6Al-4V Parts Fabricated by Laser Powder Bed Fusion. Materials 2022, 15, 5787. [Google Scholar] [CrossRef] [PubMed]
  17. Soltani-Tehrani, A.; Habibnejad-Korayem, M.; Shao, S.; Haghshenas, M.; Shamsaei, N. Ti-6Al-4V powder characteristics in laser powder bed fusion: The effect on tensile and fatigue behavior. Addit. Manuf. 2022, 51, 102584. [Google Scholar] [CrossRef]
  18. Riener, K.; Albrecht, N.; Ziegelmeier, S.; Ramakrishnan, R.; Haferkamp, L.; Spierings, A.B.; Leichtfried, G.J. Influence of particle size distribution and morphology on the properties of the powder feedstock as well as of AlSi10Mg parts produced by laser powder bed fusion (LPBF). Addit. Manuf. 2020, 34, 101286. [Google Scholar] [CrossRef]
  19. Balbaa, M.; Ghasemi, A.; Fereiduni, E.; Elbestawi, M.; Jadhav, S.; Kruth, J.-P. Role of powder particle size on laser powder bed fusion processability of AlSi10mg alloy. Addit. Manuf. 2021, 37, 101630. [Google Scholar] [CrossRef]
  20. Pleass, C.; Jothi, S. Influence of powder characteristics and additive manufacturing process parameters on the microstructure and mechanical behaviour of Inconel 625 fabricated by Selective Laser Melting. Addit. Manuf. 2018, 24, 419–431. [Google Scholar] [CrossRef]
  21. Spierings, A.; Herres, N.; Levy, G. Influence of the particle size distribution on surface quality and mechanical properties in AM steel parts. Rapid Prototyp. J. 2011, 17, 195–202. [Google Scholar] [CrossRef] [Green Version]
  22. Gu, H.; Gong, H.; Dilip, J.J.S.; Pal, D.; Hicks, A.; Doak, H.; Stucker, B. Effects of Powder Variation on the Microstructure and Tensile Strength of Ti6Al4V Parts Fabricated by Selective Laser Melting. Solid Free. Fabr. Symp. 2014, 470–483. [Google Scholar]
  23. Brika, S.E.; Letenneur, M.; Dion, C.A.; Brailovski, V. Influence of particle morphology and size distribution on the powder flowability and laser powder bed fusion manufacturability of Ti-6Al-4V alloy. Addit. Manuf. 2019, 31, 100929. [Google Scholar] [CrossRef]
  24. Irrinki, H.; Dexter, M.; Barmore, B.; Enneti, R.K.; Pasebani, S.; Badwe, S.; Stitzel, J.; Malhotra, R.; Atre, S.V. Effects of Powder Attributes and Laser Powder Bed Fusion (L-PBF) Process Conditions on the Densification and Mechanical Properties of 17-4 PH Stainless Steel. JOM 2016, 68, 860–868. [Google Scholar] [CrossRef]
  25. Liu, B.; Wildman, R.; Tuck, C.; Ashcroft, I.; Hague, R. Investigation the effect of particle size distribution on processing parameters optimization in selective laser melting process. SFF 2011, 227–238. [Google Scholar]
  26. Gullane, A.; Murray, J.W.; Hyde, C.J.; Sankare, S.; Evirgen, A.; Clare, A.T. Failure modes in dual layer thickness Laser Powder Bed Fusion components using a novel post-mortem reconstruction technique. Addit. Manuf. 2022, 59, 103186. [Google Scholar] [CrossRef]
  27. Gullane, A.; Murray, J.W.; Hyde, C.J.; Sankare, S.; Evirgen, A.; Clare, A.T. On the use of multiple layer thicknesses within laser powder bed fusion and the effect on mechanical properties. Mater. Des. 2021, 212, 110256. [Google Scholar] [CrossRef]
  28. Pal, S.; Lojen, G.; Kokol, V.; Drstvensek, I. Evolution of metallurgical properties of Ti-6Al-4V alloy fabricated in different energy densities in the Selective Laser Melting technique. J. Manuf. Process. 2018, 35, 538–546. [Google Scholar] [CrossRef]
  29. Gordon, J.V.; Narra, S.P.; Cunningham, R.W.; Liu, H.; Chen, H.; Suter, R.M.; Beuth, J.L.; Rollett, A.D. Defect structure process maps for laser powder bed fusion additive manufacturing. Addit. Manuf. 2020, 36, 101552. [Google Scholar] [CrossRef]
  30. Panwisawas, C.; Qiu, C.; Anderson, M.J.; Sovani, Y.; Turner, R.P.; Attallah, M.M.; Brooks, J.W.; Basoalto, H.C. Mesoscale modelling of selective laser melting: Thermal fluid dynamics and microstructural evolution. Comput. Mater. Sci. 2017, 126, 479–490. [Google Scholar] [CrossRef]
  31. Qiu, C.; Panwisawas, C.; Ward, M.; Basoalto, H.C.; Brooks, J.W.; Attallah, M.M. On the role of melt flow into the surface structure and porosity development during selective laser melting. Acta Mater. 2015, 96, 72–79. [Google Scholar] [CrossRef] [Green Version]
  32. Nguyen, Q.; Luu, D.; Nai, S.; Zhu, Z.; Chen, Z.; Wei, J. The role of powder layer thickness on the quality of SLM printed parts. Arch. Civ. Mech. Eng. 2018, 18, 948–955. [Google Scholar] [CrossRef]
  33. Cai, J.; Li, F.; Liu, T.; Chen, B.; He, M. Constitutive equations for elevated temperature flow stress of Ti–6Al–4V alloy considering the effect of strain. Mater. Des. 2011, 32, 1144–1151. [Google Scholar] [CrossRef]
  34. Min, D.; Shen, J.; Lai, S.; Chen, J.; Xu, N.; Liu, H. Effects of heat input on the low power Nd:YAG pulse laser conduction weldability of magnesium alloy AZ61. Opt. Lasers Eng. 2011, 49, 89–96. [Google Scholar] [CrossRef]
  35. Jallo, L.J.; Chen, Y.; Bowen, J.; Etzler, F.; Dave, R. Prediction of Inter-particle Adhesion Force from Surface Energy and Surface Roughness. J. Adhes. Sci. Technol. 2012, 25, 367–384. [Google Scholar] [CrossRef]
  36. Baesso, I.; Karl, D.; Spitzer, A.; Gurlo, A.; Günster, J.; Zocca, A. Characterization of powder flow behavior for additive manufacturing. Addit. Manuf. 2021, 47, 102250. [Google Scholar] [CrossRef]
  37. Kalman, H. Quantification of mechanisms governing the angle of repose, angle of tilting, and Hausner ratio to estimate the flowability of particulate materials. Powder Technol. 2021, 382, 573–593. [Google Scholar] [CrossRef]
  38. Wang, D.; Wu, S.; Fu, F.; Mai, S.; Yang, Y.; Liu, Y.; Song, C. Mechanisms and characteristics of spatter generation in SLM processing and its effect on the properties. Mater. Des. 2017, 117, 121–130. [Google Scholar] [CrossRef]
  39. Wang, S.; Ning, J.; Zhu, L.; Yang, Z.; Yan, W.; Dun, Y.; Xue, P.; Xu, P.; Bose, S.; Bandyopadhyay, A. Role of porosity defects in metal 3D printing: Formation mechanisms, impacts on properties and mitigation strategies. Mater. Today 2022, 59, 133–160. [Google Scholar] [CrossRef]
  40. Bustillos, J.; Kim, J.; Moridi, A. Exploiting lack of fusion defects for microstructural engineering in additive manufacturing. Addit. Manuf. 2021, 48, 102399. [Google Scholar] [CrossRef]
  41. Huang, Y.; Fleming, T.G.; Clark, S.J.; Marussi, S.; Fezzaa, K.; Thiyagalingam, J.; Leung, C.L.A.; Lee, P.D. Keyhole fluctuation and pore formation mechanisms during laser powder bed fusion additive manufacturing. Nat. Commun. 2022, 13, 1170. [Google Scholar] [CrossRef]
  42. Chen, Z.; Wu, X.; Tomus, D.; Davies, C.H. Surface roughness of Selective Laser Melted Ti-6Al-4V alloy components. Addit. Manuf. 2018, 21, 91–103. [Google Scholar] [CrossRef]
  43. Abele, E.; Kniepkamp, M. Analysis and optimisation of vertical surface roughness in micro selective laser melting. Surf. Topogr. Metrol. Prop. 2015, 3, 34007. [Google Scholar] [CrossRef]
  44. Strano, G.; Hao, L.; Everson, R.M.; Evans, K.E. Surface roughness analysis, modelling and prediction in selective laser melting. J. Mater. Process. Technol. 2013, 213, 589–597. [Google Scholar] [CrossRef]
  45. Chen, Z.; Wu, X.; Davies, C.H. Process variation in Laser Powder Bed Fusion of Ti-6Al-4V. Addit. Manuf. 2021, 41, 101987. [Google Scholar] [CrossRef]
  46. Gusarov, A.V.; Kovalev, E.P. Model of thermal conductivity in powder beds. Phys. Rev. B 2009, 80, 024202. [Google Scholar] [CrossRef]
  47. Wang, D.; Yang, Y.; Yi, Z.; Su, X. Research on the fabricating quality optimization of the overhanging surface in SLM process. Int. J. Adv. Manuf. Technol. 2012, 65, 1471–1484. [Google Scholar] [CrossRef]
  48. Ilin, A.; Logvinov, R.; Kulikov, A.; Prihodovsky, A.; Xu, H.; Ploshikhin, V.; Günther, B.; Bechmann, F. Computer Aided Optimisation of the Thermal Management During Laser Beam Melting Process. Phys. Procedia 2014, 56, 390–399. [Google Scholar] [CrossRef] [Green Version]
  49. Huang, W.; He, D.; Wang, H.; Qin, S.; Wang, L.; Xu, X. The Effect of Heat Treatment on the Anisotropy of Ti-6Al-4V by Selective Laser Melting. JOM 2022, 74, 2724–2732. [Google Scholar] [CrossRef]
  50. Xu, W.; Brandt, M.; Sun, S.; Elambasseril, J.; Liu, Q.; Latham, K.; Xia, K.; Qian, M. Additive manufacturing of strong and ductile Ti–6Al–4V by selective laser melting via in situ martensite decomposition. Acta Mater. 2014, 85, 74–84. [Google Scholar] [CrossRef]
  51. Wang, H.; Chao, Q.; Chen, H.; Chen, Z.; Primig, S.; Xu, W.; Ringer, S.; Liao, X. Formation of a transition V-rich structure during the α’ to α + β phase transformation process in additively manufactured Ti-6Al-4 V. Acta Mater. 2022, 235, 118104. [Google Scholar] [CrossRef]
  52. Sun, S.; Zhang, D.; Palanisamy, S.; Liu, Q.; Dargusch, M.S. Mechanical properties and deformation mechanisms of martensitic Ti6Al4V alloy processed by laser powder bed fusion and water quenching. Mater. Sci. Eng. A 2022, 839, 142817. [Google Scholar] [CrossRef]
  53. Yang, J.; Yu, H.; Yin, J.; Gao, M.; Wang, Z.; Zeng, X. Formation and control of martensite in Ti-6Al-4V alloy produced by selective laser melting. Mater. Des. 2016, 108, 308–318. [Google Scholar] [CrossRef]
  54. Mercelis, P.; Kruth, J. Residual stresses in selective laser sintering and selective laser melting. Rapid Prototyp. J. 2006, 12, 254–265. [Google Scholar] [CrossRef]
  55. Wang, Y.N.; Huang, J.C. Texture analysis in hexagonal materials. Mater. Chem. Phys. 2003, 81, 11–26. [Google Scholar] [CrossRef]
  56. Ren, S.; Chen, Y.; Liu, T.; Qu, X. Effect of Build Orientation on Mechanical Properties and Microstructure of Ti-6Al-4V Manufactured by Selective Laser Melting. Met. Mater. Trans. A 2019, 50, 4388–4409. [Google Scholar] [CrossRef]
  57. Matsumoto, H.; Yoneda, H.; Sato, K.; Kurosu, S.; Maire, E.; Fabregue, D.; Konno, T.J.; Chiba, A. Room-temperature ductility of Ti–6Al–4V alloy with α′ martensite microstructure. Mater. Sci. Eng. A 2010, 528, 1512–1520. [Google Scholar] [CrossRef]
  58. Chao, Q.; Cizek, P.; Wang, J.; Hodgson, P.D.; Beladi, H. Enhanced mechanical response of an ultrafine grained Ti–6Al–4V alloy produced through warm symmetric and asymmetric rolling. Mater. Sci. Eng. A 2016, 650, 404–413. [Google Scholar] [CrossRef]
Figure 1. (ad) SEM images showing the particle morphology of the Ti-6Al-4V powders: (a) T1 (0–53 μm); (b) T2 (15–53 μm); (c) T3 (15–75 μm); (d) T4 (15–105 μm); (e) PSD of the Ti-6Al-4V powders used in this study.
Metals 13 00604 g001
Figure 2. The sample scheme of the Ti-6Al-4V specimens for (a) porosity/tension and (b) surface roughness measurements. (c) Geometrical size of the pyramid specimen for surface roughness measurement and (d) geometrical size of the tensile specimen.
Metals 13 00604 g002
Figure 3. Relative densities of the LPBF specimens manufactured at various VEDs.
Metals 13 00604 g003
Figure 4. OM images of the specimens produced from different types of powders and process parameters: (ac) T1, (df) T2, (gi) T3, and (jl) T4; (a,d,g,j) VED = 26 J/mm3 (Laser power = 280 W Scanning speed = 1800 mm/s), (b,e,h,k) VED = 39 J/mm3 (Laser power = 280 W Scanning speed = 1200 mm/s), (c,f,i,l) VED = 78 J/mm3 (Laser power = 280 W Scanning speed = 600 mm/s).
Metals 13 00604 g004
Figure 5. Top surface morphologies of LPBF specimens formed using different powders and process parameters: (ac) T1, (df) T2, (gi) T3, and (jl) T4. (a,d,g,j) VED = 26 J/mm3 (Laser power = 280 W Scanning speed = 1800 mm/s), (b,e,h,k) VED = 39 J/mm3 (Laser power = 280 W Scanning speed = 1200 mm/s), (c,f,i,l) VED = 78 J/mm3 (Laser power = 280 W Scanning speed = 600 mm/s). The arrows show the scanning direction.
Metals 13 00604 g005
Figure 6. Ra values measured on the inclined surfaces of the pyramid specimen using different PSDs and manufacturing parameters (a) 45° up-skin, (b) 45° down-skin, (c) 60° up-skin, (d) 60° down-skin.
Metals 13 00604 g006
Figure 7. Angular plot of Ra values measured from up-skin and down-skin surfaces of the cone-shaped roof structure. Roughness was measured at 12 different angles relative to the powder re-coating direction. The processing parameters used in (ai) are for specimens (1–9) as shown in Table 2.
Metals 13 00604 g007
Figure 8. Typical SEM images of the selected facets of the T4 specimen on (a) 45° up-skin surfaces; (b) 45° down-skin surfaces; (c) 60° up-skin surfaces; (d) 60° down-skin surfaces.
Metals 13 00604 g008
Figure 9. OM images of the as-built specimens made from different powders: (a) T1; (b) T2; (c) T3; (d) T4.
Metals 13 00604 g009
Figure 10. BSE images showing the microstructure of the T4 specimen: (a) as-built, (b) 800 °C-2h annealing treatment. (a1) and (b1) show the magnified images as marked in (a) and (b), respectively.
Metals 13 00604 g010
Figure 11. Tensile properties of the as-built and annealed Ti-6Al-4V specimens using different powders: (a) as-built state in horizontal direction; (b) as-built state in vertical direction; (c) annealed state in horizontal direction; (d) annealed state in vertical direction.
Metals 13 00604 g011
Figure 12. SEM images showing the tensile fracture surfaces of the as-built and annealed Ti-6Al-4V specimens produced using T3 powder: (a) as-built state in horizontal direction; (b) as-built state in vertical direction; (c) annealed state in horizontal direction; (d) annealed state in vertical direction. (a1d1) are the magnified SEM images corresponding to (ad).
Metals 13 00604 g012
Table 1. Process parameters for producing cubes.
Manufacturing ParametersValues
Laser power/W200–400280
Scanning speed/mm·s−11200600–1800
VED/J·mm−327.8–55.677.8–25.9
Table 2. Process parameters for producing pyramid specimens.
SpecimensLaser Power (W)Scanning Speed
(mmꞏs−1)
VED (J·mm−3)
132090059.3
2320120044.4
3320150035.6
428090051.9
5280120038.9
6280150031.1
724090044.4
8240120033.3
9240150026.7
Table 3. The flowability of the powders with different PSDs.
TypesAverage Particle Diameter (μm)Fluidity
(s/50g)
Apparent Density
(g/cm3)
Tap Density
(g/cm3)
Hausner Ratio
T13336.722.302.861.243
T23534.292.302.841.235
T34529.942.322.841.224
T45924.302.412.921.211
Table 4. Tensile properties of the as-built and annealed Ti-6Al-4V specimens using different powders.
SampleUTS (MPa)YS (MPa)Elongation (%)
As-built HorizontalT1120110729.5
T21206107710.8
T3119310609.7
T4118910489.1
As-built VerticalT11122106212.3
T21106104712.1
T31106104711.2
T41124106412.3
Annealing HorizontalT1102695314.1
T2102995614.3
T3101994515.0
T4101493815.1
Annealing VerticalT1102896315.2
T2104197816.2
T3102396113.9
T4101795414.1
Disclaimer/Publisher’s Note: The statements, opinions and data contained in all publications are solely those of the individual author(s) and contributor(s) and not of MDPI and/or the editor(s). MDPI and/or the editor(s) disclaim responsibility for any injury to people or property resulting from any ideas, methods, instructions or products referred to in the content.

