Article

Impact of Ti Doping on the Microstructure and Mechanical Properties of CoCrFeMoNi High-Entropy Alloy

by
Santiago Jose Brito-Garcia
1,
Julia Claudia Mirza-Rosca
1,2,*,
Cristina Jimenez-Marcos
1 and
Ionelia Voiculescu
3
1
Mechanical Engineering Department, University of Las Palmas de Gran Canaria, 35001 Las Palmas de Gran Canaria, Spain
2
Materials Engineering, and Welding Department, Transilvania University of Brasov, 500036 Brasov, Romania
3
Faculty of Industrial Engineering and Robotics, Politehnica University of Bucharest, 060042 Bucharest, Romania
*
Author to whom correspondence should be addressed.
Metals 2023, 13(5), 854; https://doi.org/10.3390/met13050854
Submission received: 30 March 2023 / Revised: 22 April 2023 / Accepted: 24 April 2023 / Published: 27 April 2023
(This article belongs to the Special Issue Microstructure/Property Relationship in Metals)

Abstract

:
The design principle of high-entropy alloys is to mix many chemical elements in equal or nearly equal proportions to create new alloys with unique and special properties such as high strength, ductility and corrosion resistance. Some properties of high-entropy alloys can be adjusted via introducing new doping elements, which are selected according to working conditions. The high-entropy alloy CoCrFeMoNi was examined to determine the impact of Ti doping on its micro-structure, microhardness and elastic modulus. Microstructure analysis revealed a core structure consisting of both face-centered cubic (FCC) and body-centered cubic (BCC) phases, along with the formation of a Laves phase. The addition of Ti made the alloy grains finer and reduced the Mo concentration difference between the interdendritic and dendritic regions. As a result of Ti doping, the microhardness of the alloy increased from 369 HV 0.2 to 451 HV 0.2. Ti doping produced a doubling of the breaking strength value, although no significant changes were observed in the elastic modulus of the CoCrFeMoNi alloy.

1. Introduction

Metallic alloys that contain at least five distinct elements in approximately equal proportions are known as high-entropy alloys (HEAs). HEAs contain numerous principal elements in high concentrations, unlike traditional alloys, which usually contain one or two main elements with minor amounts of other elements added to enhance certain properties. The high-entropy concept was introduced in 2004 by two different groups [1,2] and since then, a variety of HEAs have been developed and studied, including alloys containing elements such as nickel [3,4], aluminum [5,6], titanium [7,8] and molybdenum [9]. One of the defining characteristics of HEAs is their high configurational entropy, which is a measure of the degree of disorder in the arrangement of atoms within a material. Some potential applications of HEAs include high-temperature materials for use in jet engines or nuclear reactors [9,10], lightweight alloys for use in the aerospace or automotive industries [11,12] and corrosion-resistant coatings for use in harsh environments [13,14,15]. Recently, high-entropy alloys have been created for potential use in extremely effective electrochemical devices that efficiently and sustainably transform fuel energy into electricity [16]. While HEAs are a relatively new class of materials, research in this area is rapidly expanding, and there is significant interest in exploring their potential properties and applications.
The field of high-entropy alloys has found that CoCrFeMoNi possesses exceptional mechanical properties, including impressive strength and flexibility even when exposed to extremely low temperatures [17,18]. These properties, particularly its high-temperature strength and ductility, make CoCrFeMoNi a promising material for use in high-temperature structures such as gas turbines and nuclear reactors [19]. Additionally, adding Nb and varying concentrations of Mo [20] has been found to enhance the corrosion resistance of load-bearing parts used in marine equipment.
Doping of high-entropy alloys (HEAs) refers to the intentional addition of other chemical elements, in small amounts [21], to the base alloy composition which can influence the physical and mechanical properties of the alloy. Overall, the effect of doping on HEAs depends on the specific elements added, their concentration and the intended application of the alloy. Through carefully adapting the doping strategy, HEAs with properties suitable for certain operating conditions can be obtained.
Ti doping has been extensively studied in a wide range of materials, including semiconductors, ceramics and metals. Ti doping is commonly used to modify the electronic properties of semiconductors. For example, Ti doping in silicon (Si) can lead to an increase in the number of free electrons, which can enhance the electrical conductivity and make Si more suitable for applications such as solar cells and microelectronics [22]. Similarly, Ti doping in gallium nitride (GaN) can enhance the electrical conductivity and improve the performance of GaN-based devices (LEDs) and the mobility of electrons in transistors (HEMTs) [23,24].
Ti doping can also alter the mechanical and chemical properties of ceramics. For instance, Ti doping in alumina (Al2O3) can enhance its hardness, fracture toughness and wear resistance, making it suitable for applications such as cutting tools, biomedical implants and armor materials [25]. Ti doping in barium titanate (BaTiO3) can modify its ferroelectric properties, leading to improved piezoelectricity and a greater dielectric constant, which can be useful for applications such as sensors and actuators [26].
The mechanical and physical characteristics of metals can also be changed through titanium doping. For example, Ti doping in copper (Cu) can improve its strength, ductility and thermal stability, making it suitable for applications such as electrical interconnects and microelectronic packaging [27]. Similarly, Ti doping in iron (Fe) can enhance its magnetic properties, making it suitable for magnetic storage and sensing applications [28].
Thus, the aim of this research paper was to study the Ti doping effects on the microstructure and mechanical properties of the high-entropy alloy CoCrFeMoNi. Ti was chosen as a doping element due to its grain-refining effect, which allows the improvement of strength and ductility. For now, there are no data available about this particular doping method on high-entropy alloys from this alloying system and which are manufactured using the vacuum arc melting technique.

2. Materials and Methods

2.1. Sample Preparation

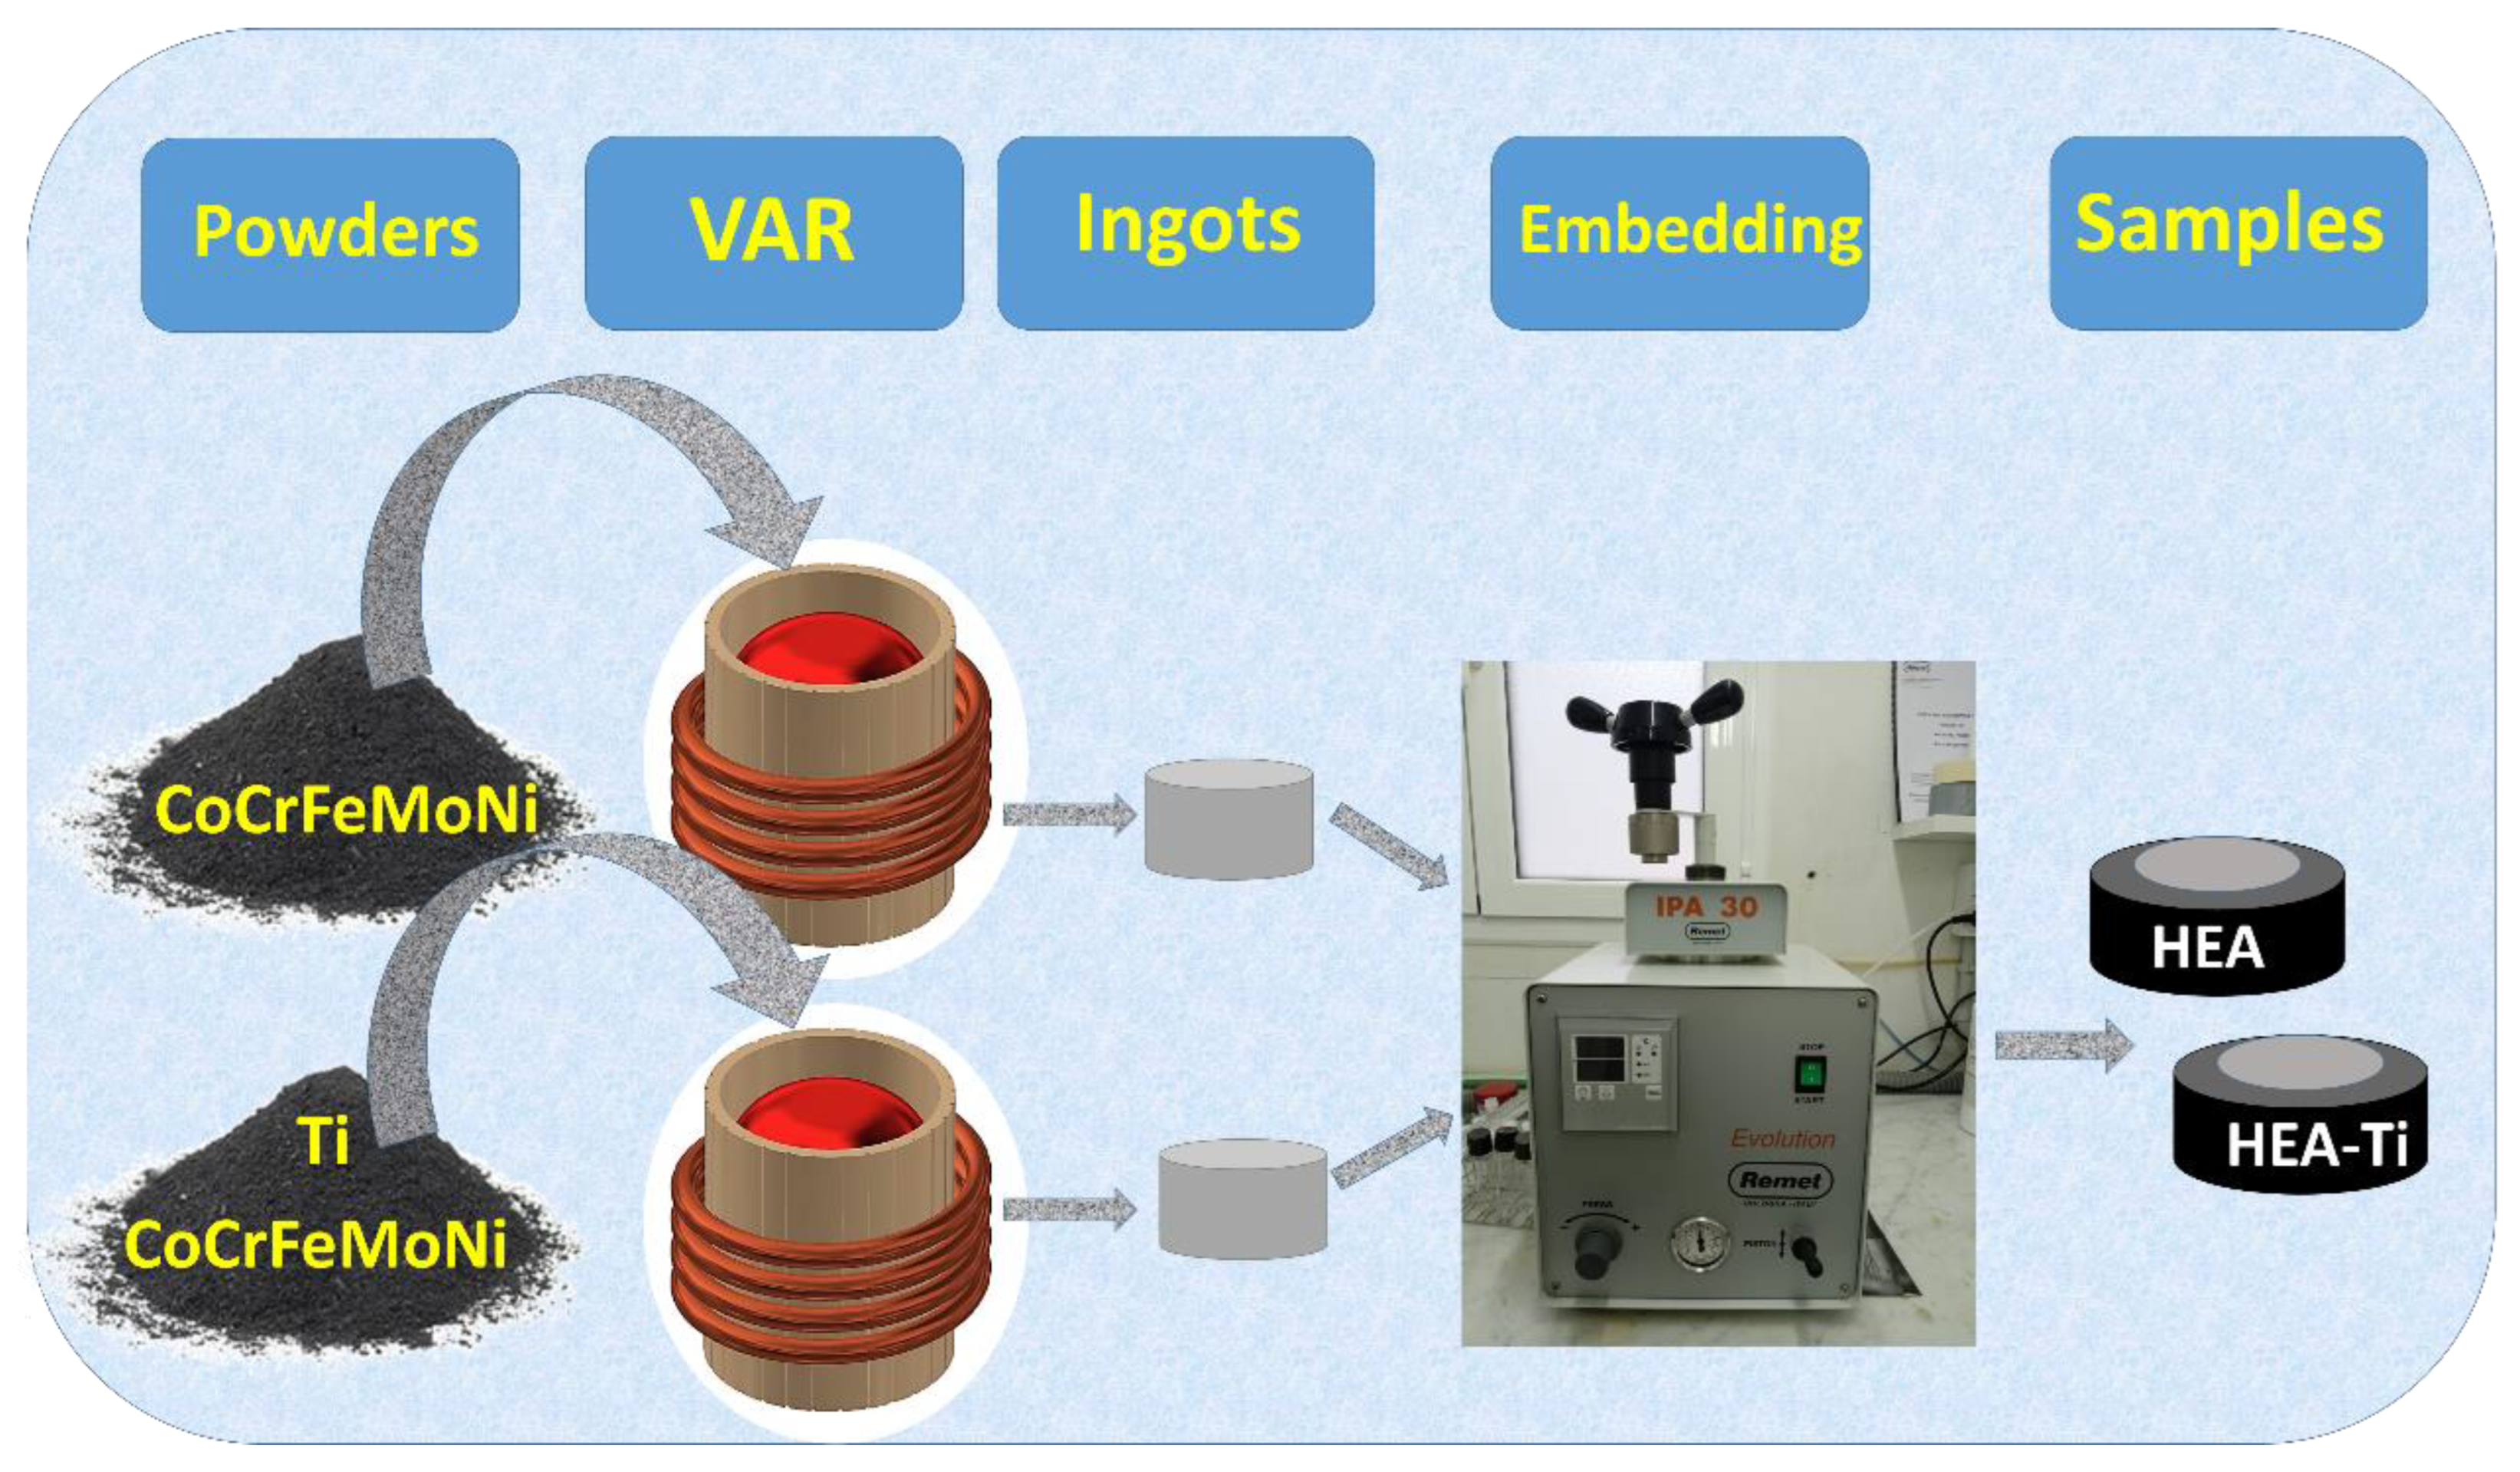
The high-entropy CoCrFeMoNi alloy (named HEA) and Ti-doped CoCrFeMoNi alloy (named HEATi) were obtained using a MRF ABJ 900 vacuum arc remelting (VAR) installation from ERAMET Laboratory (UPB, Bucharest, Romania). To design the metallic charge, potential losses from vaporization were considered, as well as the predicted level of chemical element incorporation during melting. Energy dispersive X-ray analysis (EDS) employing a Fei XL30 ESEM (MTM, Leuven, Belgium) scanning electron microscope outfitted with an EDAX Sapphire detector was used to ascertain the elemental composition of the HEA and doped HEATi samples. The results (in wt% and at%) are presented in Table 1.
Raw materials with high purity levels of at least 99.7% for Co, Cr, Fe, Mo, Ni and Ti were utilized. The obtained alloys were subjected to 8 rounds of flipping and re-melting in VAR equipment under an inert Argon atmosphere to achieve adequate homogeneity. The resultant ingots were rods 10 cm in length and 1 cm in diameter. To carry out assessments of the structure, composition and mechanical properties, the samples underwent a three-stage surface processing procedure. First, they were embedded into a phenolic resin cylinder (see Figure 1) and then polished using SiC abrasive papers with increasing grain sizes ranging from 240 to 2000 grit. Following this, they underwent final polishing utilizing a 0.1 μm alpha alumina paste and were ultimately cleaned using ultrasonic-deionized water according to ASTM E3-11(2017) [29].

2.2. Microstructural Characterization

To investigate the microstructure, the prepared cross-sections cut off from the alloy ingots were subjected to electrochemical etching using a 10% oxalic acid solution, with a voltage of 5 V and an immersion time ranging from 5 to 25 s. The microstructure was first examined using an OLYMPUS BX 51 (Olympus Corp., Tokyo, Japan) optical microscope (OM).
The samples’ X-ray diffraction data were measured using a Bruker D8 ADVANCE diffractometer (Bruker Corp., Billerica, MA, USA) and used to characterize the phase analysis. CuKα radiation (λ = 1.5418 Å) in the range of 2θ = 5−80° with a step size of 0.02° at a power of 40 kV (LYNXEYE XE high-speed position-sensitive detector) in Bragg–Brentano geometry was employed for the analysis.
For SEM observations, a Hitachi TM3030 Scanning Electron Microscope with an EDX spectrometer (Hitachi High-Tech Science Corporation, Tokyo, Japan) was utilized, with voltage set to 15 kV and the working distance set to 10.7 mm.

2.3. Microhardness

To determine the microhardness of the samples, an indentation test was conducted using a Shimadzu HMV 2T microhardness tester (Shimadzu, Kyoto, Japan) at 25 °C and 45% humidity. The sample, which had previously been polished to a mirror finish, was examined using an optical microscope before perpendicular microhardness measurements were taken. Indentations were made at 0.5 mm intervals along the sample diameter, using a load of 1.961 N and a dwell time of 10 s. In accordance with ISO 14577-1:2015 [30], 10 indentations were made for each sample and the Vickers hardness (HV) was then calculated as the average value of each individual sample.

2.4. Three-Point Bending Test

To determine the modulus of elasticity of the material, a three-point bending test was conducted. The specimens were prepared via cutting samples using a BUEHLER IsoMet® 4000 precision linear saw (Lake Bluff, IL, USA), from which minimal alteration of the material occurs. The cutting process utilizes a blade speed of 2200 rpm and a feed speed of 13.9 mm/min. A total of ten samples were selected from each alloy to obtain a weighted average of the test results. The test was performed using a BOSE Corporation Electroforce 3100 machine (Bose Corporation, Eden Prairie, MN, USA), applying a maximum load of 22 N until the material fractured or reached the maximum load capacity according to ISO 7438:2020 [31].

3. Results and Discussions

3.1. Microstructural Characterization

To study the effect of Ti doping on the microstructure, the base CoCrFeMoNi alloy (Figure 2a,b) and the Ti-doped one (Figure 2c,d) were examined using optical microscopy. The microstructure of both alloys is dense and free of cracks. From the images, it can easily be seen that the dimensions of the dendrites in the case of the Ti-doped alloy are much finer at the same magnification. Over the same surface area, approximately twelve grains of different diameters (bordered by grain boundaries) are observed in the Ti-doped alloy, while in the un-doped alloy there are only two coarse grains.
XRD analysis of the CoCrFeMoNi alloy reveals a microstructure consisting of three main phases: an FCC (face-centered cubic) solid solution and a BCC (body-centered cubic) solid solution, in addition to a Laves phase (Figure 3). This result agrees with the result obtained for the equiatomic CoCrFeNi alloy, reported to be multiphase at room temperature [32]. The FCC solid solution is the dominant phase and consists of a mixture of Co, Cr, Fe, Mo and Ni atoms. The BCC solid solution consists mainly of Mo and Fe atoms. The ternary intermetallic hard phase (Laves phase), consisting of Co, Fe, and Mo atoms, is distributed in both phases. The uniform distribution and finer dimensions of Laves phases can contribute to increased mechanical strength properties.
Sherrer’s equation is used to calculate the size of nanocrystalline materials from the full width at half maximum (FWHM) of a diffraction peak acquired from X-ray diffraction (XRD) research. The equation is as follows:
D = K λ ( β   cos   θ )
where:
  • D denotes the material’s average crystallite size in nanometers (nm).
  • K is a dimensionless form factor that is usually taken as 0.9.
  • λ is the wavelength of the X-ray radiation used for the diffraction measurement, which is usually measured in angstroms (Å).
  • β is the diffraction peak’s FWHM in radians.
  • θ is the Bragg angle, which is the X-ray beam’s angle of incidence on the sample surface.
The equation connects the finite size of crystallites in a material to the widening of diffraction peaks. The diffraction peak becomes wider as the crystallite size decreases. The equation assumes that the crystallites in the sample are spherical and randomly orientated. The results for the HEA and HEATi are presented in Figure 4.
The SEM images and elemental maps of the samples are presented in Figure 5.
To uncover the chemical composition of the analyzed samples within different micro-areas identified as spectra, a semi-quantitative analysis was performed in ten points located on different phases (see Figure 6 and Figure 7): five in the dendritic zone (D) and five in the interdendritic zone (ID). Then, the mean and standard deviation were calculated. Table 2 and Table 3 display the measured concentration values of the elements detected in the respective alloys’ composition. An analysis comparing the microstructure of the two alloys revealed that upon introducing Ti to the CoCrFeMoNi alloy, there was a noticeable reduction in the volume fraction of interdendritic zones. It is common to observe the presence of the σ phase in this type of alloy, in addition to the FCC structure [33]. When Mo was added to the CoCrFeNi system, a eutectic structure emerged that contained intermetallic phases (σ and µ) within the FCC phase. This eutectic microstructure had a notable impact on the mechanical properties of the alloy, leading to increased hardness and yield strength. The Mo concentration in the interdendritic zone is the primary factor that contributes to the appearance of the σ phase [34]. The CoCrFeNiMo high-entropy alloy was found to contain an approximately 14% Cr- and Mo-rich σ phase [35]. In the HEA sample, the Mo concentration in the interdendritic zones dropped from 34.4 wt% to 15.6 wt%. In contrast, the Cr concentration remained steady, hovering around 20 wt%. This shift in concentration ultimately resulted in a decrease in the tendency to form a Laves phase.
The segregation factor is a helpful parameter to evaluate an alloy’s degree of segregation and to compare the segregation behavior of various alloys. When the SR value is higher, there is more concentration of the element in the alloy’s most segregated area, indicating a greater level of segregation.
The segregation factor (see Table 4) can be measured experimentally using various techniques, such as electron microscopy and energy-dispersive X-ray spectroscopy (EDS). These techniques allow the concentration of elements to be measured at different locations within the alloy, providing information on the extent of segregation.
S R = Element   concentration   in   Dendritic   area Element   concentration   in   Interdendritic   area
Upon conducting nanoscale analysis of the HEA sample, it was found that the dendritic region was abundant in Co, Fe and Ni, but had low levels of Mo. On the other hand, the interdendritic region was rich in Mo but depleted in Co, Fe and Ni. In the HEA alloy, the element that exhibited no noticeable difference between the D and ID regions, with slightly increase of the concentration observed in the D zone, was chromium.
As Ti doping was introduced, the effect of iron became more prominent, and Ti exhibited a noticeable difference in the two regions. Cobalt, iron, and molybdenum exhibited an increase in their segregation ratios, while nickel showed a decrease in its segregation ratio. This indicates that these elements formed fewer intermetallic compounds or precipitated less. The segregation ratio of chromium remained largely unchanged. It can be said that Ti doping reduced the solubility limit of the solid phase for nickel, cobalt and iron, and increased it for molybdenum and titanium, while chromium was almost unaffected. In our alloys, doping with 0.36 at.% Ti changed the distribution of Mo in the dendritic zones (max. 39.35 wt%, min. 33.79 wt%) compared to the interdendritic zones (max. 29.39 wt%, min. 18.26 wt%).
3.2. Mechanical Properties

The analysis of mechanical properties focuses on two specific methods for evaluating toughness: microhardness and three-point bending. Both methods involve preparing samples, which can lead to changes in the material structure due to the cutting process. These changes can create thin layers of altered material that may affect the results of the elastic modulus. Although efforts were made to minimize this effect and verify the accuracy of the conclusions about the underlying material, additional work is needed to eliminate the impact of sample preparation on the results.

3.2.1. Microhardness

Microhardness tests were carried out on the two samples, HEA and HEATi (see Figure 8).
Hardness imprints indicate how the surface of the alloy is deformed through slow progressive pressing with the diamond indenter. Thus, it is possible to observe the deformation planes that appear at the tips of the imprint as well as the deviation from the ideal rhombic shape of the imprint if the material is inhomogeneous in the two directions of deformation. The values of the diagonals of the fingerprints indicate the hardness differences between the two studied alloys. HEA alloy has a larger diameter, which means decreased hardness compared to the HEATi alloy.
Table 5 provides information about the microhardness values in HV 0.2 and standard deviation for the 10 measurements conducted on each sample. The data show that the inclusion of Ti had a positive effect on the average microhardness of HEA. The addition of titanium during the doping process impacted several aspects, including the size of the grains and their boundaries, distribution of elements and the formation of precipitates. These changes resulted in variations in microhardness and the strengthening mechanisms of the metal [33,36]. The four primary mechanisms for strengthening metals are solid solution, precipitation, dislocation and boundary strengthening. The titanium doping process mainly employs solid solution, precipitation and dislocation strengthening to achieve its effects. The characteristics of the microstructure significantly impacted the properties of the sample that was doped with titanium. As a result, the main strengthening mechanisms were precipitation and dislocation.
The process of doping revealed a discrepancy in the concentration of Mo between the dendritic and interdendritic zones, leading to the strengthening mechanisms of dissolution and dislocation. Furthermore, the formation of a Laves phase was beneficial for strengthening via precipitation, which plays a crucial role in enhancing the microhardness of the titanium alloy.
Taking into account that the grain size of the HEA sample is greater than that of HEATi (see metallographic images from Figure 2), the obtained values of microhardness are in accordance with the Hall–Petch relationship, which is based on the idea that the smaller the grains in a metal, the greater the number of grain boundaries per unit volume [37]. These grain boundaries act as barriers to dislocation motion, which is the primary mechanism of plastic deformation in metals. Therefore, a high density of grain boundaries can hinder the movement of dislocations and make it more difficult for the metal to deform plastically, resulting in an increase in microhardness.

3.2.2. Three-Point Bending Test

Figure 9 and Figure 10 present load-displacement diagrams obtained through the three-point bending test on two samples. The elastic limit of the alloy was identified as the point at which the sample returned to its original shape after deformation. Within this limit, the graph displayed a linear relationship, and the gradient of this line was calculated using the formula dF/dε = 48EI/L3, where E represents the Young’s modulus of the sample of length L, supported on two roller supports, and subjected to a concentrated load F at its center with a central deflection ε. To determine the second moment of area, I, the equation I = (a3·b)/12 was utilized, with a representing the sample’s depth and b representing its width. Using these calculations, the average modulus of elasticity for each alloy was determined, with results indicating that the alloy lacking Ti had a slightly lower modulus of elasticity than the Ti-containing alloy, as shown in Table 6. Ten samples of each alloy underwent testing.
It was found that the values obtained for HEA and HEATi are almost the same; the addition of Ti does not modify the modulus of elasticity and, therefore, its stiffness.
Additionally, Figure 9 and Figure 10 display SEM images of the fracture surfaces for both alloys, revealing a brittle fracture in both cases, with a visible cleavage-like fracture plane.

4. Conclusions

The CoCrFeMoNi high-entropy alloy was examined to determine the impact of Ti doping on its microstructure and mechanical properties. The microstructure analysis revealed a fundamental matrix that consisted of both face-centered cubic (FCC) and body-centered cubic (BCC) phases, along with the formation of a Laves phase. Upon the addition of Ti doping, there was a noticeable refinement of the grains within the alloy. Additionally, there was a reduction in the disparity between the concentration of Mo within the interdendritic and dendritic regions. The increase in Ti doping also led to a rise in microhardness, which was measured to be 451 HV 0.2, up from 369 HV 0.2. This aspect can be taken into account when designing the alloy for conditions where improved hardness or good wear resistance are required. However, despite the increase in breaking strength and microhardness values, no significant modifications in the elastic modulus of the HEATi alloy were observed.

Author Contributions

S.J.B.-G., writing—original draft preparation, investigation and management; J.C.M.-R., conceptualization and validation; C.J.-M., investigation, writing—review and editing; I.V., methodology, investigation and data curation. All authors have read and agreed to the published version of the manuscript.

Funding

This work was supported by the Romanian National Authority for Scientific Research, CNDI–UEFISCDI, through project number PN-III-P2-2.1-PED-2019-3953, contract 514PED⁄2020: “New ceramic layer composite material processed by laser techniques for corrosion and high temperature applications—LASCERHEA”, within PNCDI III, by Cabildo de Gran Canaria, project number CABINFR2019-07 and by the project ULPGC Excellence, funded by the Department of Economy, Knowledge and Employment of the Canary Islands Government.

Data Availability Statement

All data provided in the present manuscript are available to whom it may concern.

Conflicts of Interest

The authors declare no conflict of interest.

References

  1. Cantor, B.; Chang, I.T.H.; Knight, P.; Vincent, A.J.B. Microstructural development in equiatomic multicomponent alloys. Mater. Sci. Eng. A 2004, 375–377, 213–218. [Google Scholar] [CrossRef]
  2. Yeh, J.W. Recent progress in high-entropy alloys. Ann. Chim. Sci. Mater. 2006, 31, 633–648. [Google Scholar] [CrossRef]
  3. López Ríos, M.; Socorro Perdomo, P.P.; Voiculescu, I.; Geanta, V.; Crăciun, V.; Boerasu, I.; Mirza Rosca, J.C. Effects of nickel content on the microstructure, microhardness and corrosion behavior of high-entropy AlCoCrFeNix alloys. Sci. Rep. 2020, 10, 2I1119. [Google Scholar] [CrossRef] [PubMed]
  4. Florido-Suarez, N.; Socorro-Perdomo, P.; Geanta, V.; Mirza-Rosca, J. Effect of Heat Treatment on the Microstructure and Corrosión Resistance of AlCoCrFeNi High-Entropy Alloy. Microsc. Microanal. 2021, 27, 3372–3374. [Google Scholar] [CrossRef]
  5. Socorro-Perdomo, P.P.; Florido-Suárez, N.R.; Voiculescu, I.; Mirza-Rosca, J.C. Comparative eis study of alxcocrfeni alloys in ringer’s solution for medical instruments. Metals 2021, 11, 928. [Google Scholar] [CrossRef]
  6. Florido-Suarez, N.; Socorro-Perdomo, P.; Voiculescu, I.; Mirza-Rosca, J. Microstructure and Adjustment in Tensile Strength of Al 0.8 CoCrFeNi Fibers. Microsc. Microanal. 2021, 27, 3386–3388. [Google Scholar] [CrossRef]
  7. Wu, G.; Liu, C.; Brognara, A.; Ghidelli, M.; Bao, Y.; Liu, S.; Wu, X.; Xia, W.; Zhao, H.; Rao, J.; et al. Symbiotic crystal-glass alloys via dynamic chemical partitioning. Mater. Today 2021, 51, 6–14. [Google Scholar] [CrossRef]
  8. Socorro-Perdomo, P.; Florido-Suarez, N.; Voiculescu, I.; Mirza-Rosca, J. Biocompatibility of New High-Entropy Alloys with Non-Cytotoxic Elements. Microsc. Microanal. 2021, 27, 1772–1774. [Google Scholar] [CrossRef]
  9. Li, T.; Wang, D.; Zhang, S.; Wang, J. Corrosion Behavior of High Entropy Alloys and Their Application in the Nuclear Industry—An Overview. Metals 2023, 13, 363. [Google Scholar] [CrossRef]
  10. Rios, M.L.; Baldevenites, V.L.; Voiculescu, I.; Rosca, J.M. AlCoCrFeNi High Entropy Alloys as Possible Nuclear Materials. Microsc. Microanal. 2020, 26, 406–407. [Google Scholar] [CrossRef]
  11. Li, P.; Tong, Y.; Wang, X.; Sato, Y.S.; Dong, H. Microstructures and mechanical properties of AlCoCrFeNi2.1/6061-T6 aluminum-matrix composites prepared by friction stir processing. Mater. Sci. Eng. A 2023, 863, 144544. [Google Scholar] [CrossRef]
  12. Ron, T.; Shirizly, A.; Aghion, E. Additive Manufacturing Technologies of High Entropy Alloys (HEA): Review and Prospects. Materials 2023, 16, 2454. [Google Scholar] [CrossRef] [PubMed]
  13. Lin, C.; Yao, Y. Corrosion-Resistant Coating Based on High-Entropy Alloys. Metals 2023, 13, 205. [Google Scholar] [CrossRef]
  14. Bhaskaran Nair, R.; Supekar, R.; Morteza Javid, S.; Wang, W.; Zou, Y.; McDonald, A.; Mostaghimi, J.; Stoyanov, P. High-Entropy Alloy Coatings Deposited by Thermal Spraying: A Review of Strengthening Mechanisms, Performance Assessments and Perspectives on Future Applications. Metals 2023, 13, 579. [Google Scholar] [CrossRef]
  15. Qi, W.; Wang, W.; Yang, X.; Zhang, G.; Ye, W.; Su, Y.; Li, Y.; Chen, S. Effects of Al and Ti co-doping on the strength-ductility-corrosion resistance of CoCrFeNi-AlTi high-entropy alloys. J. Alloys Compd. 2022, 925, 166751. [Google Scholar] [CrossRef]
  16. Pikalova, E.Y.; Kalinina, E.G.; Pikalova, N.S.; Filonova, E.A. High-Entropy Materials in SOFC Technology: Theoretical Foundations for Their Creation, Features of Synthesis, and Recent Achievements. Materials 2022, 15, 8783. [Google Scholar] [CrossRef]
  17. Cui, G.; Han, B.; Yang, Y.; Wang, Y.; Chunyang, H. Microstructure and tribological property of CoCrFeMoNi High entropy alloy treated by ion sulfurization. J. Mater. Res. Technol. 2020, 9, 2598–2609. [Google Scholar] [CrossRef]
  18. Alloys, M. Cryogenic-Mechanical Properties and Applications of Multiple-Basis-Element Alloys. Metals 2022, 12, 2075. [Google Scholar]
  19. Wang, Z.; Jin, J.; Zhang, G.H.; Fan, X.H.; Zhang, L. Effect of temperature on the passive film structure and corrosion performance of CoCrFeMoNi high-entropy alloy. Corros. Sci. 2022, 208, 110661. [Google Scholar] [CrossRef]
  20. Zhou, Z.; Jiang, F.; Yang, F.; Yang, Y.; Liang, P. Novel laser cladding FeCoNiCrNb0.5Mox high-entropy alloy coatings with excellent corrosion resistance. Mater. Lett. 2023, 335, 133714. [Google Scholar] [CrossRef]
  21. Brito-Garcia, S.; Mirza-Rosca, J.; Geanta, V.; Voiculescu, I. Mechanical and Corrosion Behavior of Zr-Doped High-Entropy Alloy from CoCrFeMoNi System. Materials 2023, 16, 1832. [Google Scholar] [CrossRef] [PubMed]
  22. Kippeny, T.; Swafford, L.A.; Rosenthal, S.J. Semiconductor nanocrystals: A powerful visual aid for introducing the particle in a box. J. Chem. Educ. 2002, 79, 1094–1100. [Google Scholar] [CrossRef]
  23. Mendoza-Estrada, V.; González-García, A.; López-Pérez, W.; Pinilla, C.; González-Hernández, R. Structural, electronic and magnetic properties of Ti-doped polar and nonpolar GaN surfaces. J. Cryst. Growth 2017, 467, 12–17. [Google Scholar] [CrossRef]
  24. Cui, Z.; Ke, X.; Li, E.; Liu, T. Electronic and optical properties of titanium-doped GaN nanowires. Mater. Des. 2016, 96, 409–415. [Google Scholar] [CrossRef]
  25. Lee, D.K.; Kim, G.H.; Sohn, H.; Yang, M.K. Ti-doped alumina based reliable resistive switching in sub-μ A regime. Appl. Phys. Lett. 2020, 116, 213503. [Google Scholar] [CrossRef]
  26. Scott, J.F. Applications of modern ferroelectrics. Science 80 2007, 315, 954–959. [Google Scholar] [CrossRef]
  27. Ueki, M.; Hiroi, M.; Ikarashi, N.; Onodera, T.; Furutake, N.; Inoue, N.; Hayashi, Y. Effects of Ti addition on via reliability in Cu dual damascene interconnects. IEEE Trans. Electron. Devices 2004, 51, 1883–1891. [Google Scholar] [CrossRef]
  28. Gutfleisch, O.; Willard, M.A.; Brück, E.; Chen, C.H.; Sankar, S.G.; Liu, J.P. Magnetic materials and devices for the 21st century: Stronger, lighter, and more energy efficient. Adv. Mater. 2011, 23, 821–842. [Google Scholar] [CrossRef]
  29. ASTM E3-11(2017); Standard Guide for Preparation of Metallographic Specimens. ASTM International: West Conshohocken, PA, USA, 2017.
  30. ISO 14577-1:2015; Metallic Materials—Instrumented Indentation Test for Hardness and Materials Parameters—Part 1: Test Method. International Organization for Standardization: Geneva, Switzerland, 2015.
  31. ISO 7438:2020; Metallic Materials—Bend Test. International Organization for Standardization: Geneva, Switzerland, 2020.
  32. Kini, M.K.; Lee, S.; Savan, A.; Breitbach, B.; Addab, Y.; Lu, W.; Ghidelli, M.; Ludwig, A.; Bozzolo, N.; Scheu, C.; et al. Nanocrystalline equiatomic CoCrFeNi alloy thin films: Are they single phase fcc? Surf. Coat. Technol. 2021, 410, 126945. [Google Scholar] [CrossRef]
  33. Qiu, X. Microstructure and mechanical properties of CoCrFeNiMo high-entropy alloy coatings. J. Mater. Res. Technol. 2020, 9, 5127–5133. [Google Scholar] [CrossRef]
  34. Shun, T.T.; Chang, L.Y.; Shiu, M.H. Microstructure and mechanical properties of multiprincipal component CoCrFeNiMox alloys. Mater. Charact. 2012, 70, 63–67. [Google Scholar] [CrossRef]
  35. Fan, R.; Wang, L.; Zhao, L.; Wang, L.; Zhao, S.; Zhang, Y.; Cui, B. Synergistic effect of Nb and Mo alloying on the microstructure and mechanical properties of CoCrFeNi high entropy alloy. Mater. Sci. Eng. A 2022, 829, 142153. [Google Scholar] [CrossRef]
  36. Ast, J.; Ghidelli, M.; Durst, K.; Göken, M.; Sebastiani, M.; Korsunsky, A.M. A review of experimental approaches to fracture toughness evaluation at the micro-scale. Mater. Des. 2019, 173, 107762. [Google Scholar] [CrossRef]
  37. Whang, S.H. Introduction. In Nanostructured Metals and Alloys; Whang, S.H., Ed.; Woodhead Publishing Series in Metals and Surface Engineering; Woodhead Publishing: Cambridge, UK, 2011; pp. xxi–xxxv. ISBN 978-1-84569-670-2. [Google Scholar]
Figure 1. Sample fabrication for analysis.
Metals 13 00854 g001
Figure 2. Metallographic OM images of HEA (a,b) and HEATi (c,d).
Metals 13 00854 g002
Figure 3. XRD patterns of the HEA and HEATi.
Metals 13 00854 g003
Figure 4. Size of crystallites in HEA and HEATi.
Metals 13 00854 g004
Figure 5. SEM image (a) and elemental maps (b) of HEA sample; SEM image (c) and elemental maps (d) of HEATi sample.
Metals 13 00854 g005
Figure 6. Selected points on the HEA surface for EDS analysis.
Metals 13 00854 g006
Figure 7. Selected points on the HEATi surface for EDS analysis.
Metals 13 00854 g007
Figure 8. Vickers hardness testing on (a) HEA sample and (b) HEATi sample, using a load of 1.961 N and a dwell time of 10 s.
Metals 13 00854 g008
Figure 9. Load-displacement diagrams obtained on HEA.
Metals 13 00854 g009
Figure 10. Load-displacement diagrams obtained on HEATi.
Metals 13 00854 g010
Table 1. Chemical composition of as-cast experimental samples HEA and HEATi.
Elementwt%at%
HEAHEATiHEAHEATi
Co20.6720.0921.5221.09
Cr19.9919.0423.5822.67
Fe19.8819.2921.8421.37
Mo20.2022.1012.9814.26
Ni19.2719.2020.1420.24
Ti- 0.28-0.36
Table 2. The HEA sample’s EDS analysis results in weight percentage.
SpectrumCoCrFeMoNi
117.7020.5215.1134.4012.27
217.4319.3516.8833.1213.22
316.5021.0415.2933.1614.01
416.7120.4617.4833.0212.33
516.3922.9716.7431.2412.67
622.3919.3321.5817.6419.06
723.1019.6819.9215.5821.72
822.6819.1019.7817.3721.08
922.7019.8719.4515.9422.03
1022.5217.5218.1520.3021.51
Mean19.8119.9818.0425.1816.99
Standard deviation0.920.430.642.511.32
Table 3. The results in weight percentage of EDS analysis of the alloy HEATi.
SpectrumCoCrFeMoNiTi
117.0517.8414.3037.8712.670.27
215.6318.1713.8039.3513.040.00
316.8019.4113.3037.9212.450.12
414.5420.9615.4637.9210.580.54
516.8319.9415.5133.7913.550.38
621.9316.7819.4719.7221.510.60
720.3620.0023.2018.2617.770.41
820.0017.3719.4325.1618.040.00
921.3014.5321.1319.3023.500.24
1020.714.7321.5724.6218.700.00
Mean18.5117.9717.7229.3916.180.26
Standard deviation0.790.661.092.641.300.07
Table 4. Composition average results in D and ID areas an SR values for HEA and HEATi alloys.
AlloyParametersCoCrFeMoNiTi
HEAD22.6819.1019.7817.3721.08-
ID16.9520.8716.3032.9912.90-
SR1.340.921.210.531.63-
HEATiD20.8616.6820.9621.4119.900.25
ID16.1719.2614.4737.3712.460.26
SR1.290.871.450.571.600.96
Table 5. Microhardness values HV 0.2 and standard deviation for HEA and HEATi.
AlloyHV 0.2
HEA369.20 ± 0.56
HEATi450.90 ± 0.50
Table 6. Modulus of elasticity values of the two samples, HEA and HEATi.
AlloyE (GPa)
HEA173.99 ± 4.25
HEATi177.89 ± 3.70
Disclaimer/Publisher’s Note: The statements, opinions and data contained in all publications are solely those of the individual author(s) and contributor(s) and not of MDPI and/or the editor(s). MDPI and/or the editor(s) disclaim responsibility for any injury to people or property resulting from any ideas, methods, instructions or products referred to in the content.