Article

EIS Study of Doped High-Entropy Alloy

by
Santiago Jose Brito-Garcia
1,
Julia Claudia Mirza-Rosca
1,2,*,
Cristina Jimenez-Marcos
1 and
Ionelia Voiculescu
3
1
Mechanical Engineering Department, University of Las Palmas de Gran Canaria, 3500 Las Palmas de Gran Canaria, Spain
2
Materials Engineering, and Welding Department, Transilvania University of Brasov, 500036 Brasov, Romania
3
Faculty of Industrial Engineering and Robotics, Politehnica University of Bucharest, 060042 Bucharest, Romania
*
Author to whom correspondence should be addressed.
Metals 2023, 13(5), 883; https://doi.org/10.3390/met13050883
Submission received: 27 March 2023 / Revised: 28 April 2023 / Accepted: 29 April 2023 / Published: 2 May 2023

Abstract

:
The promising results obtained in the research of high-entropy alloys are increasingly encouraging new configurations of these alloys. Our research was conducted on the high-entropy CoCrFeMoNi alloy and the Ti-doped CoCrFeMoNi alloy. Electrochemical impedance spectroscopy (EIS) measurements were performed on samples with and without Ti-doped CoCrFeMoNi high-entropy alloys in order to evaluate the influence of voltage on their behavior in a simulated aggressive environment. The impedance spectra were measured between −1.0 and +0.8 V vs. SCE at various potential levels. Using an electrical equivalent circuit to match the experimental data, the impedance spectra were analyzed. The corresponding circuit that successfully fits the spectra has two time constants: the first one is for the attributes of the compact passive layer and the second one is for the features of the porous passive layer. The results show that doping CoCrFeMoNi alloy with 0.36 at.% Ti reduces the alloy’s ability to resist corrosion, as the alloy can react more quickly to the surrounding environment and cause a decrease in the corrosion resistance of the alloy.

1. Introduction

High-entropy alloys (HEAs) are a new class of materials that have received a lot of attention recently due to their special qualities and promising applications in many areas [1,2,3]. HEAs are made up of multiple metallic elements, typically five or more, mixed together in roughly equal proportions. This results in a random atomic arrangement, which gives rise to exceptional properties, such as high strength, high ductility, excellent corrosion resistance, and high-temperature stability.
HEAs have gained widespread interest in the scientific community due to their potential to revolutionize the design of structural materials, particularly in aerospace [4], energy [5,6,7,8], and biomedical industries [9,10,11,12]. Researchers are exploring various aspects of HEAs, including synthesis, characterization, and mechanical behavior, to better understand their fundamental properties and optimize their performance.
In this field of high-entropy alloys, CoCrFeMoNi has been reported to have remarkable mechanical qualities, such as high strength and superior ductility, even at cryogenic temperatures [13]. In particular, the high-temperature strength and ductility of CoCrFeMoNi HEA make it a promising candidate for high-temperature structural applications [14], such as in gas turbines and nuclear reactors, and with Nb and different concentrations of Mo, has improved corrosion resistance of the load-bearing parts of marine equipment [15]. An ion sulfurizing technique was applied to CoCrFeMoNi HEA, and the tribological properties were improved greatly due to the fabrication of lubricant phases during sulfurization [13].
Doping refers to the intentional addition of small amounts of one element to another material in order to modify its properties [16]. When metals are used as dopants, they can have various effects on the material’s properties, depending on the specific metal and the material being doped.
For example, doping metals such as titanium, vanadium, or chromium into steels can improve their mechanical properties, such as strength, ductility, and toughness [17,18,19]. This is because these metals can form strong carbides or nitrides, which act as strengthening agents and can also improve wear and corrosion resistance. Similarly, doping copper into aluminum [20] can improve its electrical conductivity, while doping aluminum into copper [21] can improve its strength and corrosion resistance. Doping with other metals such as magnesium, zinc, or nickel [22,23] can also modify the properties of aluminum alloys, depending on the specific application. Despite the fact that boriding has been studied particularly for steels in several areas, including morphology, thickness, performance, and kinetics, the boronization of HEAs is still in its early stages [24]. After the boronizing technique was used on several types of HEA, its effects on the materials’ mechanical and tribological characteristics were examined. According to reports, boronization increased the surface hardness of high-entropy alloys by more than three times [25,26] and the wear resistance of HEA by twelve times [27]. Overall, Ti doping is a versatile strategy for modifying the properties of various materials [28], and it is an active area of research in many fields. It has been reported that, in coatings, Ti provides high wear and corrosion resistance and a low friction coefficient, depending on the uniformity, hardness, elastic modulus, and coating layer’s thickness [29], thanks to its high hardness, good substrate adhesion, and inert structure [30]. Electrochemical impedance spectroscopy (EIS) is a powerful analytical technique used to study the behavior of electrochemical systems [31,32,33]. It involves the application of a low amplitude alternating current (AC) signal to the system and analyzing the voltage response that results. By controlling the frequency of the AC signal over a range of values, the technique allows the measurement of impedance as a function of frequency.
EIS can provide information about the electrical properties of the system, such as its resistance, capacitance, and inductance, as well as its electrochemical properties, such as the charge transfer resistance, double-layer capacitance, and diffusion coefficient [34]. The technique can also be used to study the kinetics and mechanisms of electrochemical reactions, the adsorption of species on the electrode surface, and the behavior of complex electrochemical systems. Its non-invasive and non-destructive nature, along with its ability to provide information about both the electrical and electrochemical properties of a system, make it a valuable tool for the characterization and understanding of electrochemical systems.
Thus, the purpose of the present study was to evaluate, using EIS, the influence of the potential on the behavior of samples without Ti and with Ti-doped CoCrFeMoNi high-entropy alloys in a simulated aggressive environment. There is no data available about this particular doped high-entropy alloy manufactured using the vacuum arc remelting technique.

2. Materials and Methods

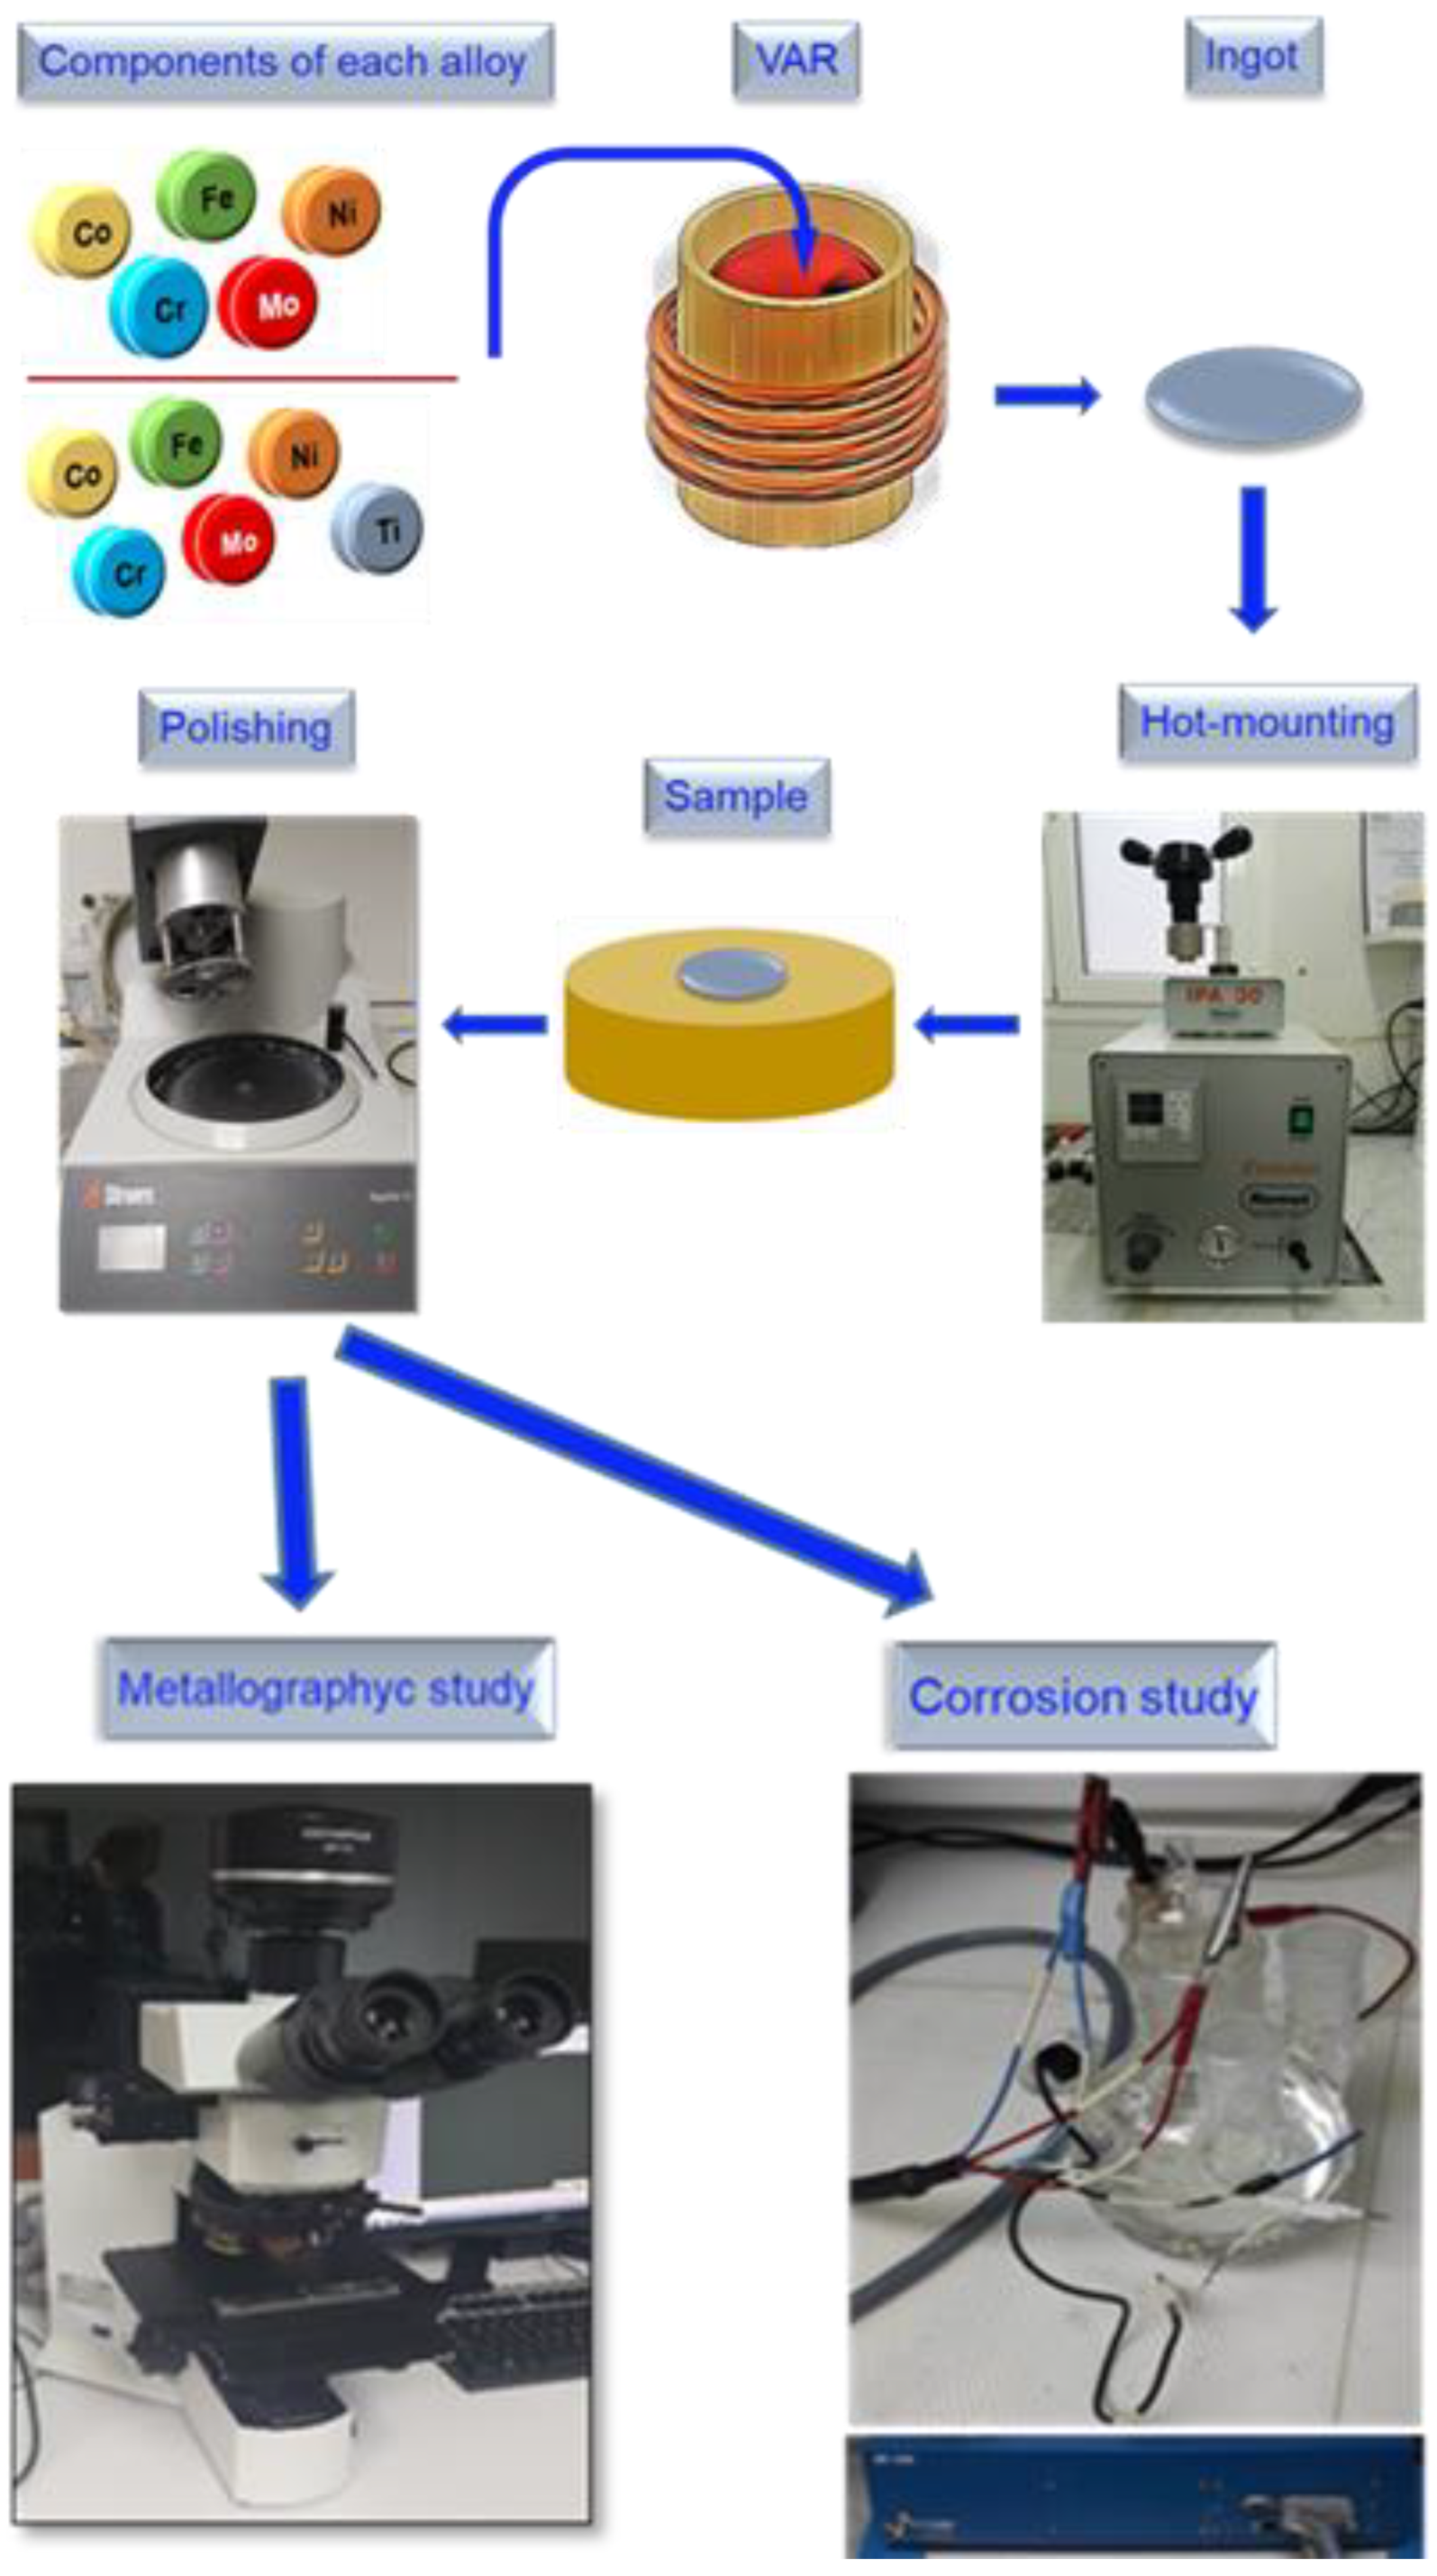
2.1. Sample Preparation

Investigations were conducted on the high-entropy CoCrFeMoNi alloy (HEA) and on the Ti-doped CoCrFeMoNi alloy (HEATi). The samples were obtained by the ERAMET Laboratory at Politehnica University of Bucharest using an MRF ABJ 900 vacuum arc remelting (VAR) system. The laboratory took into account the potential losses from vaporization as well as the anticipated degree of chemical element incorporation during melting in order to design the metallic charge.
For Co, Cr, Fe, Mo, Ni, and Ti, high-purity raw materials with purity values of at least 99.7% were used. To attain sufficient homogeneity, the obtained alloys underwent 8 cycles of flipping and remelting in VAR equipment (4 times for each part).
The elemental information of the HEA and doped HEA was determined using energy dispersive X-ray analysis (EDS) using a Fei XL30 ESEM (MTM, Leuven, Belgium) scanning electron microscope equipped with EDAX Sapphire detector. The atomic composition (at%) of the HEA is Co (21.52), Cr (23.58), Fe (21.84), Mo (12.98), and Ni (20.14); for the HEATi, it is Co (21.09), Cr (22.67), Fe (21.37), Mo (14.26), Ni (20.24), and Ti (0.36).
The resulting ingots, which were transversally cut for additional analysis, were rods about 10 centimeters long and 1 cm in diameter. The samples experienced a three-stage surface processing procedure in order to conduct assessments of structure, composition, and electrochemistry. They were first embedded in a cylinder made of phenolic resin (see Figure 1 hot-mounting step) and after that, polished with SiC abrasive papers with progressively finer grain sizes varying from 240 to 2000 grit. Immediately after, following a final polish with 0.1 m alpha alumina paste, they were washed with ultrasonic deionized water [35]. All the steps of the sample´s preparation and the posterior tests are presented in Figure 1.

2.2. Microstructural Characterization

An investigation was conducted on the microstructure of high-entropy alloys utilizing optical microscopy. To examine the surface of the samples, they were immersed in a 10% oxalic acid solution and subjected to a 5 V current for 5 to 25 s via electrochemical etching. The OLYMPUS PME 3 microscope (Olympus Corp., Tokyo, Japan) was used for optical observations of the etched surface. To investigate the microstructure and the segregation of chemical constituents of the samples, an energy-dispersive X-ray electron probe analyzer EDAX Sapphire (Ametek, Berwyn, PA, USA) was connected to an environmental scanning electron microscope (ESEM) type Fei XL30 ESEM outfitted with a LaB6 cathode (STS, North Billerica, MA, USA).

2.3. Electrochemical Measurements

2.3.1. Electrodes and Electrolyte

For all electrochemical measurements, a conventional electrochemical cell consisting of three electrodes, namely a working electrode, a reference electrode, and a counter electrode, was employed. The working electrode is formed by the alloy where the electrochemical reaction of interest takes place and is made of the material being studied (sample 1 and sample 2). The reference electrode is used as a reference point to measure the potential of the working electrode. It is a stable electrode with a well-known potential, a saturated calomel electrode (SCE). The counter electrode is an inert electrode that completes the circuit and balances the flow of electrons. It is made of a material that does not participate in the electrochemical reaction, in our case, platinum. During the electrochemical reaction, the electrolyte solution serves as the medium for the flow of current from the working electrode to the counter electrode. The potential difference between the working electrode and the reference electrode is measured to determine the electrochemical properties of the system. The three-electrode setup allows for precise measurements of the electrochemical behavior of the system, while the reference electrode ensures accurate potential measurements. To simulate the seawater environment, 3.5% NaCl solution was used.

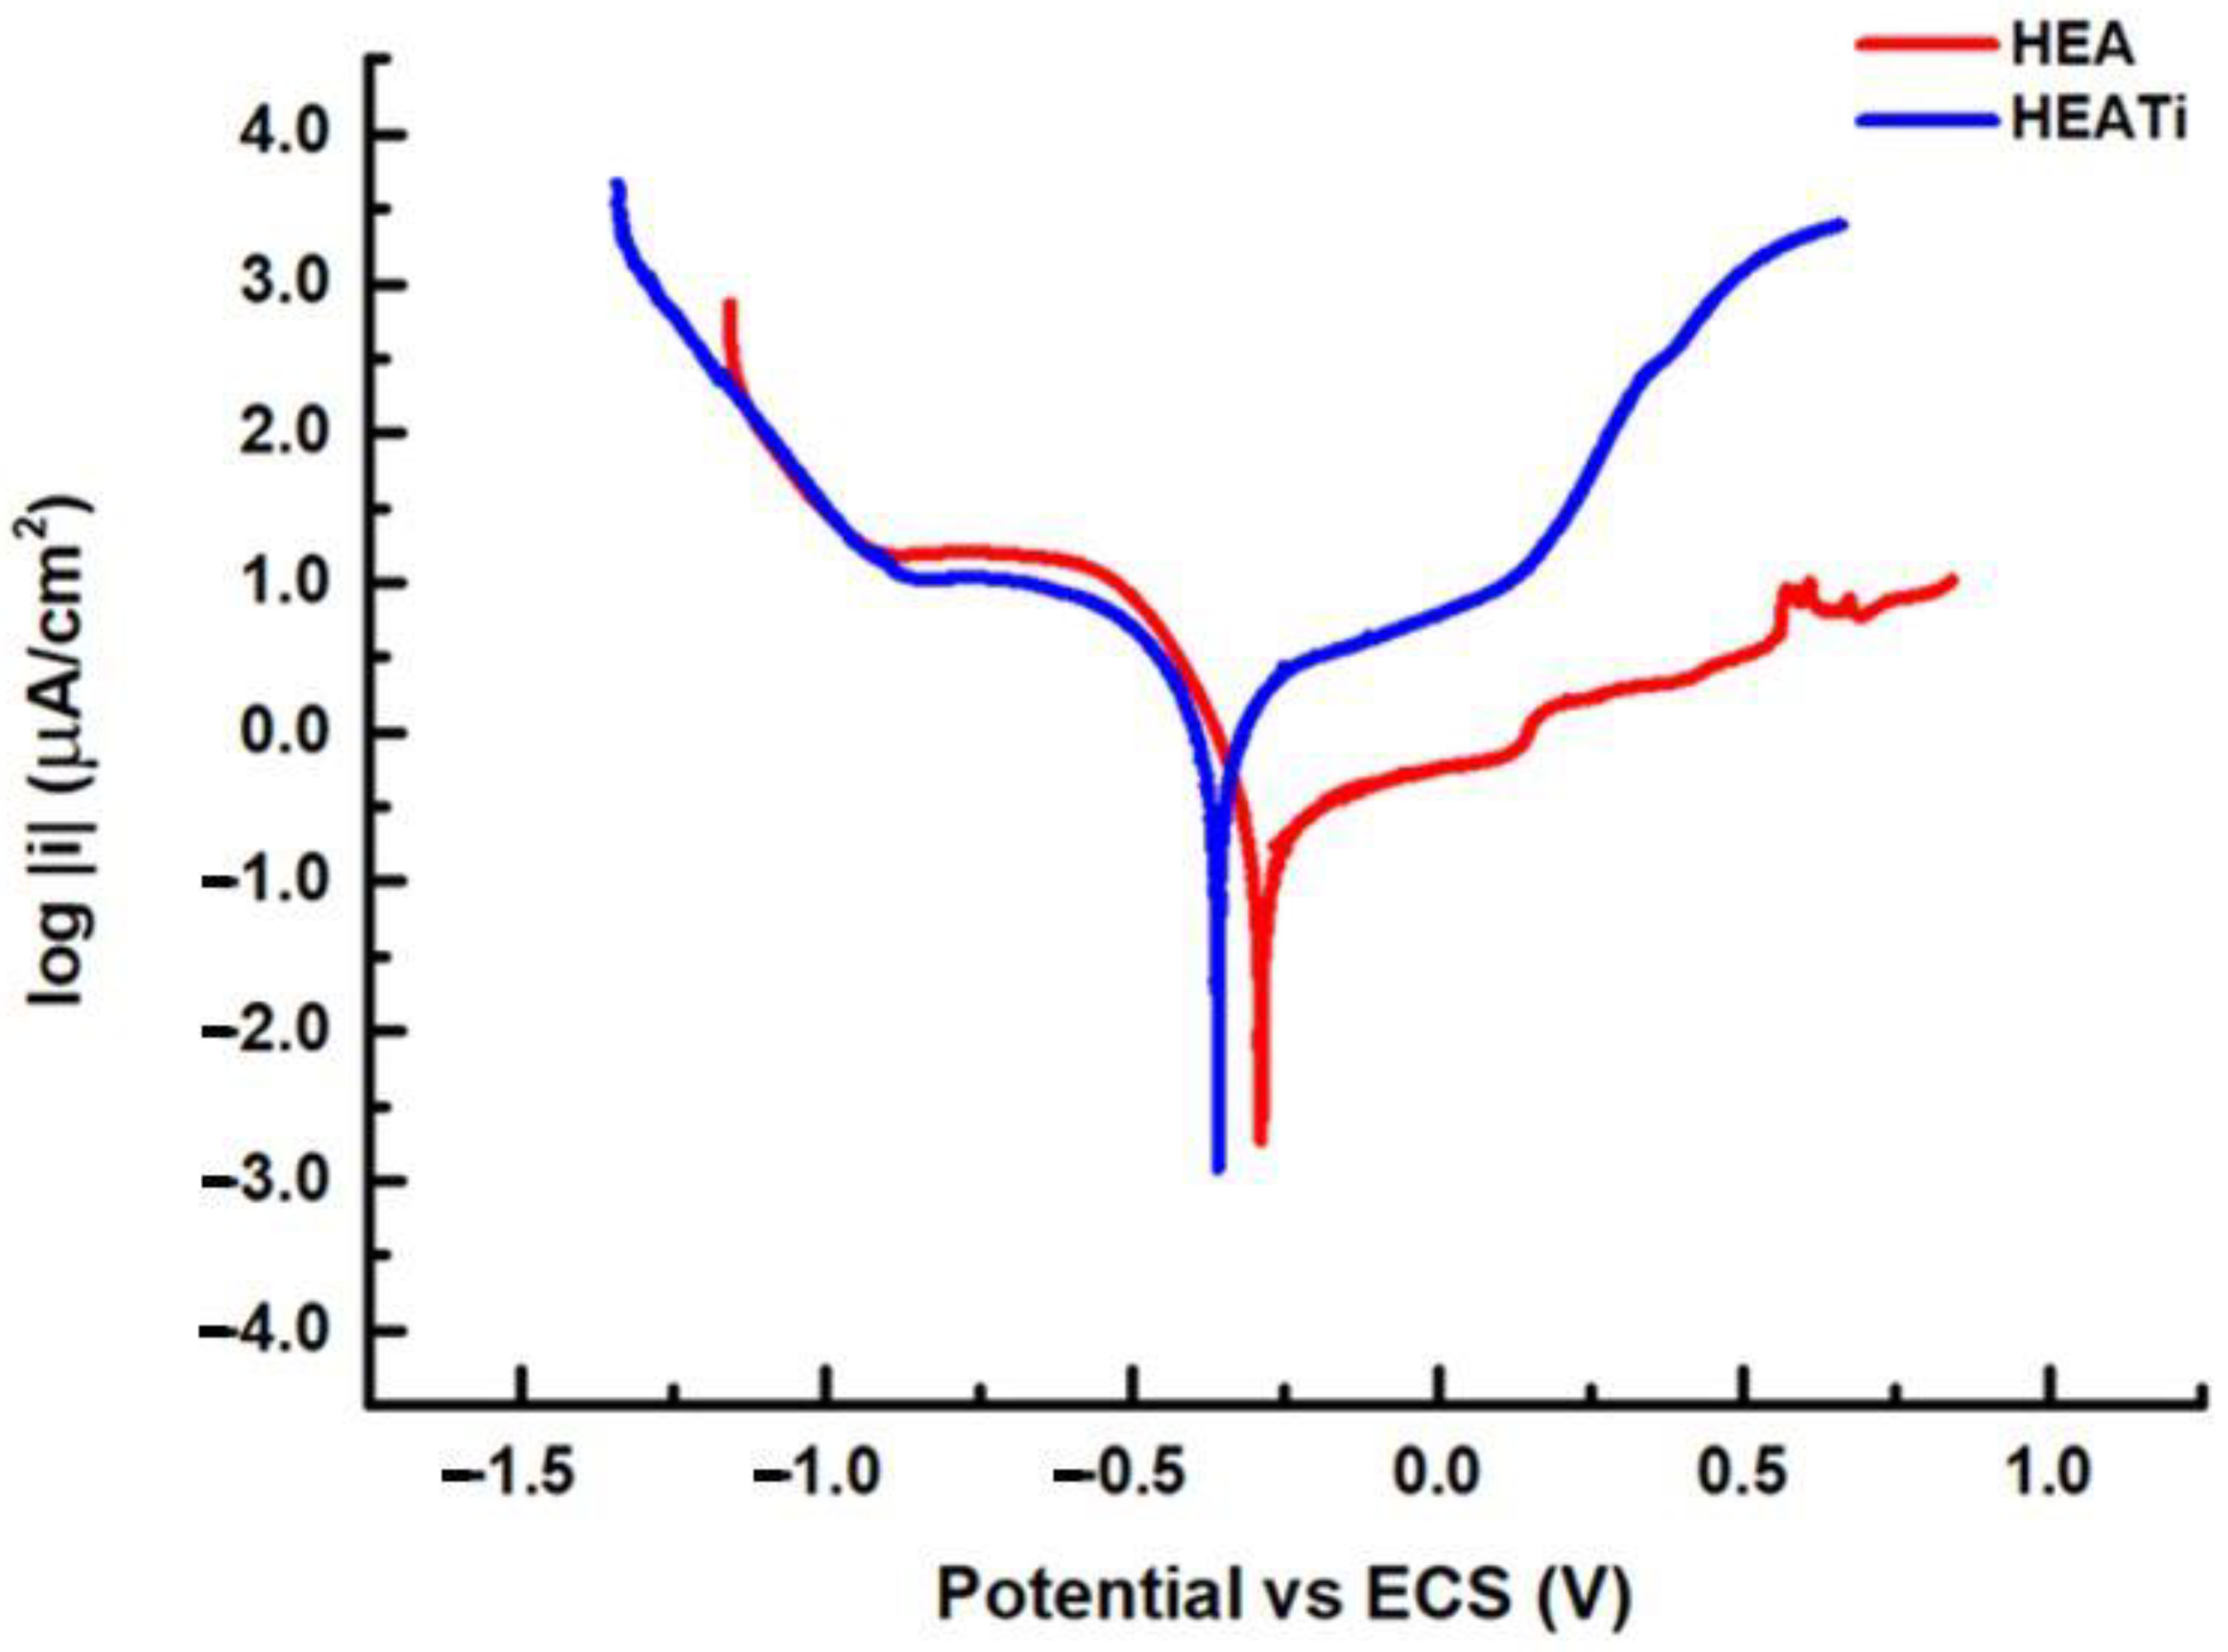
2.3.2. Potentiodynamic Polarization

Potentiodynamic polarization is a technique used to study the corrosion behavior of a material. In this technique, the potential of the sample is varied over a range of values (starting at −1.5 V till +0.8 V vs. SCE) following the ASTM standard [36] while the current passing through the electrode is monitored. By plotting the resulting current as a function of the electrode potential, a polarization curve can be generated. Potentiodynamic polarization (PD) was performed with a scan rate of approx. 300 µV / 1807.2 ms [37].

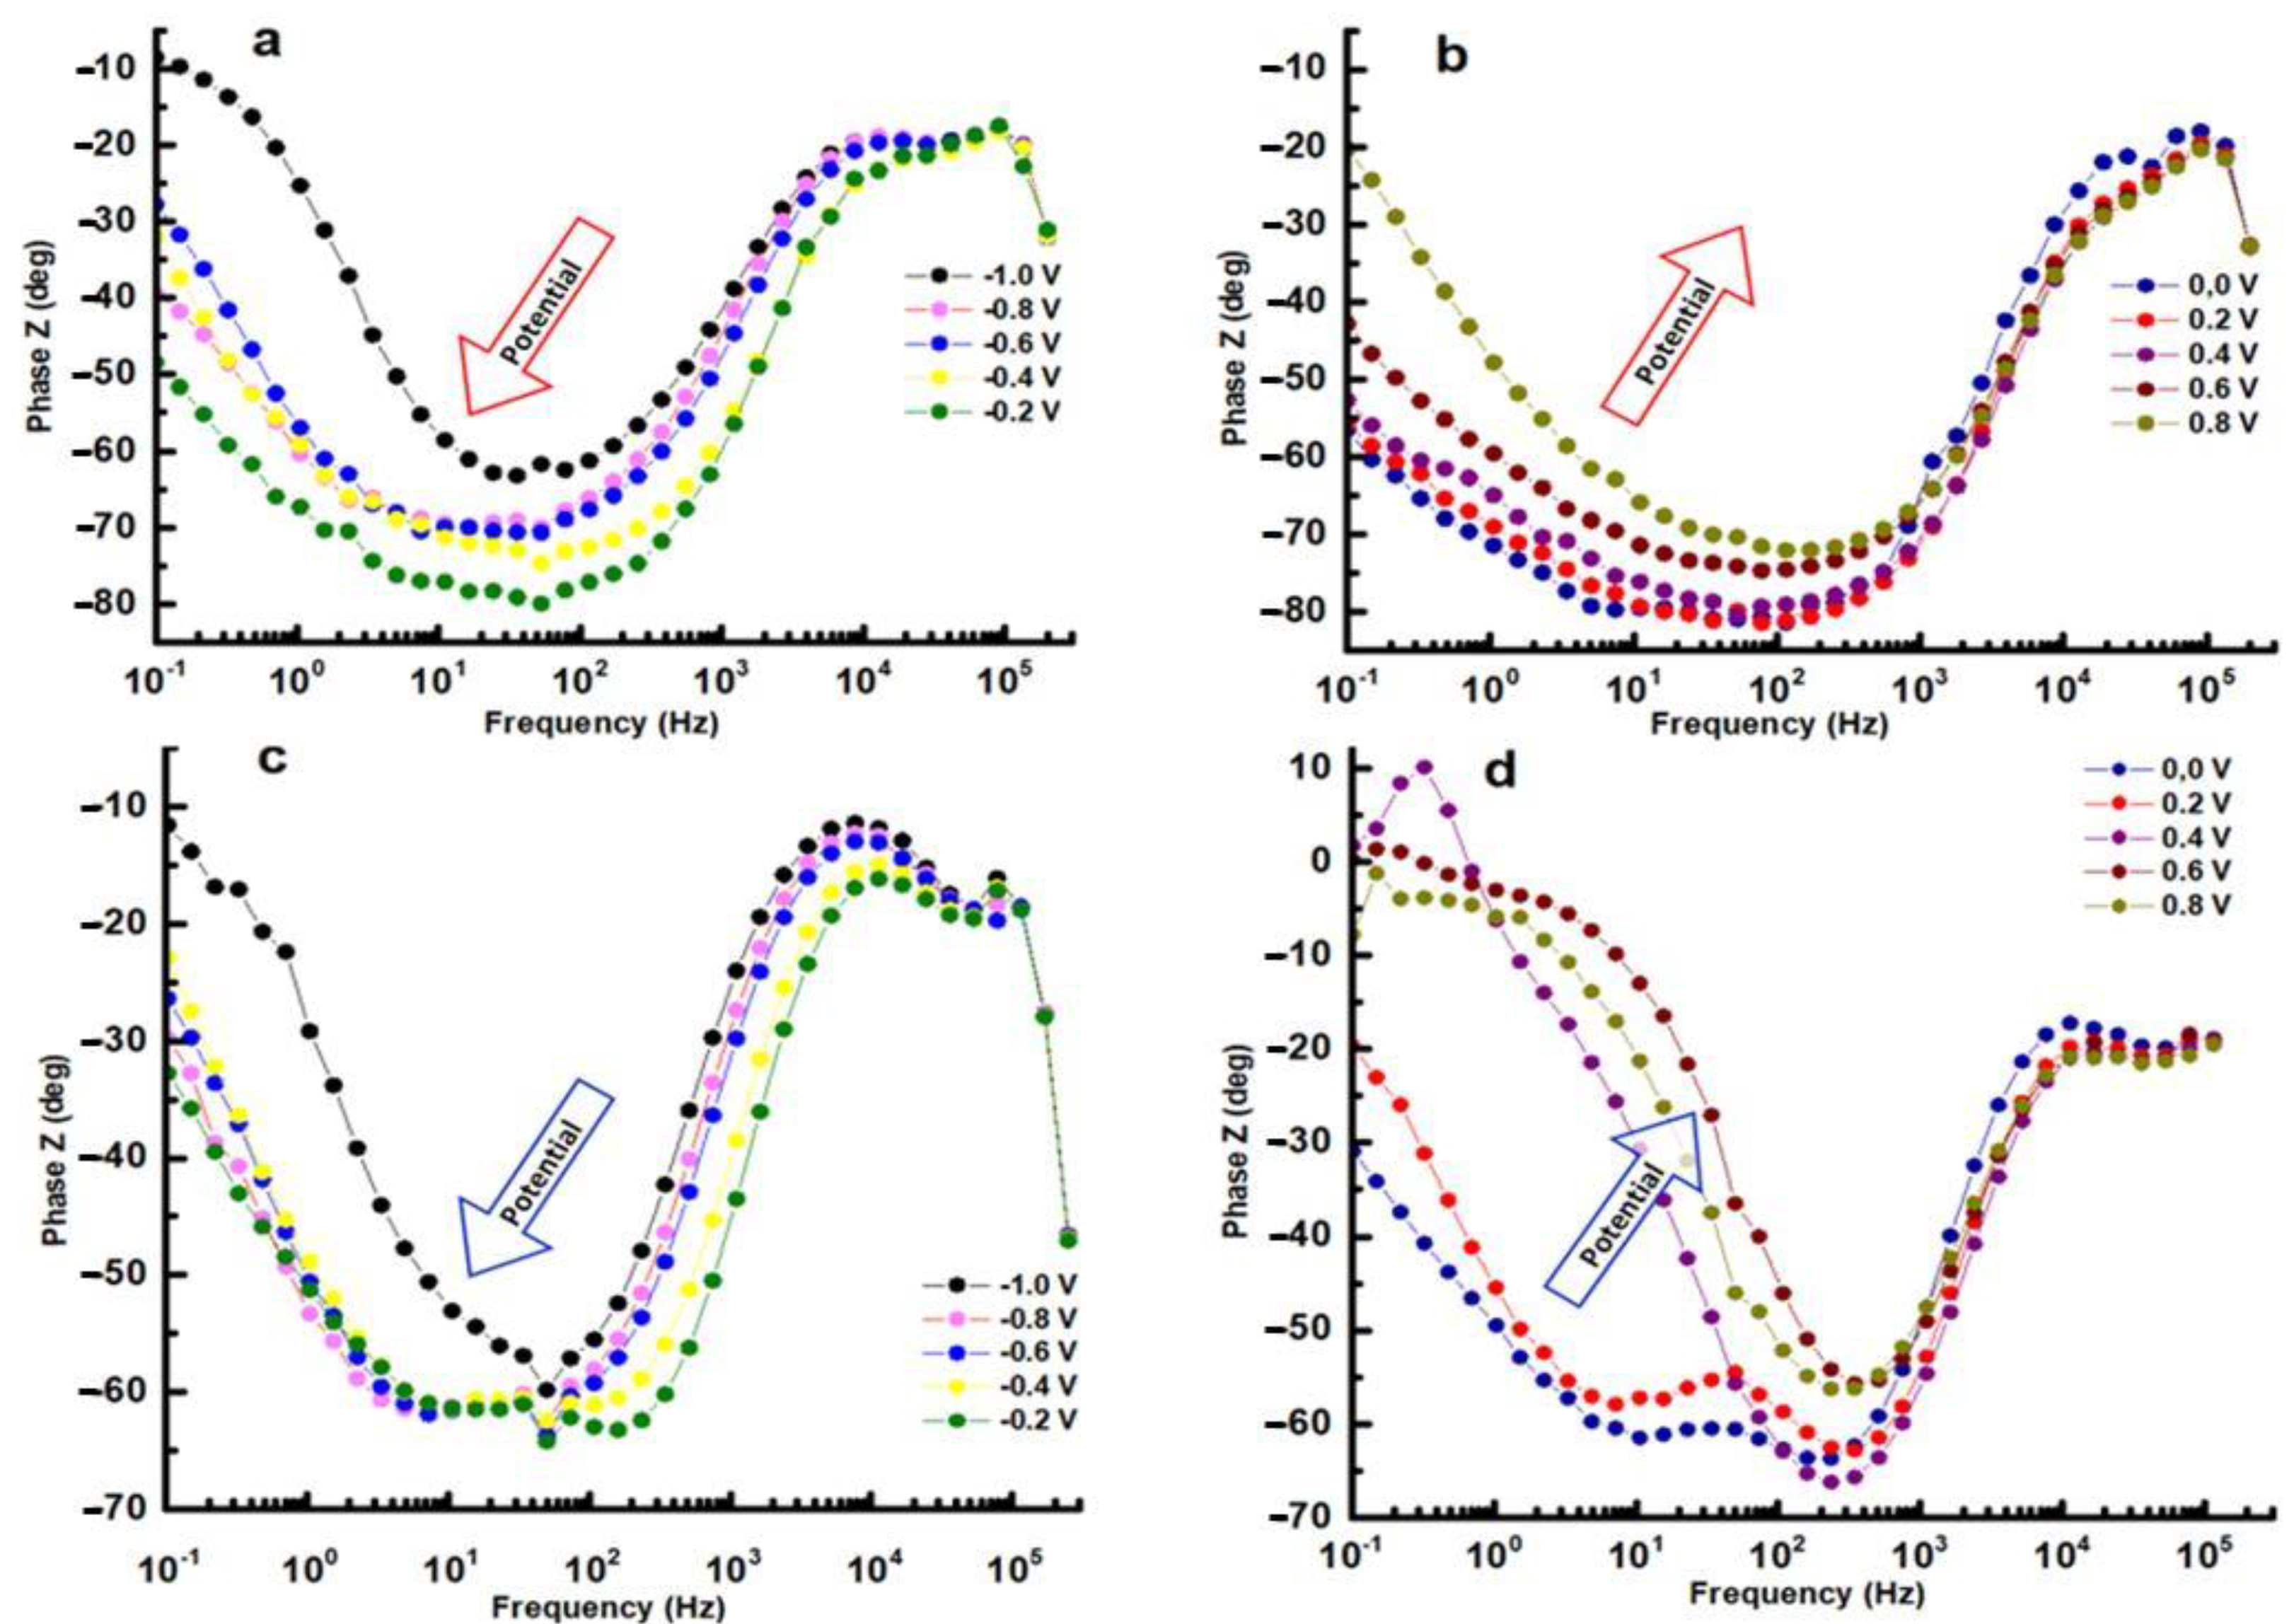
2.3.3. Potentiostatic Electrochemical Impedance Spectroscopy (PEIS)

The PEIS experiment performed impedance tests into potentiostatic configuration in employing a sinusoidal round a potential E that was adjusted to a constant value (from −1.0 V to +0.8 V with a step of 200 mV). The potential was set to the fixed value for 30 min to wait for cell current stabilization [38], and during this period, no impedance measurements were undertaken. At each potential value, a scan from 100 kHz to 100 mHz with 6 points per decade was performed with a peak-to-peak amplitude of 10 mV.

3. Results and Discussions

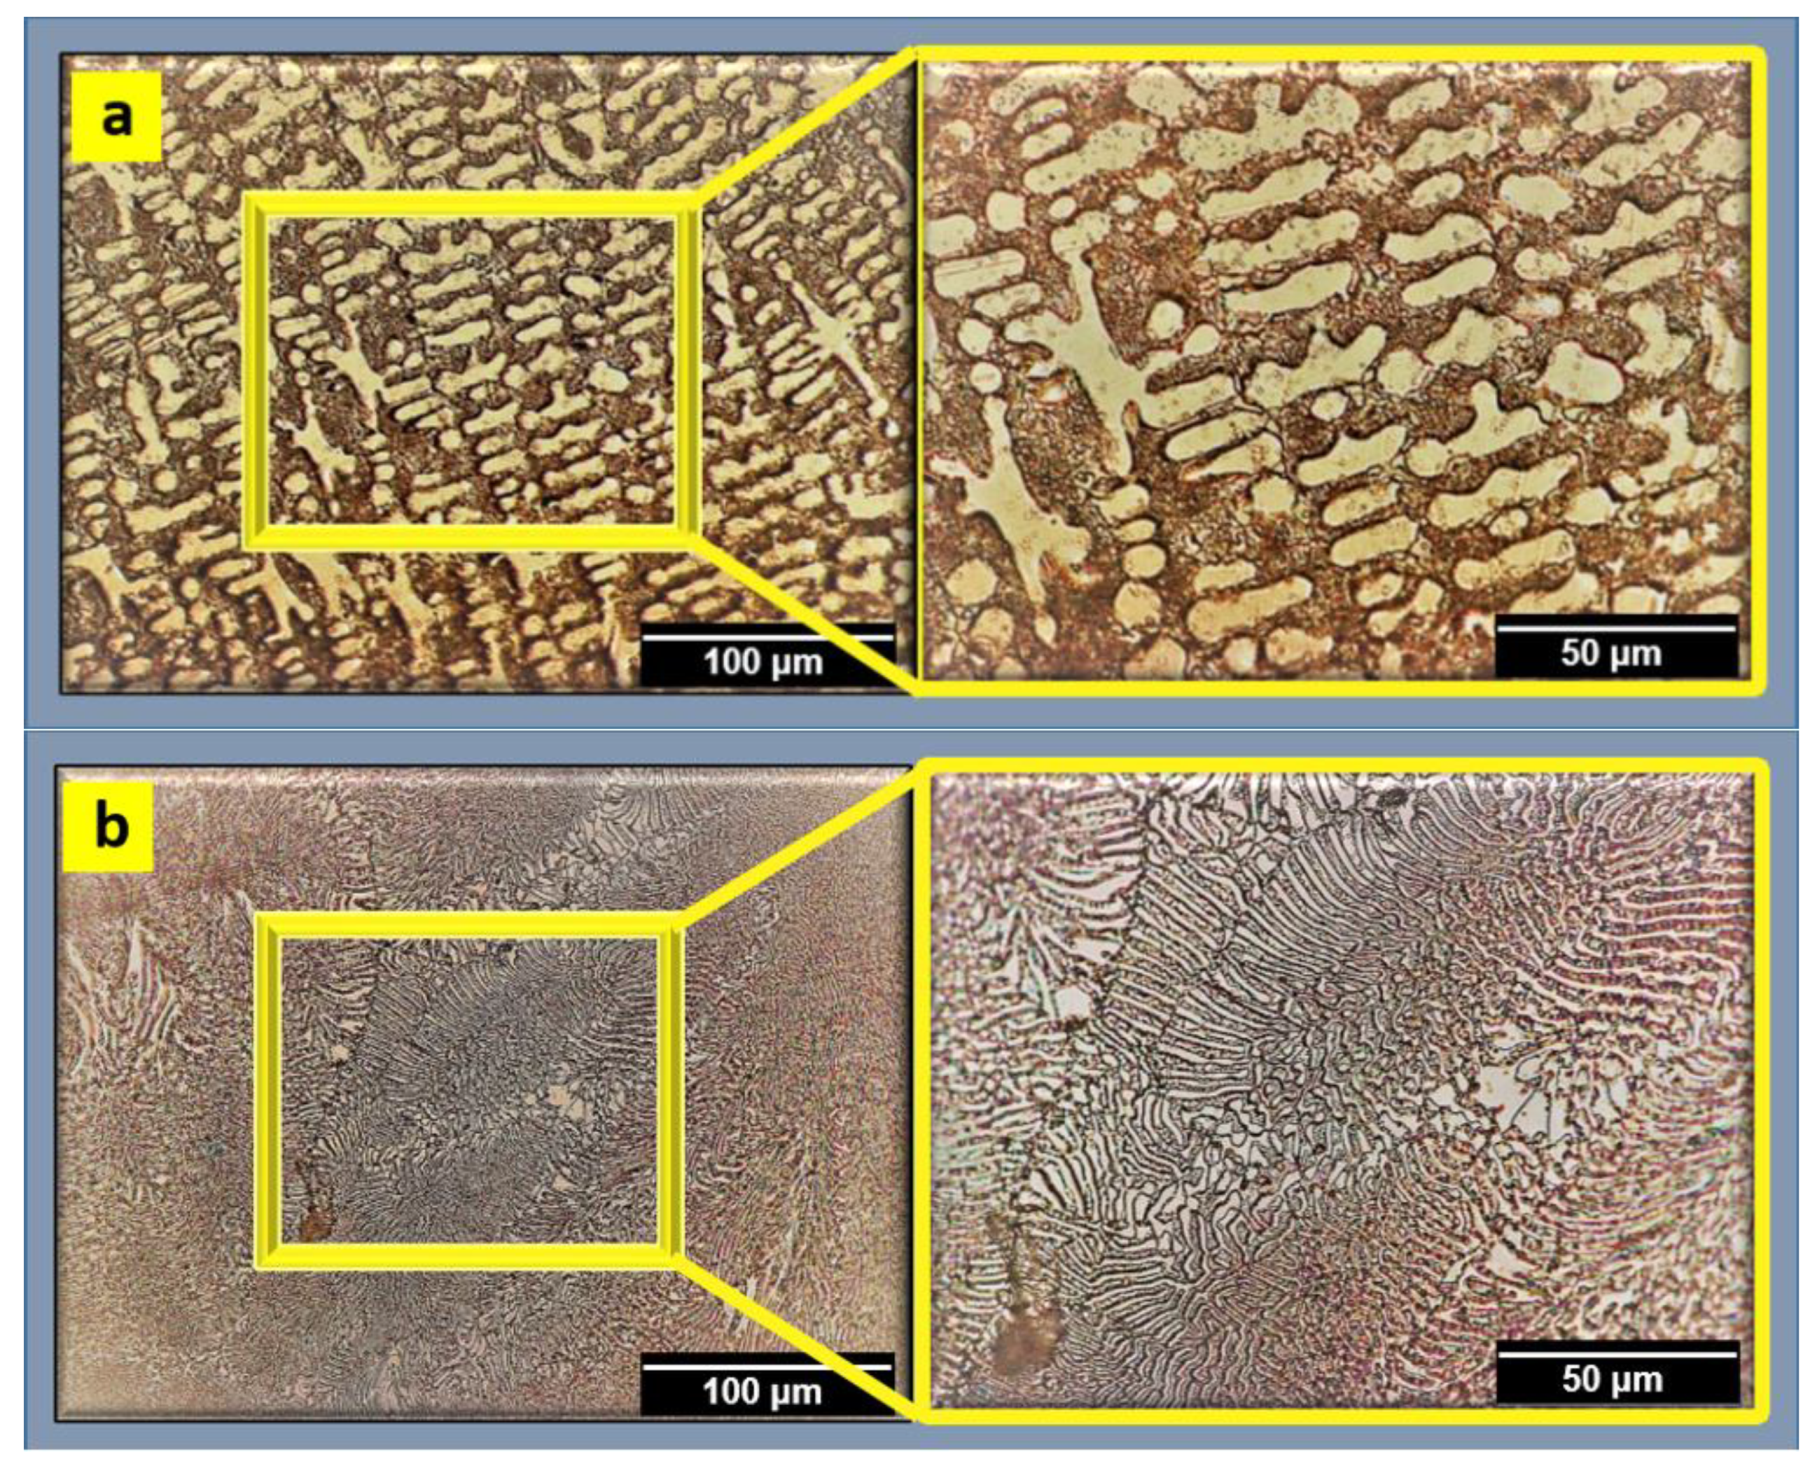
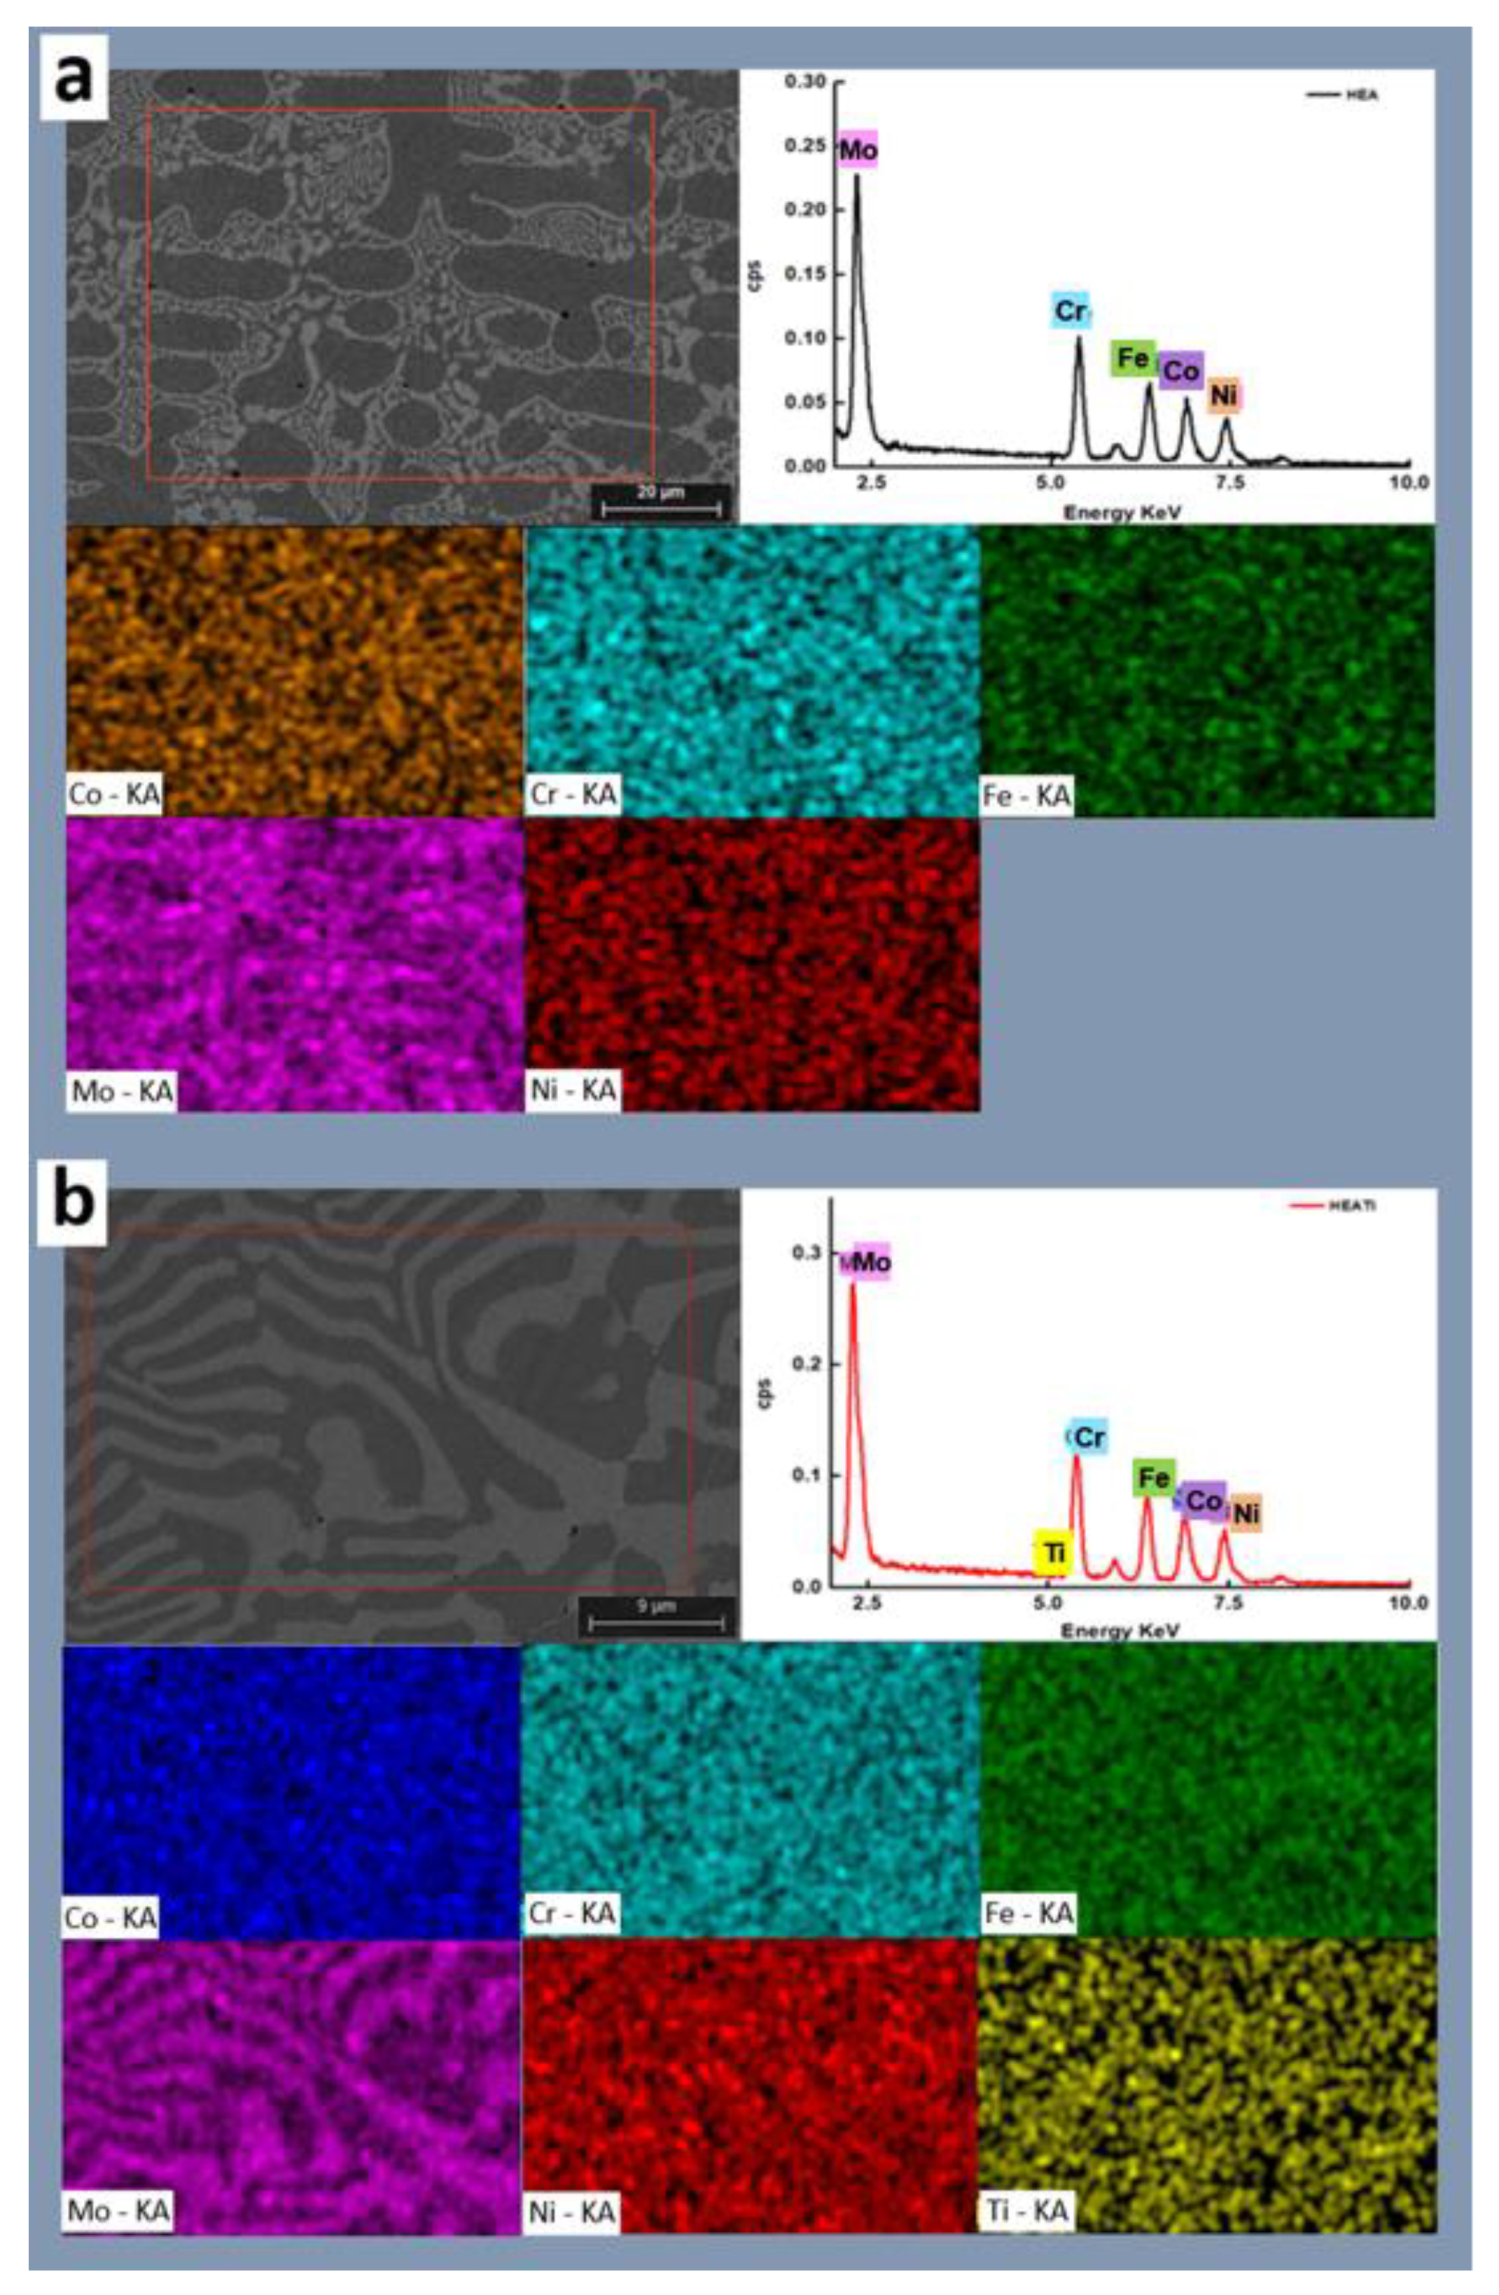
3.1. Microstructural Characterization

Optical images of the microstructure can be seen in Figure 2 for both analyzed alloys. These images show a dense microstructure that is free of cracks. In both alloys, the microstructure is dendritic, but the HEATi exhibited a tendency towards grain refinement.
The SEM images of the samples with the corresponding maps and spectra are presented in Figure 3. It can be observed that the influence of iron increased as Ti doping was applied, and Ti showed a distinct difference in the two regions. The segregation ratios of cobalt, iron, and molybdenum all increased, but the segregation ratio of nickel decreased. This suggests that these elements precipitated less or generated fewer intermetallic complexes. Chromium’s segregation ratio remained basically unaltered. It may be claimed that Ti doping increased the solubility limit of the solid phase for molybdenum and titanium while decreasing it for nickel, cobalt, and iron. Chromium remained mostly unaffected.

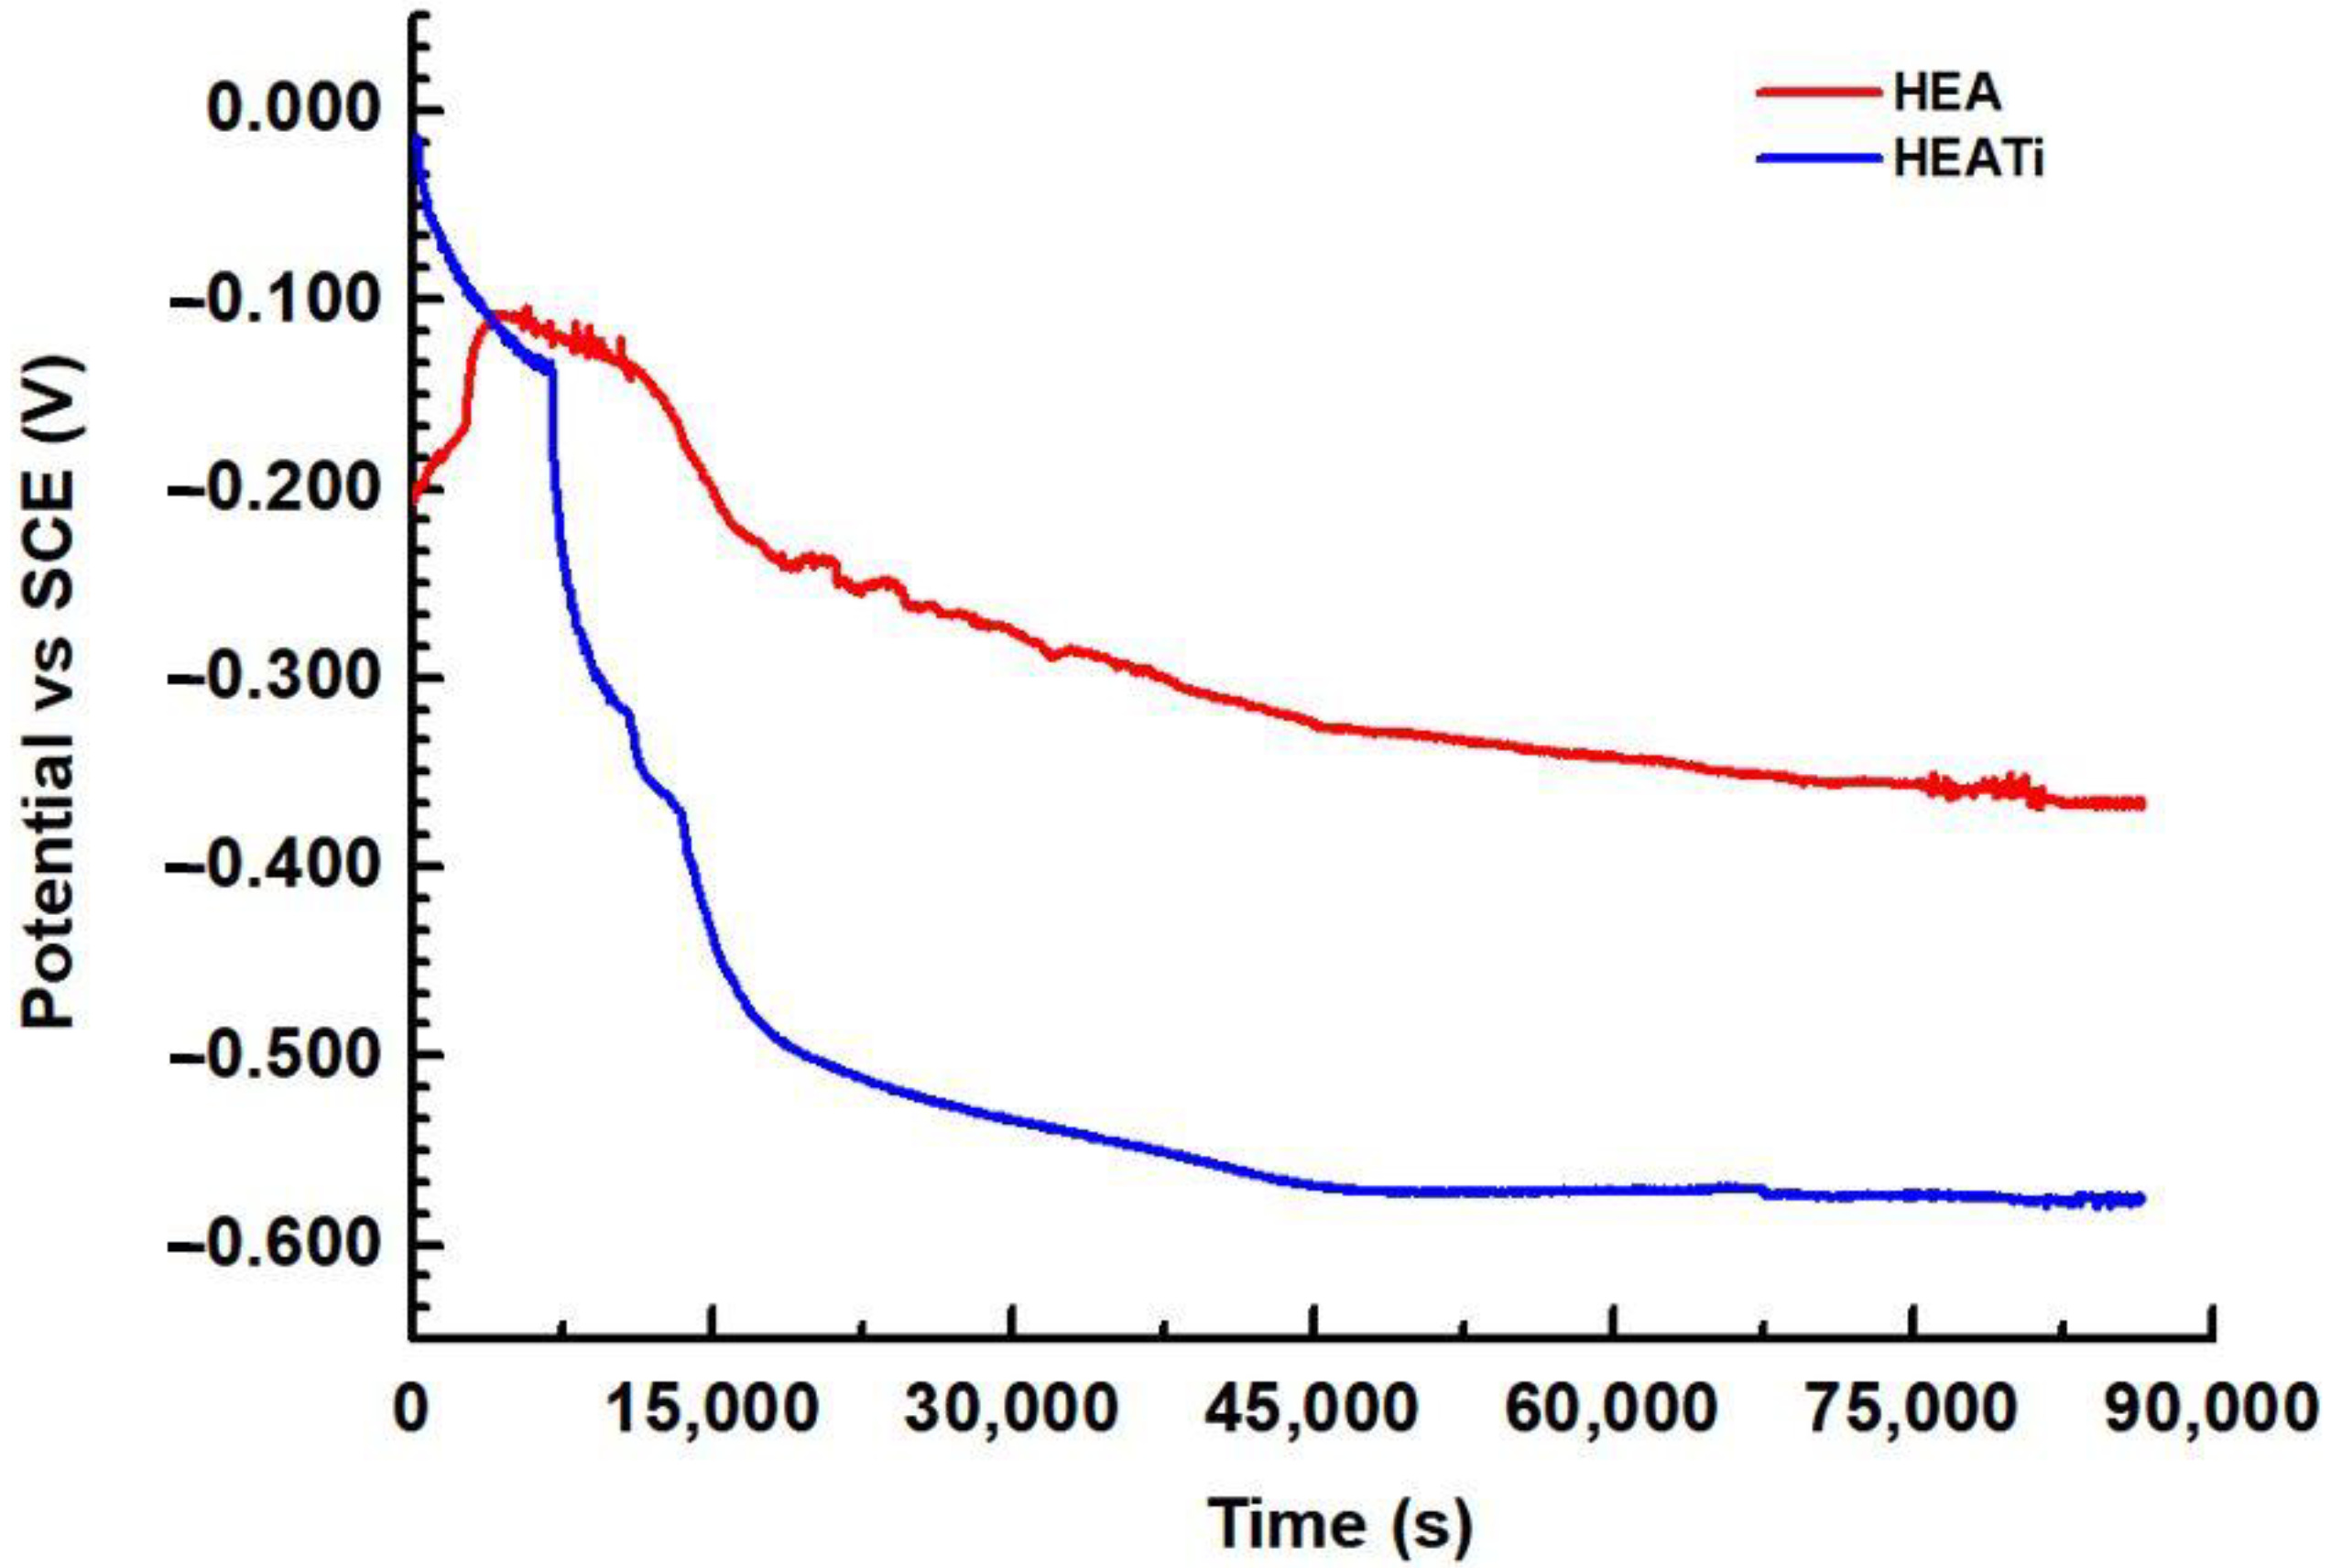
3.2. Electrochemical Measurements

The open circuit potential (OCP) is the potential difference between a metal electrode and a reference electrode when there is no current flowing between them. This potential is affected by the chemical environment surrounding the metal and can change over time as the metal corrodes. By measuring the OCP over time, the OCP diagram is obtained, which shows how the potential changes as a function of time. In a corrosive environment, the OCP of a metal can be affected by a number of factors, including the concentration of dissolved oxygen, pH, and the presence of corrosive ions. The OCP diagrams of the HEA and HEATi are presented in Figure 4.
It can be observed that for both samples the potential fluctuates and decreases over time; this suggests that the samples are susceptible to corrosion, and a corrosion product layer is formed on the surface. After about 12 h, the OCP diagram shows a stable potential over time, and this indicates that the alloys are not actively corroding and are, therefore, relatively resistant to corrosion in these conditions.
The shape of the polarization curve can provide important information about the electrochemical behavior of the metal. Figure 5 presents the polarization curves for the HEA and HEATi samples. The fit of the curves is based on the Stern and Geary equation, which states that the difference between the applied potential and the open circuit potential immediately correlates with the logarithm of the current measured during an electrochemical reaction [39]. The default positions for the fit are ± 20 mV and ± 250 mV around potential at zero current. Through these curves, the Tafel slopes were determined, being βa = 775.9 mV/decade and βc = 119 mV/decade for the HEA and βa = 746.2 mV/decade and βc = 338.7 mV/decade.
The Tafel slopes are used to calculate the Tafel constant B:
B = β a β c 2.303 ( β a + β c )
The corrosion rate is determined using the corresponding weight, density, and surface area.
The following equation is used to determine the corrosion rate (CR) [37]:
C R = I c o r r K E w ρ A
The corrosion current is denoted as Icorr and is measured in amperes (A). The constant K is used to determine the units of the corrosion rate. The equivalent weight (EW) is measured in grams per equivalent, and the density (d) is measured in grams per cubic centimeter (g/cm3). The sample area (A) is measured in square centimeters (cm2).
The HEA sample has a corrosion rate of 2.38 × 10⁻³ mmpy, while for the HEATi, the corrosion rate is 21.70 × 10⁻³ mmpy, almost 10 times more. Similar results were obtained when the CoCrFeNiMo high-entropy alloy was doped with 0.48 at.% Zr [40], and it was reported that this doping produced grain refinement and increased the hardness but did not increase the modulus of elasticity or corrosion resistance of the CoCrFeNiMo high-entropy alloy.
The surface of the samples HEA and HEATi were examined using SEM/EDS methods after 24 h of immersion in a 3.5% NaCl corrosive solution. For each sample, EDS analysis was performed both on the dendrites and inter-dendritic areas.
The microstructure of sample LAS 1 (see Figure 6a) is composed of dendrites (Cr-, Co-, Fe-, and Ni-rich), surrounded by inter-dendritic zones (Mo-rich, 19.50 - 15.56 at% Mo). Measuring spots 1 to 4 are located on the dendrites, while spots 5 to 8 are located on the inter-dendritic areas. As a result of EDS analysis (see Figure 6b), small quantities of Na and Cl were observed on the sample’s surface. The maximum quantity of Cl was measured only on the dendritic areas (0.05–0.14 at% Cl), while Na was present mainly on the inter-dendritic areas (0.28–0.73 at% Na).
In the SEM observations and EDS measurements of the HEATi samples (see Figure 7), Ti also appears in the chemical composition of the alloy, and in this case, the areas rich in Mo are the inter-dendritic ones (12.92–13.76 at% Mo). The CI concentration was maximal on these areas (0.13–0.15 at% Cl), while the maximal Na concentration (0.90 at%) was measured on an inter-dendritic zone.
The XPS results [41] suggest that the passive film mainly consists of Cr2O3 and MoO3, according to the reactions [42]:
2 C r + 3 H 2 O   C r 2 O 3 + 6 H + + 6 e
M o + 3 H 2 O   M o O 3 + 6 H + + 6 e
The impedance data were utilized to assess the behavior of the samples. When examining the Nyquist plots, it becomes evident that all samples exhibit three distinct regions. The first region corresponds to an area of low impedances at high frequencies, while the second region corresponds to an area of medium impedances with a ratio greater than that of the high-frequency region. Finally, the third region consists of a line of high impedances at low frequencies. This pattern clearly indicates that at least two frequency-dependent processes with different time constants are contributing to the feedback.
In the Nyquist plot of the HEATi (see Figure 8d), an inductive behavior can be observed at 400 mV. Inductance is a property of electrical circuits that describes the ability of a circuit to store energy in a magnetic field when an electric current flows through it. In electrochemical impedance spectroscopy (EIS), inductance is one of the three main components of impedance, along with resistance and capacitance.
In EIS measurements, inductance can have a significant effect on the data obtained. Inductance causes a phase shift between the applied AC voltage and the resulting AC, which can be observed in the phase angle of the impedance data. The magnitude of the inductance is also reflected in the frequency dependence of the impedance, with higher inductance leading to a greater deviation from the ideal behavior of a purely resistive or capacitive system. The Bode phase plot exhibits phase displacement in relation to frequency for distinct potentials versus the reference electrode. The presence of a solitary phase shift peak within the range of potentials between −1.0 V and −0.2 V suggests that any time constants tied to the corrosion process must be relatively close in frequency. As the potential increases, the maximum phase shifts systematically to lower frequencies. This change is a sign of increased polarization resistance and can take place without any shift in interfacial capacitance (see Figure 9a,c). It can be observed from the curves at 0.4 V, 0.6 V, and 0.8 V of the HEATi (see Figure 9d) that phase Z changes sharply in the low-frequency region, which means that the sample undergoes pitting corrosion (as can also be observed in Figure 5 when the potential exceeds about 0.25 V). The reason for pitting corrosion in the HEATi alloy can be explained by the preferential dissolution of iron ions into the electrolyte due to the increase in the Fe segregation ratio when the high-entropy alloy was doped with Ti. Due to the low stability of iron species compared to Cr, Mo, Ni, and Co substances, previous investigations [43,44] on stainless steels demonstrated that Fe was primarily prone to selective dissolution.
In the Bode–IZI plots (refer to Figure 10), the impedance spectra for both samples display overlapping curves at high and mid frequencies. There is a notable decline between −0.2 and 0.0 V that persists throughout the duration of the experiment, with the film resistance being reduced by over 10 times for all samples. Within the potential range of 0.0 V to 0.8 V, the phase data demonstrate the emergence of a second, low-frequency phase peak. It is clear from this that the spectrum can be resolved into two nearly identical time constants, suggesting the presence of a two-step mechanism of the electrochemical reaction which occurs at the interface of the electrolyte/alloy.
The impedance of the low-frequency flat surface is related to the intrinsic characteristics of the film in the Bode–IZI graphs (see Figure 10). This low-frequency zone signifies the total resistance of the passive film, charge transfer resistance, and electrolyte resistance. Given that the last two resistances remain relatively constant for the same sample, any modifications in the low-frequency region can be attributed to alterations in the film, potentially resulting from the conductive pathways through it. The rise in low-frequency impedance with potential indicates a greater corrosion resistance of the layer formed on the HEA surface, with the HEA sample at 0.2 V displaying the highest corrosion resistance.
In Figure 8b and d, it can be observed that from 0.2 V to 0.8 V, a diffusion-controlled process becomes a significant component of total impedance. These findings indicate an ionic conductivity-controlled diffusion process for corrosion [45], with the transfer resistance dominating film resistance. The pore-filling process in the external layer may be the cause of this inconsistent behavior.
The selection of an appropriate equivalent circuit is critical for accurately fitting and interpreting EIS data. The equivalent circuit should be physically meaningful and relevant to the electrochemical system being studied, and it should be as simple as possible while still capturing the important features of the system because adding too many circuit elements can lead to overfitting, which can result in poor model predictions and difficulty in interpreting the fitted parameters. It should provide a good fit to the experimental data, and this can be evaluated by calculating the root mean square error.
The equivalent circuit that shows an appropriate balance between physical relevance and simplicity is represented in Figure 11 and was used to model the corrosion process parameters based on the impedance spectra visual data [46]. To compare the EIS data at all potentials, we did not use the inductance in the circuit because with inductance, only for one area of data (at 0.4V for the HEATi), the fit was better, with all the rest of the data being a good fit with the circuit from Figure 11.
The impedance spectra were analyzed using ZSimpWin 3.6 software (Informer Technologies, Los Angeles, CA, USA), and the quality of the fit was evaluated by comparing the experimental data with the simulated data and calculating the chi-square value. A value of chi-square around 10−5 signifies a highly accurate fit with a minimal number of components [47]. All elements in the equivalent circuit were consistent with the data. As the diffusion stage became increasingly important at potentials higher than −200 mV, a better fit was obtained employing an equivalent electrical circuit with two time constants, known as R(C(R(CR)). This circuit takes into consideration the properties of both the interior, compact layer (R2 is the charge transfer resistance, and C2 is the double layer capacitance) and the exterior, porous, passive layer (characterized by the resistance R1 and associated capacitance C1). A capacitor was used instead of a constant phase element in fitting [48] due to the homogeneous interface between the high-entropy alloy and the electrolyte.
For this circuit, the equivalent impedance is:
Z eq = R e + 1 j   w   C 1 + 1 R 1 + 1 1 R   2 + j   w   C     2
considering:
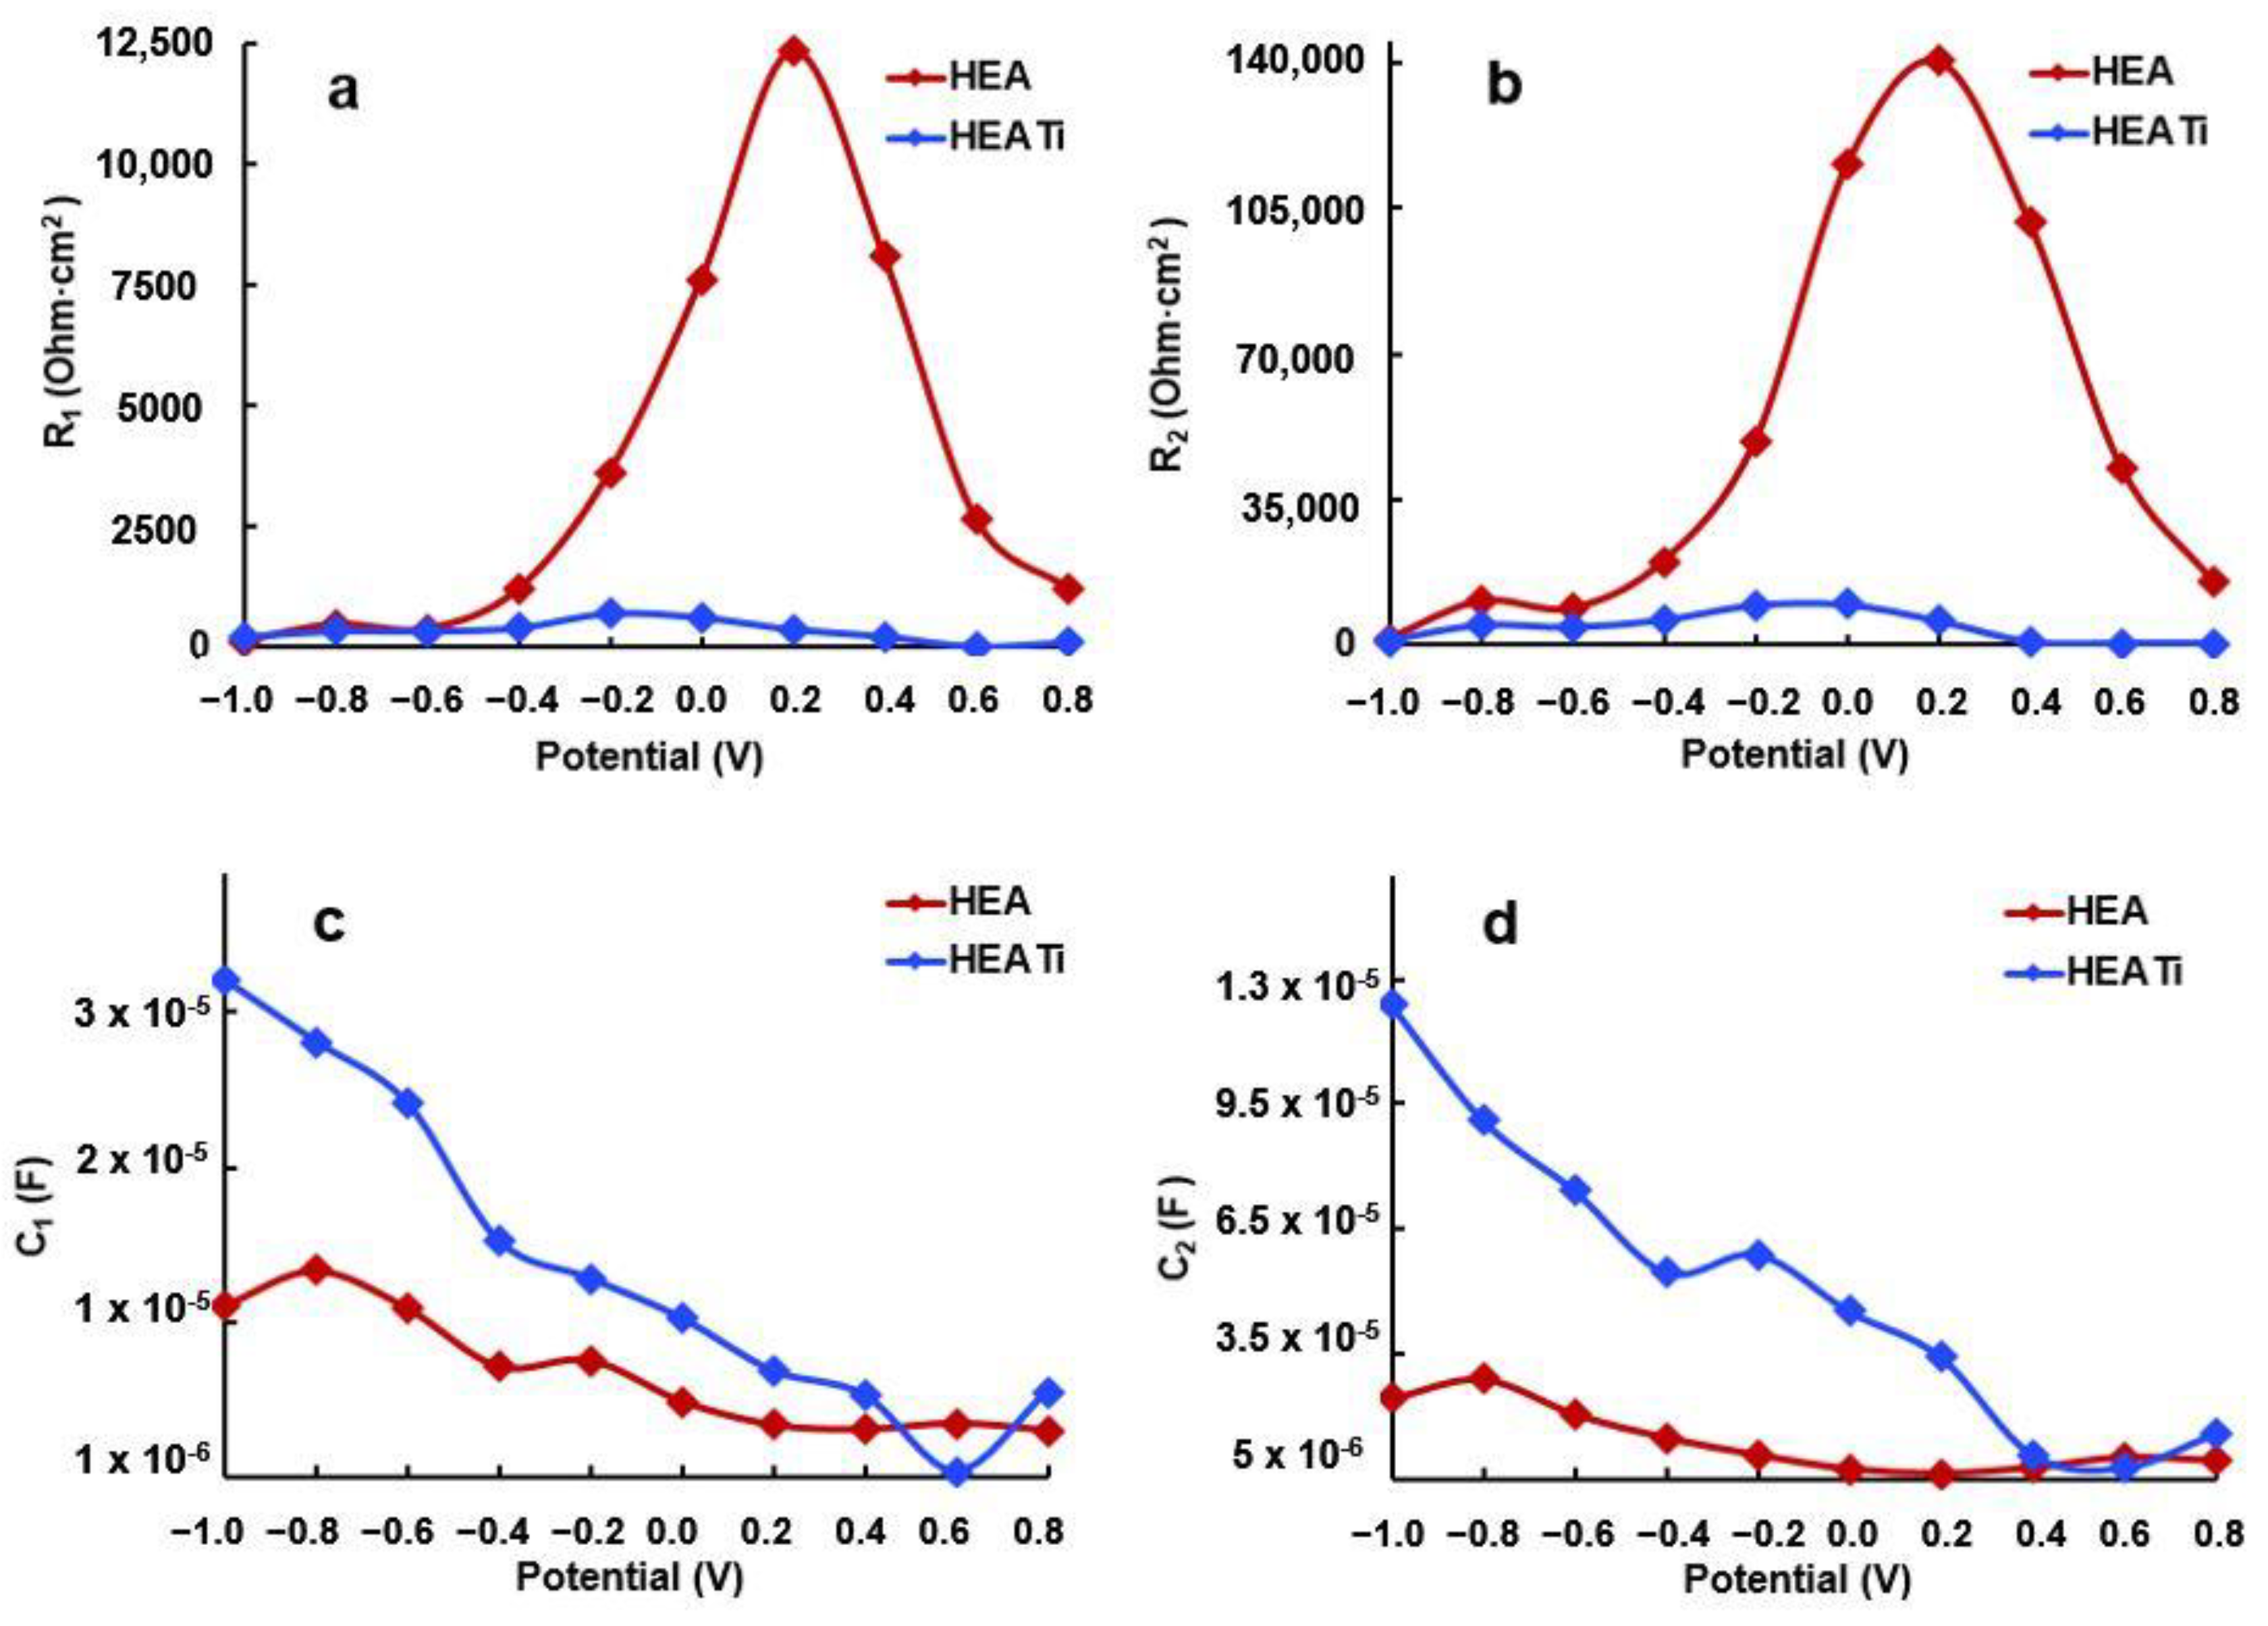
  • R is equal to R1 plus R2;
  • T is the product of τ1 and τ2;
  • X is equal to τ1 plus τ2 plus C1 times R2;
  • Y is equal to τ2 times R1;
  • τ1 represents the time constant of the porous layer in seconds;
  • τ2 represents the time constant of the compact layer in seconds.
Basic computations yielded the following equation:
Z eq = R e + R w 2 RT + w 2 XY ( 1 w 2 T ) 2 + w 2 R 2 + jw Y RX w 2 TY ( 1 w 2 T ) 2 + w 2 X 2
The electrolyte resistance (Re) is influenced by the separation among the working and reference electrodes, which remained constant in all experiments. Meanwhile, R1 stands for the resistance of the pores in the passive film and is linked to the ion conduction within the structure of the passive layer, revealing the degree of protection against corrosion supplied by the passive film to the base alloy. On the other hand, R2 indicates the polarization resistance at the interface between the alloy and passive film, considering the electrolyte’s ability to enter into the pores.
R2 represents the corrosion resistance of the investigated alloys, and its values are presented in Figure 10 after fitting the experimental data with the simulated values using the equivalent circuit. It can be observed that at −1000 mV, the R2 values of both samples are similar. However, as the potential increases, R2 also increases and reaches its maximum at −200 mV.
The rise in R2, which correlates with the increase in potential, is attributed to changes in the characteristics of the protective layer formed on the sample surface. Specifically, the layer becomes increasingly compact, as evidenced by the nearly 90-degree phase angle, and thicker, as seen in the decrease of capacity C2 with the increasing potential (refer to Figure 12). The HEA sample exhibits the highest R2 value, as indicated in Figure 12b.
The increase in the R2 value up to −0.2 V reflects the enhancement of the protective properties of the passive film as the potential rises. However, in the positive potential range, a decrease in C1 and C2 (refer to Figure 12c,d) indicates an increased irregularity and non-uniformity of the passive layer compared to the surface of the metal. It is a well-established fact that Ni and Cr are highly resistant to corrosion and form a robust passive film on the surface. During polarization, Ni(OH)2 and Cr(OH)3 are formed, leading to a uniform and compact passive film that effectively hinders Cl- from coming into contact with the metal surface, thereby lowering the corrosion rate and enhancing the alloy’s resistance to corrosion [48].
The decline in resistance at higher positive potentials can be attributed to the thinning and breakdown of the protective film on the sample surface. As the potential is shifted from −200 mV to more positive values, R2 decreases, indicating a reduction in the corrosion resistance of the alloy. This phenomenon occurs because the protective film formed on the sample surface becomes more permeable, enabling the electrolyte’s chloride ions to reach and attack the base metal. This is further evidenced by the decrease in C2, which is a result of the pores’ increased surface area that is exposed to the electrolyte, as shown in Figure 12d.
At positive potentials, the reduction in C1 and C2 suggests that the passive film becomes more uneven and rough compared to the underlying metal surface.
The discrepancies between the outcomes obtained from linear polarization and electrochemical impedance spectroscopy methods are attributed to inaccuracies arising from the initial current spike that distorted the polarization curve, leading to a shift of the zero-current potential from the Ecorr equilibrium. However, the curve-fitting analysis of the EIS spectra, as demonstrated by the chi-square value, indicates a high degree of conformity between the experimental and simulated data.

4. Conclusions

In the present work, CoCrFeMoNi HEAs and Ti-doped CoCrFeMoNi HEAs were prepared using vacuum arc remelting. Electrochemical impedance spectroscopy (EIS) measurements were performed on samples with and without Ti-doped CoCrFeMoNi high-entropy alloys in order to evaluate the influence of voltage on corrosion behavior in a simulated aggressive environment.
Above 0.25 V vs. SCE, the HEATi sample undergoes pitting corrosion. The reason for the pitting corrosion in the HEATi alloy can be explained by the preferential dissolution of iron ions into the electrolyte due to the increase in the Fe segregation ratio when the high-entropy alloy is doped with Ti.
Doping CoCrFeMoNi alloy with 0.36 at.% Ti reduce the alloy’s ability to resist corrosion, as the alloy can react more quickly with the surrounding environment and cause a decrease in the corrosion resistance of the alloy.

Author Contributions

S.J.B.-G., writing—original draft preparation, investigation, and management; J.C.M.-R., conceptualization and validation; C.J.-M., investigation, writing—review and editing; I.V., methodology, investigation, and data curation. All authors have read and agreed to the published version of the manuscript.

Funding

This work was supported by the Romanian National Authority for Scientific Research, CNDI–UEFISCDI, through project number PN-III-P2-2.1-PED-2019-3953, contract 514PED⁄2020: “New ceramic layer composite material processed by laser techniques for corrosion and high temperature applications—LASCERHEA”, within PNCDI III by Cabildo de Gran Canaria, project number CABINFR2019-07 and by the project ULPGC Excellence, funded by the Department of Economy, Knowledge and Employment of the Canary Islands Government.

Data Availability Statement

All data provided in the present manuscript are available to whom it may concern.

Conflicts of Interest

The authors declare no conflict of interest.

References

  1. Chen, J.; Zhou, X.; Wang, W.; Liu, B.; Lv, Y.; Yang, W.; Xu, D.; Liu, Y. A review on fundamental of high entropy alloys with promising high–temperature properties. J. Alloys Compd. 2018, 760, 15–30. [Google Scholar] [CrossRef]
  2. Miracle, D.B.; Senkov, O.N. A critical review of high entropy alloys and related concepts. Acta Mater. 2017, 122, 448–511. [Google Scholar] [CrossRef]
  3. Alaneme, K.K.; Bodunrin, M.O.; Oke, S.R. Processing, alloy composition and phase transition effect on the mechanical and corrosion properties of high entropy alloys: A review. J. Mater. Res. Technol. 2016, 5, 384–393. [Google Scholar] [CrossRef]
  4. Dada, M.; Popoola, P.; Adeosun, S.; Mathe, N. High Entropy Alloys for Aerospace Applications. Aerodynamics. IntechOpen. 2021, 1–16. [Google Scholar] [CrossRef]
  5. Yang, F.; Wang, J.; Zhang, Y.; Wu, Z.; Zhang, Z.; Zhao, F.; Huot, J.; Grobivć Novaković, J.; Novaković, N. Recent progress on the development of high entropy alloys (HEAs) for solid hydrogen storage: A review. Int. J. Hydrogen Energy 2022, 47, 11236–11249. [Google Scholar] [CrossRef]
  6. Fu, M.; Ma, X.; Zhao, K.; Li, X.; Su, D. High-entropy materials for energy-related applications. iScience 2021, 24, 102177. [Google Scholar] [CrossRef]
  7. Rios, M.L.; Baldevenites, V.L.; Voiculescu, I.; Rosca, J.M. AlCoCrFeNi High Entropy Alloys as Possible Nuclear Materials. Microsc. Microanal. 2020, 26, 406–407. [Google Scholar] [CrossRef]
  8. Hussain, I.; Lamiel, C.; Ahmad, M.; Chen, Y.; Shuang, S.; Javed, M.S.; Yang, Y.; Zhang, K. High entropy alloys as electrode material for supercapacitors: A review. J. Energy Storage 2021, 44, 103405. [Google Scholar] [CrossRef]
  9. Castro, D.; Jaeger, P.; Baptista, A.C.; Oliveira, J.P. An overview of high-entropy alloys as biomaterials. Metals 2021, 11, 648. [Google Scholar] [CrossRef]
  10. López Ríos, M.; Socorro Perdomo, P.P.; Voiculescu, I.; Geanta, V.; Crăciun, V.; Boerasu, I.; Mirza Rosca, J.C. Effects of nickel content on the microstructure, microhardness and corrosion behavior of high-entropy AlCoCrFeNix alloys. Sci. Rep. 2020, 10, 1–11. [Google Scholar] [CrossRef]
  11. Socorro-Perdomo, P.; Florido-Suarez, N.; Voiculescu, I.; Mirza-Rosca, J. Biocompatibility of New High-Entropy Alloys with Non-Cytotoxic Elements. Microsc. Microanal. 2021, 27, 1772–1774. [Google Scholar] [CrossRef]
  12. Feng, J.; Tang, Y.; Liu, J.; Zhang, P.; Liu, C.; Wang, L. Bio-high entropy alloys: Progress, challenges, and opportunities. Front. Bioeng. Biotechnol. 2022, 10, 1–26. [Google Scholar] [CrossRef]
  13. Cui, G.; Han, B.; Yang, Y.; Wang, Y.; Chunyang, H. Microstructure and tribological property of CoCrFeMoNi High entropy alloy treated by ion sulfurization. J. Mater. Res. Technol. 2020, 9, 2598–2609. [Google Scholar] [CrossRef]
  14. Wang, Z.; Jin, J.; Zhang, G.H.; Fan, X.H.; Zhang, L. Effect of temperature on the passive film structure and corrosion performance of CoCrFeMoNi high-entropy alloy. Corros. Sci. 2022, 208, 110661. [Google Scholar] [CrossRef]
  15. Zhou, Z.; Jiang, F.; Yang, F.; Yang, Y.; Liang, P. Novel laser cladding FeCoNiCrNb0.5Mox high-entropy alloy coatings with excellent corrosion resistance. Mater. Lett. 2023, 335, 133714. [Google Scholar] [CrossRef]
  16. Zhang, J.; Tse, K.; Wong, M.; Zhang, Y.; Zhu, J. A brief review of co-doping. Front. Phys. 2016, 11, 117405. [Google Scholar] [CrossRef]
  17. Wang, F.; Wang, S.; Chen, B.; Ma, W.; Jing, Q.; Zhang, X.; Ma, M.; Wang, Q.; Liu, R. Effect of Ti addition on the mechanical properties and microstructure of novel Al-rich low-density multi-principal-element alloys. J. Alloys Compd. 2022, 891, 162028. [Google Scholar] [CrossRef]
  18. Wang, S.; Gao, Z.; Wu, G.; Mao, X. Titanium microalloying of steel: A review of its effects on processing, microstructure and mechanical properties. Int. J. Miner. Metall. Mater. 2022, 29, 645–661. [Google Scholar] [CrossRef]
  19. Liu, Y.; Sun, Y.H.; Wu, H. tian Effects of chromium on the microstructure and hot ductility of Nb-microalloyed steel. Int. J. Miner. Metall. Mater. 2021, 28, 1011–1021. [Google Scholar] [CrossRef]
  20. Lin, Y.J.; Huang, C.S.; Tsai, P.C.; Hsiao, Y.L.; Chen, C.Y.; Jou, J.H. Minor Copper-Doped Aluminum Alloy Enabling Long-Lifetime Organic Light-Emitting Diodes. ACS Appl. Mater. Interfaces 2022, 14, 55898–55904. [Google Scholar] [CrossRef]
  21. Jing, J.; Gu, X.; Zhang, S.; Sun, J.; Chen, Y.; Sun, T. Doping of aluminum (Al) into copper sulfide (CuS) nanocrystals enhanced their solar spectral selectivity. CrystEngComm 2019, 21, 4969–4975. [Google Scholar] [CrossRef]
  22. Missaghian, P. Oxidation of magnesium doped Al-surfaces. KTH Skolan for Teknikvetenskap 2020, 1, 1–33. [Google Scholar]
  23. Meroueh, L.; Eagar, T.W.; Hart, D.P. Effects of Mg and Si Doping on Hydrogen Generation via Reduction of Aluminum Alloys in Water. ACS Appl. Energy Mater. 2020, 3, 1860–1868. [Google Scholar] [CrossRef]
  24. Gunen, A.; Keddam, M.; Sunbul, S.E.; Icin, K.; Doleker, K.M.; Gok, M.S.; Dal, S.; Erdogan, A. Powder-pack boronizing of CoCrFeNiAl0.5Nb0.5 HEA: Modeling of kinetics, microstructural, mechanical, and tribological characterizations. J. Alloys Compd. 2022, 929, 167310. [Google Scholar] [CrossRef]
  25. Zhang, Y.; Wu, H.; Chen, Y.; Dong, J.; Yin, S.; Hua, K.; Wang, H. Characterization of the microstructure and self-lubrication properties of a AlCoCrFeNi2.1 eutectic high-entropy alloy with powder-pack boronizing. Mater. Charact. 2022, 191, 112118. [Google Scholar] [CrossRef]
  26. Wu, Y.H.; Yang, H.J.; Guo, R.P.; Wang, X.J.; Shi, X.H.; Liaw, P.K.; Qiao, J.W. Tribological behavior of boronized Al0.1CoCrFeNi high-entropy alloys under dry and lubricated conditions. Wear 2020, 460–461, 203452. [Google Scholar] [CrossRef]
  27. Hou, J.; Zhang, M.; Yang, H.; Qiao, J.; Wu, Y. Surface strengthening in Al0.25CoCrFeNi high-entropy alloy by boronizing. Mater. Lett. 2019, 238, 258–260. [Google Scholar] [CrossRef]
  28. Qi, W.; Wang, W.; Yang, X.; Zhang, G.; Ye, W.; Su, Y.; Li, Y.; Chen, S. Effects of Al and Ti co-doping on the strength-ductility- corrosion resistance of CoCrFeNi-AlTi high-entropy alloys. J. Alloys Compd. 2022, 925, 166751. [Google Scholar] [CrossRef]
  29. Kurt, B.; Günen, A.; Kanca, Y.; Koç, V.; Gök, M.S.; Kırar, E.; Askerov, K. Properties and Tribologic Behavior of Titanium Carbide Coatings on AISI D2 Steel Deposited by Thermoreactive Diffusion. JOM 2018, 70, 2650–2659. [Google Scholar] [CrossRef]
  30. Günen, A.; Soylu, B.; Karakaş, Ö. Titanium carbide coating to improve surface characteristic, wear and corrosion resistance of spheroidal graphite cast irons. Surf. Coatings Technol. 2022, 437, 128280. [Google Scholar] [CrossRef]
  31. Mareci, D.; Ungureanu, G.; Aelenei, N.; Chelariu, R.; Rosca, J.C.M. Eis diagnosis of some dental alloys in artificial saliva. Environ. Eng. Manag. J. 2007, 6, 313–317. [Google Scholar] [CrossRef]
  32. Socorro-Perdomo, P.P.; Florido-Suárez, N.R.; Mirza-Rosca, J.C.; Saceleanu, M.V. EIS Characterization of Ti Alloys in Relation to Alloying Additions of Ta. Materials 2022, 15, 476. [Google Scholar] [CrossRef] [PubMed]
  33. Perdomo, P.P.S.; Suárez, N.R.F.; Verdú-Vázquez, A.; Rosca, J.C.M. Comparative EIS study of titanium-based materials in high corrosive environments. Int. J. Surf. Sci. Eng. 2021, 15, 152–164. [Google Scholar] [CrossRef]
  34. González, J.E.G.; Mirza-Rosca, J.C. Study of the corrosion behavior of titanium and some of its alloys for biomedical and dental implant applications. J. Electroanal. Chem. 1999, 471, 109–115. [Google Scholar] [CrossRef]
  35. ASTM E3-11; Standard Guide for Preparation of Metallographic Specimens. ASTM International: West Conshohocken, PA, USA,, 2017.
  36. Material, C.; Databases, P. Standard Reference Test Method for Making Potentiostatic and Potentiodynamic Anodic. Annu. B. ASTM Stand. 2004, 94, 1–12. [Google Scholar]
  37. ASTM-Standards Standard practice for calculation of corrosion rates and related information from electrochemical measurements. Astm G 102-89 1999, 89, 1–7.
  38. ISO 16773-1-4:2016; Electrochemical Impedance Spectroscopy (EIS) on Coated and Uncoated Metallic Specimens. International Organization for Standardization: Geneva, Switzerland, 2016.
  39. Stern, M.; Geary, A.L. Electrochemical Polarization: I. A Theoretical Analysis of the Shape of Polarization Curves. J. Electrochem. Soc. 1957, 104, 56. [Google Scholar] [CrossRef]
  40. Brito-Garcia, S.; Mirza-Rosca, J.; Geanta, V.; Voiculescu, I. Mechanical and Corrosion Behavior of Zr-Doped High-Entropy Alloy from CoCrFeMoNi System. Materials 2023, 16, 1832. [Google Scholar] [CrossRef]
  41. Wang, W.; Wang, J.; Sun, Z.; Li, J.; Li, L.; Song, X.; Wen, X.; Xie, L.; Yang, X. Effect of Mo and aging temperature on corrosion behavior of (CoCrFeNi)100−xMox high-entropy alloys. J. Alloys Compd. 2020, 812, 152139. [Google Scholar] [CrossRef]
  42. Pourbaix, M.; Zhang, H.; Pourbaix, A. Presentation of an Atlas of chemical and electrochemical equilibria in the presence of a gaseous phase. Mater. Sci. Forum 1997, 251–254, 143–148. [Google Scholar] [CrossRef]
  43. Wang, Z.; Feng, Z.; Zhang, L. Effect of high temperature on the corrosion behavior and passive film composition of 316 L stainless steel in high H2S-containing environments. Corros. Sci. 2020, 174, 108844. [Google Scholar] [CrossRef]
  44. Wang, Z.; Zhang, L.; Zhang, Z.; Lu, M. Combined effect of pH and H2S on the structure of passive film formed on type 316L stainless steel. Appl. Surf. Sci. 2018, 458, 686–699. [Google Scholar] [CrossRef]
  45. Scully, R.; Silverman, D.C.; Kendig, M. Electrochemical Impedance: Analysis and Interpretation; ASTM: Philadelphia, PA, USA, 1993. [Google Scholar] [CrossRef]
  46. Lutton, K.; Han, J.; Ha, H.M.; Sur, D.; Romanovskaia, E.; Scully, J.R. Passivation of Ni-Cr and Ni-Cr-Mo Alloys in Low and High pH Sulfate Solutions. J. Electrochem. Soc. 2023, 170, 021507. [Google Scholar] [CrossRef]
  47. Boukamp, B.A. A nonlinear least squares fit procedure for analysis of immittance data of electrochemical systems. Solid State Ion. 1986, 20, 31–44. [Google Scholar] [CrossRef]
  48. Wang, Z.; Zhang, G.-H.; Fan, X.-H.; Jin, J.; Zhang, L.; Du, Y.-X. Corrosion behavior and surface characterization of an equiatomic CoCrFeMoNi high-entropy alloy under various pH conditions. J. Alloys Compd. 2022, 900, 163432. [Google Scholar] [CrossRef]
Figure 1. Samples’ preparation and posterior tests.
Metals 13 00883 g001
Figure 2. Metallographic structure of (a) HEA and (b) HEATi.
Metals 13 00883 g002
Figure 3. SEM micrographs and corresponding EDS maps and spectra for (a) HEA and (b) HEATi.
Metals 13 00883 g003
Figure 4. Open circuit potential for HEA and HEATi during 24 h in 3.5% NaCl.
Metals 13 00883 g004
Figure 5. Linear polarization curves of the analyzed samples.
Metals 13 00883 g005
Figure 6. SEM observation (a) and EDS spectra and composition (b) of the HEA sample after 24 h of immersion in 3.5% NaCl.
Metals 13 00883 g006
Figure 7. SEM observation (a) and EDS spectra and composition (b) of the HEATi sample after 24 h of immersion in 3.5% NaCl.
Metals 13 00883 g007
Figure 8. Nyquist plots for HEA (a,b) and for HEATi (c,d).
Metals 13 00883 g008
Figure 9. Bode phase for HEA (a,b) and for HEATi (c,d).
Metals 13 00883 g009
Figure 10. Bode–IZI for HEA (a,b) and for HEATi (c,d).
Metals 13 00883 g010
Figure 11. Electrical equivalent circuit used for fitting the experimental EIS data.
Metals 13 00883 g011
Figure 12. Evolution of R1 (a), R2 (b), C1 (c), and C2 (d) resulting from fitting of the experimental data of HEA and HEATi.
Metals 13 00883 g012
Disclaimer/Publisher’s Note: The statements, opinions and data contained in all publications are solely those of the individual author(s) and contributor(s) and not of MDPI and/or the editor(s). MDPI and/or the editor(s) disclaim responsibility for any injury to people or property resulting from any ideas, methods, instructions or products referred to in the content.

