Article

The Influences of Heat Treatment on the Microstructure and Mechanical Properties of Rolled Ti2AlNb

1
Key Laboratory for Light-Weight Materials, Nanjing University of Technology, Nanjing 210003, China
2
School of Materials Science and Chemical Engineering, Harbin University of Science and Technology, Harbin 150040, China
*
Author to whom correspondence should be addressed.
Metals 2023, 13(5), 886; https://doi.org/10.3390/met13050886
Submission received: 1 March 2023 / Revised: 16 April 2023 / Accepted: 25 April 2023 / Published: 3 May 2023

Abstract

:
In this study, the microstructural evolution, distribution, morphology, and change mechanism of an as-rolled Ti2AlNb alloy were quantitatively analyzed by X-ray diffraction and electron backscatter diffraction (EBSD). The results show that after solution treatment at 900 °C, the content of the O phase alloy decreased by 2%, which provided space for the nucleation of the α2 phase, the content of which increased by 2%. After aging treatment at 760 °C, large quantities of acicular O phase and α2 phase were precipitated in the B2 matrix, and the content of the α2 phase increased. As the aging temperature increased to 840 °C, the elongated α2 phases were connected to each other at a specific angle along the grain boundary, extending to the interior of the grain. The hardness reached its maximum value of 402 HV at 760 °C. This study deepened our understanding of the formation of the α2 phase in the microstructure of rolled Ti2AlNb alloy, and investigates the effect of α2 phase content on the hardness of the alloy in more depth.

1. Introduction

Titanium alloy has great development and application potential in aerospace equipment such as aircraft and rockets, and its excellent properties, such as high strength, low density, and good corrosion resistance, play an important role [1,2]. For a long time, researchers have been pursuing titanium alloys with excellent performance and higher usage temperatures (above 700 °C). Nowadays, nickel-based superalloys are widely used as high-temperature structural materials in the aerospace field because of their superior high-temperature strength and outstanding creep resistance. However, high density is the Achilles heel of nickel-based superalloys; it leads to low thrust/weight ratios and high fuel consumption. Therefore, the research on and development of lightweight, high-strength, and high-temperature structural materials is of great significance.
Low-density α2-Ti3Al-based alloys have excellent thermal stability and high specific strength, but are brittle at room temperature. Banerjee added some Nb elements to Ti3Al to obtain ordered orthogonal O phase [3]. The obtained Ti2AlNb-based alloy had better specific strength, oxidation resistance, and creep resistance than traditional titanium alloys. However, the brittleness and inoperability of Ti2AlNb-based alloy sheets limit their application [4,5,6].
According to its characteristics, the microstructure of Ti2AlNb alloy is divided into lath, equiaxed and bimodal structure [7]. The equiaxed α2 phase and O phase are distributed on the β/B2 matrix as equiaxed structures. The equiaxed α2/O phase can be obtained by isothermal forging in the α2 + B2 + O or O + B2 phase regions followed by recrystallization annealing. The lath structure without equiaxed α2 phase can be obtained by isothermal forging in the B2/β single-phase region and then processing in the O + B2 two-phase region. The advantages of equiaxed and lath structures are reflected in the bimodal structure, and the equiaxed α2 phase content does not exceed 40%. The bimodal microstructure can be obtained by plastic deformation after heating in the α2 + B2/β two-phase region. The growth of B2 grains is inhibited by the pinning effect of the α2 phase. The crystal structure of the α2 phase (Ti3Al) is HCP-D019 type, and its space group is P63/mmc. The B2 phase is a body-centered cubic (BCC) structure with a space group of Pm3m. The structure of O (Ti2AlNb) is ordered orthogonally, and the space group is Cmcm [8]. The Ti2AlNb alloy has the highest volume fraction of the B2 phase, so the B2 phase is the matrix phase. Most of the microstructure of Ti2AlNb-based alloys is based on the B2 phase. At high temperatures, the ordered B2 phase transforms to the disordered β phase, and the second-order phase transition occurs.
Alloying Ti2AlNb-based alloys can significantly improve their properties. By adding other elements, such as Mo, V, Zr, and others, the shortcomings of the alloy can be mitigated. By studying the microstructure and phase transformation during quenching and cooling, it was concluded that O dissolves during solution treatment, and that the Widmanstatten structure O + B2 is refined during heat treatment in B2 phase region [4,9]. Hagihara et al. [10] studied the effect of W on the mechanical properties of Ti-22Al-27Nb alloy. They found that W alloying lowers the phase transition temperature of the Ti2AlNb alloy, which is conducive to precipitation of the O phase. This can improve the strength and creep resistance of the Ti2AlNb alloy [10]. The addition of the element Mo improves the creep resistance and tensile properties of Ti2AlNb-based alloys [11,12,13].
Ti2AlNb-based alloys have been studied considerably because of their attractive performances in high-temperature conditions. However, due to its complex structure, there are still some deficiencies in the quantitative analysis of the heat treatment process of the Ti2AlNb alloy containing low Nb. Therefore, this paper intends to improve the data research in this field by solution and aging treatment of the Ti2AlNb alloy containing low Nb; quantitatively analyzing the changes in the phase content, phase transformation mechanism, and appearance; and summarize the effects of the changes in each phase along with the heat treatment process on the mechanical properties of the alloy.

2. Materials and Methods

In this experiment, a rolled alloy sheet with nominal composition of Ti-22Al-23 (Nb, Mo, V, Si) was used as the experimental material. The alloy’s composition is shown in Table 1. Mo and V reduced the overall density of the alloy, and a small amount of Si increased the high-temperature oxidation resistance and high-temperature strength of the alloy. The microstructure of the Ti2AlNb alloy, rolled by different heat treatment processes, was observed using a metallographic microscope. The microstructure was observed and analyzed by scanning electron microscope backscatter (BSE). The detailed solution and aging parameters used in this study are shown in Table 2.
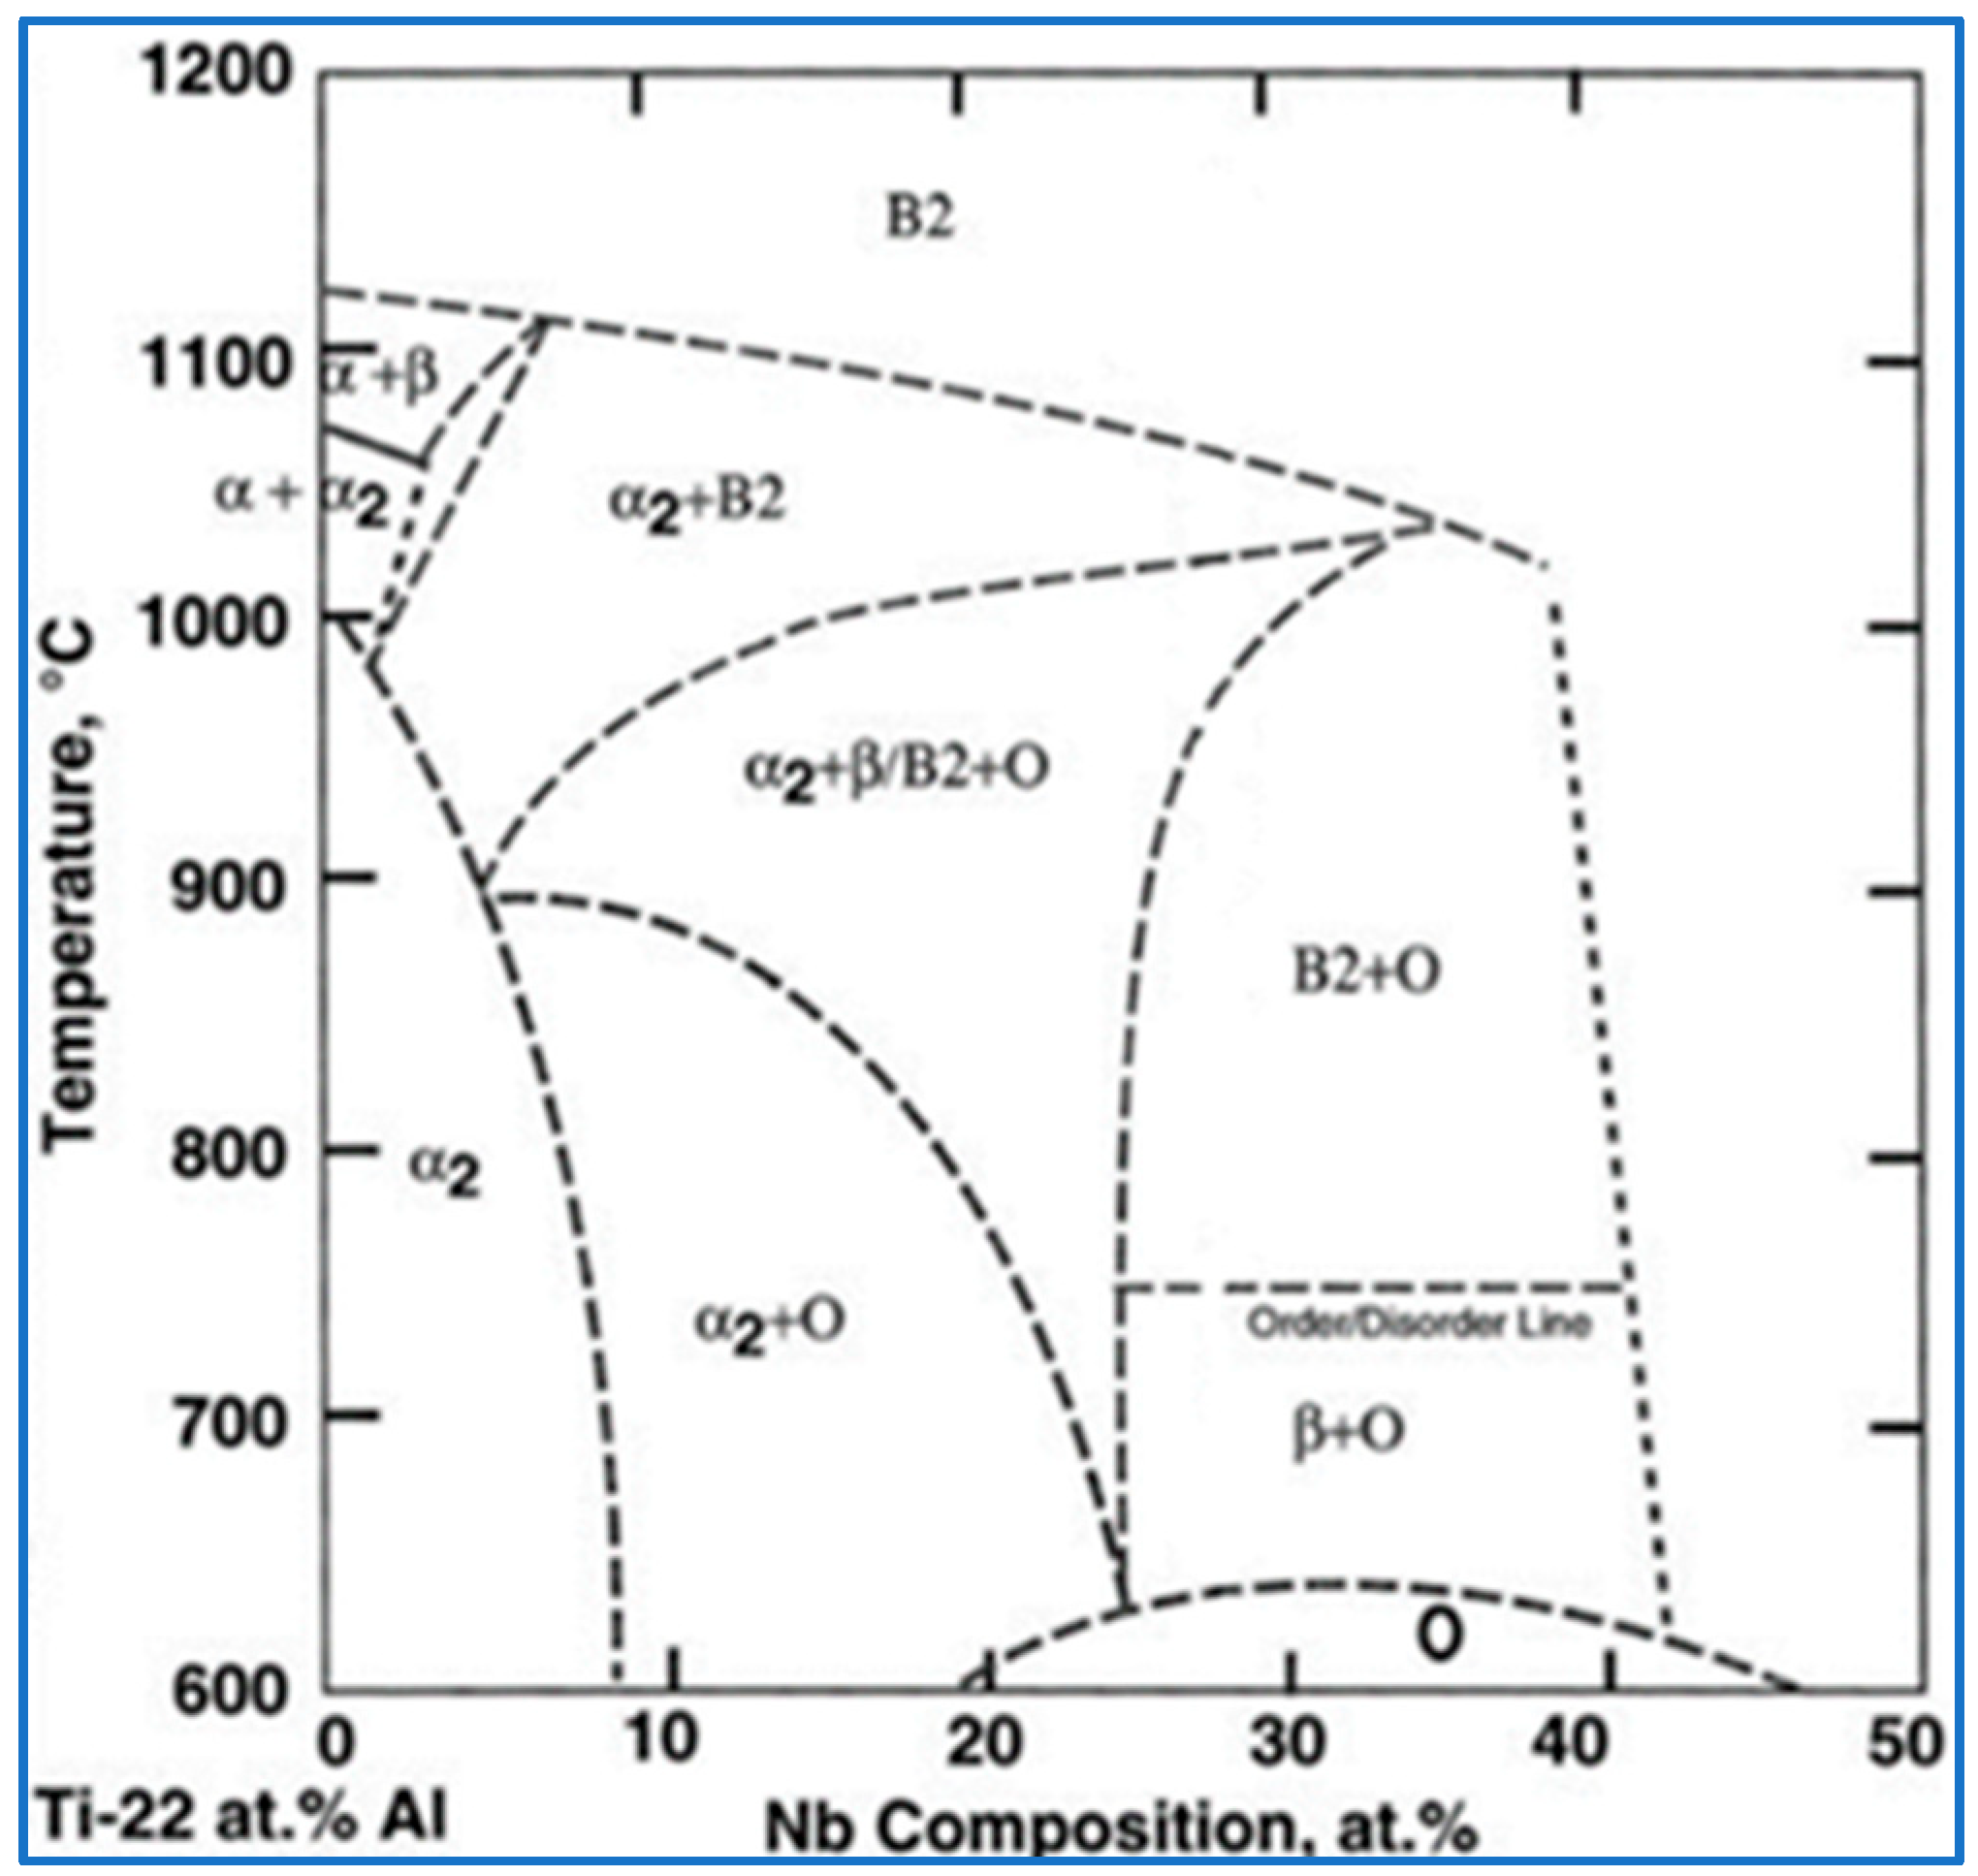
In this experiment, the as-rolled Ti2AlNb alloy was treated at 900 °C. The effect of solution treatment on the phase content and phase transformation mechanism of Ti2AlNb rolled alloy was studied, and its Vickers microhardness was measured. Then, the alloy, after solution treatment at 900 °C, was aged at 760 °C and 840 °C for 6 h. The precipitation mechanism of the alloy phase after aging treatment and the effects of different phase contents on the hardness of the alloy were studied, and the evolution of the alloy structure was summarized. The temperature–time diagram of the heat treatment process is shown in Figure 1. Figure 2 shows the phase diagram of the Ti-22Al-xNb alloy [14], drawn by Boehler et al., which provides a basis for the study of the heat treatment process of the Ti2AlNb-based alloys in different phase regions.
Firstly, the cut samples were polished with 300#, 800#, 1200#, 1500#, and 2000# sandpaper. After the sample was mechanically polished, it was cleaned with alcohol, dried with a hairdryer, and then electrolytically polished on an electrolytic polishing platform. The voltage was controlled at 40 V, the current was controlled at 0.8 A, and an appropriate amount of standard polishing liquid (polishing liquid ratio: 5 vol.% HClO4 + 35 vol.% CH3 (CH2))3OH + 60 vol.% CH3OH) was added to the beaker. Since the polishing was carried out at a lower temperature (−40 °C), an appropriate amount of liquid nitrogen was added to reduce the temperature before polishing. The polishing time was 50 s. After polishing, the sample was rinsed with anhydrous ethanol, and then rinsed again in an ultrasonic cleaner with anhydrous ethanol for 2 min. After the sample was dried using a hair dryer, the etching process was conducted using a Kroll solution of 60 vol.% H2O, 37 vol.% HNO3, and 3 vol.% HF. The etching time was about 35 s. Immediately after the corrosion was complete, the sample was rinsed with anhydrous ethanol, then rinsed again in an ultrasonic cleaner for 2 min and blow-dried with a hairdryer. The microstructure of the samples after corrosion was observed by a metallographic microscope and scanning electron microscopy.
The phase constituent of the Ti2AlNb-based alloy was determined by an X-ray diffraction (XRD, Bruker D8 Discover) technique, using with Cu Kα radiation. The XRD was performed with a step size of 0.01° and a scanning range of 20°~100°. The microstructure of the Ti2AlNb-based alloy was observed by scanning electron microscopy (EISS Gemini SEM 300). Electron backscatter diffraction (EBSD, 20 kV, 20 nA) experiments were further carried on the scanning electron microscopy equipment. For the scanning step of EBSD mapping, 0.1 μm was selected. The room-temperature Vickers microhardness was obtained under a 0.2 kg load and held for 15 s.
The effect of the heat treatment process on the microstructure was quantitatively analyzed by OM, SEM, XRD, EBSD, and other analytical methods, and then the hardness, as measured by Vickers hardness tester, was used to study the effect of different microstructures on the hardness [15]. Image-Pro Plus6.0 image analysis software was used to quantitatively analyze the volume fractions and grain sizes of the α2, B2, and O phases in the sample. The grain sizes were measured using the intercept method, and the phase volume fraction was measured using the microstructure measurement method for titanium alloys, established by Wang [16,17]. To ensure statistical accuracy, five different regions, with a total area of more than 200,000 μm2, were randomly selected for calculation. In addition, EBSD technology was also used to analyze the phase composition, because sometimes the grain boundaries of the needle-like O phase and the B2 phase were difficult to distinguish in BSE images.

3. Results and Discussion

3.1. Microstructure of Rolled Ti2AlNb Alloy

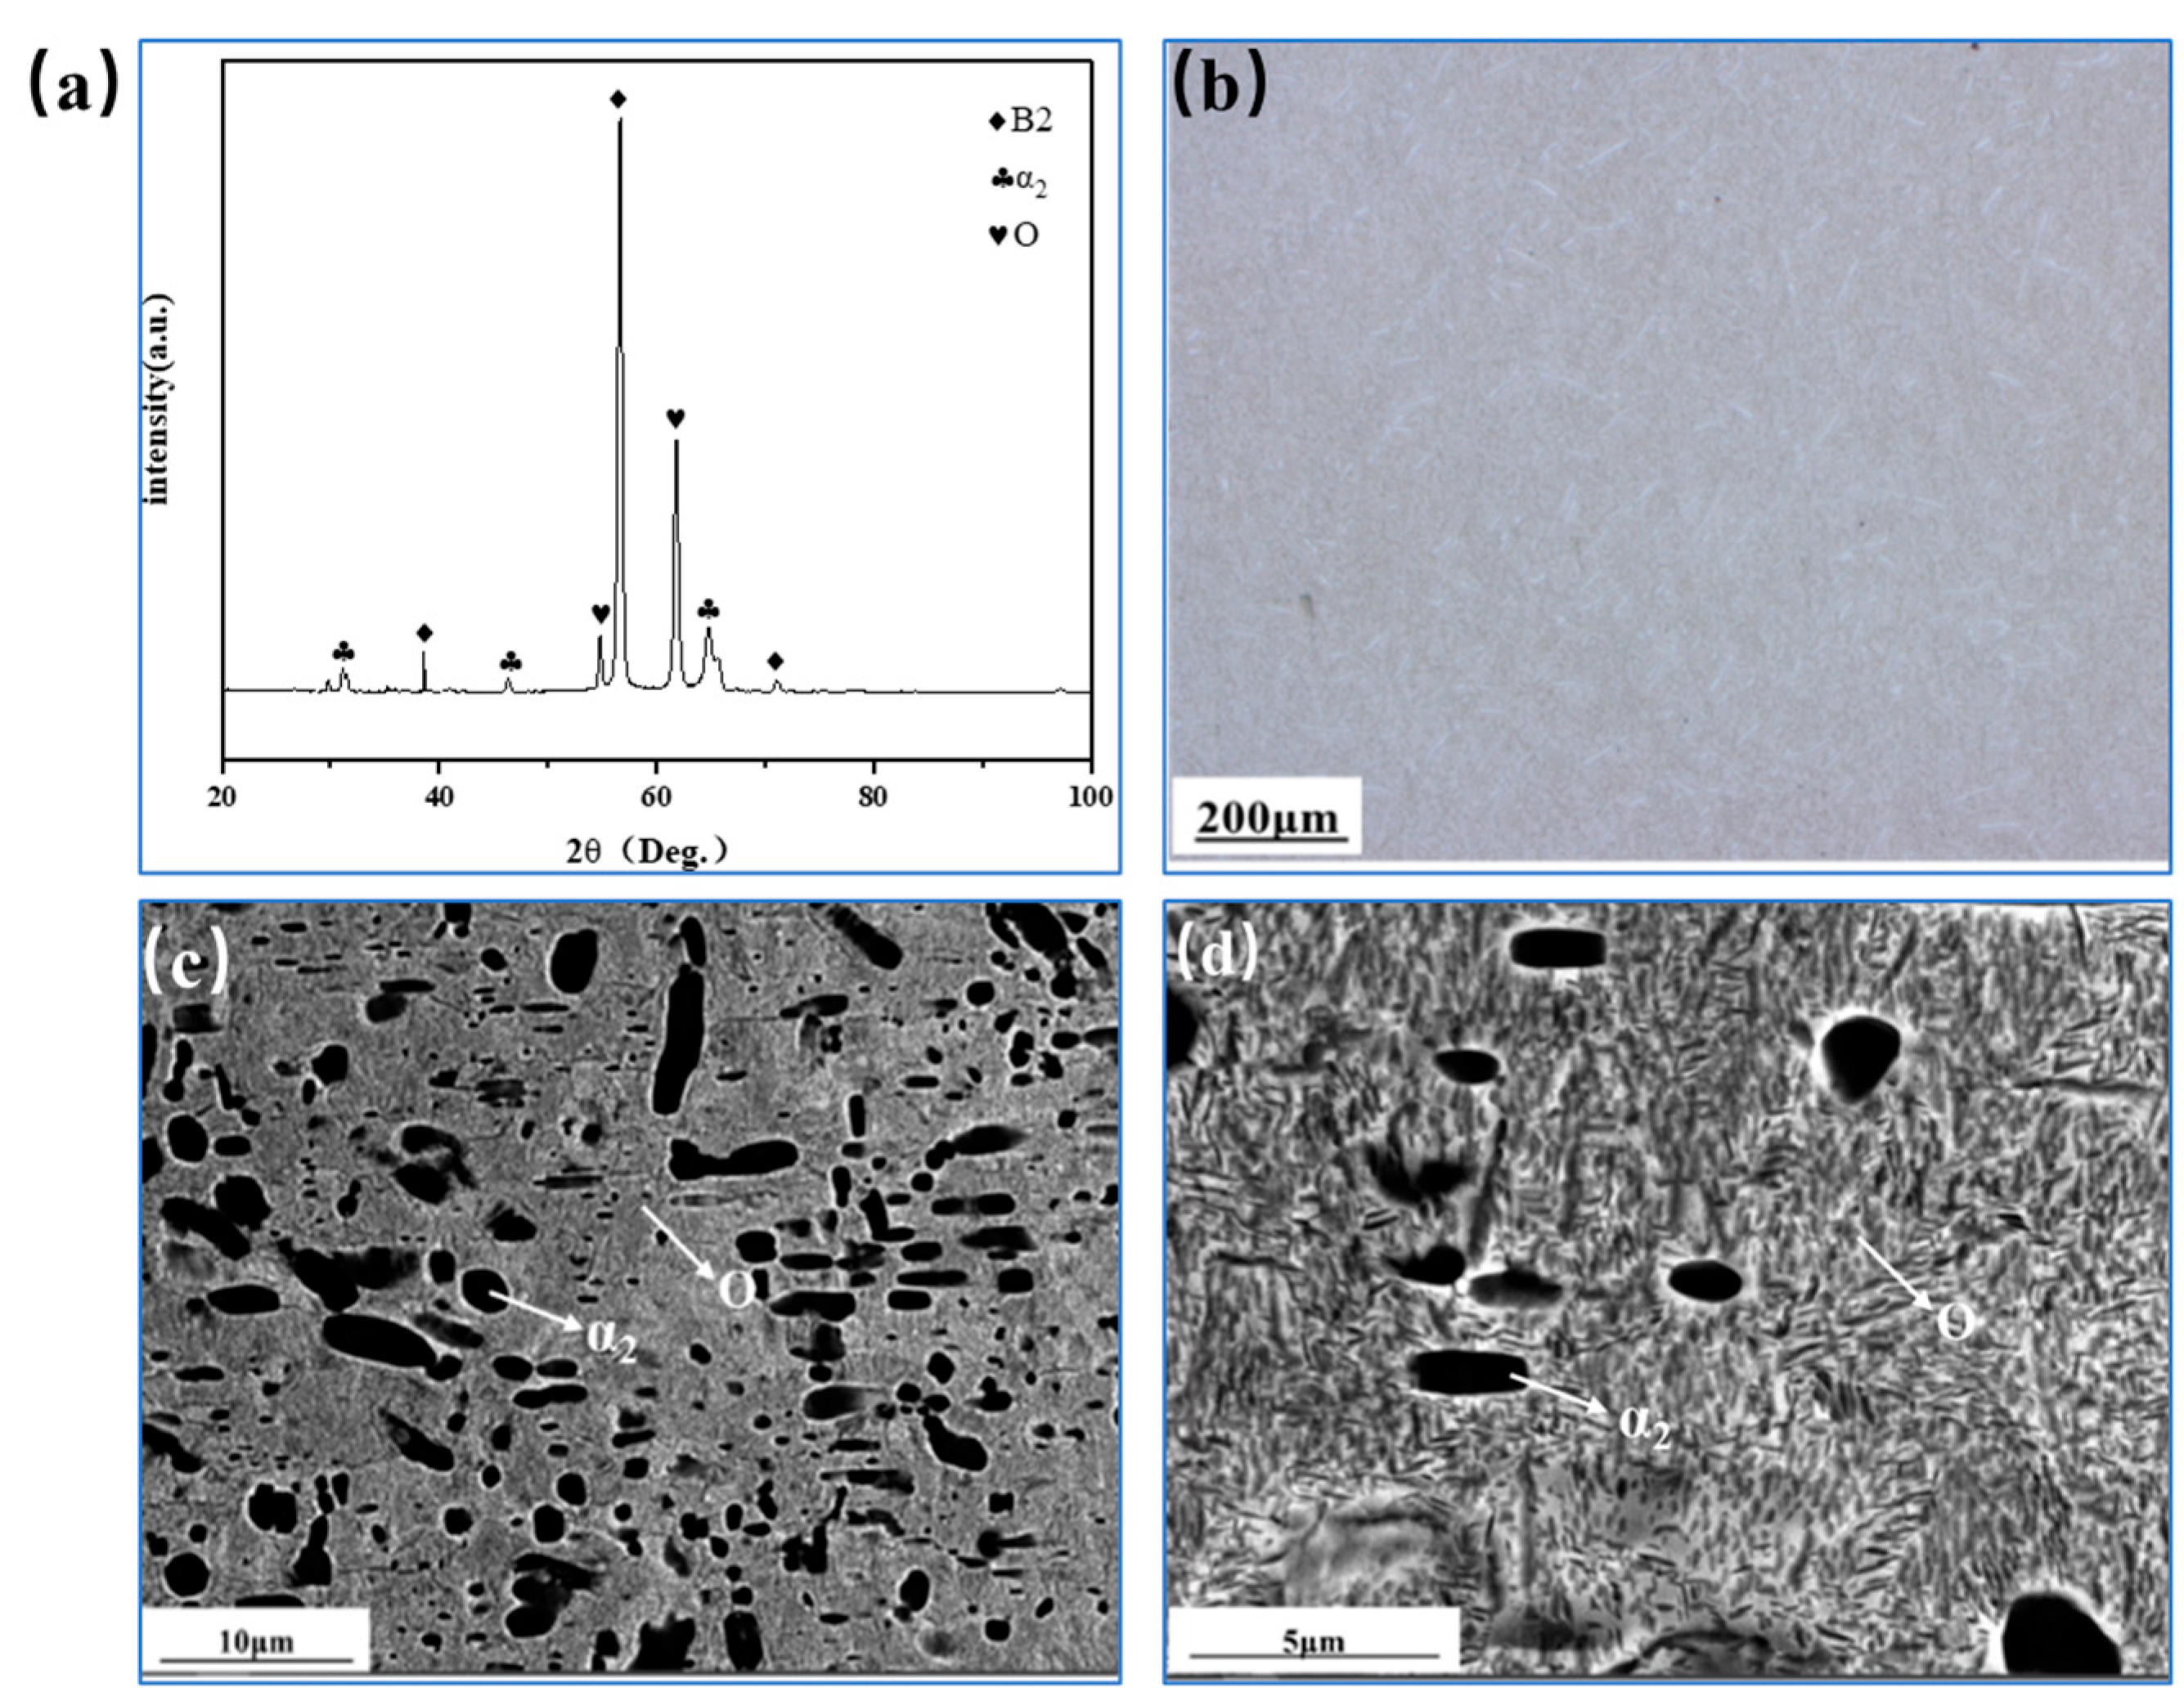
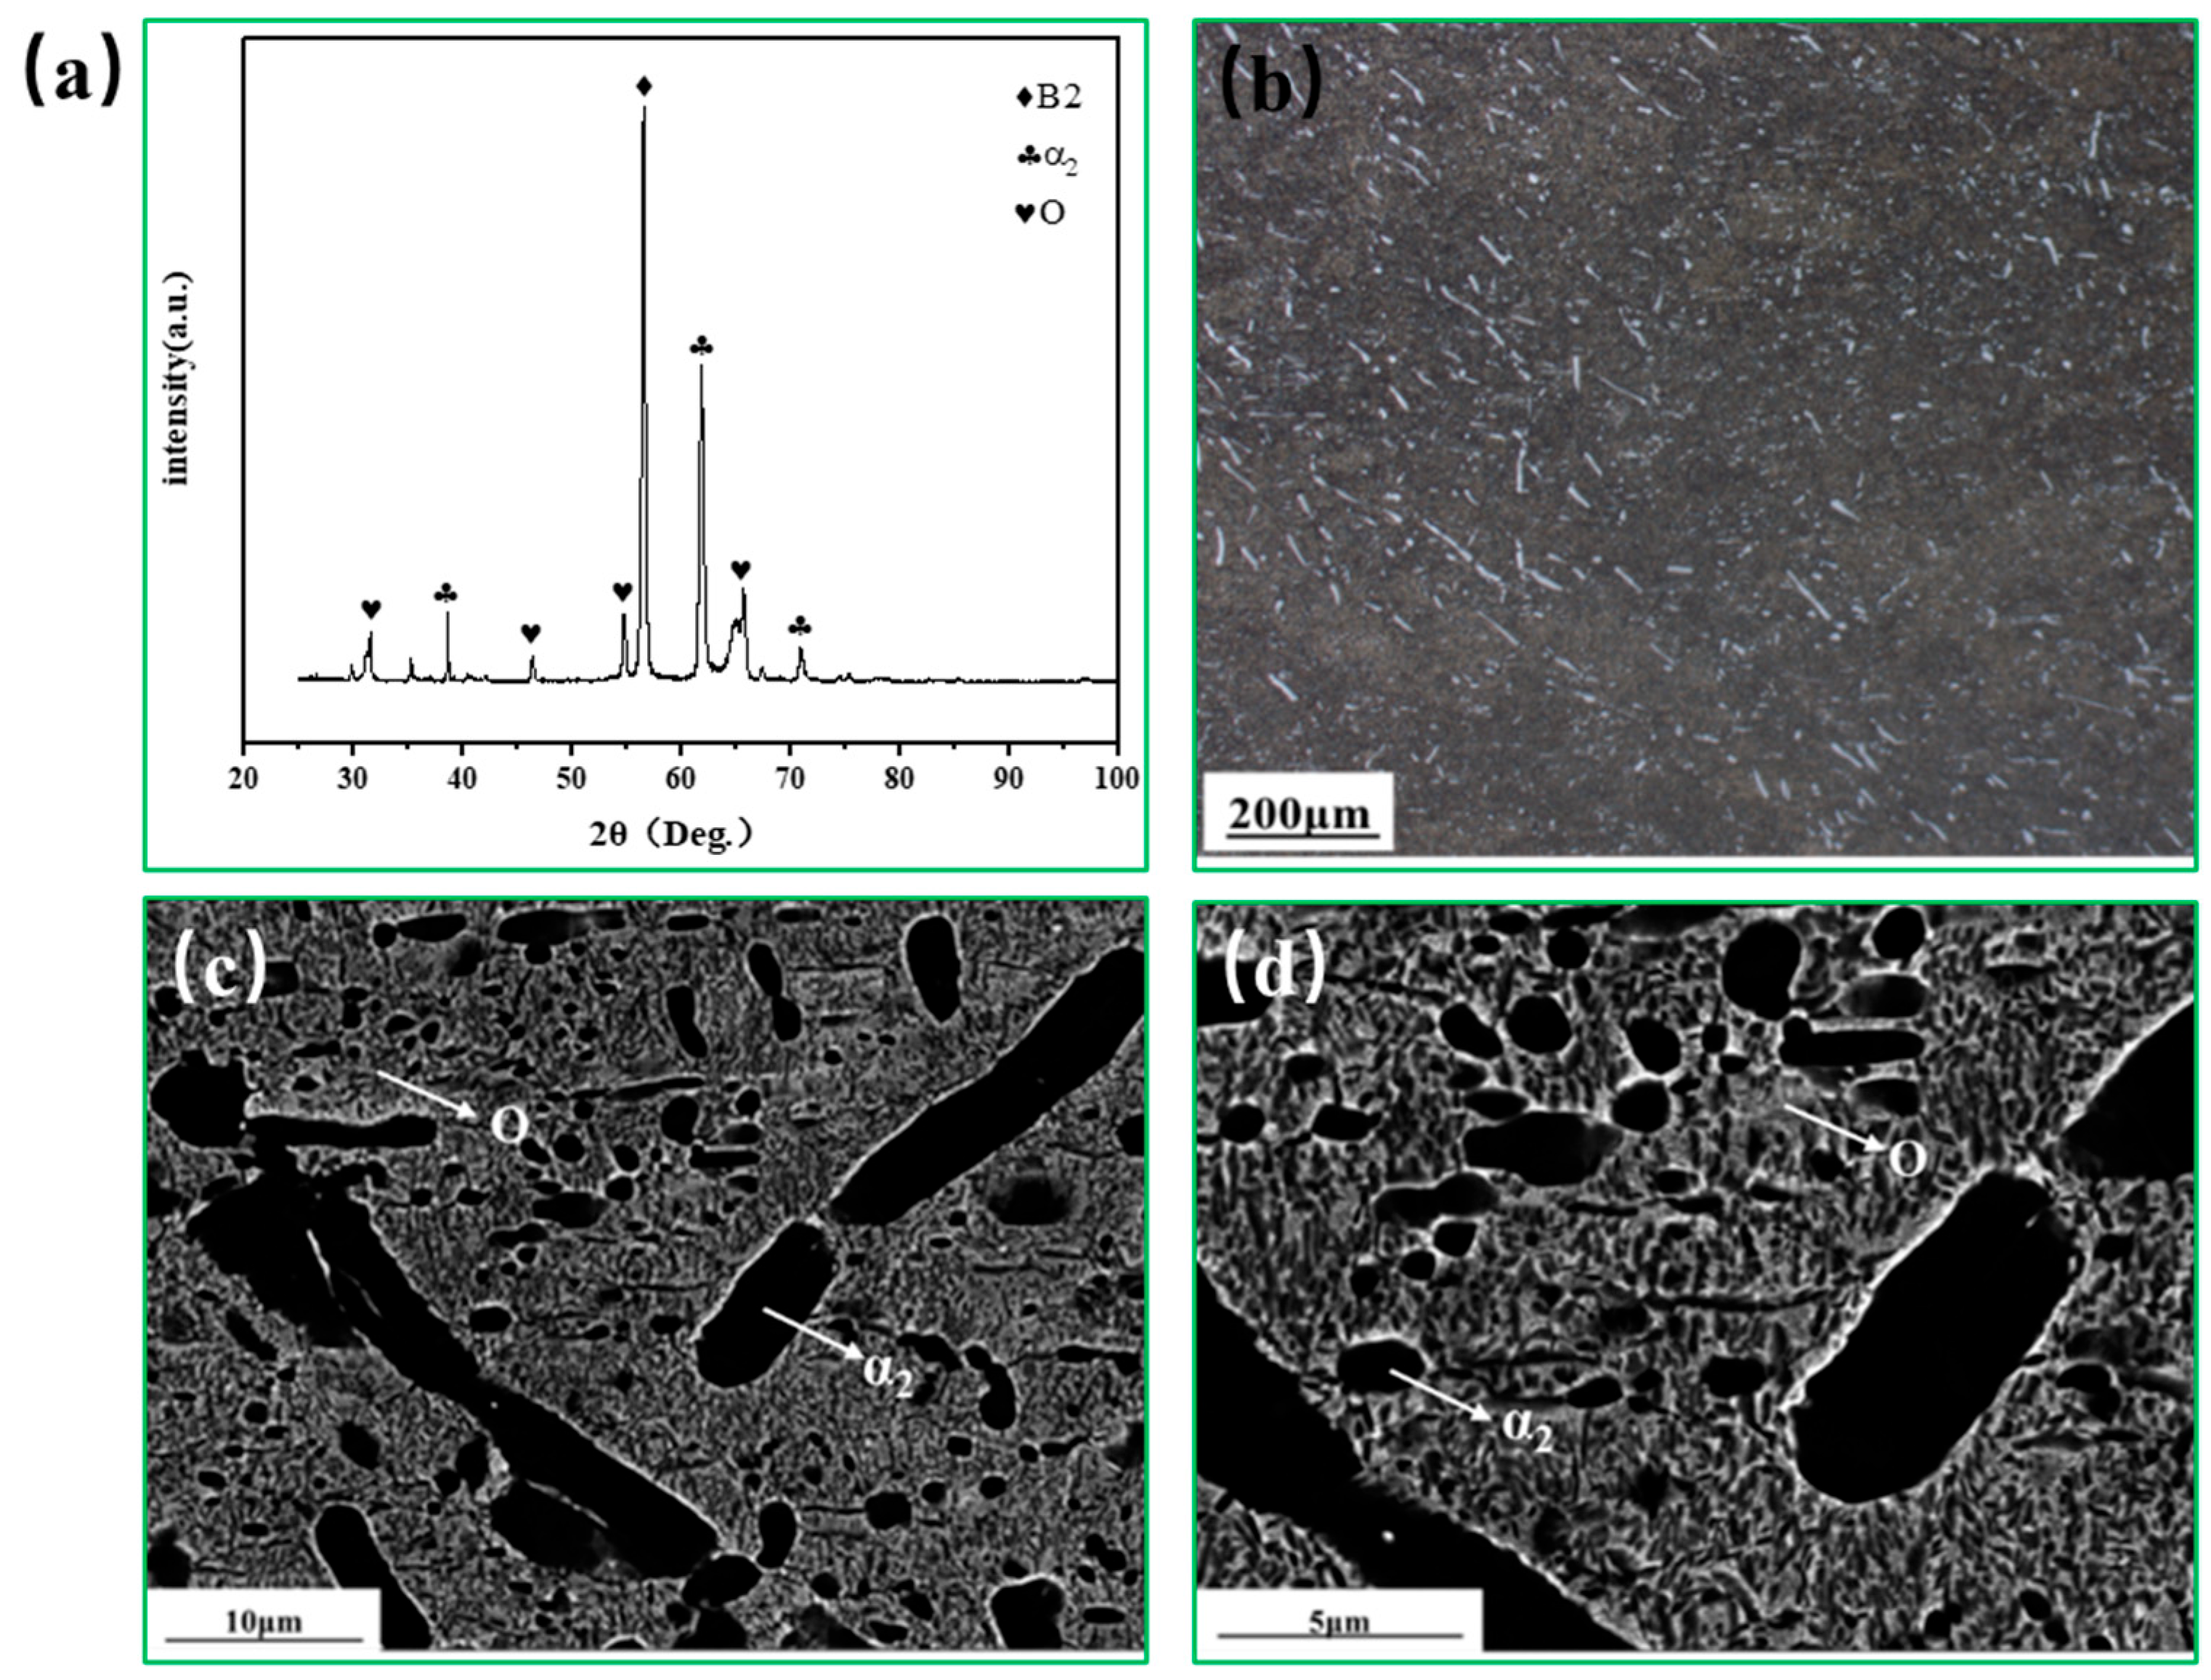
It can be seen from the microstructure of the XRD pattern of the rolled Ti2AlNb alloy in Figure 3a that the alloy was composed of three phases: α2 + B2 + O. The diffraction peak of the B2 phase was the strongest, followed by the O phase, and the α2 phase is the weakest. Rolling promotes the dissolution of O lath, but accelerates the precipitation of the acicular O phase.
In the metallographic structure of Figure 3b, the grains were equiaxed and elongated, and the grains had become fine due to rolling. Figure 3c,d are the microstructure images of the Ti2AlNb alloy.
The grain sizes of the equiaxed α2 phase were measured by Image-Pro Plus6.0 software to be about 2 μm, and some α2 was long-strip. During the air-cooling process after rolling, the O phase precipitated from the matrix B2 phase in the form of lamellae, and, finally, was uniformly distributed in the B2 matrix at different needle sizes, lathed, and equiaxed. Through observation and analysis, it was found that the α2 phase was dark black, the O phase was light gray, and the B2 phase was bright white.
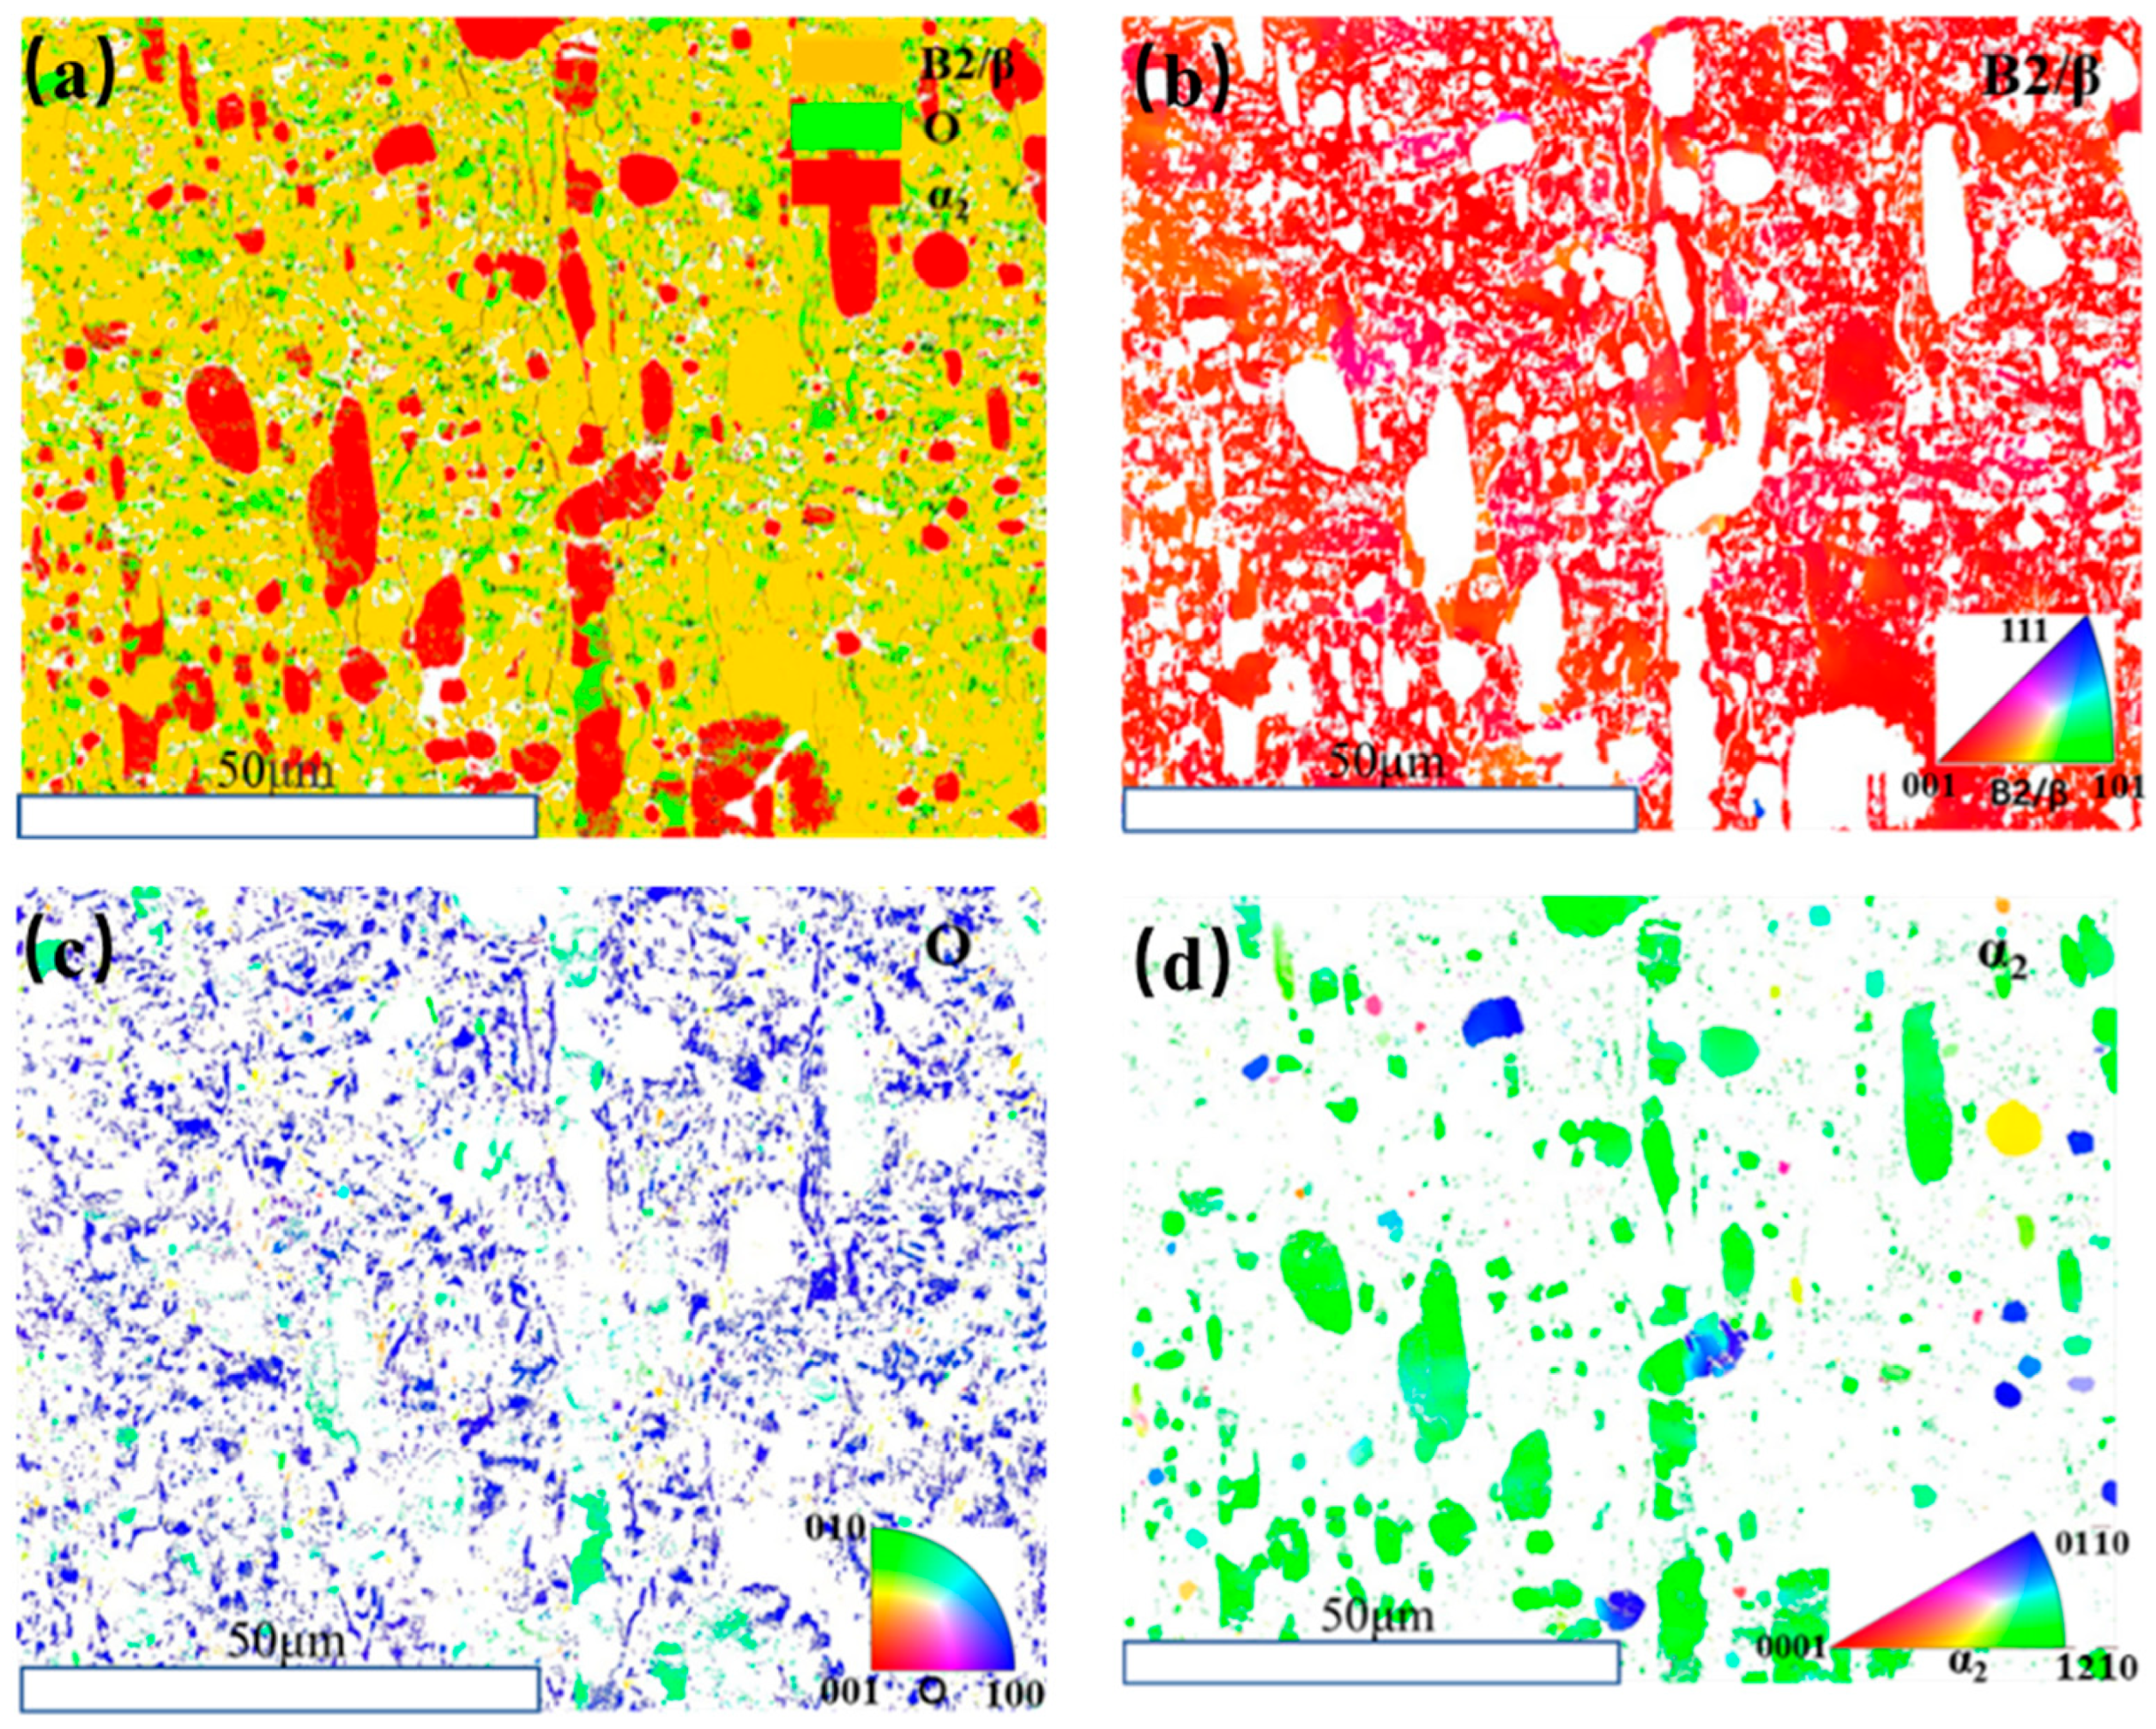
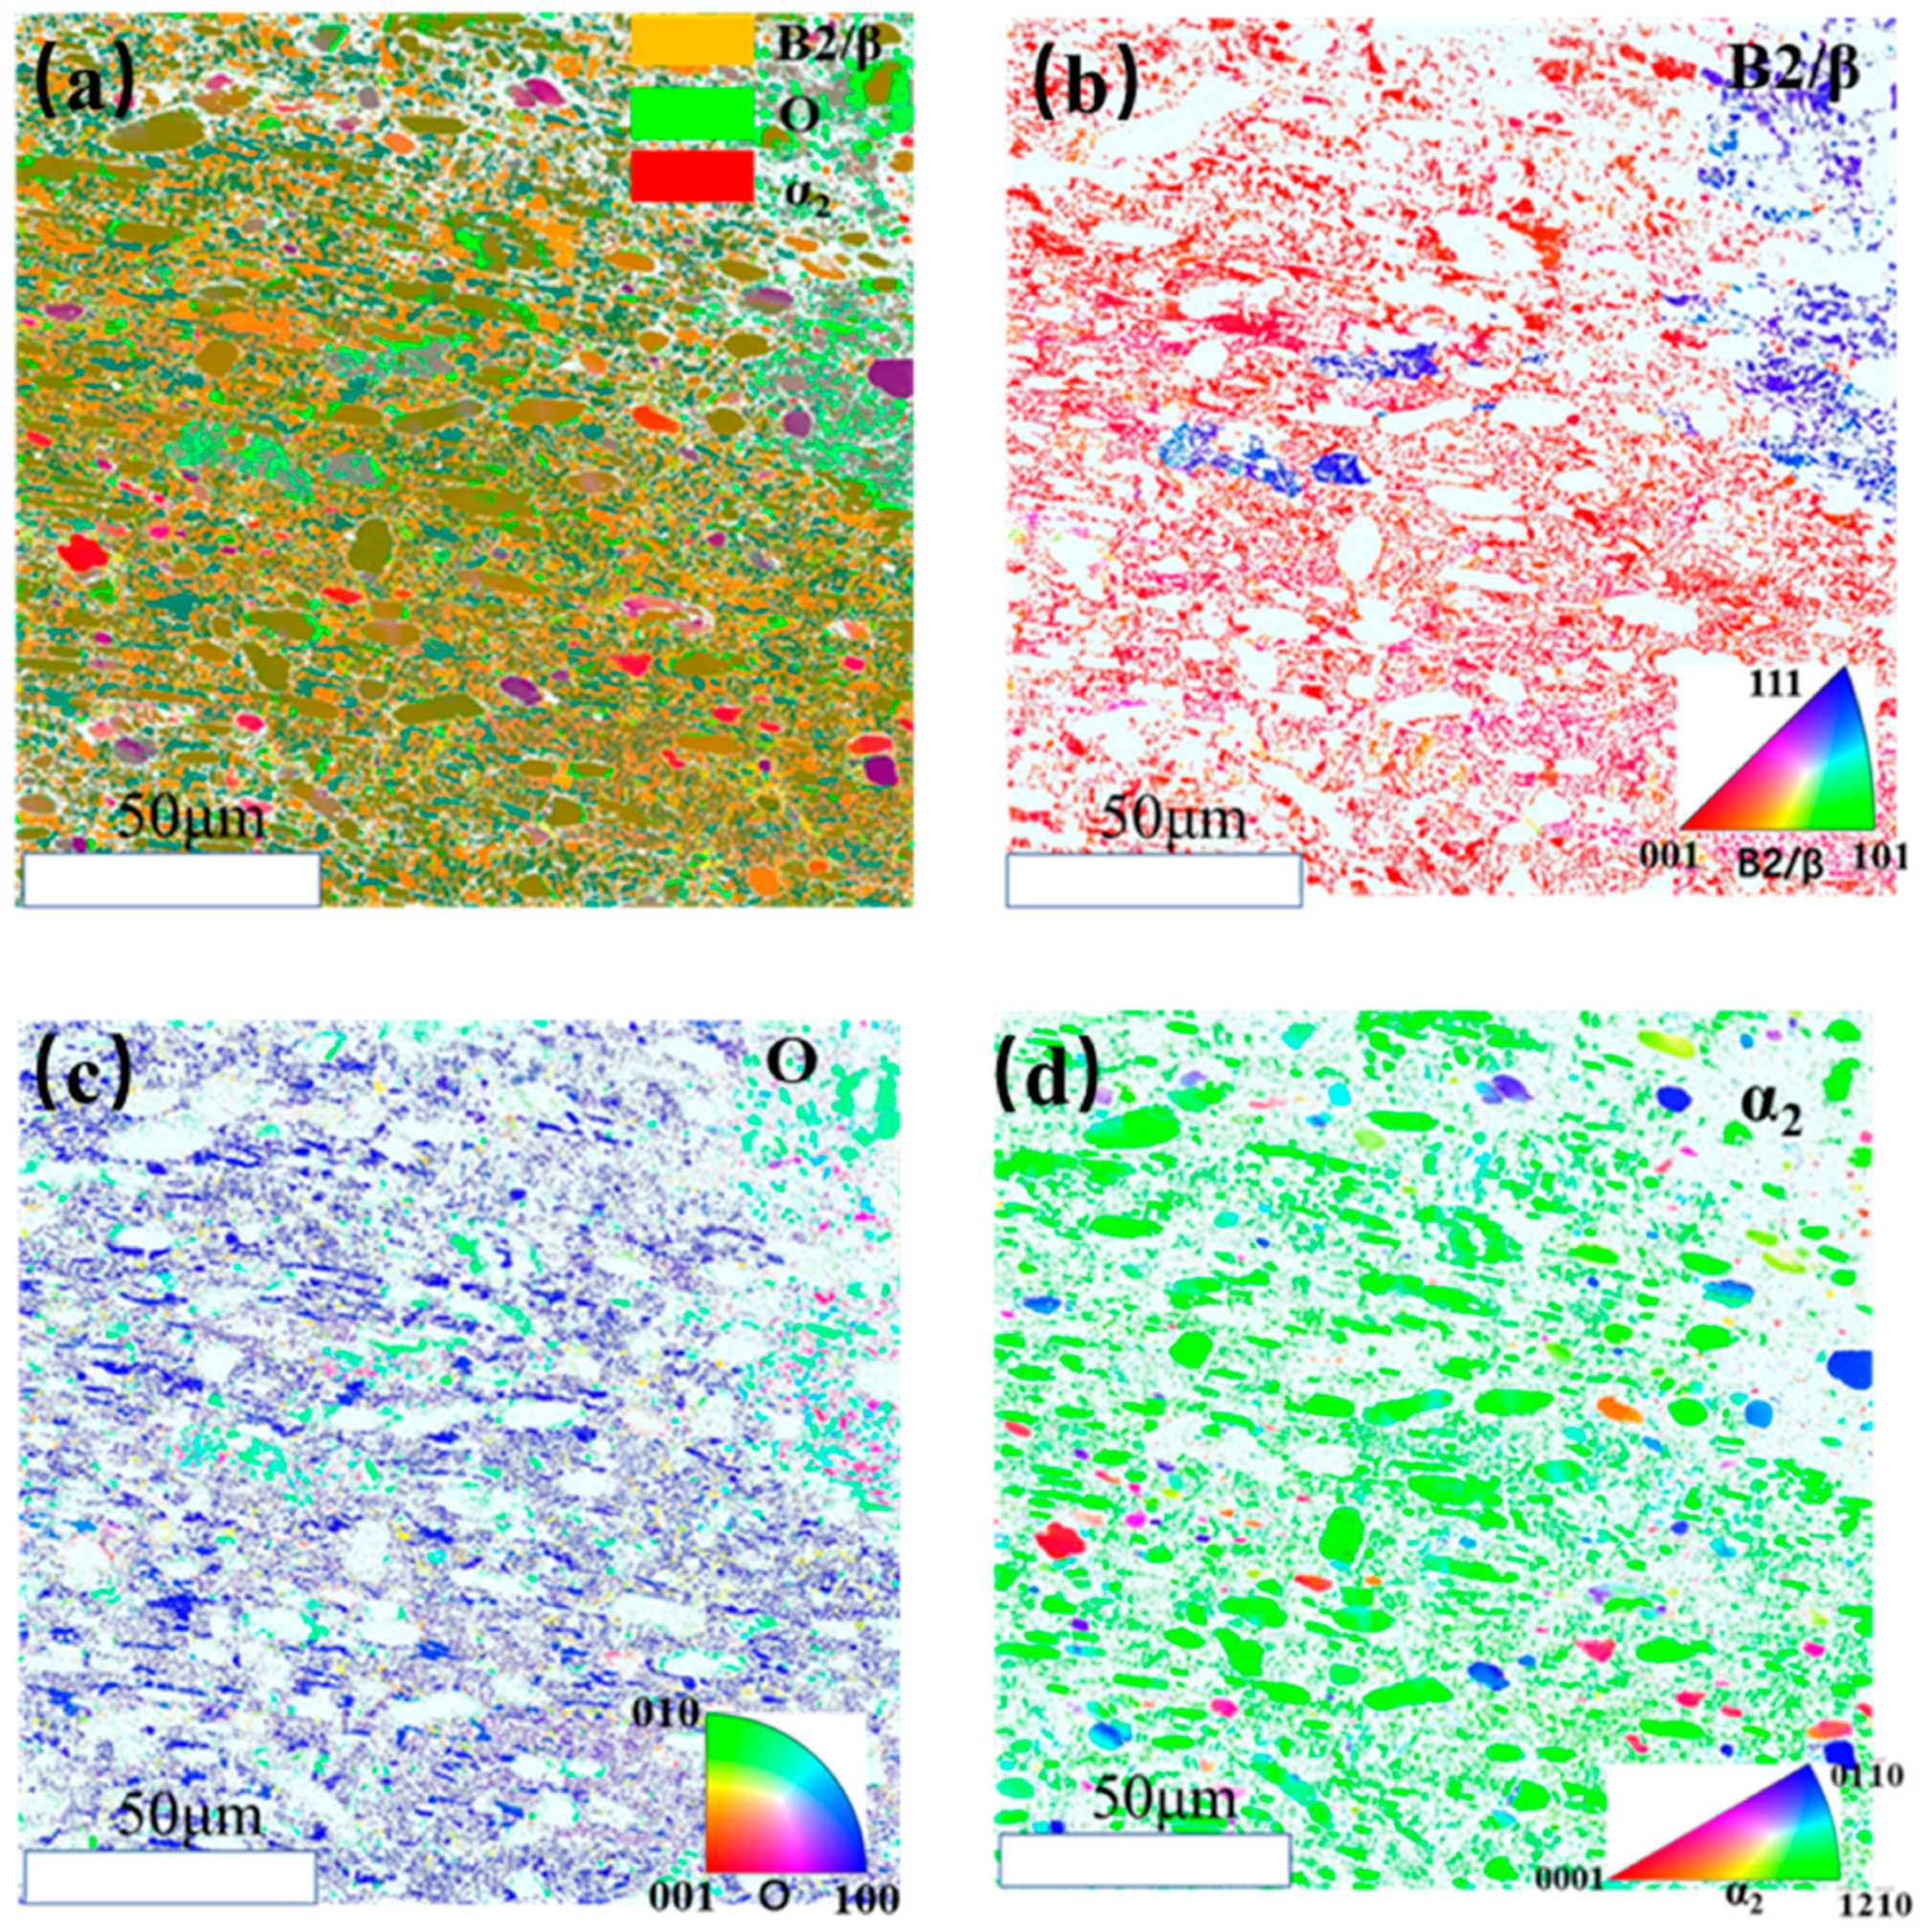
Figure 4 shows the phase diagram and grain characteristic diagram of the Ti2AlNb alloy. Due to the fast cooling rate of water after rolling, the α2 phase and O phase had not grown, as showed in Figure 4a, so the sizes were small and evenly distributed in the B2 matrix.
The volume fraction of B2/β phase was the largest, at 67.3%. Figure 4b showed that the α2 phase and O phase was densely distributed in the matrix B2 phase. It can be seen from the grain characteristic diagram of the O phase in Figure 4c that the grain size of the O phase in the matrix B2 phase was small and evenly distributed near the grain boundary [18]. The volume fraction of the O phase was 16.3%, as measured by Aztec Crystal. Because the alloy was rolled, the grain boundary was not obvious. According to the grain characteristic diagram of the α2 phase in Figure 4d, it can be seen that α2 was distributed in the grain interior in the form of long strip and equiaxed, and that some small particles with a volume fraction of 16.4% were distributed along the grain boundary [19,20]. Due to the pinning effect of the α2 phase, the grain growth of the rolled Ti2AlNb alloy was limited, and the size was 0.79 μm. Therefore, the grain size can be controlled by controlling the α2 content, thereby improving the mechanical properties of the alloy.

3.2. Microstructure Evolution of Ti2AlNb Alloy after Solution Treatment

Figure 5 shows the microstructure and XRD pattern of the Ti2AlNb alloy after solution treatment at 900 °C. From Figure 5a, it can be seen that the phase of the alloy after heat treatment was still composed of three phases, α2 + B2 + O, but the intensity of the O phase diffraction peak had weakened, while the intensity of the α2 diffraction peak had increased, causing the intensity of the B2 phase diffraction peak to increase [21,22]. From the metallographic photos in Figure 5b, it can be observed that after corrosion at the same time as the rolled alloy, the color of the alloy after heat treatment was darker, the original rolled alloy was more prone to corrosion, and the equiaxed and long strip grains increased significantly, linearly distributed in one direction.
When the rolled Ti2AlNb alloy was treated at 900 °C, it entered the α2 + B2 + O three-phase region. The O phase in the microstructure of the alloy dissolved in the B2 matrix, and the O → B2 transition occurred. The α2 phase did not decompose due to its high stability at low temperatures. However, due to the increase in temperature, the Nb element diffused, some O phases were transformed into α2 phases, and O → α2 transition occurred, resulting in an increase in the content of α2 phases and a decrease in the content of O phases.
From the low-magnification observation and analysis of the microstructure, due to the heat treatment temperature in the α2 + B2 + O three-phase region, the fine O phase first dissolved, the O → B2 transition occurred, and the content decreased, while the primary α2 phase did not dissolve [23,24]. The α2 phase was further equiaxed. Due to the inclusion reaction of α2 + B2 → O, a rimO phase existed around the α2 phase. From the local magnification of the microstructure in Figure 5d, it can be seen that the fine O phase dissolved in the B2 matrix and disappeared. The undissolved O phase grew, was equiaxed, and then was evenly distributed inside the grain. In addition, there were α2 nuclei in the equiaxed O phase, forming a spherical α2 phase in which the dark black area represented the α2 phase, the light ash area indicated the O phase, and the needle-like O phase also formed inside the lath O phase [25]. Due to the change in Nb element content after heat treatment, O → α2 transformation occurred. The lath-shaped O phase was precipitated at the grain boundary, while the thin-layer O phase was precipitated inside the grain, and the B2 → O transition occurred in this region. The undissolved O phase was coarser than the O phase precipitated from the B2 matrix at the B2 grain boundary due to its growth and high diffusivity. Due to the low energy configuration of the specific plane between the B2 and O phase boundaries, the thin O phase was precipitated inside the grain, and the grain size was refined after heat treatment.
Figure 6 shows the phase diagram and grain characteristic diagram of the alloy after solution treatment at 900 °C. It can be seen from Figure 6a that part of the α2 phase O phase was still distributed around the grain boundary, and the alloy was still based on the B2 phase. The small O phase dissolved and the number decreased. Since the rimO phase was decomposed into B2 and α2, the content of the equiaxed α2 phase increased, and the unchanged α2 phase was distributed in this region [26]. It can be seen from Figure 6b that the B2/β phase was still densely distributed around the α2 phase and the O phase, but the grain orientation changed after heat treatment. From Figure 6c, it can be seen that the fine O phase dissolved, the content was reduced, and the volume fraction was 13.4%, while the undissolved O phase transitioned to a rough state and the grain orientation also changed. Part of the O phase aggregated to form a block that was then dispersed in the B2 matrix [27,28]. From Figure 6d, it can be seen that due to the weak diffusion of Nb in the primary α2 phase, the decomposition of the α2 phase was inhibited. The granular α2 phase nucleated at the grain boundary, which is called the grain boundary α2 phase. The solid solution in the α2 + B2 + O three-phase region led to the B2 → α2 reaction, the Nb content changed, and the α2 phase was also precipitated inside the grains. The volume fraction of the α2 phase was 18.4%. The undissolved α2 and O phases grew and were equiaxed. The grain size of the alloy was 0.89 μm, higher than that of the rolled alloy.

3.3. Microstructure Evolution of Ti2AlNb Alloy after aging Treatment

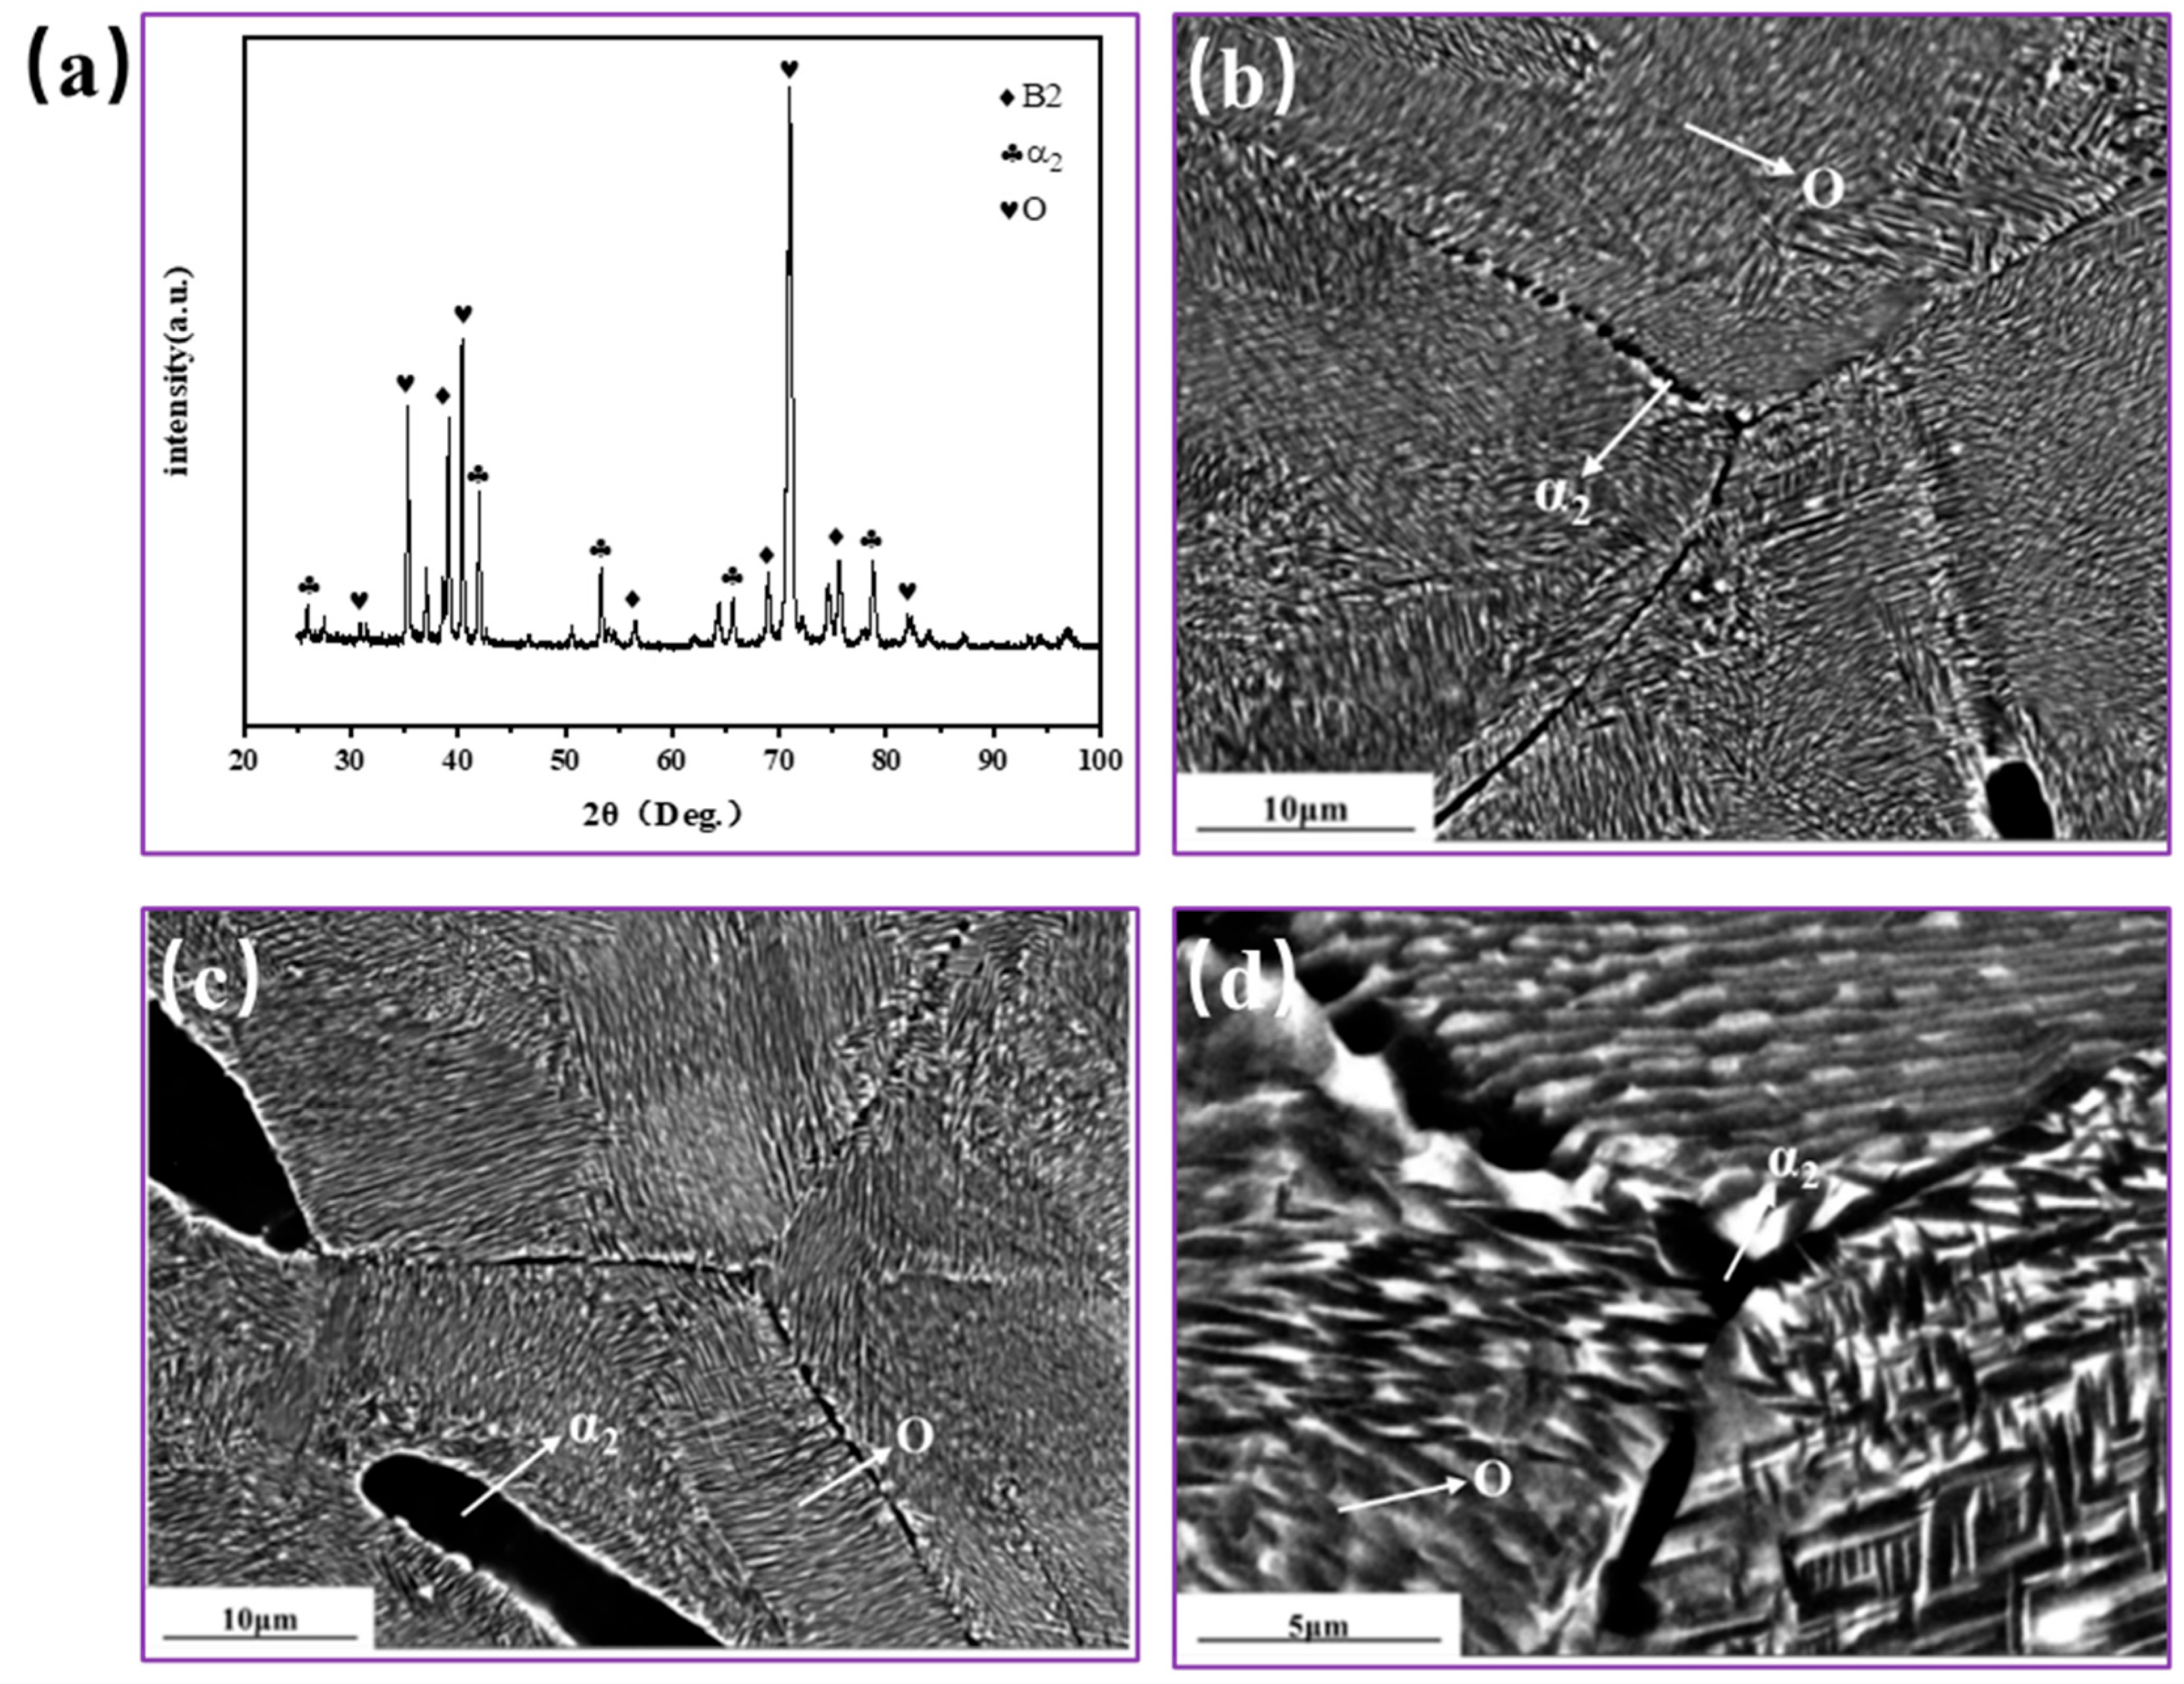
Figure 7 shows the microstructure and XRD pattern of the Ti2AlNb alloy after solution treatment at 900 °C and aging at 760 °C. It can be seen from the XRD pattern of Figure 7a that the diffraction peak intensity of O phase and α2 phase was stronger than that of a 900 °C solid solution, and the intensity of the B2 diffraction peak was weakened. From the metallographic structure diagram in Figure 7b, it can be seen that the grain size remained basically unchanged compared with the solid solution at 900 °C, and the content of the equiaxed α2 phase and O phase in the grain increased.
As can be seen from Figure 7c,d, the α2 phase was equiaxed, while the O phase was short, rod-like, and disorderly distributed in the B2 matrix. The rod-like O phase precipitated irregularly and sparsely due to aging in the α2 + B2 + O three-phase region, and the adjacent primary O phase was connected in a spherical structure, similarly to the spheroidization of α2. This was due to the termination of migration and Ostwald ripening, resulting in rod-like O static spheroidization. Due to the long aging time, the α2 phase decomposed, and the α2 → α2 + O transition occurred [29,30]. Some equiaxed α2 phases with smaller sizes were transformed into equiaxed O phases. Compared with the solid solution at 900 °C, except for the transformation of α2 into the O phase, more O phases were precipitated from the B2 matrix, and the primary lath O phase did not change with age. It was found that the sizes of the primary lath O phase and the secondary acicular O phase were different, and the α2 phase precipitated in the grains in equiaxed and long strips.
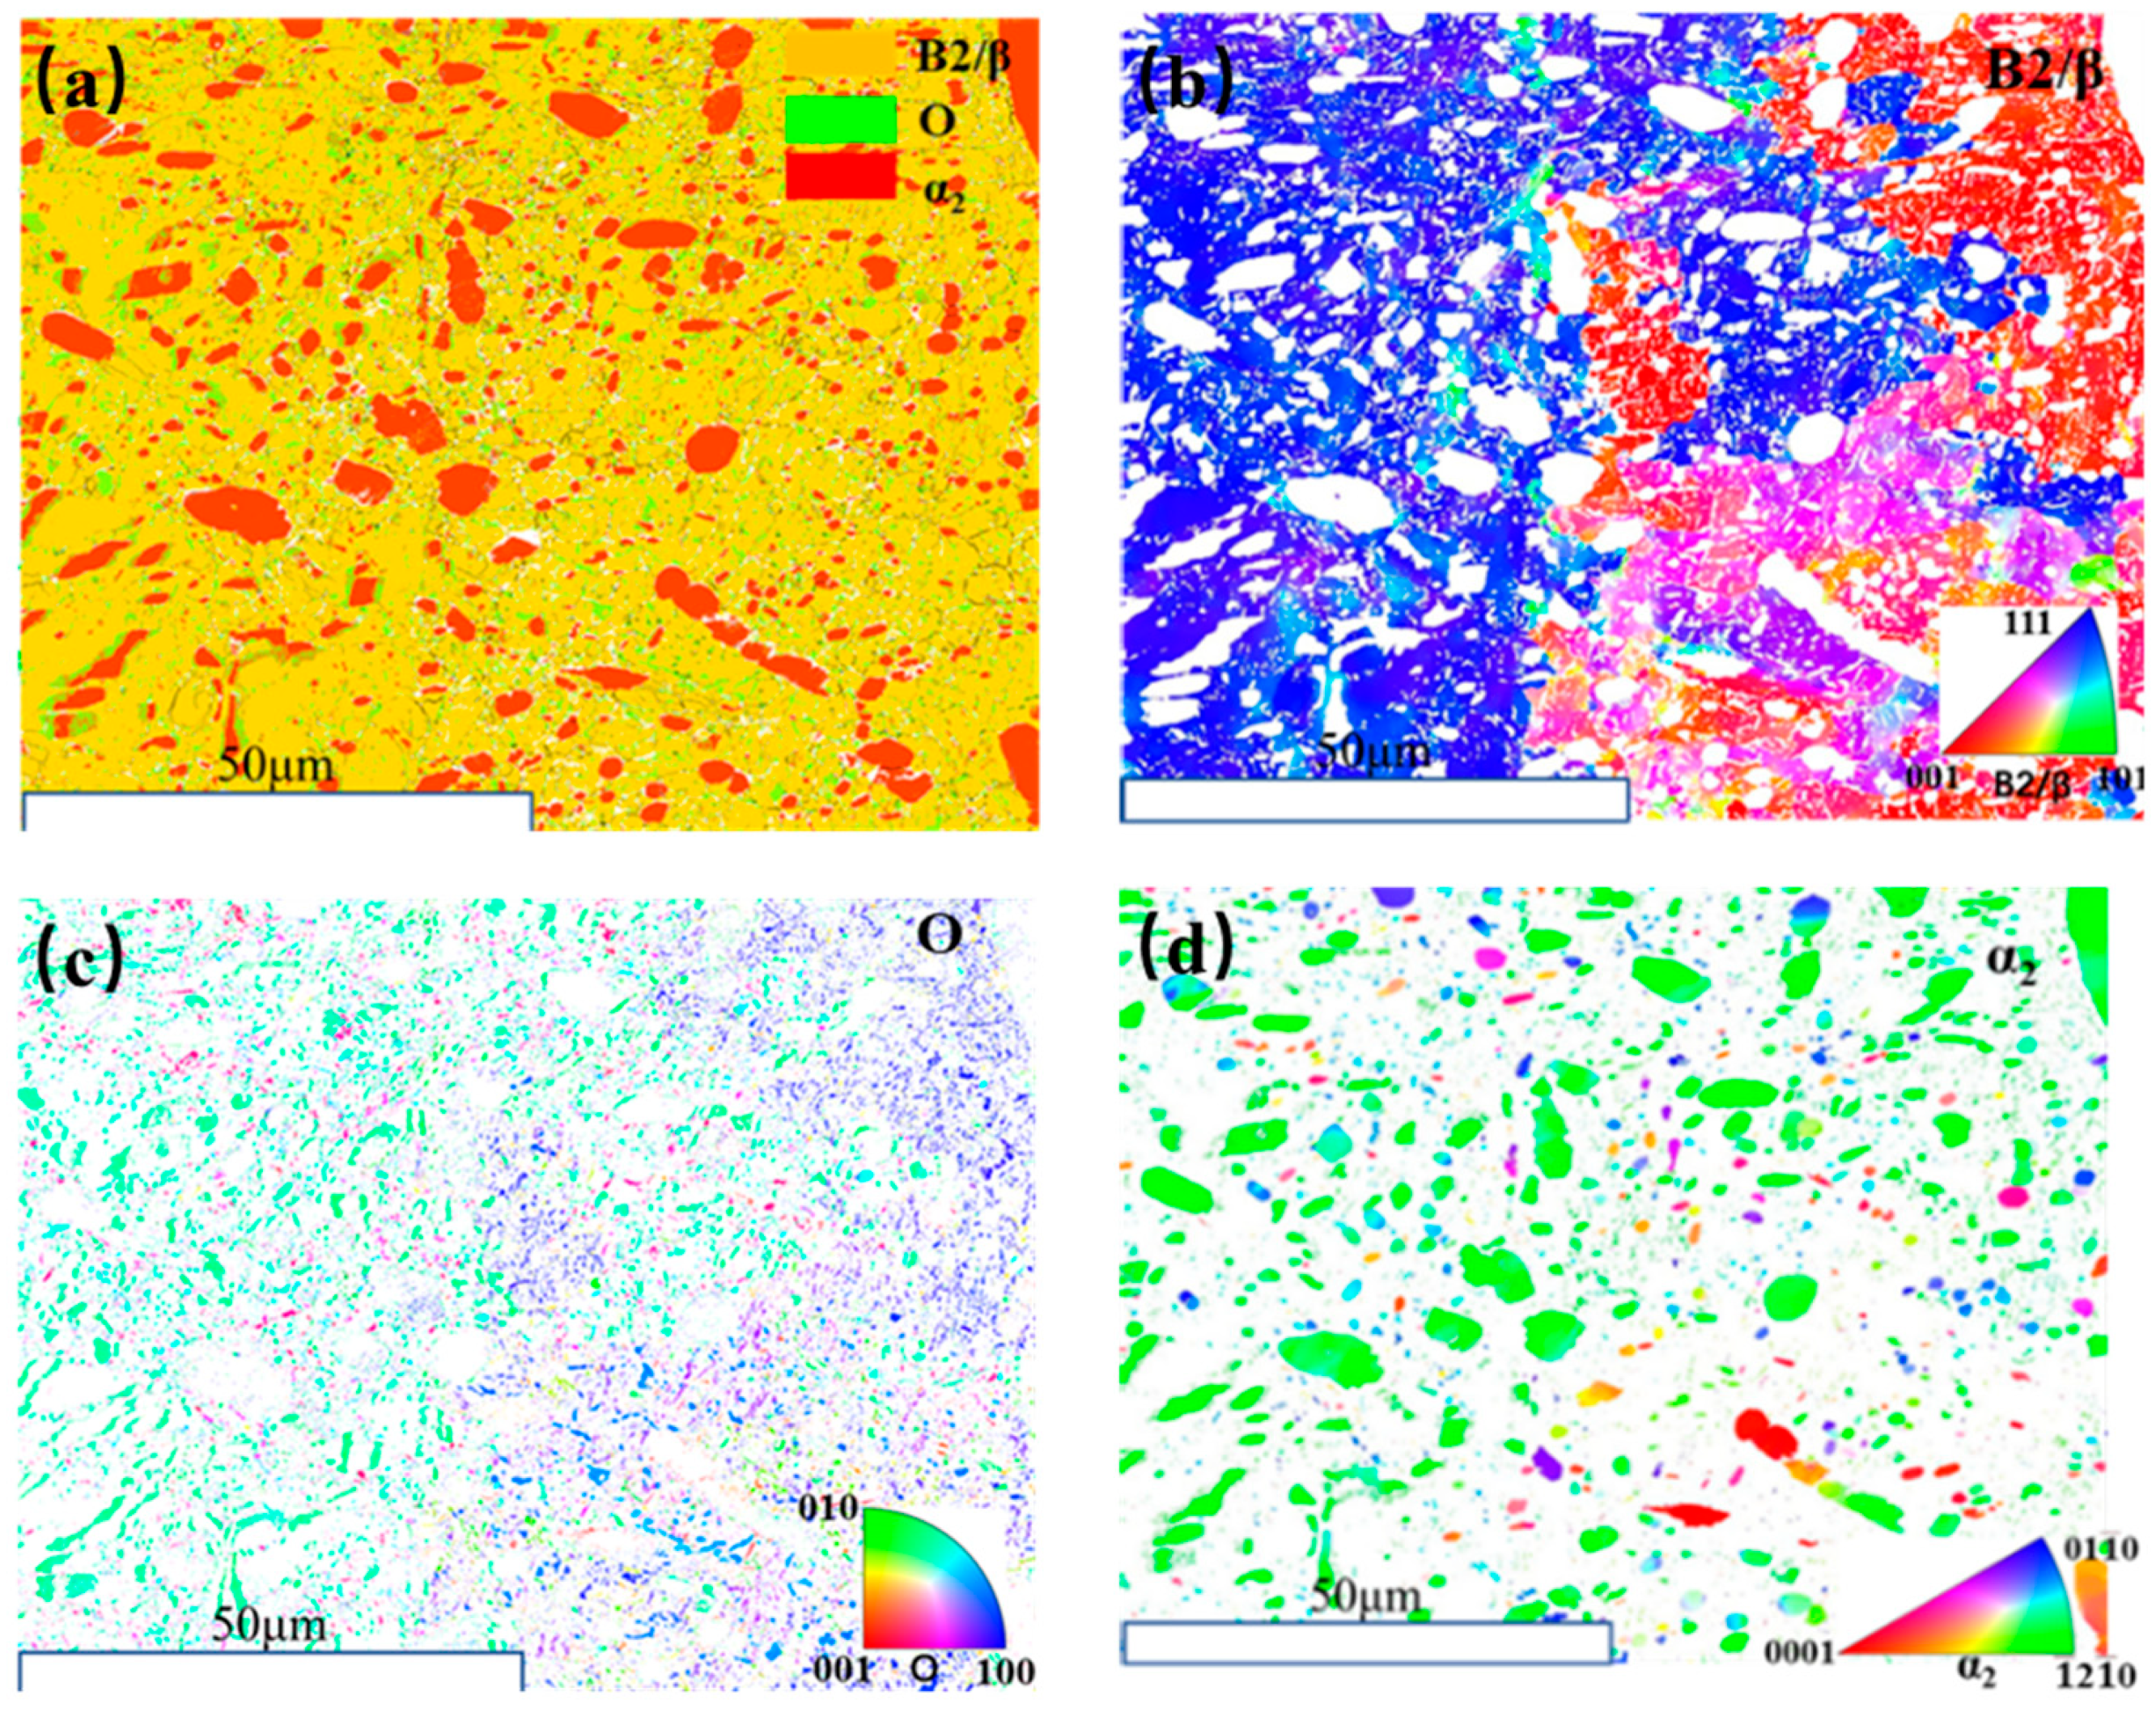
Figure 8 shows the phase diagram and grain characteristic diagram of the Ti2AlNb alloy after 900 solution treatments and aging at 760 °C. It can be seen from Figure 8a that the primary lath O phase, secondary acicular O lath, and equiaxed O/α2 phase were dispersed in the B2 matrix. In order to reduce the system’s energy, the O phase and the α2 phase were uniformly distributed in the B2 matrix. Compared with the solid solution at 900 °C, the grain size was 0.73 μm, and did not change much.
It can be seen from Figure 8b that the grain orientation changed greatly compared with the solid solution at 900 °C. Since the precipitation of the α2 phase and O phase in the B2 matrix led to an increase in their content, the volume fraction of the B2 phase decreased to 44.2%. From Figure 8c, it can be seen that the grain orientation of the O phase precipitated in the crystal was obviously different from that in the grain boundary distribution, which was due to the different formation mechanisms. The O phase near the grain boundary was generated by α2 + B2 → O, partly due to the lattice distortion of the α2 phase into the O phase. The volume fraction of the O phase was significantly higher than that of 900 °C solid solution, which was 23.9%. From Figure 8d, it can be seen that the phase transition of O → B2 and O → α2 occurred in the three-phase region during the aging of the alloy, resulting in a denser distribution of the α2 phase [31,32]. When the alloy was aged in the three-phase region, B2 → α2 and O → α transformation occurred. Due to the mechanical displacement, O → α2 transformation occurred, resulting in an increase in the α2 phase content.
Figure 9 shows the microstructure picture and XRD pattern of the Ti2ANb alloy after solution treatment at 900 °C and aging at 840 °C. From the XRD pattern shown in Figure 9a, it can be seen that the diffraction peak intensity of the α2 phase was weakened, and the diffraction peak intensity of the O phase was enhanced. There were O, α2, and B2 phases present in the aging process, and the phases were balanced.
From Figure 9b–d, it can be seen that the microstructure of the alloy was composed of fine lath α2 and O phases, an acicular O phase, an equiaxed and long-strip α2 phase, and a matrix B2 phase, and the aging microstructure was a double-sized lamellar O phase. With the increase in aging temperature, needle-like phases with different widths appeared inside the B2 grains, and the secondary needle-like O became shorter and thicker than that aged at 760 °C. This was due to the improvement of the B2 grain boundary’s diffusion ability and the growth of the residual O phase. The distribution of the O phase was more dense, and the content was greatly increased. The α2 phase was precipitated from the B2 matrix in a needle shape 1~2 μm in size, but its content was reduced. This is due to the dissolution of the α2 phase during furnace cooling, for which the alloy was kept in the α2 + B2 + O three-phase region and then annealed in the α2 + O two-phase region, resulting in the decomposition of the α2 phase and the precipitation of the O phase [33,34]. The coarse, long-strip α2 phase was distributed along the grain boundary and extended continuously along it. Its growth stopped when it met other phases. There were a large number of needle-like O phases around it, which provided conditions for the nucleation of the O phase, which was also the reason for the substantial increase in O phase content. Due to the existence of the α2 phase, the grain size changes little.
Figure 10 shows the phase diagram and grain characteristic diagram of the Ti2AlNb alloy after solution treatment at 900 °C and aging at 840 °C. It can be seen from Figure 10a that as the aging temperature increased to 840 °C, and the sample was based on the O phase, which dispersed with the α2 phase and B2 phase. From Figure 10b, it can be seen that the B2 phase was dispersed into fine equiaxed grains, and the volume fraction was significantly lower than that achieved by aging at 760 °C, which was 19.5%.
From Figure 10c, it can be seen that the alloy structure was composed of numerous needle-like O phases with different matrix sizes. The morphology of the O precipitates was quite different from that of the 900 °C solid solution state [35]. The α2 phase changed to the O phase due to lattice distortion. At the same time, the secondary acicular O phase further precipitated from the B2 matrix with the increase in aging temperature, and the volume fraction increased to 68.9%. Due to the interconnection, it was difficult to obtain size statistics [20]. From Figure 10d, it can be seen that compared with aging at 760 °C, the equiaxed α2 phase disappeared, the O phase matrix was finely distributed, it was dispersed and aggregated in different regions, and the volume fraction reduced to 11.6%. The grain size of the alloy was 0.70 μm, and it changed little with the increase in aging temperature.
The phase volume fraction and average grain/particle size of the Ti2AlNb alloy under rolling and heat treatment conditions are shown in Table 3.

3.4. Hardness of Ti2AlNb Alloy after Heat Treatment

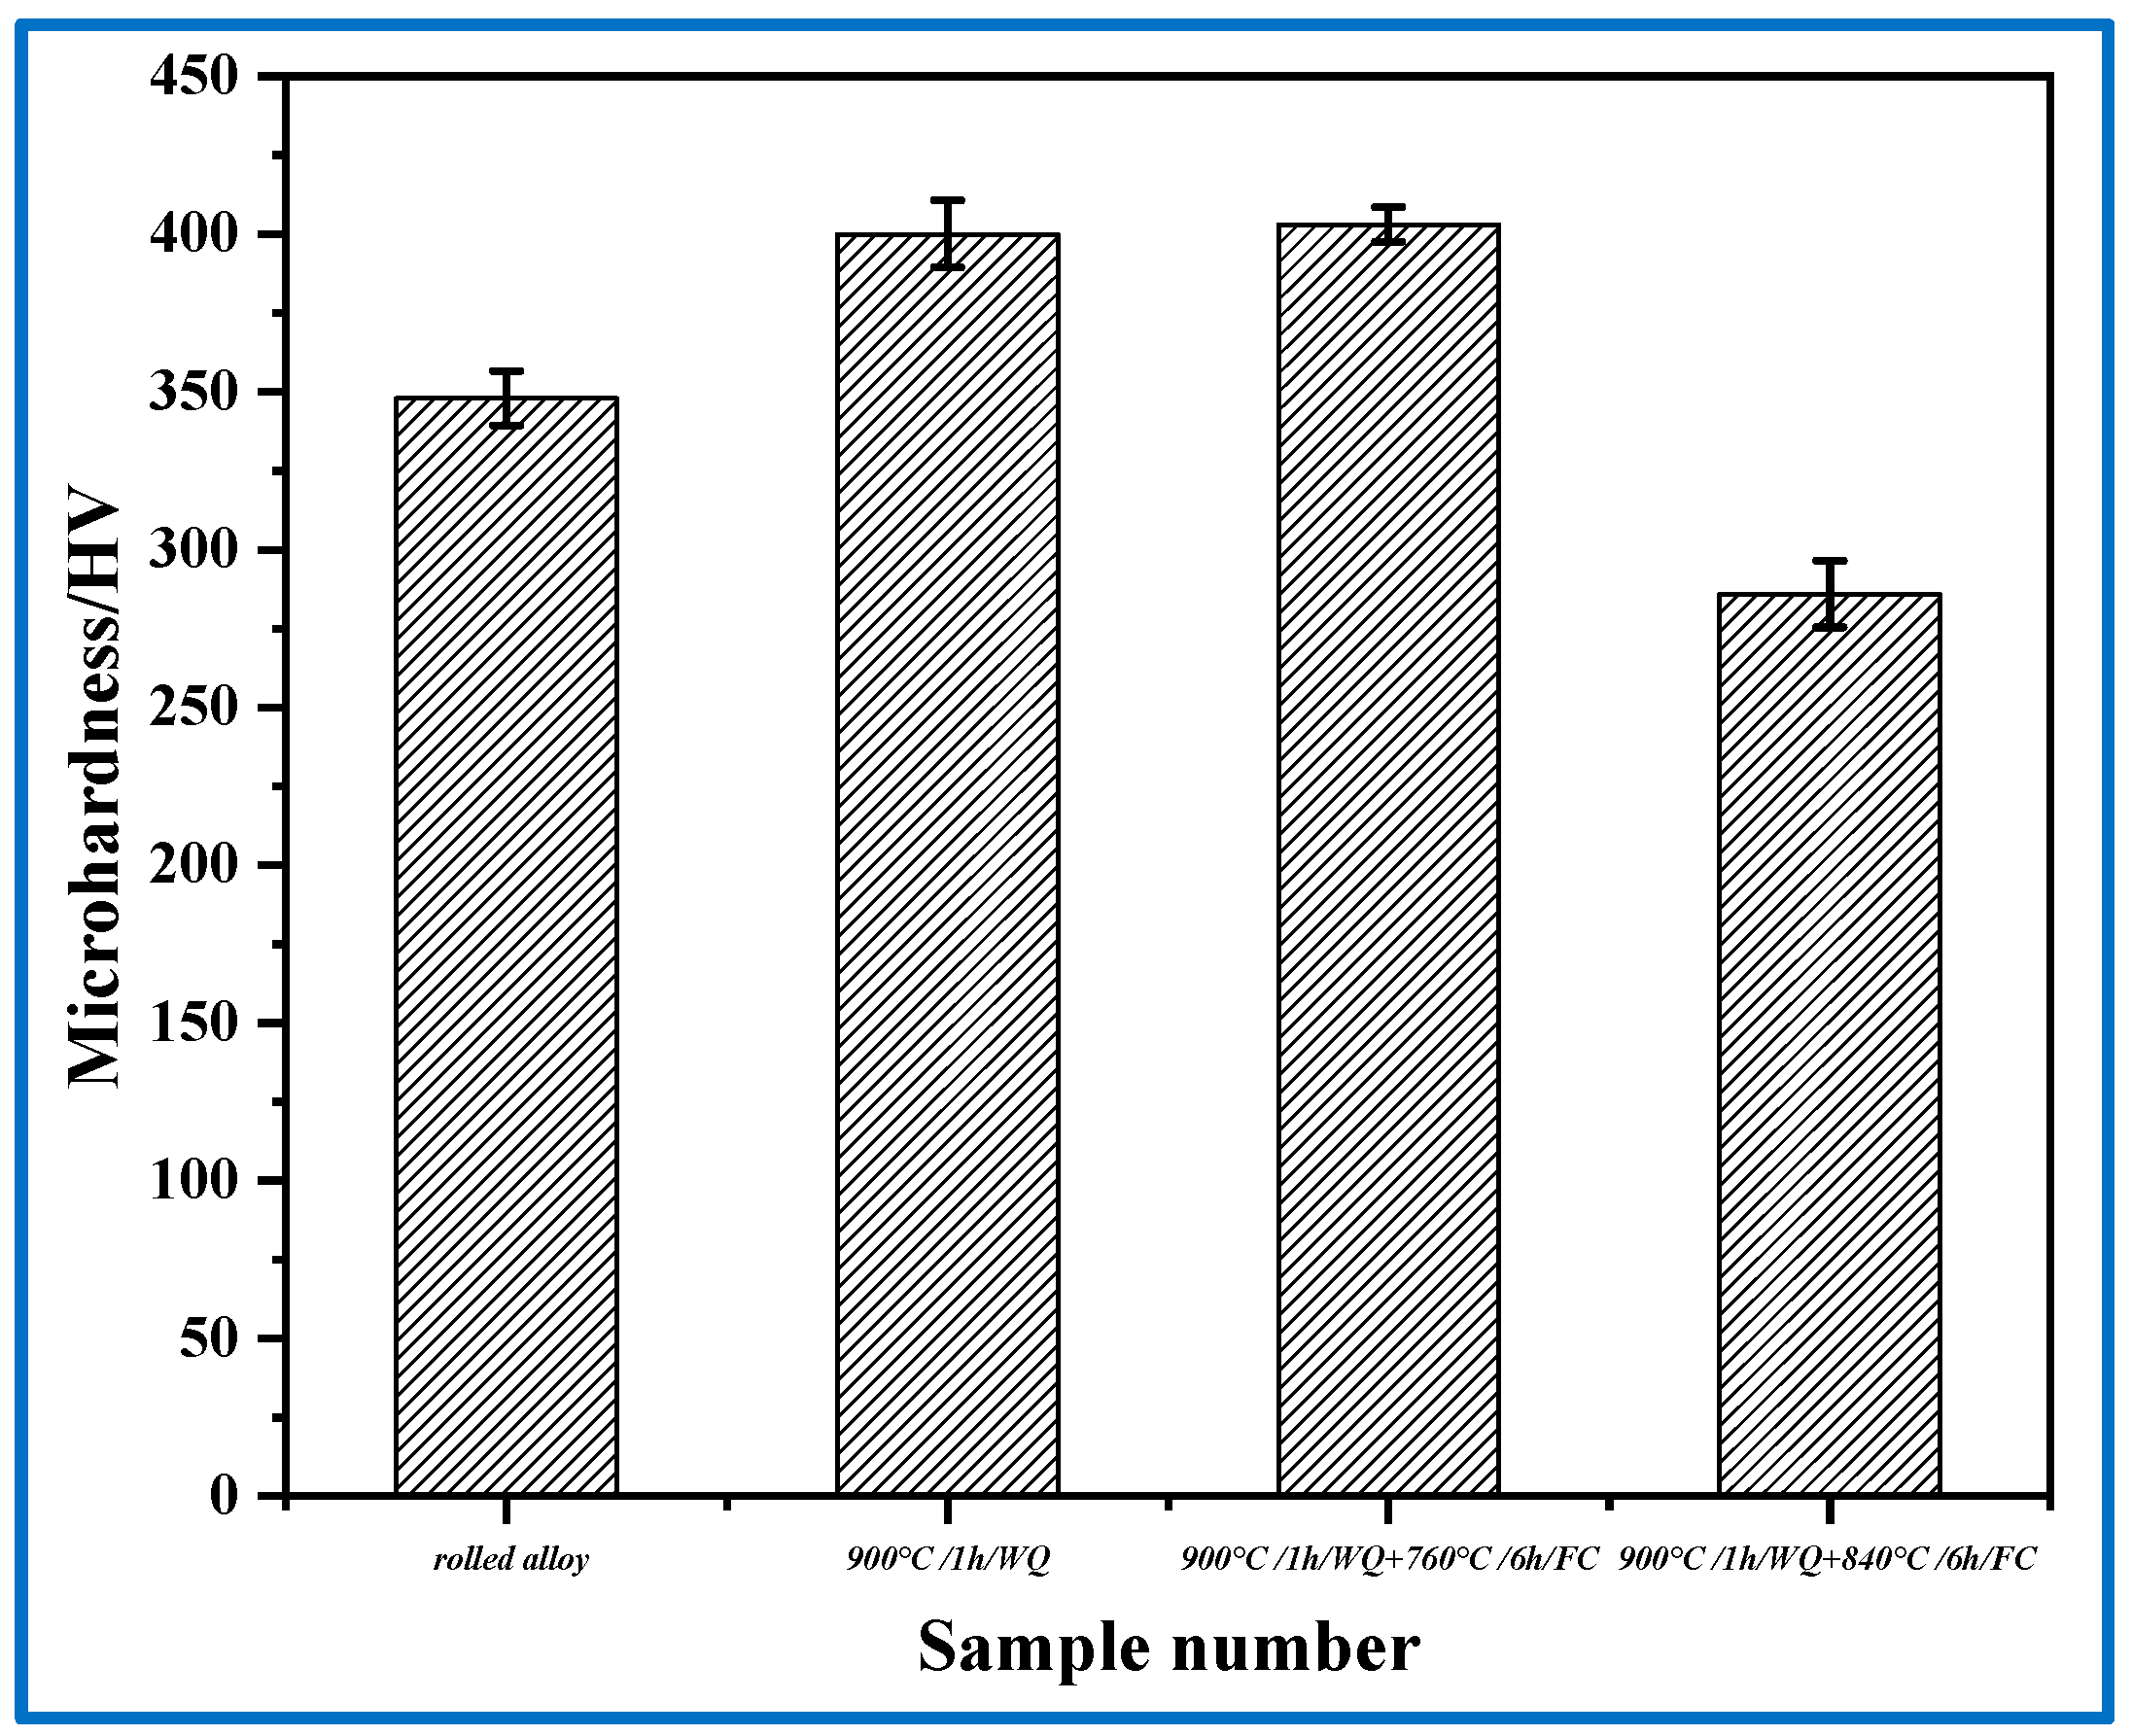
Figure 11 shows the Vickers hardness of the Ti2AlNb alloy. It can be seen from the figure that the hardness of the original rolled Ti2AlNb alloy was 348 HV. After solid solution at 900 °C, the lath O phase dissolved in the B2 matrix, but the brittle, hard α2 phase precipitated from the B2 matrix. The volume fraction of the O phase decreased by 2.9%, while the volume fraction of the α2 phase increased by 2%. At this time, the Vickers microhardness of the alloy increased, and the hardness value was 400 HV. It can be seen that the increase in the hardness of the α2 phase relative to the alloy was higher than that of the O phase.
The hardness of the Ti2AlNb alloy after 900 °C/1 h/WC + 760 °C/6 h/FC was 402 HV. Compared with the solid solution treatment at 900 °C, the volume fraction of the brittle O phase increased by 10.5%, and the volume fraction of the brittle α2 phase increased by 13.5% after aging treatment. The secondary fine acicular α2/O phase was uniformly distributed in the matrix, and the Vickers hardness of the alloy increased [36]. The undissolved α2 phase and O phase were equiaxed, which strengthened the matrix and increased the hardness.
With the increase in aging temperature, the hardness decreased due to the change in the phase composition after aging treatment. When the aging treatment was carried out in the α2 + O + B2 three-phase region, as the aging temperature increased from 760 °C to 840 °C, the atomic diffusion rate increased, and the O phase and α2 phase were formed in the alloy. After the heat preservation grew, the grain size became larger and the hardness of the alloy decreased.
The secondary acicular O phase precipitated during aging treatment had a better strengthening effect. With the precipitation of more secondary acicular O phases, the alloy treated in the α2 + B2 + O three-phase region showed greater microhardness after aging treatment. In addition, due to the formation of the secondary needle-like O phase, the microhardness of the alloy was restored to its original strength. Compared with the direct solid solution alloy, the hardness was significantly improved. The alloy with the O phase had a higher microhardness value than that with the B2 phase.

4. Conclusions

In this study, the influences of heat treatment, including solution and aging, on the microstructure and mechanical properties of rolled Ti2AlNb were systematically studied. The major results and findings were as follows. After solution treatment at 900 °C, the O phase and α2 phase of the rolled Ti2AlNb alloy were transformed into the B2 phase, and the volume fraction of the B2 phase gradually increased. The undissolved α2/O phase was equiaxed and subsequently grew, and the B2 phase grains were recrystallized and subsequently grew.
After solution treatment at 900 °C (in the α2 + B2 + O three-phase region), the alloy was aged at 760 °C and 840 °C, respectively, and the acicular O phase was precipitated from the B2 matrix. The microstructure mainly included the secondary precipitated acicular O phase, the equiaxed α2 phase, and the B2 matrix. The size and volume fraction of the secondary precipitated acicular O phase were dependent upon the aging temperature. The number of pre-nucleated particles in the secondary acicular O phase depended on the previous solution’s temperature. When the aging temperature was 840 °C, the precipitation phase size was at its largest, while the aging treatment at 760 °C yielded the smallest precipitation size. With the increase in the aging temperature, the volume fraction of the secondary precipitated needle O phase increased, while the coarse primary lath O phase formed during the solid solution process was almost unaffected by the aging temperature. There were many very fine α2 phases in the sample after solutioning at 900 °C and aging at 760 °C. When the aging temperature was increased to 840 °C, the number of fine lath α2 phases was small, and the grain boundary α2 phase lath was coarse. At the same aging temperature, with the increase in the solution’s temperature, the fine O phase was reduced. With the increase in the aging temperature, the hardness of the alloy decreased, as the O → B2/O → α2 phase transformation consumed the O phase that produced the precipitation hardening effect. The coarse O phase lath was caused by the increase in the grain boundary diffusion ability of the B2 phase and the growth of the residual O phase. The residual strain energy of the alloy disappeared after solution treatment, and the order of the O phase was broken. During the aging process, coarse O laths appeared due to Ostwald ripening. The length of the coarse O slab was different, and the width remained basically unchanged with the increase in temperature. In order to reduce the energy of the system, the multi-shaped O phase was uniformly distributed in the matrix, and the needle-like O phase was coarsened due to the greater amount of active energy provided by the higher temperature.

Author Contributions

Conceptualization, X.L.; investigation, T.L.; writing—original draft preparation, T.L.; writing—review and editing, X.L. and B.W.; funding acquisition, X.L. All authors have read and agreed to the published version of the manuscript.

Funding

This research was funded by the National Key R&D Program of China (No. 2020YFA0405900), the National Natural Science Foundation of China (No. 52271104), and the Natural Science Foundation of Heilongjiang Province of China (No. YQ2020E030).

Institutional Review Board Statement

Not applicable.

Informed Consent Statement

Not applicable.

Data Availability Statement

Not applicable.

Acknowledgments

The authors would like to acknowledge the financial support provide by the National Key R&D Program of China (No. 2020YFA0405900), the National Natural Science Foundation of China (No. 52271104), and the Natural Science Foundation of Heilongjiang Province of China (No. YQ2020E030).

Conflicts of Interest

The authors declare no conflict of interest.

References

  1. Chao, Q.; Cizek, P.; Wang, J. Enhanced Mechanical Response of an Ultrafine Grained Ti-6Al-4V Alloy Produced through Warm Symmetric and Asymmetric Rolling. Mater. Sci. Eng. A 2016, 650, 404–413. [Google Scholar] [CrossRef]
  2. Zheng, X.; Zheng, S.; Wang, J. Twinning and Sequential Kinking in Lamellar Ti-6Al-4V Alloy. Acta Mater. 2019, 181, 479–490. [Google Scholar] [CrossRef]
  3. Banerjee, D.; Gogia, A.K.; Nandi, T.K. A New Ordered Orthorhombic Phase in a Ti3Al-Nb Alloy. Acta Metall. 1988, 36, 871–882. [Google Scholar] [CrossRef]
  4. Katoh, Y.; Vasudevamurthy, G.; Nozawa, T.; Snead, L.L. Properties of zirconium carbide for nuclear fuel applications. J. Nucl. Mater. 2013, 441, 718–742. [Google Scholar] [CrossRef]
  5. Zhang, Y.; Liu, Y.; Yu, L. Microstructures and Tensile Properties of Ti2AlNb and Mo-Modified Ti2AlNb Alloys Fabricated by Hot Isostatic Pressing. Mater. Sci. Eng. A 2020, 776, 139043. [Google Scholar] [CrossRef]
  6. Mao, Y.; Li, S.; Zhang, J. Microstructure and Tensile Properties of Orthorhombic Ti-Al-Nb-Ta Alloys. Intermetallics 2000, 8, 659–662. [Google Scholar] [CrossRef]
  7. Kumpfert, J. Intermetallic Alloys Based on Orthorhombic Titanium Aluminide. Adv. Eng. Mater. 2001, 3, 851–864. [Google Scholar] [CrossRef]
  8. Das, K.; Das, S. Order-Disorder Transformation of the Body Centered Cubic Phase in the Ti-Al-X(X = Ta, Nb, or Mo) System. J. Mater. Sci. 2003, 38, 3995–4002. [Google Scholar] [CrossRef]
  9. Yang, J.; Cai, Q.; Ma, Z. Effect of W Addition on Phase Transformation and Microstructure of Powder Metallurgic Ti-22Al-25Nb Alloys during Quenching and Furnace Cooling. Chin. J. Aeronaut 2019, 32, 1343–1351. [Google Scholar] [CrossRef]
  10. Hagiwara, M.; Emura, S.; Araoka, A. Enhanced Mechanical Properties of Orthorhombic Ti2AlNb-Based Intermetallic Alloy. Met. Mater. Int. 2003, 9, 265–272. [Google Scholar] [CrossRef]
  11. Germann, L.; Banerjee, D.; Gu’edou, J.Y. Effect of Composition on the Mechanical Properties of Newly Developed Ti2AlNb-based Titanium Aluminide. Intermetallics 2005, 13, 920–924. [Google Scholar] [CrossRef]
  12. Zhao, H.; Lu, B.; Tong, M. Tensile Behavior of Ti-22Al-24Nb-0.5Mo in the Range 25–650 °C. Mater. Sci. Eng. A 2016, 679, 455–464. [Google Scholar] [CrossRef]
  13. Jiao, X.; Liu, G.; Wang, D. Creep Behavior and Effects of Heat Treatment on Creep Resistance of Ti-22Al-24Nb-0.5Mo Alloy. Mater. Sci. Eng. A 2016, 680, 182–189. [Google Scholar] [CrossRef]
  14. Yang, J.; Cai, Q.; Liu, Y. Herringbone Structure and Significantly Enhanced Hardness in W-Modified Ti2AlNb Alloys by Spark Plasma Sintering. Met. Mater. Int. 2019, 25, 1000–1007. [Google Scholar] [CrossRef]
  15. Boehlert, C.J. The Phase Evolution and Microstructural Stability of an Orthorhombic Ti-23Al-27Nb Alloy. J. Phase Equilibria 1999, 20, 101–108. [Google Scholar] [CrossRef]
  16. Zhan, H.; Kent, D.; Wang, G.; Dargusch, M.S. The dynamic response of a β titanium alloy to high strain rates and elevated temperatures. Mater. Sci. Eng. A 2014, 607, 417–426. [Google Scholar] [CrossRef]
  17. Lai, M.J.; Li, T.; Raabe, D. ω phase acts as a switch between dislocation channeling and joint twinning-and transformation-induced plasticity in a metastable β titanium alloy. Acta Mater. 2018, 105, 67–77. [Google Scholar] [CrossRef]
  18. Wojcik, R.; Roessler, R.W.; Zordan, I. Titanium aluminide foil processing. In Advances in the Science and Technology of Titanium Alloy Processing: Proceedings of an International Symposium Sponsored by the TMS Titanium and Shaping and Forming Held at the 125th TMS Annual Meeting and Exhibition, Anaheim, CA, USA, 5–8 February 1996; Weiss, I., Srinivasan, R., Bania, P.J., Eylon, D., Semiatin, S.L., Eds.; TMS: Warrendale, PA, USA, 1997; pp. 293–300. [Google Scholar]
  19. Boehlert, C.J.; Majumdar, B.S.; Seetharaman, V.; Miracle, D. Part I. The Microstructural Evolution in Ti-Al-Nb O+Bcc Orthorhombic Alloys. Metall. Mater. Trans. 1999, 30, 2305–2323. [Google Scholar] [CrossRef]
  20. Li, M.; Cai, Q.; Liu, Y.; Ma, Z.; Wang, Z. Microstructure and Mechanical Properties of Ti2AlNb-Based Alloys Synthesized by Spark Plasma Sintering from Pre-Alloyed and Ball-Milled Powder. Adv. Eng. Mater. 2018, 20, 1700659. [Google Scholar] [CrossRef]
  21. Banerjee, D. The Intermetallic Ti2AlNb. Prog. Mater. Sci. 1997, 42, 135–158. [Google Scholar] [CrossRef]
  22. Huang, Y.; Liu, C.; Li, Z.; Ma, L. Microstructure Evolution and Phase Transformations in Ti-22Al-25Nb Alloys Tailored by Super-Transus Solution Treatment. Vacuum 2019, 161, 209–219. [Google Scholar] [CrossRef]
  23. Sadi, F.A.; Servant, C. On the B2→O phase transformation in Ti-Al-Nb alloys. Mater. Sci. Eng. A 2003, 346, 19–28. [Google Scholar] [CrossRef]
  24. Sherby, O.D.; Klundt, R.H.; Miller, A.K. Flow stress, subgrain size, and subgrain stability at elevated temperature. Metall. Trans. A 1977, 8, 83. [Google Scholar] [CrossRef]
  25. Wang, S.H.; Kao, P.W. The strengthening effect of Ti3Al in high temperature deformation of Al-Ti3Al composites. Acta Mater. 1998, 46, 2675. [Google Scholar] [CrossRef]
  26. Alabort, E.; Putman, D.; Reed, R.C. Superplasticity in Ti-6Al-4V: Characterisation, modelling and applications. Acta Mater. 2015, 95, 428. [Google Scholar] [CrossRef]
  27. Nandy, T.K.; Banerjee, D. Deformation mechanisms in the O phase. Intermetallics 2000, 8, 1269. [Google Scholar] [CrossRef]
  28. Lin, P.; He, Z.B.; Yuan, S.J.; Shen, J. Tensile deformation behavior of Ti-22Al-25Nb alloy at elevated temperatures. Mater. Sci. Eng. A 2012, 556, 617. [Google Scholar] [CrossRef]
  29. Wang, W.; Zeng, W.D.; Xue, C.; Liang, X.B. Microstructure control and mechanical properties from isothermal forging and heat treatment of Ti-22Al-25Nb (at%) orthorhombic alloy. Intermetallics 2015, 56, 79. [Google Scholar] [CrossRef]
  30. Chiu, J.M. Effect of fiber coating on the fracture and fatigue resistance of CSC-6/Ti3Al composites. Acta Metall. Mater. 1995, 43, 2581–2587. [Google Scholar] [CrossRef]
  31. Boet, J. Thermal residual stresses in ceramic matrix composites-I. Axisymmetrical model and finite element analysis. Acta Metall. Mater. 1995, 43, 2241–2253. [Google Scholar] [CrossRef]
  32. Zheng, W.; Zeng, D.; Li, Q.; Zhao, X.; Liang, J.; Zhang, X. Fracture toughness of the bimodal size lamellar O phase microstructures in Ti-22Al-25Nb (at. %) orthorhombic alloy. J. Alloys Compd. 2017, 709, 511–518. [Google Scholar] [CrossRef]
  33. Zheng, W.; Zeng, D.; Li, H.; Ma, P.; Zhang, X. Cleavage fracture of the bimodal size lamellar O phase microstructure of a Ti2AlNb based alloy. J. Alloys Compd. 2019, 799, 267–278. [Google Scholar] [CrossRef]
  34. Li, Q.; Cai, Y.; Liu, Z.; Ma, Z.; Wang, Y.; Huang, H. Formation of fine B2/β + O structure and enhancement of hardness in the aged Ti2AlNb-based alloys prepared by spark plasma sintering. Metall. Mater. Trans. A 2017, 48, 4365–4371. [Google Scholar] [CrossRef]
  35. He, R.; Hu, W.; Luo, T.; He, Y.-J.; Lai, Y.-J.; Du, X.-H. Microstructure and mechanical properties of a new Ti2AlNb-based alloy after aging treatment. Rare Met. 2018, 37, 942–951. [Google Scholar] [CrossRef]
  36. Wang, W.; Zeng, D.; Li, B.; Zhu, Y.; Zheng, X. Microstructural evolution and tensile behavior of Ti2AlNb alloys based α2-phase decomposition. Mater. Sci. Eng. A 2016, 662, 120–128. [Google Scholar] [CrossRef]
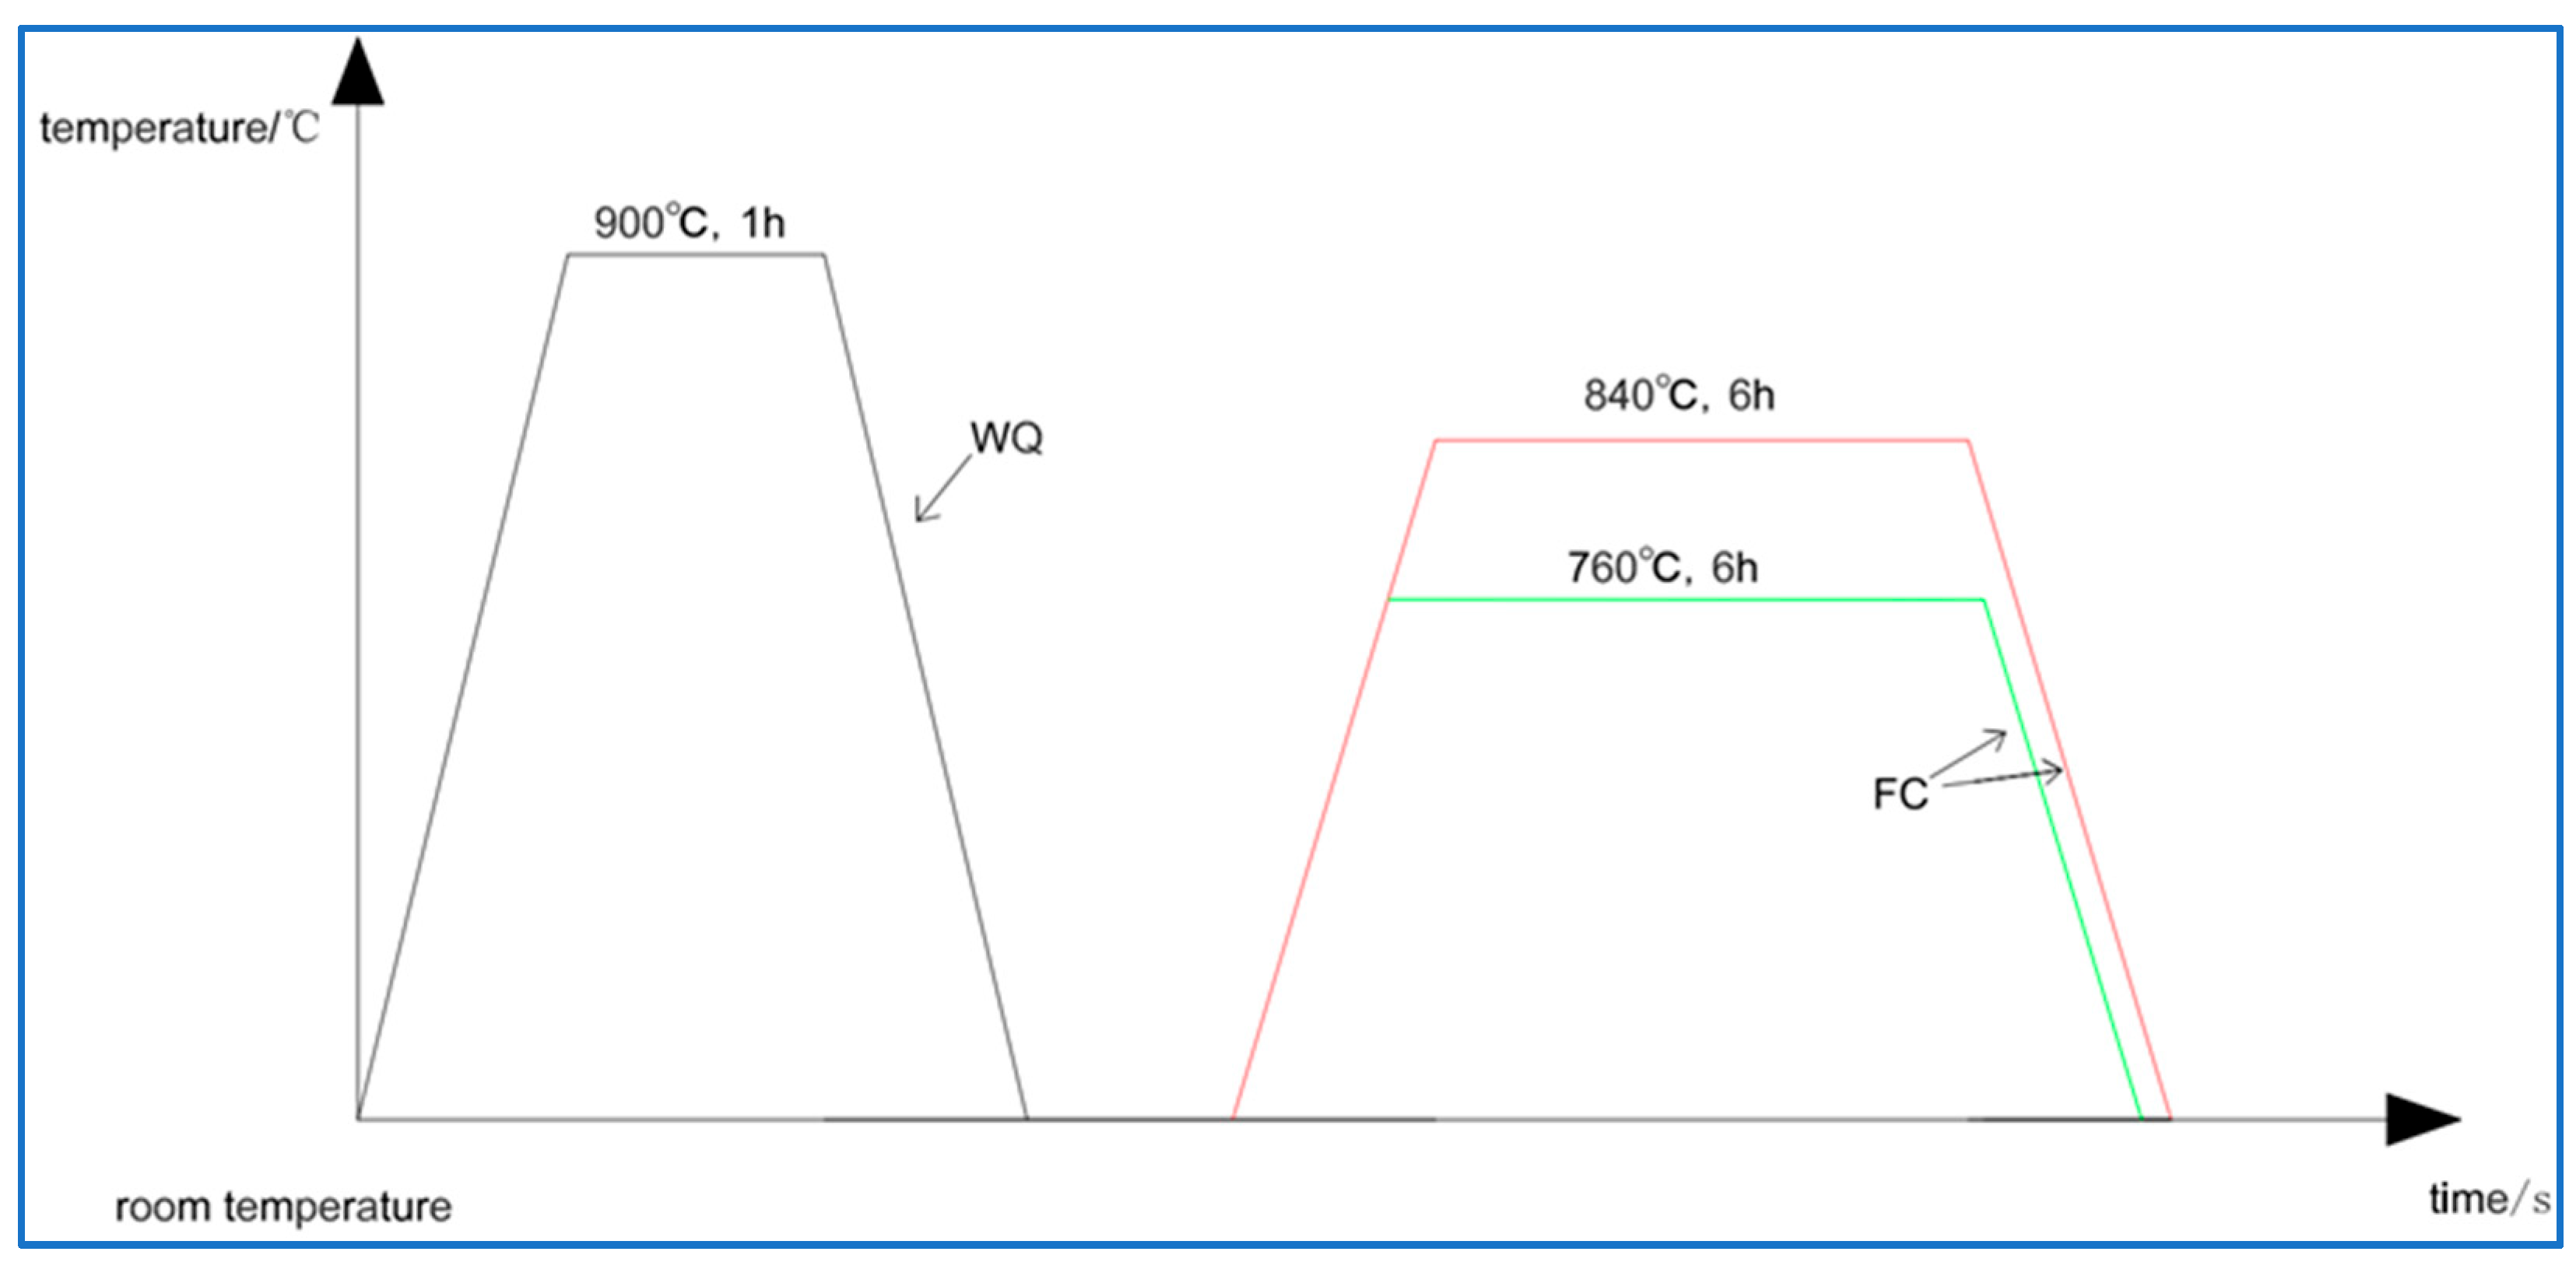
Figure 1. Heat treatment process diagram.
Metals 13 00886 g001
Figure 2. Vertical section phase diagram of Ti-22Al-XNb ternary alloys at variable temperatures [14].
Metals 13 00886 g002
Figure 3. (a) XRD patterns of the rolled Ti2ANb alloy, (b) metallographic structure of the alloy, (c) low-magnification BSE image of the alloy, (d) high-magnification BSE image of the alloy.
Metals 13 00886 g003
Figure 4. EBSD phase (a) and grain orientation (bd) maps of a rolled Ti2AlNb alloy.
Metals 13 00886 g004
Figure 5. (a) XRD patterns of the alloy after solution treatment at 900 °C, (b) Metallographic structure of alloy, (c) Low-magnification BSE images of alloys, (d) High-magnification BSE image of alloys.
Metals 13 00886 g005
Figure 6. EBSD phase of the alloy after solution treatment at 900 °C (a), and grain orientation (bd) maps.
Metals 13 00886 g006
Figure 7. (a) XRD patterns of the alloy after solution treatment at 900 °C and aging treatment at 760 °C; (b) metallographic structure of the alloy; (c) low-magnification BSE images of alloys; (d) high-magnification BSE image of alloys.
Metals 13 00886 g007
Figure 8. EBSD phase of the alloy after solution treatment at 900 °C and aging treatment at 760 °C (a); grain orientation (bd) maps.
Metals 13 00886 g008
Figure 9. (a) XRD patterns of the alloy after solution treatment at 900 °C and aging treatment at 840 °C; (b) metallographic structure of the alloy, (c) low-magnification BSE image of the alloy, (d) high-magnification BSE image of the alloy.
Metals 13 00886 g009
Figure 10. EBSD phase of the alloy after solution treatment at 900 °C and aging treatment at 840 °C (a); grain orientation (bd) maps.
Metals 13 00886 g010
Figure 11. Effect of heat treatment on the alloy’s microhardness.
Metals 13 00886 g011
Table 1. Chemical composition of Ti2AlNb.
CompositionTiAlNbMoVSiMiscellaneous
wt.%Bal.10.8011.3811.7912.790.040.12
Table 2. The heat treatment parameters adopted in this study.
Sample
Number
Solution
Condition
Cooling
Way
Aging
Condition
Cooling
Method
1
2900 °C/1 hWQ
3900 °C/1 hWQ760 °C/6 hFC
4900 °C/1 hWQ840 °C/6 hFC
WQ, water cooling; FC, furnace cooling; −, None.
Table 3. The phase volume fraction and the average grain/particle size of the phase in the Ti2AlNb alloy.
Test SpecimenB2/β (%)O (%)α2 (%)Grain Size (μm)
Rolled plate67.316.316.40.79
ST90068.313.418.40.89
ST900 + AT76044.223.931.90.73
ST900 + AT84019.568.911.60.70
Disclaimer/Publisher’s Note: The statements, opinions and data contained in all publications are solely those of the individual author(s) and contributor(s) and not of MDPI and/or the editor(s). MDPI and/or the editor(s) disclaim responsibility for any injury to people or property resulting from any ideas, methods, instructions or products referred to in the content.