Article

Effect of Glue, Thiourea, and Chloride on the Electrochemical Reduction in CuSO4–H2SO4 Solutions

by
Érika D. Nevárez-Llamas
1,
Eugenia A. Araneda-Hernández
2,*,
Víctor R. Parra-Sánchez
2 and
Eduardo A. Villagrán-Guerra
2
1
Department of Chemical Engineering and Metallurgy, University of Sonora, Blvd. Luis Encinas & Rosales S/N, Hermosillo 83000, Mexico
2
Department of Metallurgical Engineering, University of Concepcion, Edmundo Larenas 285, Concepcion 4030000, Chile
*
Author to whom correspondence should be addressed.
Metals 2023, 13(5), 891; https://doi.org/10.3390/met13050891
Submission received: 14 March 2023 / Revised: 20 April 2023 / Accepted: 28 April 2023 / Published: 5 May 2023
(This article belongs to the Special Issue Separation and Purification of Metals)

Abstract

:
The effect of glue, thiourea, and chloride on the kinetics of copper reduction in CuSO4–H2SO4 solutions of copper composition, and temperatures like those used in the copper electrorefining plants, were studied. The kinetic study was conducted by determining the kinetic parameters  i 0  and  β  under the activation control of the Tafel approximation, which is applied to polarization curves obtained via linear voltammetry. The results show that the incorporation of glue and thiourea decreases the exchange current density, while chloride does not significantly affect the kinetic parameters. The data on the fraction of the surface covered by glue and thiourea fitted to the Temkin adsorption isotherm indicate that the mechanism of action during the reduction of copper to low overpotentials is the adsorption of these additives on the electrode surface. The adsorption of additives reduces the cathodic area available for Cu2+ adsorption and lateral diffusion of Cu atoms to continue the reduction process and the growth of the crystalline deposit. The kinetic study was complemented with a comprehensive analysis of the effect of the additives on the morphological and textural characteristics of the deposits. The results of this work contribute to the understanding of the mechanisms of the main additives used during the copper electrorefining process.

1. Introduction

The objective of copper electrorefining is to produce high-purity copper cathodes from impure copper anodes generated during the typical sequence of pyrometallurgical processes of concentrate smelting, matte conversion, and copper fire refining. These cathodes are obtained via electrodeposition of the metal in an acid medium and are based on the formation of massive deposits of metallic copper through the occurrence of electrochemical reactions. The cathodic product must meet rigorous chemical and physical quality standards. The former is evaluated based on the content of impurities such as As, Sb, Bi, and S, among others. Regarding its physical quality, it is related to the brightness, surface irregularities, and coherence of the deposit obtained [1].
At the industrial level, a typical operational practice is the incorporation of additives as a method to control the surface quality of the cathodic product, acting either as metal deposit growth levelers or as grain refiners [2,3,4,5,6,7,8,9,10,11,12,13,14,15,16]. Among the most used additives are animal glue, thiourea, and chloride ion. Glue and thiourea are added to the electrolyte as levelers of the deposits, while the chloride ions are added to refine the grains. The presence of these additives in the electrolyte, even at low concentrations, allows for obtaining more compact, smoother, and less rough deposits [13,17,18,19,20]. However, the effect that these additives have on the overall reduction kinetics in the Cu2+/Cu system is an aspect that requires further study [21].
The electrochemical reduction of cupric ions to metallic copper can be represented in a general way by two fundamental stages. The first stage involves the oxidized Cu2+ species being transported via diffusion through the Nernst layer from the bulk to the solution/electrode interface, where it is then adsorbed on the surface according to the following reaction:
Cu 2 +   ( electrolyte )     Cu 2 +   ( surface )
In a second stage, the adsorbed Cu2+ is reduced to metallic copper using Reaction (2):
Cu 2 +   ( surface ) + 2 e     Cu   ( surface )
Once the electron transfer takes place according to the previous reaction, the reduced species diffuse superficially towards active sites, where the formation of the massive metallic deposit of the morphological and crystallographic characteristics that depend on the competition between nucleation and growth phenomena will occur. The reduction of cupric ions takes place through the occurrence of two consecutive reactions:
Cu 2 + + e k 1   Cu + E 0 = 0.15   V / SHE
Cu + + e k 2 Cu   E 0 = 0.52   V / SHE
Reaction (3) is much slower than the Reaction (4), thus consequently limiting the overall reduction kinetics [22].
The cathodic current density, ic, is given using the Butler–Volmer equation expressed in Equation (5), where  i 0  and  β  are the exchange current density and the cathodic charge transfer coefficient, respectively, and η is the overpotential defined as the difference between the applied potential and the thermodynamic equilibrium potential of the electrochemical system:
i c = i 0 e x p β n F η / R T
The exchange current density, i0, is a measure of the rate of charge transfer between the electrode and the electrolyte at equilibrium potential, while β is an indicator of the symmetry of the energy barrier between the cathodic and anodic half-reactions.
The overall effect of additives on the morphology of the massive deposits is a well-known aspect that specially refers to their levelling, inhibitory, brightening, and grain-refining abilities; however, their mechanism of action is a subject that is still in progress [23,24,25,26,27]. In addition, kinetic information on copper electrorefining is still limited and scarce and is crucial to the copper industry. Knowledge of the kinetic critical parameters and the mechanism of action of the additives enables for a better process design, optimization of additive use, control of additive effect on deposit formation, development of additive addition strategies during operation, and so on [28]. The latter is relevant in electrorefining and electrowinning processes that are conducted at high current densities in which the formation of irregular morphologies is highly probable [1], as well as helping to produce electrodeposited thin films in which, given the specific applications of such materials, extremely homogeneous surface characteristics are required.
In the present study, the effect of the additives glue; thiourea; and chloride ion on the reduction kinetics of cupric ions in synthetic solutions of copper composition; acidity; and temperatures similar to those presented by an industrial electrolyte in the copper electrorefining process, is investigated. The cathodic kinetic parameters are determined under charge transfer control conditions using the linear voltammetry technique on a fixed electrode, assuming that these additives are adsorbed on the electrode surface and, therefore, influence the cathodic charge transfer process.
In this sense, reference is made to the adsorption of additives on the electrode surface as a mechanism of the inhibition of the deposit growth through adsorption models that consider the fraction covered on the electrode by the additive, calculated from electrochemical measurements. A study on the effect of additives on the surface morphology of massive deposits complemented our study.

2. Materials and Methods

2.1. Electrolyte Solutions

The electrochemical measurements were carried out using, as an electrolyte, a synthetic solution composed of 40 g L−1 of Cu2+ and 200 g L−1 of H2SO4, prepared with CuSO4·5H2O 99.99% supplied by Sigma-Aldrich (Burlington, NJ, USA) which was denominated as the base solution (BS). The additives: animal glue and thiourea were supplied by a Chilean copper electro-refinery and correspond to those used in their industrial processes, while the chloride ion was added in the form of KCl 99.99% supplied by Sigma-Aldrich (Burlington, NJ, USA). Each of the additives were incorporated individually into the base solution, having dissolved them previously in deionised water. All electrochemical tests were performed within 30 min after the addition of the additives.
Glue and thiourea concentrations of 1, 10, and 100 mg L−1 were used; and in the case of chloride ion, the concentrations were 20, 40, 80, 100, and 1000 mg L−1. The solutions were kept in contact with atmospheric air and magnetic stirring until the operating temperature (60 °C) was reached. During each experiment, the temperature of the solution was measured continuously using an alcohol thermometer. To maintain the solution temperature at a constant value, with maximum variations of ±1 °C, a double-jacketed electrolytic cell connected to a thermostatic bath was used.

2.2. Electrochemical Measurements

A 200-mL double-jacketed electrolytic cell with a typical three-electrode configuration was used for the voltammetric tests. A platinum disk with 0.0314 cm2 of exposed area was used as a working electrode and subjected to electrolytic cleaning in an acid solution prior to each test. The auxiliary electrode was a 0.6-mm diameter, high-purity platinum wire, while a saturated calomel electrode (SCE) with a potential +240 mV in relation to the standard hydrogen electrode (SHE) was used as the reference electrode.
Electrochemical measurements were recorded using a Voltalab 40 PGZ 301 potentiostat from Radiometer Analytical SAS (Lyon, France). Voltammetric tests were carried out in the anodic direction in the range of −300–+800 mV/SCE and with a sweep rate of 10 mV s−1. Preliminary electrochemical measurements were performed to establish the effect of the sweep rate and thus define a suitable value for the system under study.

2.3. Massive Deposits Obtention

A 1 cm × 1 cm 316-L stainless steel electrode extracted from a commercial cathode zone from a Chilean electrolytic refinery was used as a working electrode. Subsequently, it was mounted in epoxy resin and polished with 3-μm alumina until a specular surface was obtained. The surface of the electrode was cleaned with ultrasound to remove impurities, then it was washed with water and isopropyl alcohol and immediately placed in the electrolytic cell. This operation was performed before each experiment. Massive deposits were obtained at two current density values, 300 and 500 A m−2, for an electrolysis time of 18 h. In both cases, the solutions were kept at 60 °C and the base composition was 40 g L−1 of Cu2+ and 200 g L−1 of H2SO4. Concentrations of 1, 10, and 100 mg L−1 of thiourea, glue, and chloride were used for a current density of 300 A m−2; and 1 and 100 mg L−1 of thiourea, glue, and chloride for a current density of 500 A m−2. The morphological characterization of the deposits was performed via electron microscopy and X-ray diffraction.
In the first case, secondary electron (SE) and three-dimensional images of the surface of the deposits were acquired using QEMSCAN® (Hillsboro, FL, USA) consisting of a Tescan (Brno, Czech Republic) Vega LSH scanning electron microscope operated at 25 keV under vacuum conditions below 10−5 Torr. For the indirect determination of relative heights, the SE image was acquired on a particular section of the surfaces of the deposits which had a dimension of approximately 1970.33 μm × 1970.33 μm. This surface was divided into a mesh with a node spacing of 1.93 μm and 49.26 μm in the x and y directions, respectively, resulting in a total of 40,920 nodes for each surface analyzed. Each node represented a measurement point. The scan yielded a histogram of ADU (Analogue to Digital Unit) counts for a specific (x, y) position on the deposit surface. The number of ADU counts is proportional to the brightness of the surface at that point and thus to the distance of the analyzed surface from the secondary electron detectors. Thus, the shorter the distance between the sample and the detectors, the brighter the surface with a higher ADU value and vice versa. It is important to point out that the results of the average relative height corresponding to the average ADU values are not comparable between different deposits because this value depends on the working distance defined for each sample, the position on the vertical axis concerning the incident beam, and the secondary electron detector, among other factors. Therefore, in an SE image for the same sample, a higher ADU value corresponds to a higher relative height, but for different deposit samples, with different reference planes equivalent to Z = 0, the comparison of the effect of additives on roughness is based on the statistical parameters of the standard deviation, kurtosis, and asymmetry coefficient calculated for solutions with different types and concentration levels of additives in relation to those calculated for the base solution in the absence of additives.
On the other hand, the determination of the texture coefficient of the deposits was carried out via X-ray diffraction using a Bruker (Billerica, MA, USA) diffractometer model D4 Endeavor. The reading conditions were set at 30 to 60°, with a scanning speed of 0.5° s−1 operated with the Cu radiation and Ni radiation filter of Kβ with 40 kV and 20 mA.

3. Results and Discussions

3.1. Determination of Electrochemical Kinetics Parameters,  i 0  and  β

3.1.1. Additive-Free Base Solutions

To analyze the effect of the additives on the kinetic parameters of the Cu2+/Cu reduction half-reaction, the values obtained for the base solution in the absence of additives at 60 °C were considered as reference values. In previous studies [29,30,31,32], kinetic parameters obtained using different electrochemical techniques are reported; however, the temperature ranges and copper concentration levels considered differ from those that operate the industrial copper electro-refinery. Despite these differences, the values of the kinetic parameters previously reported were contrasted with those obtained in the present study with the base solution at 60 °C by applying the Tafel approximation to the polarization curves. The values of the kinetic parameters were determined at different copper concentrations of 20, 40, 60, and 80 g L−1 in solutions of 200 g L−1 of sulfuric acid at 60 °C.
In the cathodic zone, the polarization curves (Figure 1) show a current plateau that corresponds to the reduction of Cu2+ ions in the solution. This is the reaction of interest for this study. A peak corresponding to the oxidation of the reduced copper is observed in the anodic zone. The current intensity reached in both cases depends on the initial concentration of Cu2+ ions. The analysis of the polarization curves showed the shift of the equilibrium potential toward more positive values and the depolarization of the electrode with increasing copper concentration in the solution.
Furthermore, it was determined that the exchange current density,  i 0 , obtained using the Tafel approximation, varies with the cupric ion concentration according to the empirical correlation (6) (R2 = 0.97), where  C C u 2 + , r e f  corresponds to the reference cupric ion concentration, which for the present study was set at 40 g L−1, and  C C u 2 +  is the cupric ion concentration in the evaluated interval. Under the same experimental conditions, it was determined that β was independent of Cu2+ concentration, remaining at a value of 0.19.
i 0 = 21.5   C C u 2 + C C u 2 + , r e f 0.62
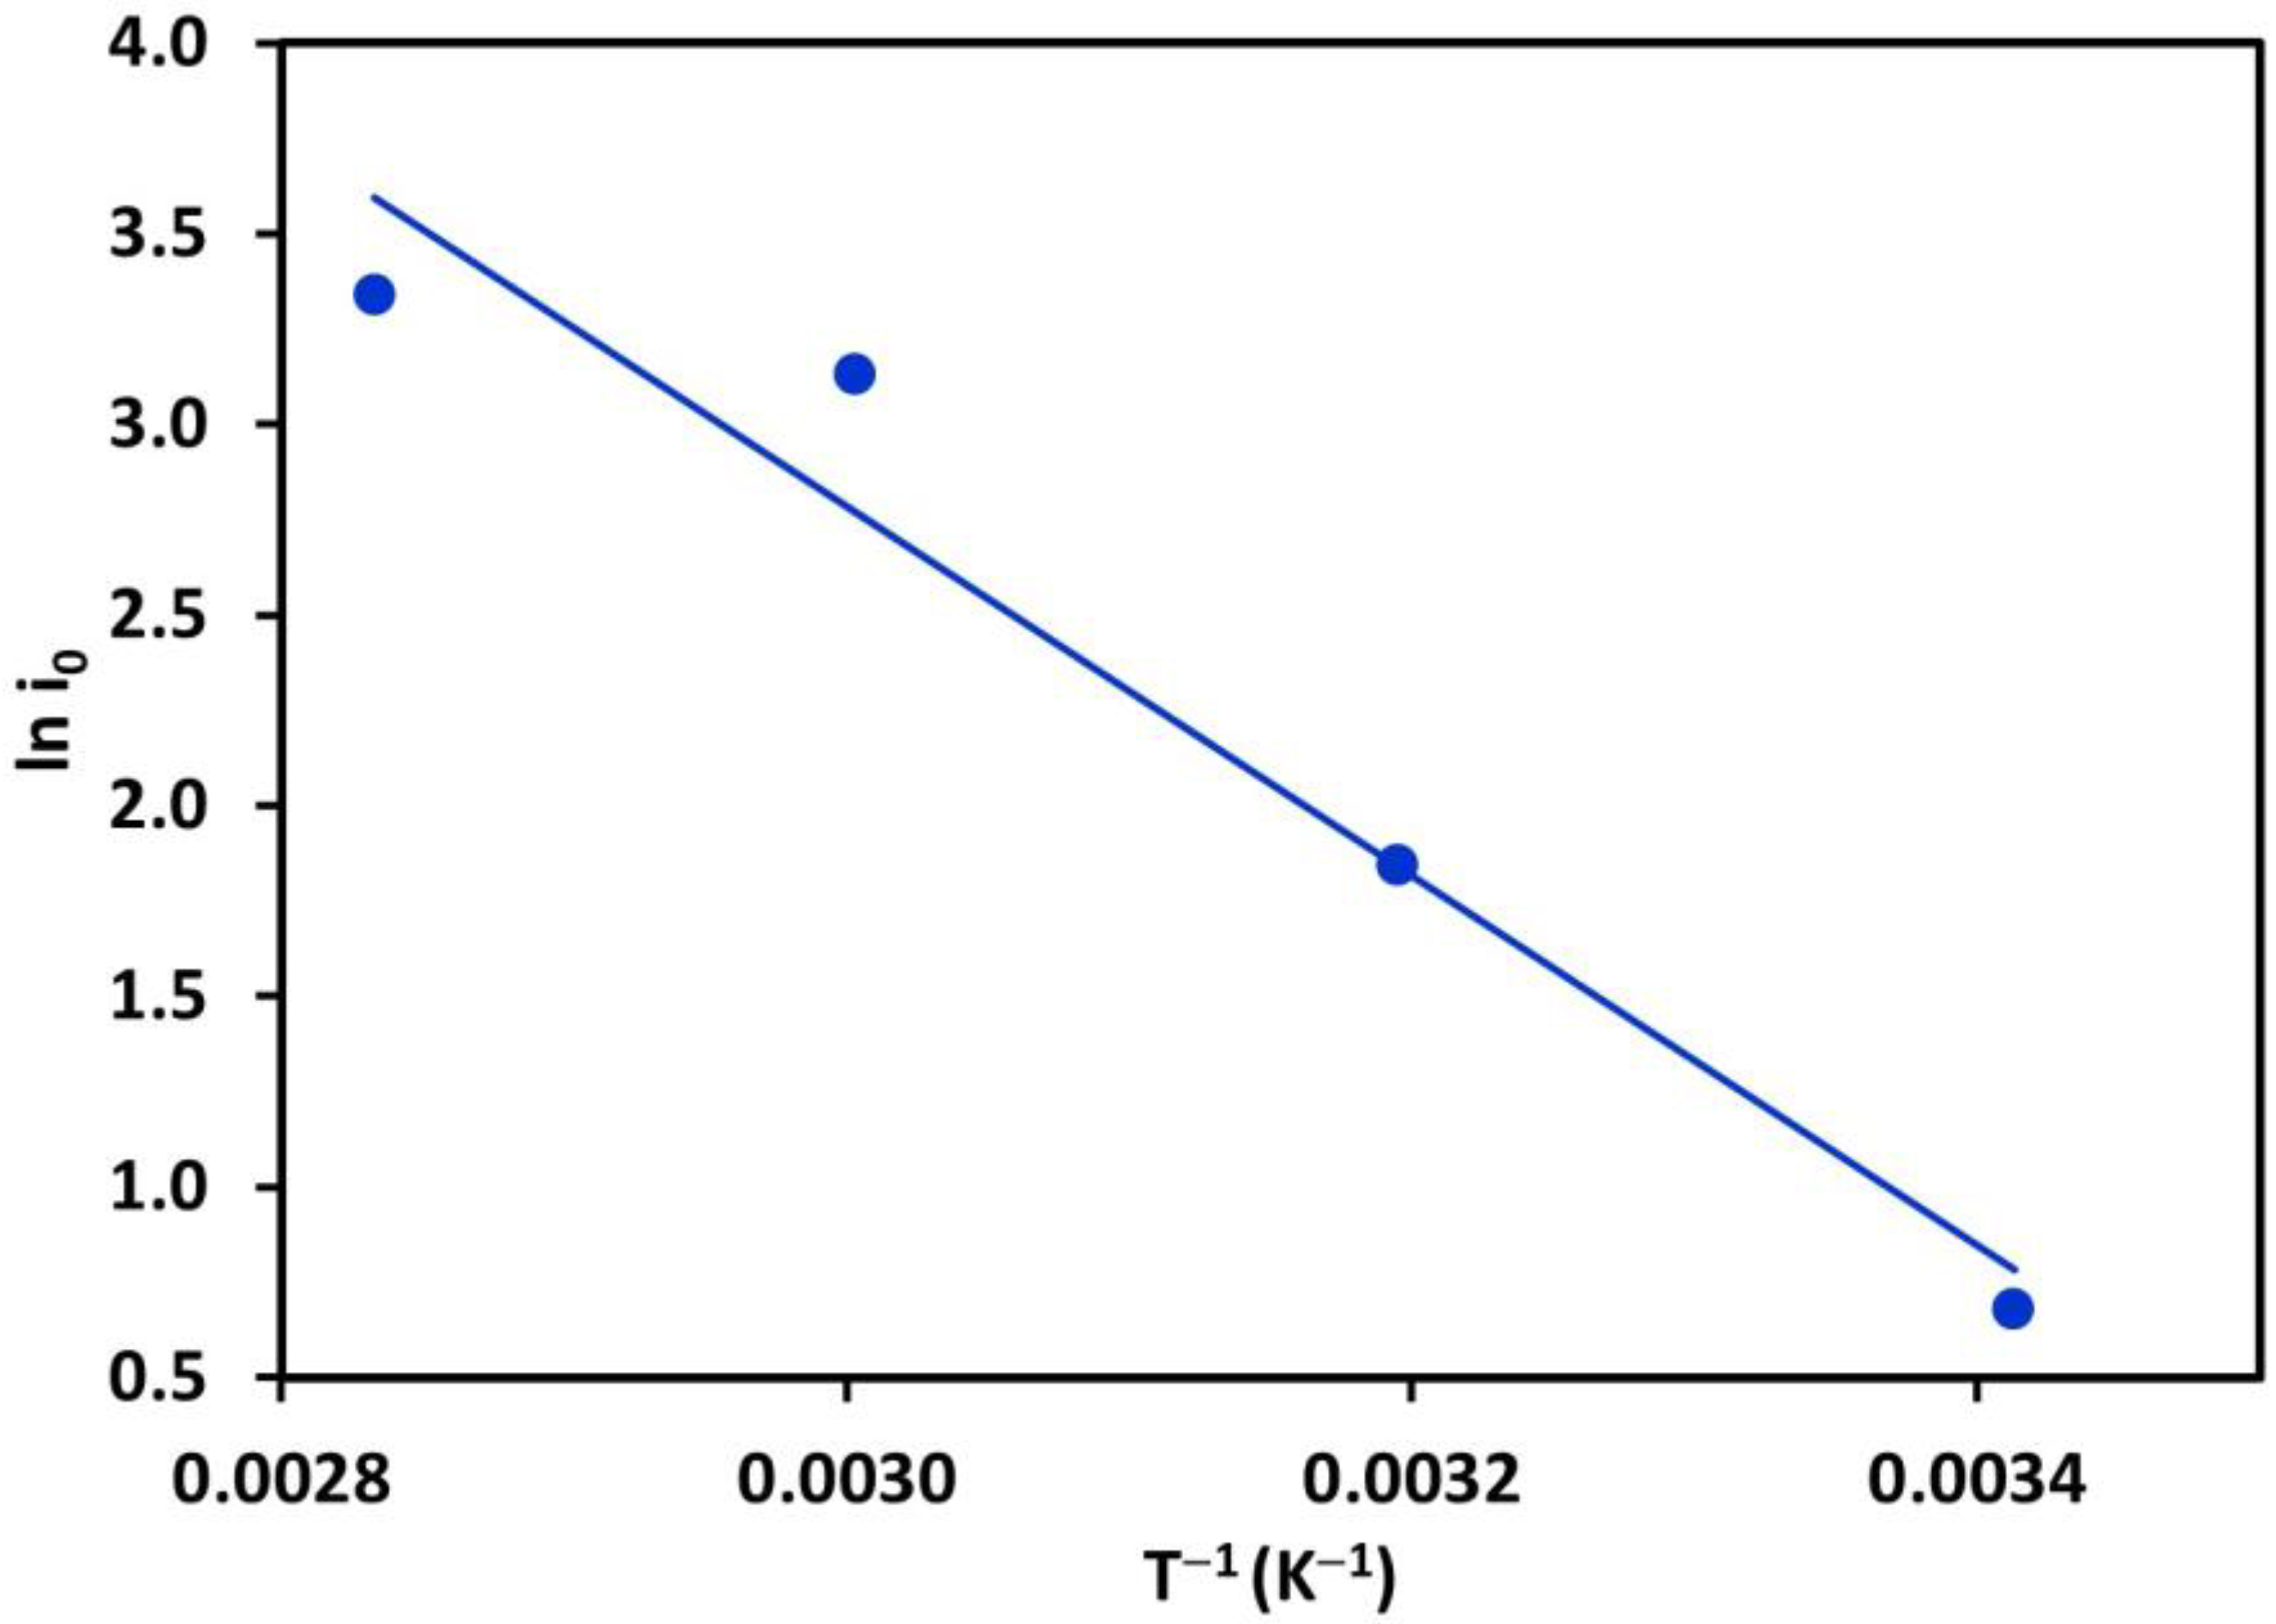
Likewise, the values of the kinetic parameters were determined at different solution temperatures, 20, 40, 60, and 80 °C, at a concentration of 40 g L−1 of cupric ions and 200 g L−1 of sulfuric acid (Figure 2). It was verified that the exchange current density obtained using the Tafel approximation showed an Arrhenius-type dependence with temperature, valid in the range of 20 to 80 °C, with an activation energy of 40.3 kJ mol−1 according to expression (7):
ln i 0 = 17.32 4843.3   T 1
To check the validity of the above correlation, the exchange current density values obtained for 21 °C and 30 °C corresponding to 2.3 mA cm−2 and 3.8 mA cm−2, respectively, were compared to those obtained by Caban and Champan using potentiostatic techniques in a rotating disk electrode (5.2 mA cm−2 at 21 °C) and Stankovic using galvanostatic pulses (2.5 mA cm−2 at 30 °C), reported by Hinatsu [29] as being of the same order of magnitude. Previous studies also report values of the same order of magnitude; for example, Pearson and Schrader [32], using impedance obtained an  i 0  value of 1.59 mA cm−2 at 23 °C, and Bockris and Enyo [22], using the galvanostatic pulse technique at 30 °C, obtained an  i 0  value of 2.4 mA cm−2 using dilute solutions of CuSO4–H2SO4.
The value of the cathodic charge transfer coefficient was 0.19 and was found to be independent of the electrolyte temperature over the range considered in this study. This suggests that, under the experimental conditions evaluated, there are no additional reaction mechanisms to the electrochemical reduction of Cu2+ in a kinetic regime controlled by charge transfer in the electrolyte in the absence of additives.
Then, the kinetic parameter values obtained in the base solutions at 60 °C were used as a reference to evaluate the effect of additives on the kinetics of the Cu2+/Cu reduction reaction.

3.1.2. Solutions in the Presence of Additives

The polarization curves in the presence of additives were obtained from the base solution at 60 °C by adding glue and thiourea at concentrations of 1, 10, and 100 mg L−1; chloride was added at concentrations of 20, 40, 80, 100, and 1000 mg L−1 of Cl.
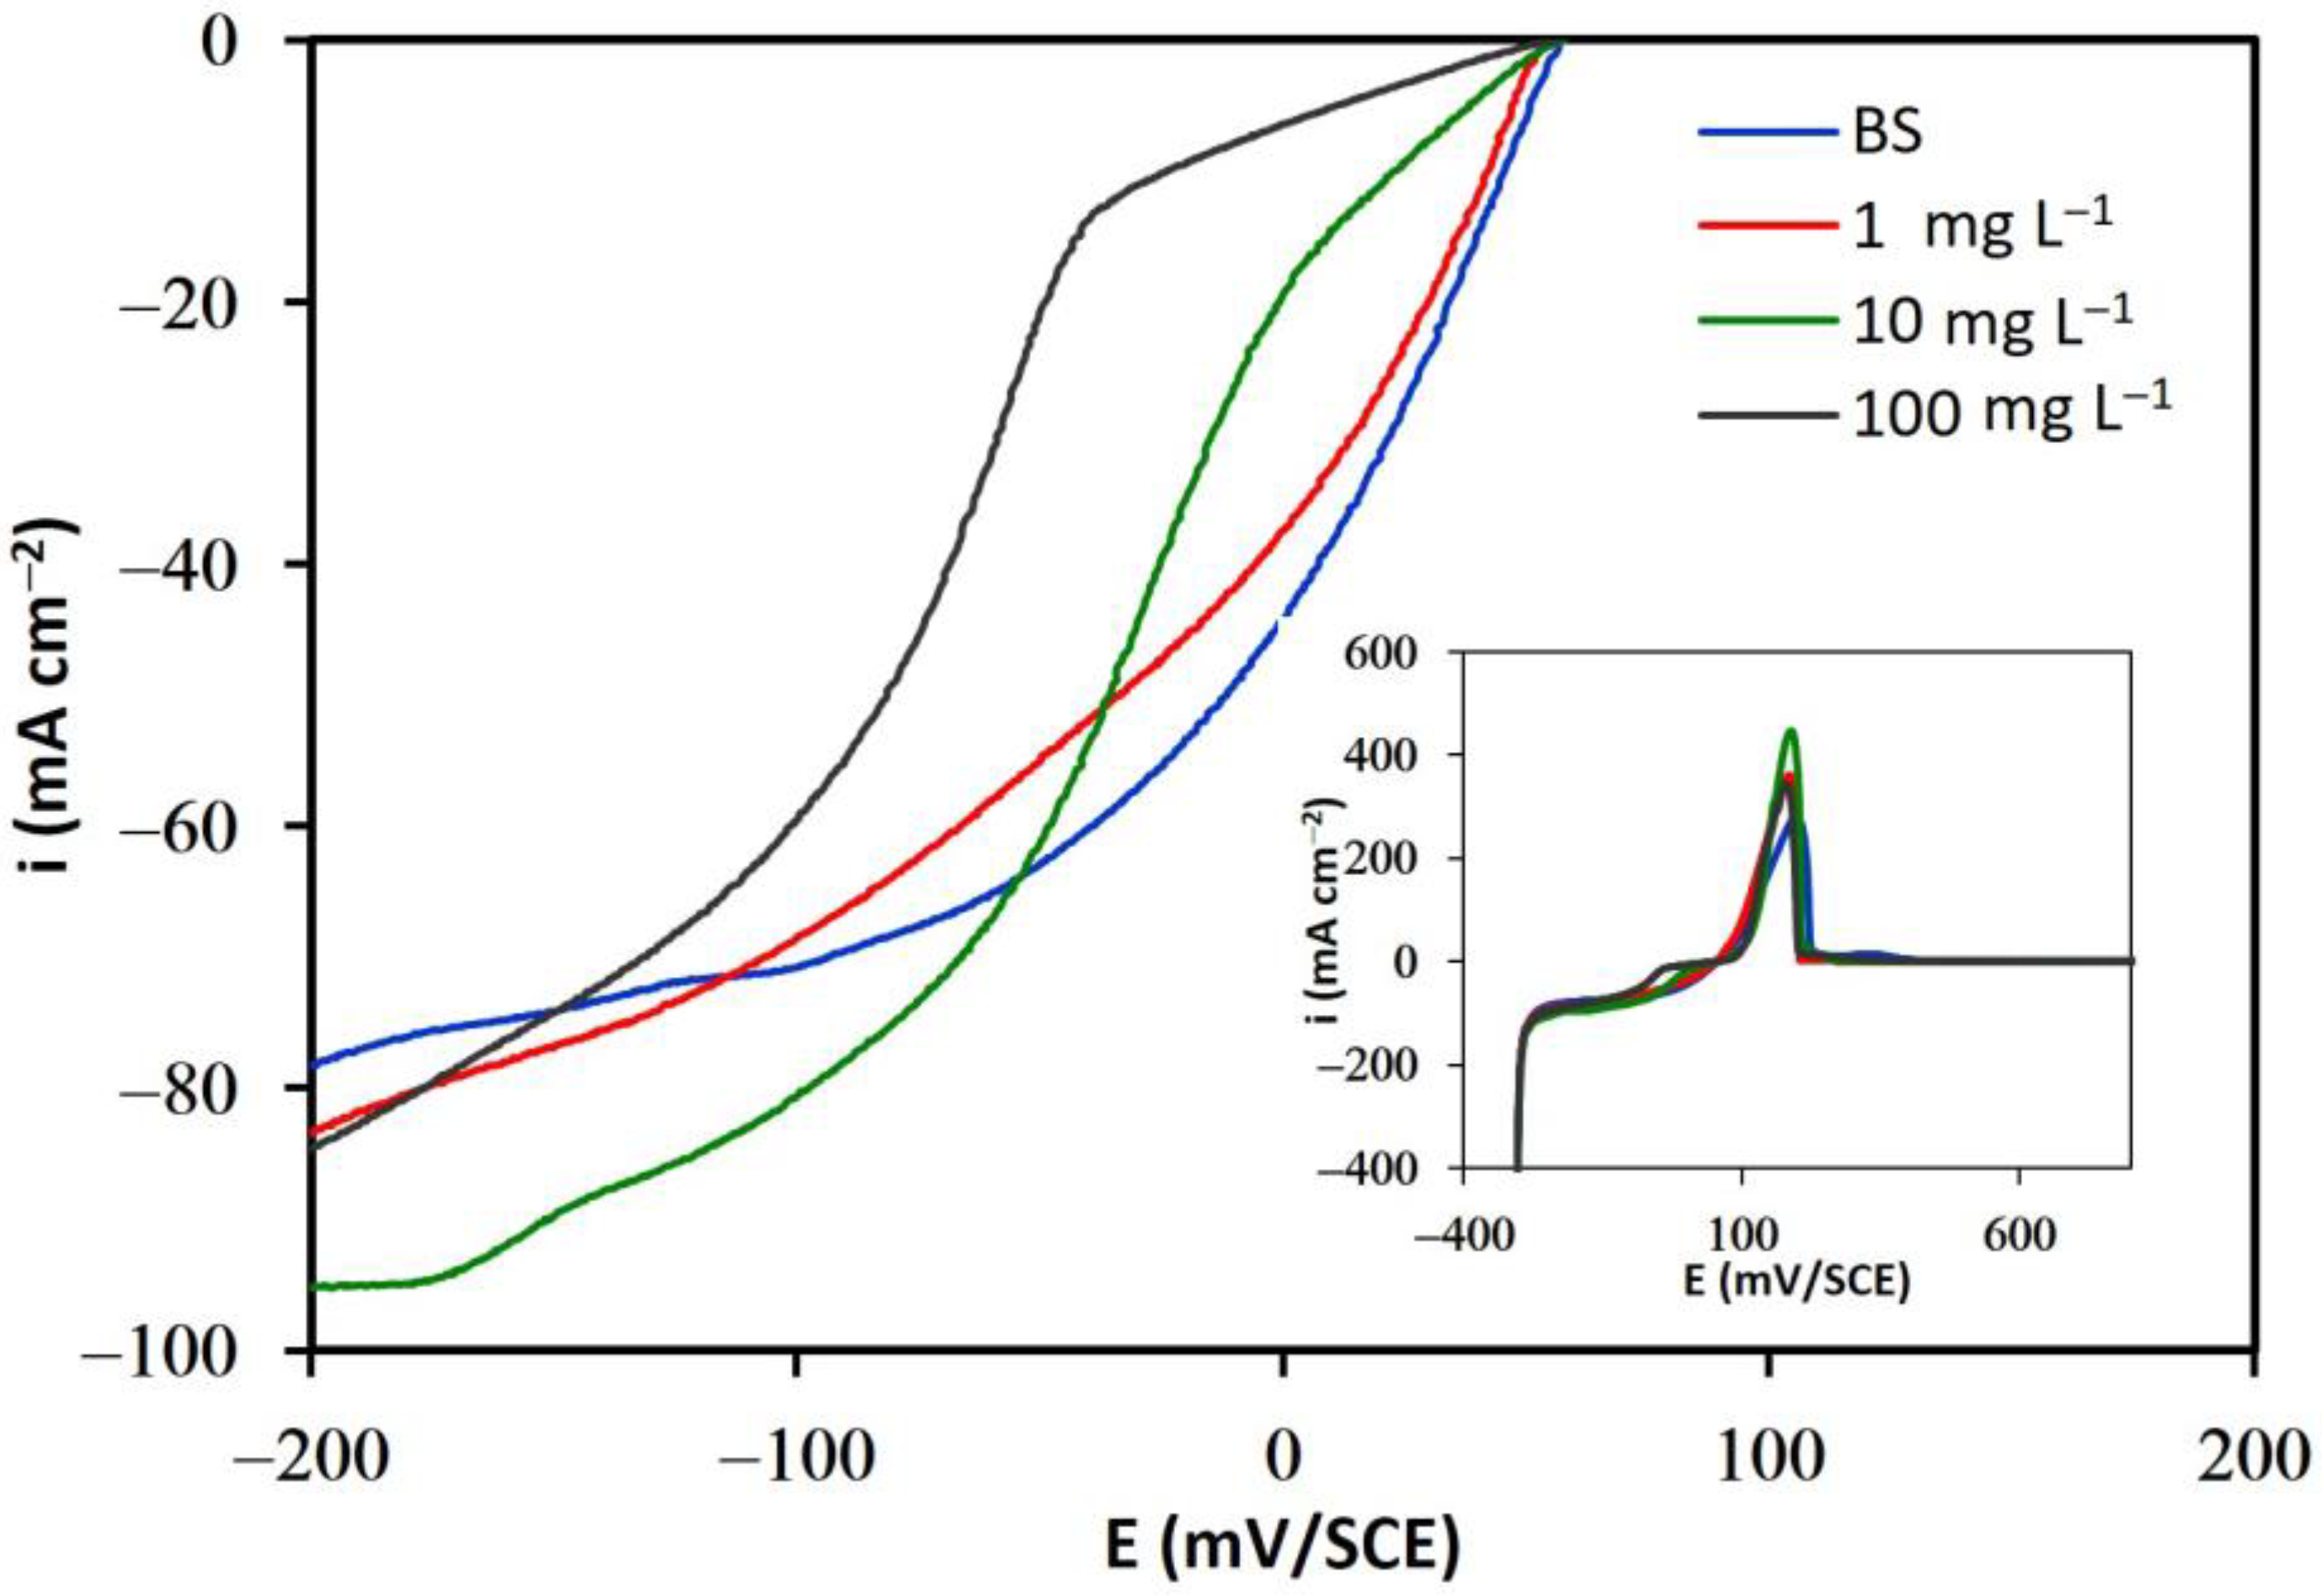
Regarding the behavior of the solutions with glue addition (Figure 3), it is observed that the equilibrium potential is maintained throughout the concentration range, at approximately 55 mV/SCE, very close to the thermodynamic equilibrium potential of the reduction half-reaction calculated at 71.48 mV/SCE at 60 °C and 40 g L−1 Cu2+. The shape of the curves is qualitatively similar to that obtained in the absence of additives. However, increasing the glue concentration to 10 and 100 mg L−1 causes the polarization curve to shift in the cathodic region (from −50 mV/SCE) toward less negative current density values. This is associated with a decrease in the reduction kinetics of Cu2+ ions.
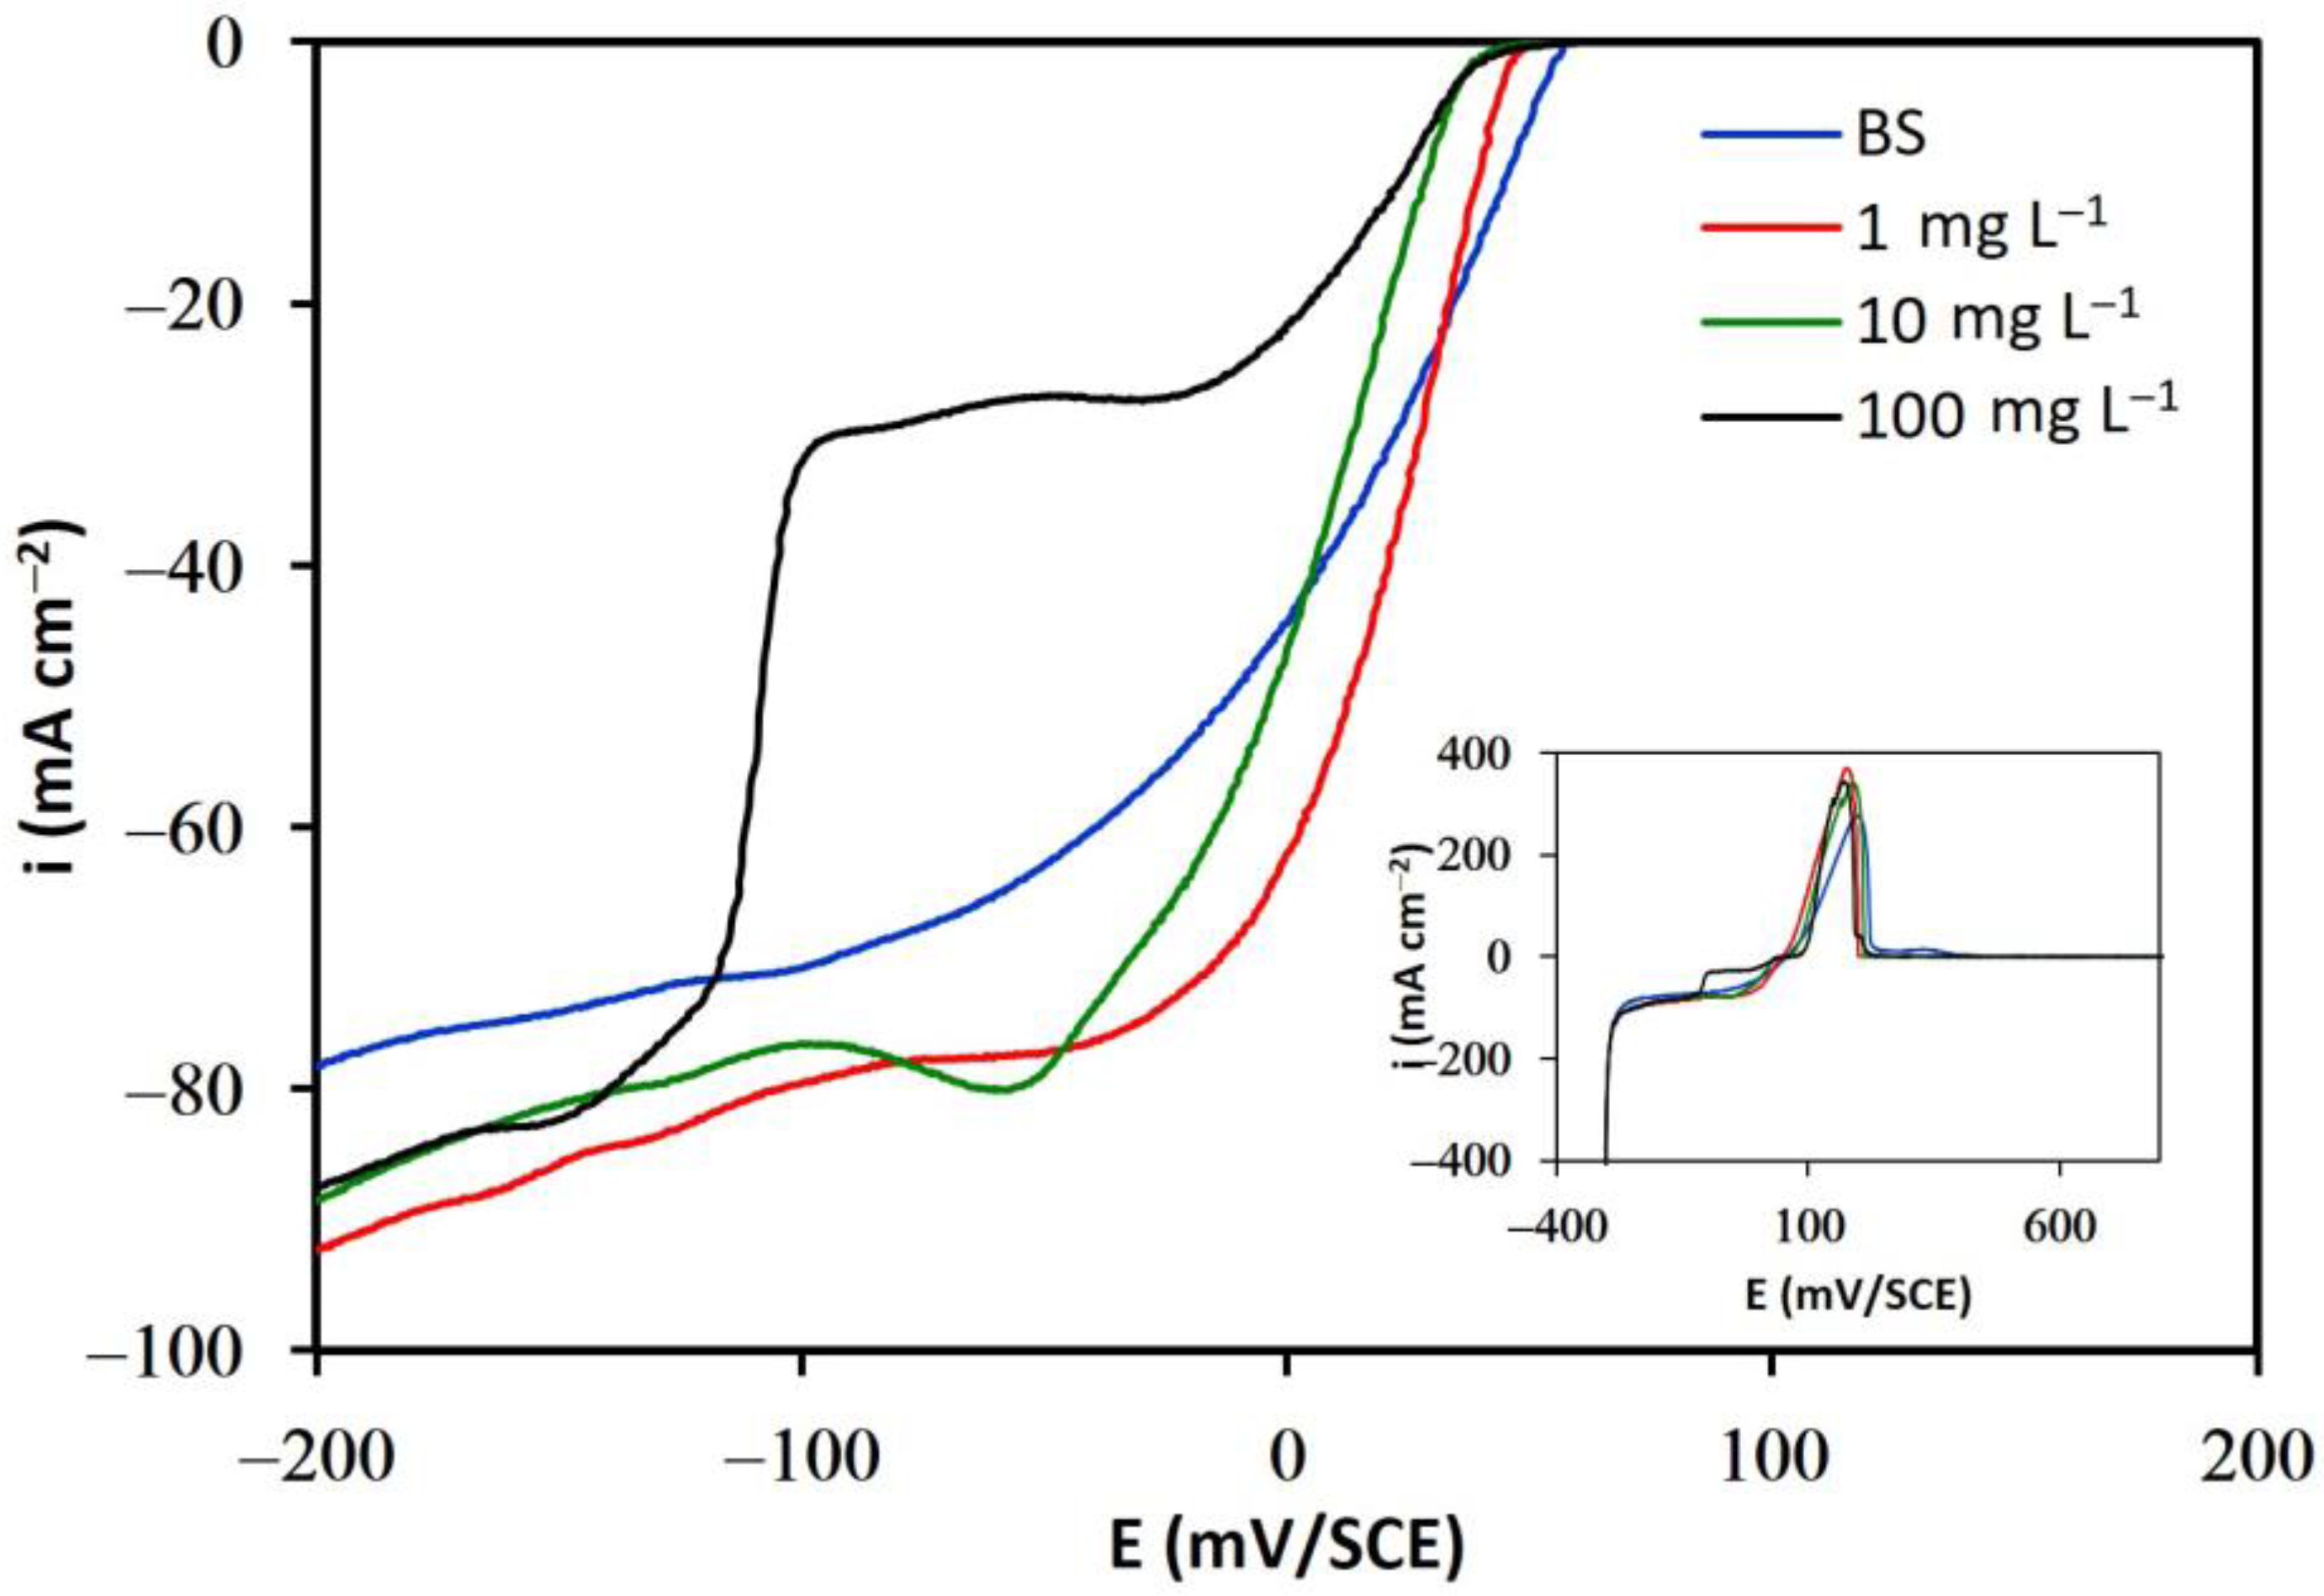
With the addition of thiourea (Tu), the polarization curve at 100 mg L−1 shows in the cathodic zone at low potentials the formation of a cathodic peak at −100 mV/SCE (Figure 4). The formation of this cathodic peak at high thiourea concentrations can be explained because in the presence of cupric ions, thiourea is oxidized to form formamidine disulfide (FDS) and cuprous ions according to the following reaction [23,33,34]:
2 C u 2 + + 2 T u 2 C u + + F D S + 2 H +
followed by the formation of complexes of Cu+ and FDS or Cu+ with Tu, according to the following reactions [11,35,36]:
C u + + n F D S C u F D S n +
C u + + n T u C u T u n +
which can be reduced on the cathode to form metallic copper, according to the following reactions [11,36]:
C u F D S n + + e C u + n F D S
C u T u n + + e C u + n T u
At low overpotentials and low thiourea concentrations, Reaction (9) predominates over Reaction (10), whereas, with increasing thiourea concentration, this is reversed in favor of the formation of copper complexes with thiourea. The literature indicates that the  C u F D S n +  complex is more easily reduced than the complex  C u T u n +  [37], which is consistent with the increase in current density observed at 1 and 10 mg L−1. In contrast, for higher concentrations, the formation of the  C u T u n +  complex is favored, resulting in the cathodic polarization of the electrode observed in the curve at 100 mg L−1.
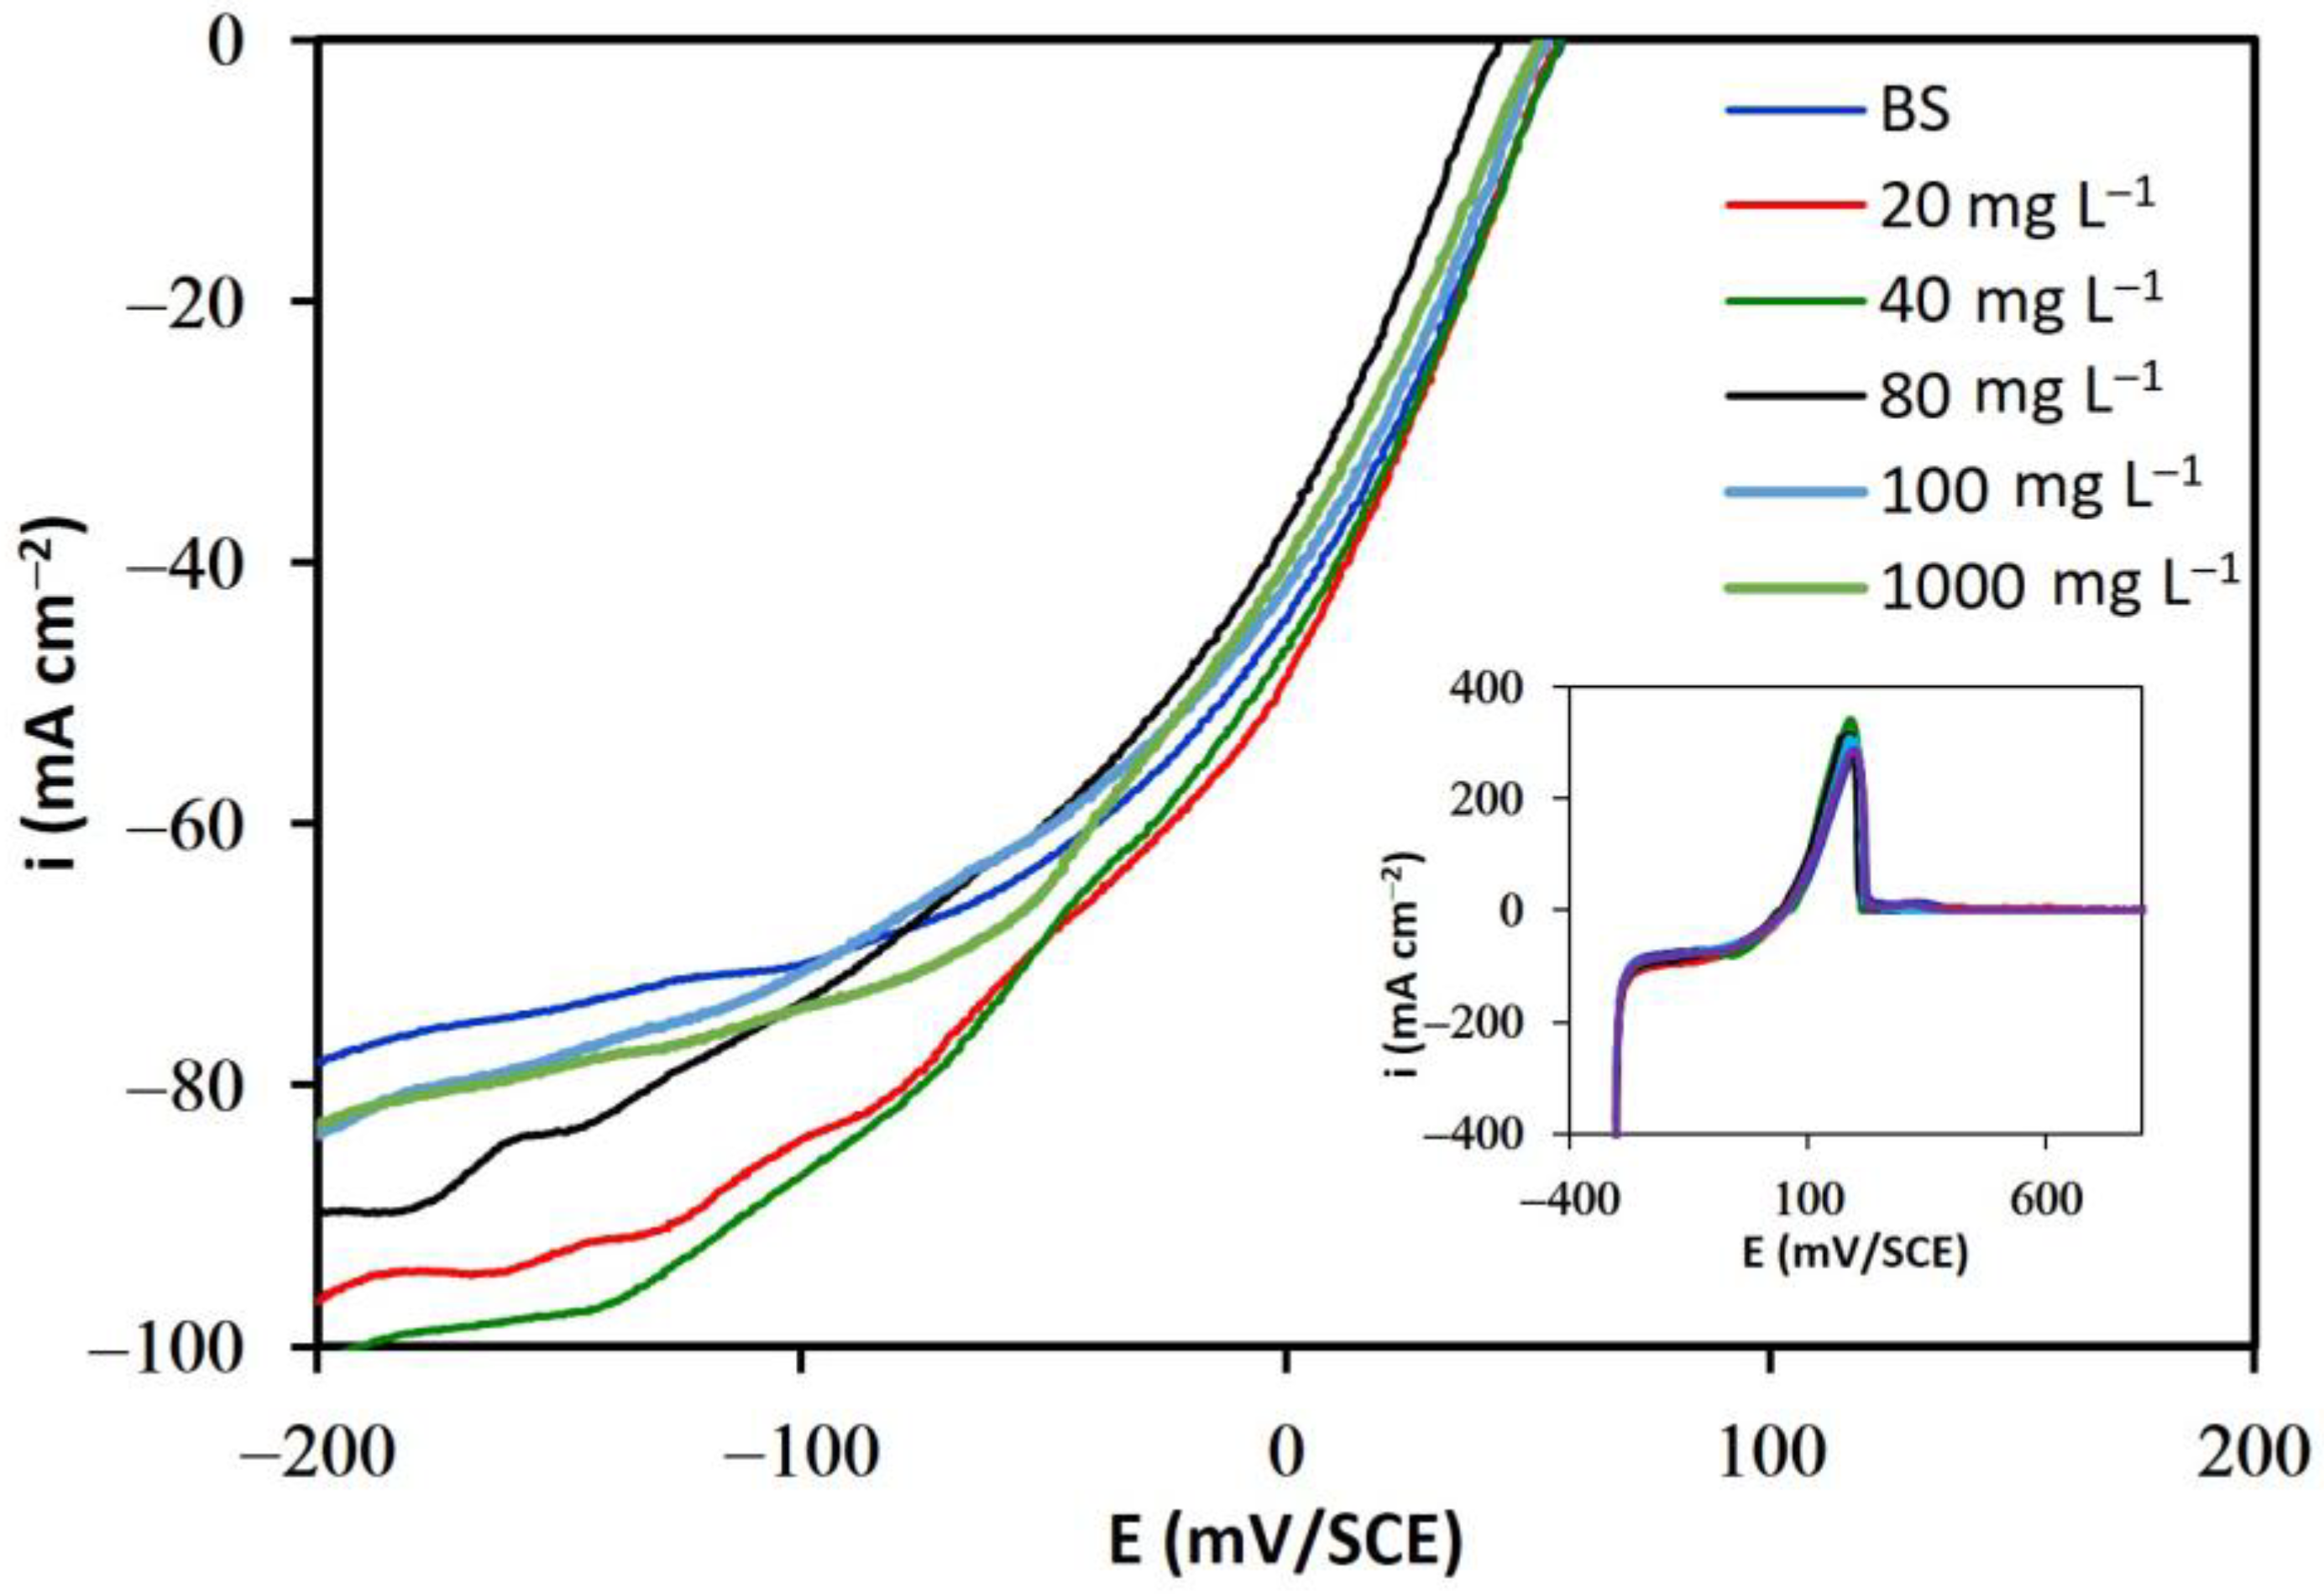
The addition of chloride ion at concentrations of 20 and 40 mg L−1 resulted in cathodic depolarization of the electrode from a potential of −80 mV/SCE, while for the rest of the Cl concentrations, the depolarizing effect was lower (Figure 5). This effect was also observed in the electrochemical behavior of the solutions with thiourea and glue (Figure 3 and Figure 4), which is relevant since a polarizing effect of these additives on the electrode would result in the displacement of the curve ( i = f E ), causing a decrease in the current density at certain potential values and therefore a retardation of the reaction kinetics.
To analyze the effect of the additives on Cu2+ reduction, Figure 6 shows the relationship of the exchange current density in terms of the concentration of the additives. In solutions in the presence of glue (Figure 6), the exchange current density,  i 0 , decreases significantly in the concentration range of 1 to 10 mg L−1 of glue, whereas, at higher concentrations of this additive, the decrease was smaller. Similarly, the addition of thiourea also caused the significant decrease in  i 0  in the range of 1 to 10 mg L−1 (Figure 6). These results agree with those reported by Stankovic et al. [38], who reported a decrease in the exchange current density by at least one order of magnitude in a solution in the presence of 4 × 10⁻⁵ M thiourea in relation to that observed in a solution in the absence of the additive. In the case of chloride addition, although there is a decrease in the exchange current density in relation to the base solution, it is independent of the chloride concentration of the solution used. Therefore, its effect on this parameter is negligible. (Figure 6).
On the other hand, the cathodic charge transfer coefficient increased in the range of concentrations of glue and thiourea in the solution studied, from 0.19 for the base solution to 0.38 and 0.61 for 100 mg L−1 of glue and thiourea, respectively. In the presence of chloride, this coefficient increased slightly for that obtained for the base solution; however, it was independent of the chloride concentration.
The variation observed in the exchange current density is associated with the decrease in the overall kinetics of cupric ion reduction in the presence of glue or thiourea in solution and can be explained in part by the increase in the activation energy of the reduction reaction associated with the increase in the cathodic charge transfer coefficient,  β .
It is important to point out that, for both additives, a concentration value was identified where both kinetic parameters remain relatively constant under the experimental conditions analyzed. It is widely accepted that, during the electrochemical reduction of copper, the glue decomposes and degrades without the formation of species that interfere with the reduction reaction [39]. Therefore, the observed variation in the kinetic parameters at low glue concentrations, which are significantly lower than the Cu2+ concentration in the electrolyte, and under the consideration of an activation-controlled kinetic regime, suggests that the additive presents a localized interaction at the electrode interface. In the case of the differences observed in the kinetic parameter values with the addition of thiourea, these can be explained in terms of the formation and adsorption of the complexes described in Reactions (9) and (10).
Table 1 shows the summary values of the exchange current density,  i 0 , and the cathodic charge transfer coefficient obtained using the Tafel approximation from the polarization curves for all the conditions tested.
Additionally, the partial order of the Cu2+/Cu reaction in terms of the concentration of glue, thiourea, and chloride was determined using the logarithmic form of the general rate equation for an electrochemical reaction given using Equation (13), in which n is the number of electrons transferred; F is the Faraday constant; [A] is the concentration of the additive (glue, thiourea, or chloride); m is the partial order of reaction referred to species A; and K is a constant depending on the temperature and electrode potential [40]:
log i c = log n F K + m l o g [ A ]
For the above, the relationship between the cathodic current density (log  i c ) and additive concentration (log [A]) was plotted for four overpotential values (−30, −35, −55, and −60 mV); the slope corresponds to the partial order of the electrochemical reaction, which is shown in Figure 7.
It was verified that, for the solutions with the addition of glue and thiourea, the partial order was dependent on the concentration of the additives but practically independent of the applied overpotential. The rate equations of the half-reaction in terms of the concentration of glue and thiourea valid for the experimental conditions of the present study are:
i c = n F K 1 [ GL ] 0.35   to   0.40
i c = n F K 2 [ T u   ] 0.2   to   0.3
On the other hand, for solutions with Cl addition it was determined that the partial order of the electrochemical reaction is independent of the concentration of this additive, so that, the reduction rate is given using Equation (16), suggesting that the chloride ion does not have an effect on the reduction kinetics of cupric ions under charge transfer control.
i c = n F K 3 Cl 0 = n F K 3

3.2. Adsorption Isotherms

The main mechanism of action of the additives as growth levelers of the Cu cathodes during electrorefining consists of the blocking of active sites on the cathodic surface where the electrocrystallization takes place. In this sense, it was proposed that the levelling effect can be explained in terms of the adsorption of the additives on the surface of the growing deposit.
Considering that the electrodeposition of the metal species happens only on the additive-free cathodic surface, the current density measured in the base solution,  i , can be directly related to the maximum cathodic surface available for reduction. Then, the fraction of the cathodic surface covered by the adsorption of additives, θ, can be estimated as a function of the current density,  i * , measured in the presence of additives, so that [41]:
θ = i i * i
Thus, depending on the fraction of the surface covered by the additive,  θ , two limit values would be adopted. For the condition of the cathodic surface completely free of additives for reduction,  θ = 0 , the current density,  i * , is equal to that of the base solution,  i . In contrast, in the case of the cathodic surface completely covered by the additive,  θ = 1 , the current density in the presence of additives,  i * , is null, resulting in the complete blockage of the cathodic surface.
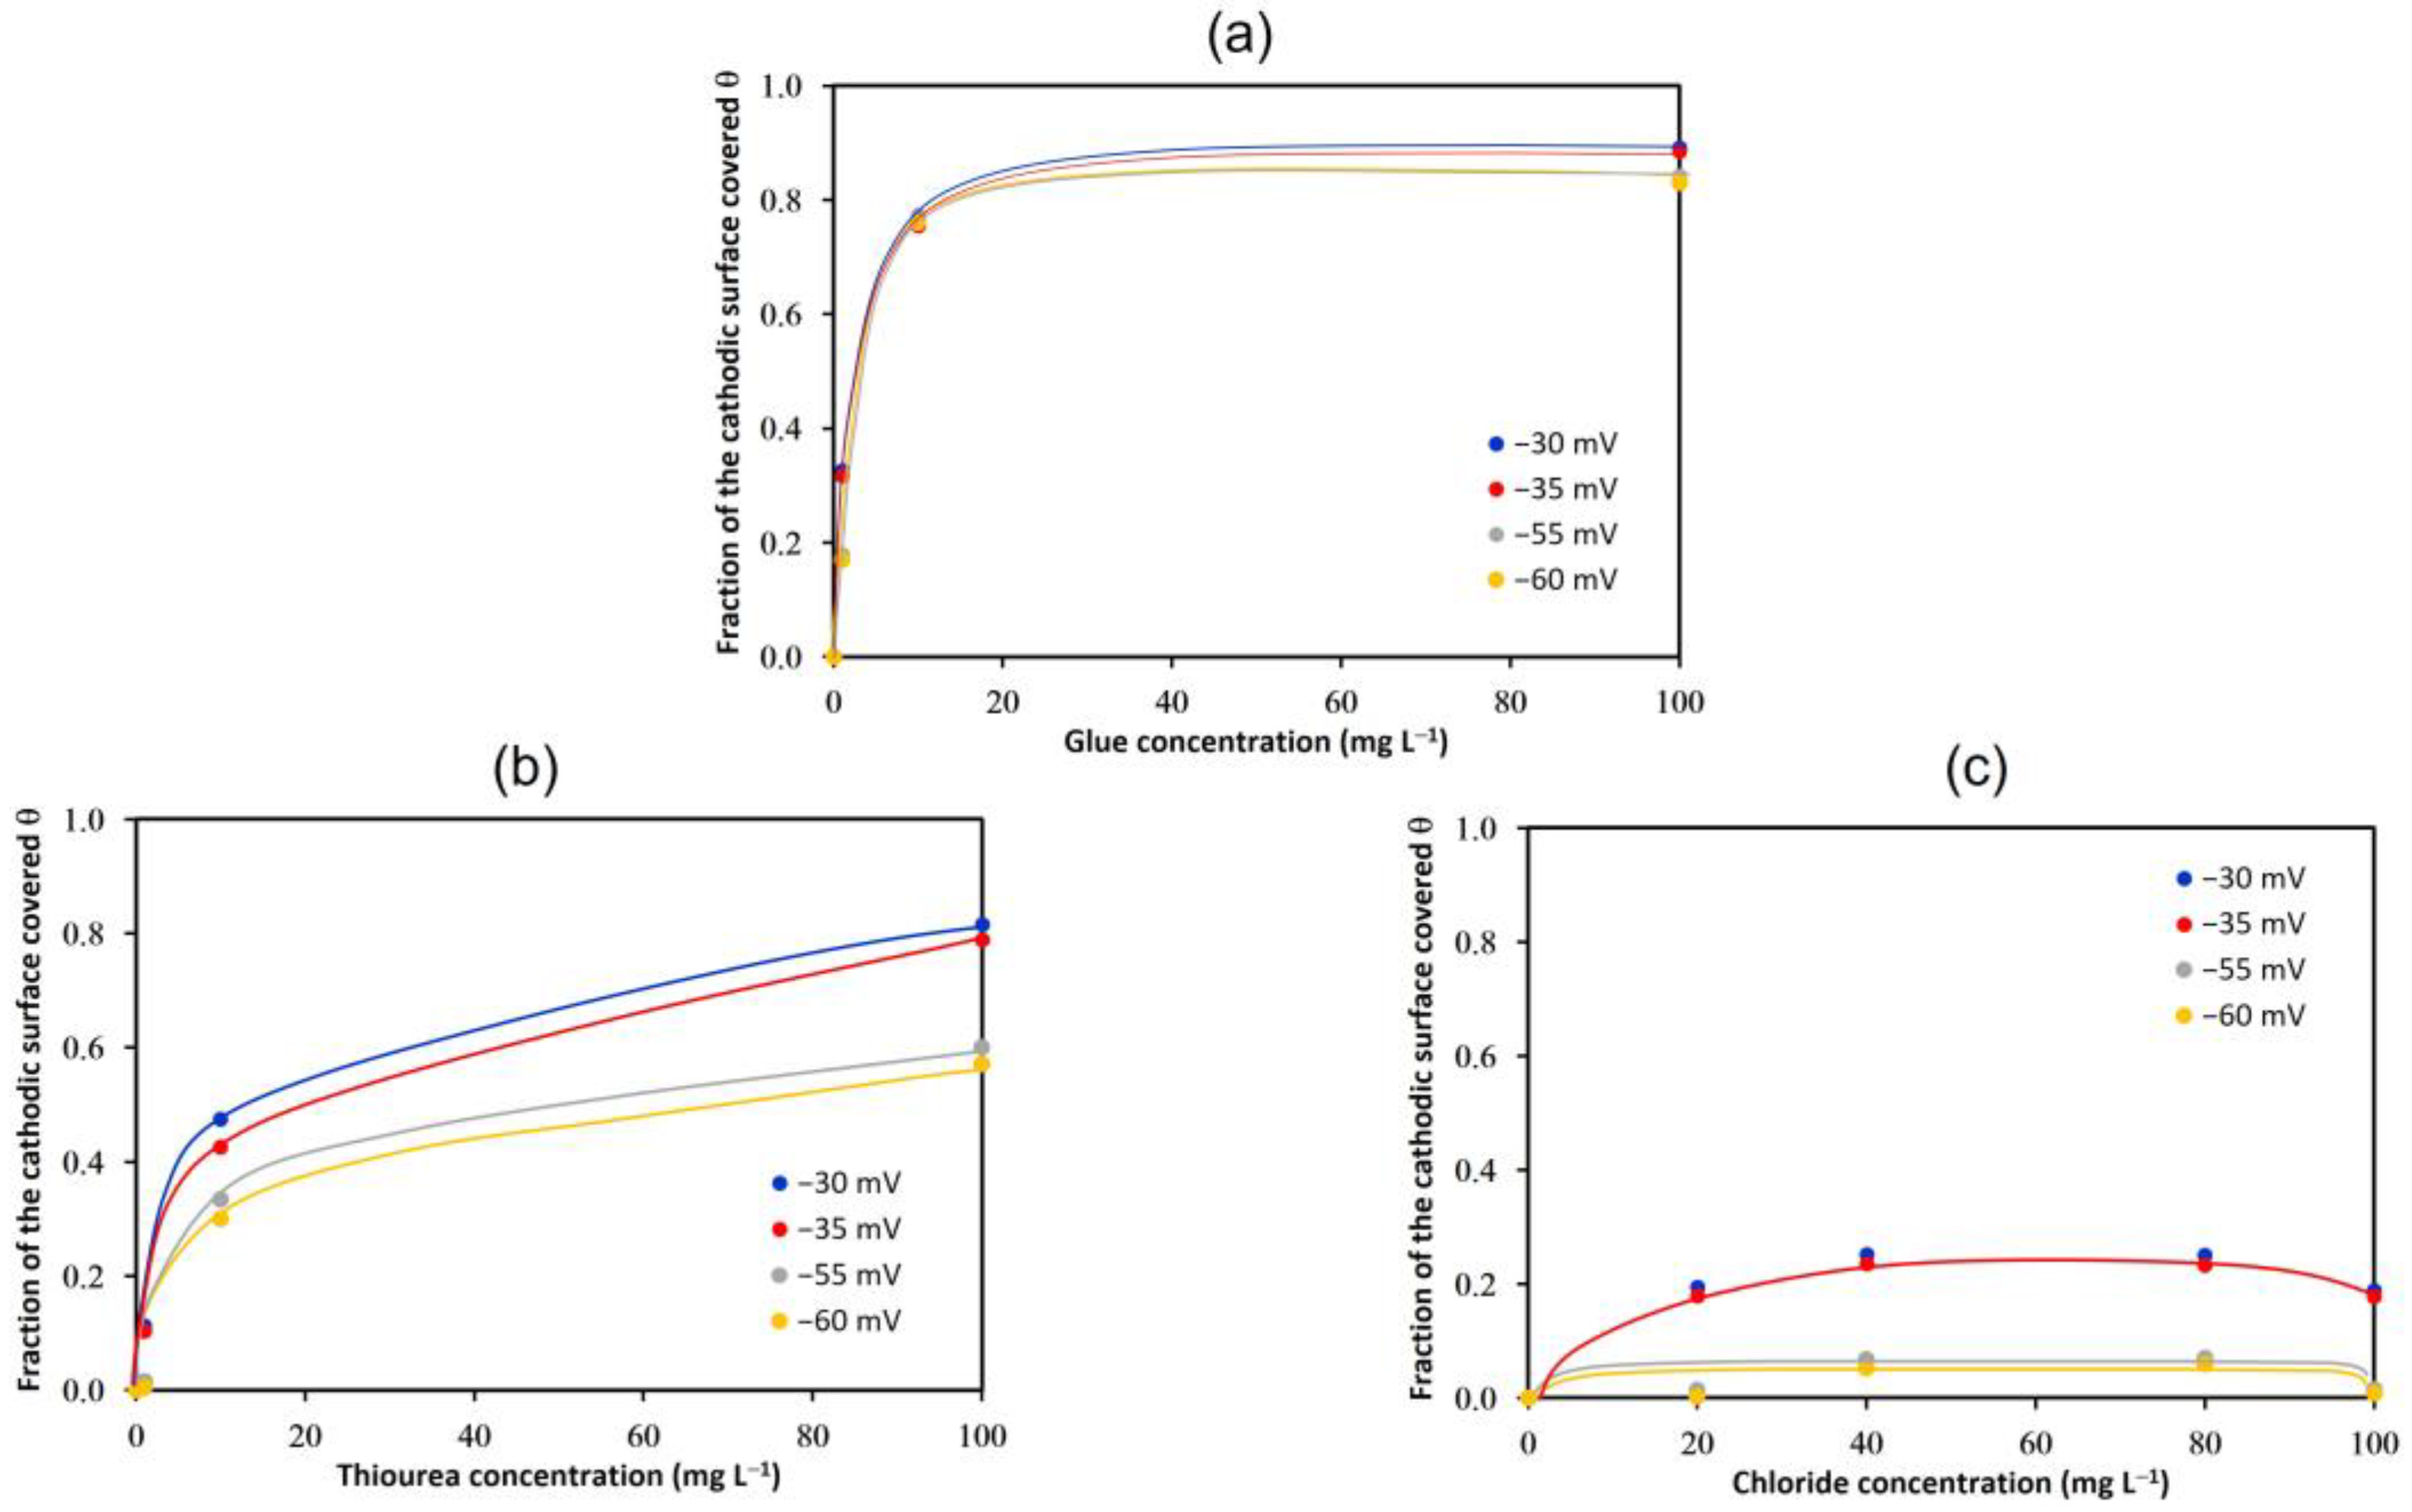
Based on the above, the values of the fraction of the cathodic surface covered, θ, were determined for four values of overpotentials, as functions of the concentration of the additives, and the results are shown in Figure 8. The effect of glue on the fraction covered, θ, was significant up to 10 mg L−1, reaching values close to 0.8 for all overpotentials evaluated. In contrast, the fraction of the surface covered increases throughout the range of thiourea concentrations evaluated, also showing a strong dependence on the overpotential value considered, since the higher the overpotential value, the lower the surface covered by the additive.
The observed differences in the fraction of the cathodic surface covered in relation to the overpotential can be explained in terms of the behavior of the additives in the experimental conditions tested. On one hand, according to the literature, the degradation of the glue is mainly caused by the temperature effect and catalyzed by sulfuric acid [39]. Then, based on the high values of θ and under the experimental conditions of this study, the glue remained active to be adsorbed on the cathodic surface, which was not affected by the considered overpotential. However, the reduction of thiourea complexes formed according to Reactions (8) to (10) is favored by increasing the cathodic overpotential, resulting in increasing the current density,  i * , and thus decreasing the fraction covered, θ.
Regarding the addition of chloride, the fraction reached values between 0.19 and 0.30 in the whole concentration range and were notably lower than those reached for the other two additives, besides being dependent on the overpotential. Cupric ions in the presence of chloride can form CuCl and be adsorbed on the cathodic surface according to the reaction Cu2+ + Cl + e ⇄ CuCl(ads) (E0 = 0.538 V/ENH). However, the adsorption of Cl or CuCl depends on the electrode potential. At low overpotentials, adsorption of both species is promoted, whereas, as the overpotential increases, the specific adsorption of Cl is favored [42]. This agrees with the decrease in the surface covered, θ, at overpotentials more negative than −55 mV. Therefore, the dependence of the fraction of the cathodic surface covered on the overpotential indicates that the mechanism of action of Cl as a grain refiner during copper electrodeposition is not based only on the specific adsorption of this ion on the growing deposit.
The adsorption of ions and organic compounds in electrochemical systems can be conveniently represented using adsorption isotherm models that relate the number of adsorbed molecules at the electrode–electrolyte interface to the activity of the adsorbate in the electrolyte under conditions of a constant electrode potential and temperature. The number of molecules adsorbed at the electrode–electrolyte interface is expressed in terms of the fraction of the electrode surface covered by the adsorbate, θ, and its activity, which, at low concentrations, approximates its concentration in the solution.
Adsorption models for electrochemical systems are based on considerations such as: surface characteristics (homogeneous or heterogeneous), lateral interaction between adsorbate particles, and size of adsorbed particles, among others. In the case of organic compounds, there are also other aspects that must be considered such as the structure, size and orientation of the adsorbed organic molecules, texture and homogeneity of the electrode, and solubility of the organic compounds in the electrolyte, among others.
In the present investigation, the four adsorption models, Langmuir, Frumkin, Temkin, and Flory-Higgins, that could best represent the studied system were evaluated. In the case of glue and thiourea, the best correlation for the experimental data (Table 2) was obtained with the Temkin model. This model considers not only the interaction of the adsorbed particles, but also different surface adsorption energies associated with the heterogeneity of the adsorption surface [43] caused by the presence of steps, dislocations, and imperfections in the crystal structure; this is represented by:
θ = 1 f l n B [ A ]
where f is the coefficient representing the lateral interaction between the adsorbed particles in the adsorption layer and the surface heterogeneity, B is the equilibrium constant of the adsorption phenomenon, and [A] is the concentration of the additive.
In both cases, the values of f are positive, indicating the existence of attractive forces between the adsorbed particles in the adsorption layer. However, positive values of f have also been associated by some authors with the vertical orientation of the inhibitor particles on the electrode surface [44]. On the other hand, the value of B is related to the binding strength between the adsorbate and the adsorbent, which initially corresponds to the stainless steel surface and evolves into the metallic copper deposit. The higher value of B corresponding to the solutions with the addition of glue suggests a higher adsorption efficiency and therefore a higher inhibition efficiency in the growth of the deposit. In the case of chloride addition, none of the evaluated models fitted successfully to the experimental data, obtaining correlation coefficients equal to or less than 0.51.

3.3. Deposits Characterization

Quantitative analysis of the morphology of the last deposited layer was carried out from measurements of relative surface roughness parameters by correlating histograms of brightness obtained via electron microscopy with relative heights of the deposit, which allowed us to recreate three-dimensional images of the topography of the deposit.
From these results, statistical parameters were also determined to study the effect of the additives on the heterogeneity of the deposits at two levels of cathodic current density.
On the other hand, the texture analysis considered the effect of the additives on the preferential growth planes of the deposit from X-ray diffraction spectra acquired on the surface of the massive deposits.

3.3.1. Deposits Surface Roughness

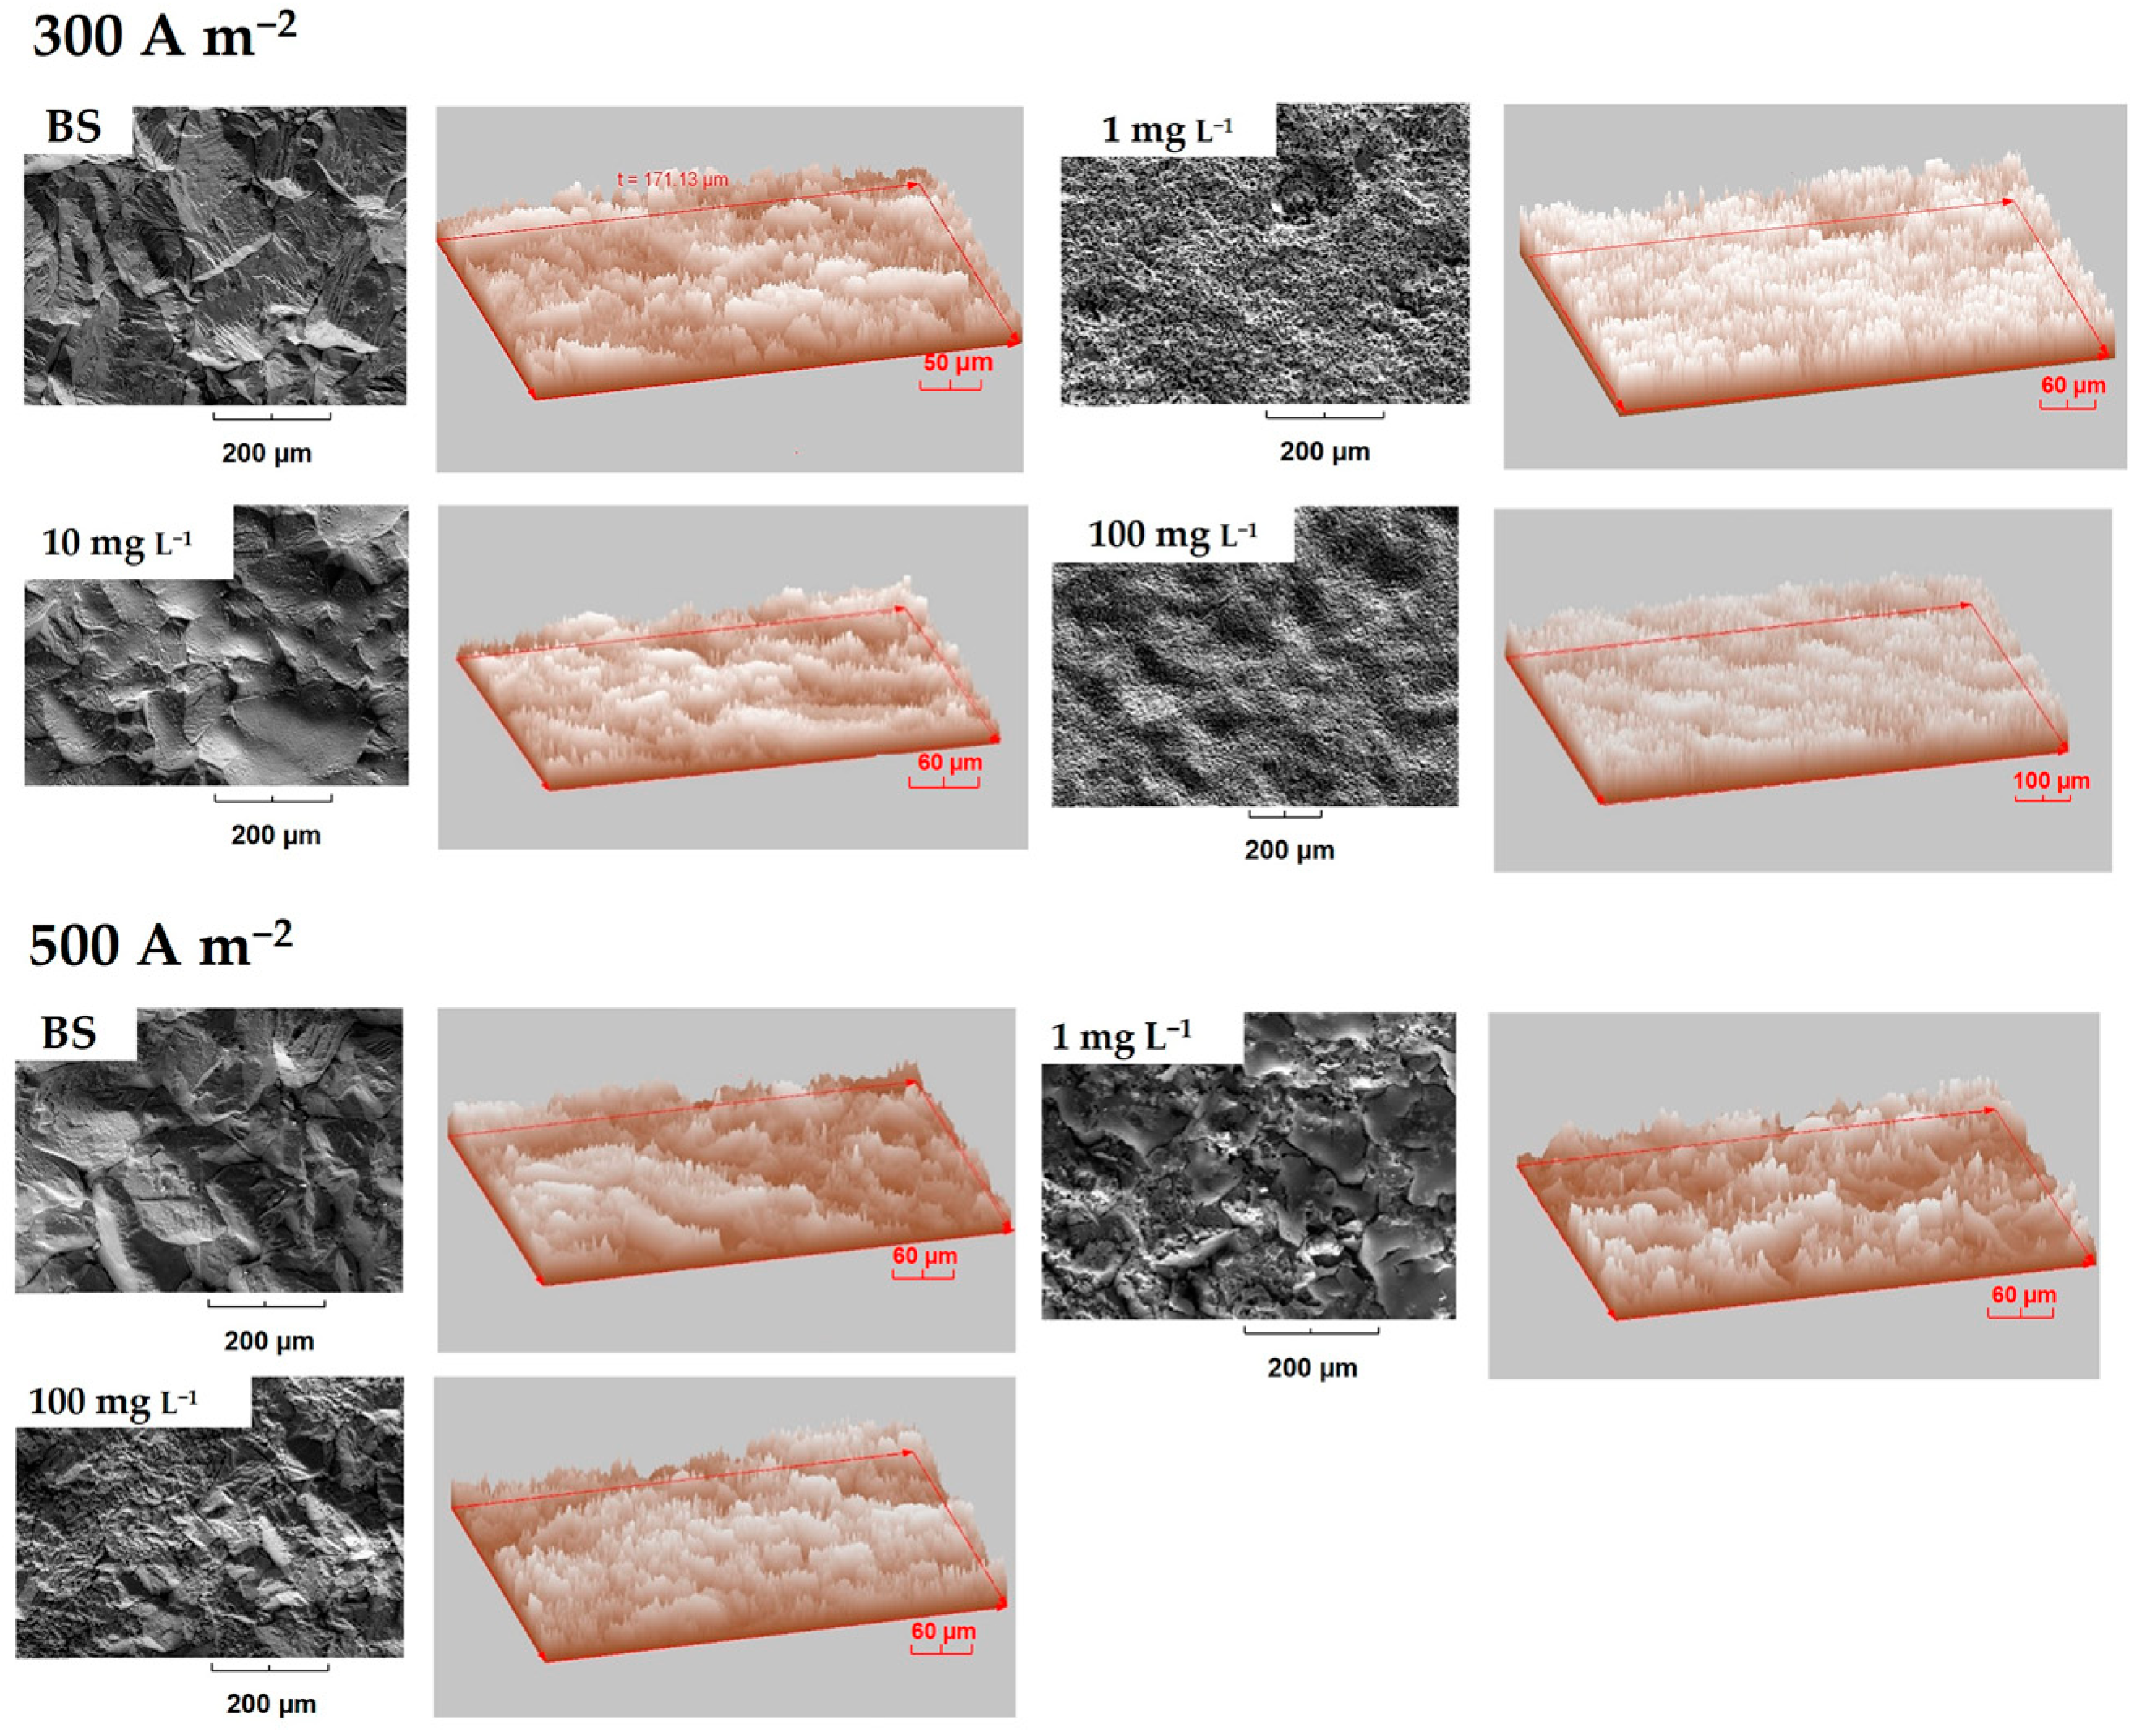
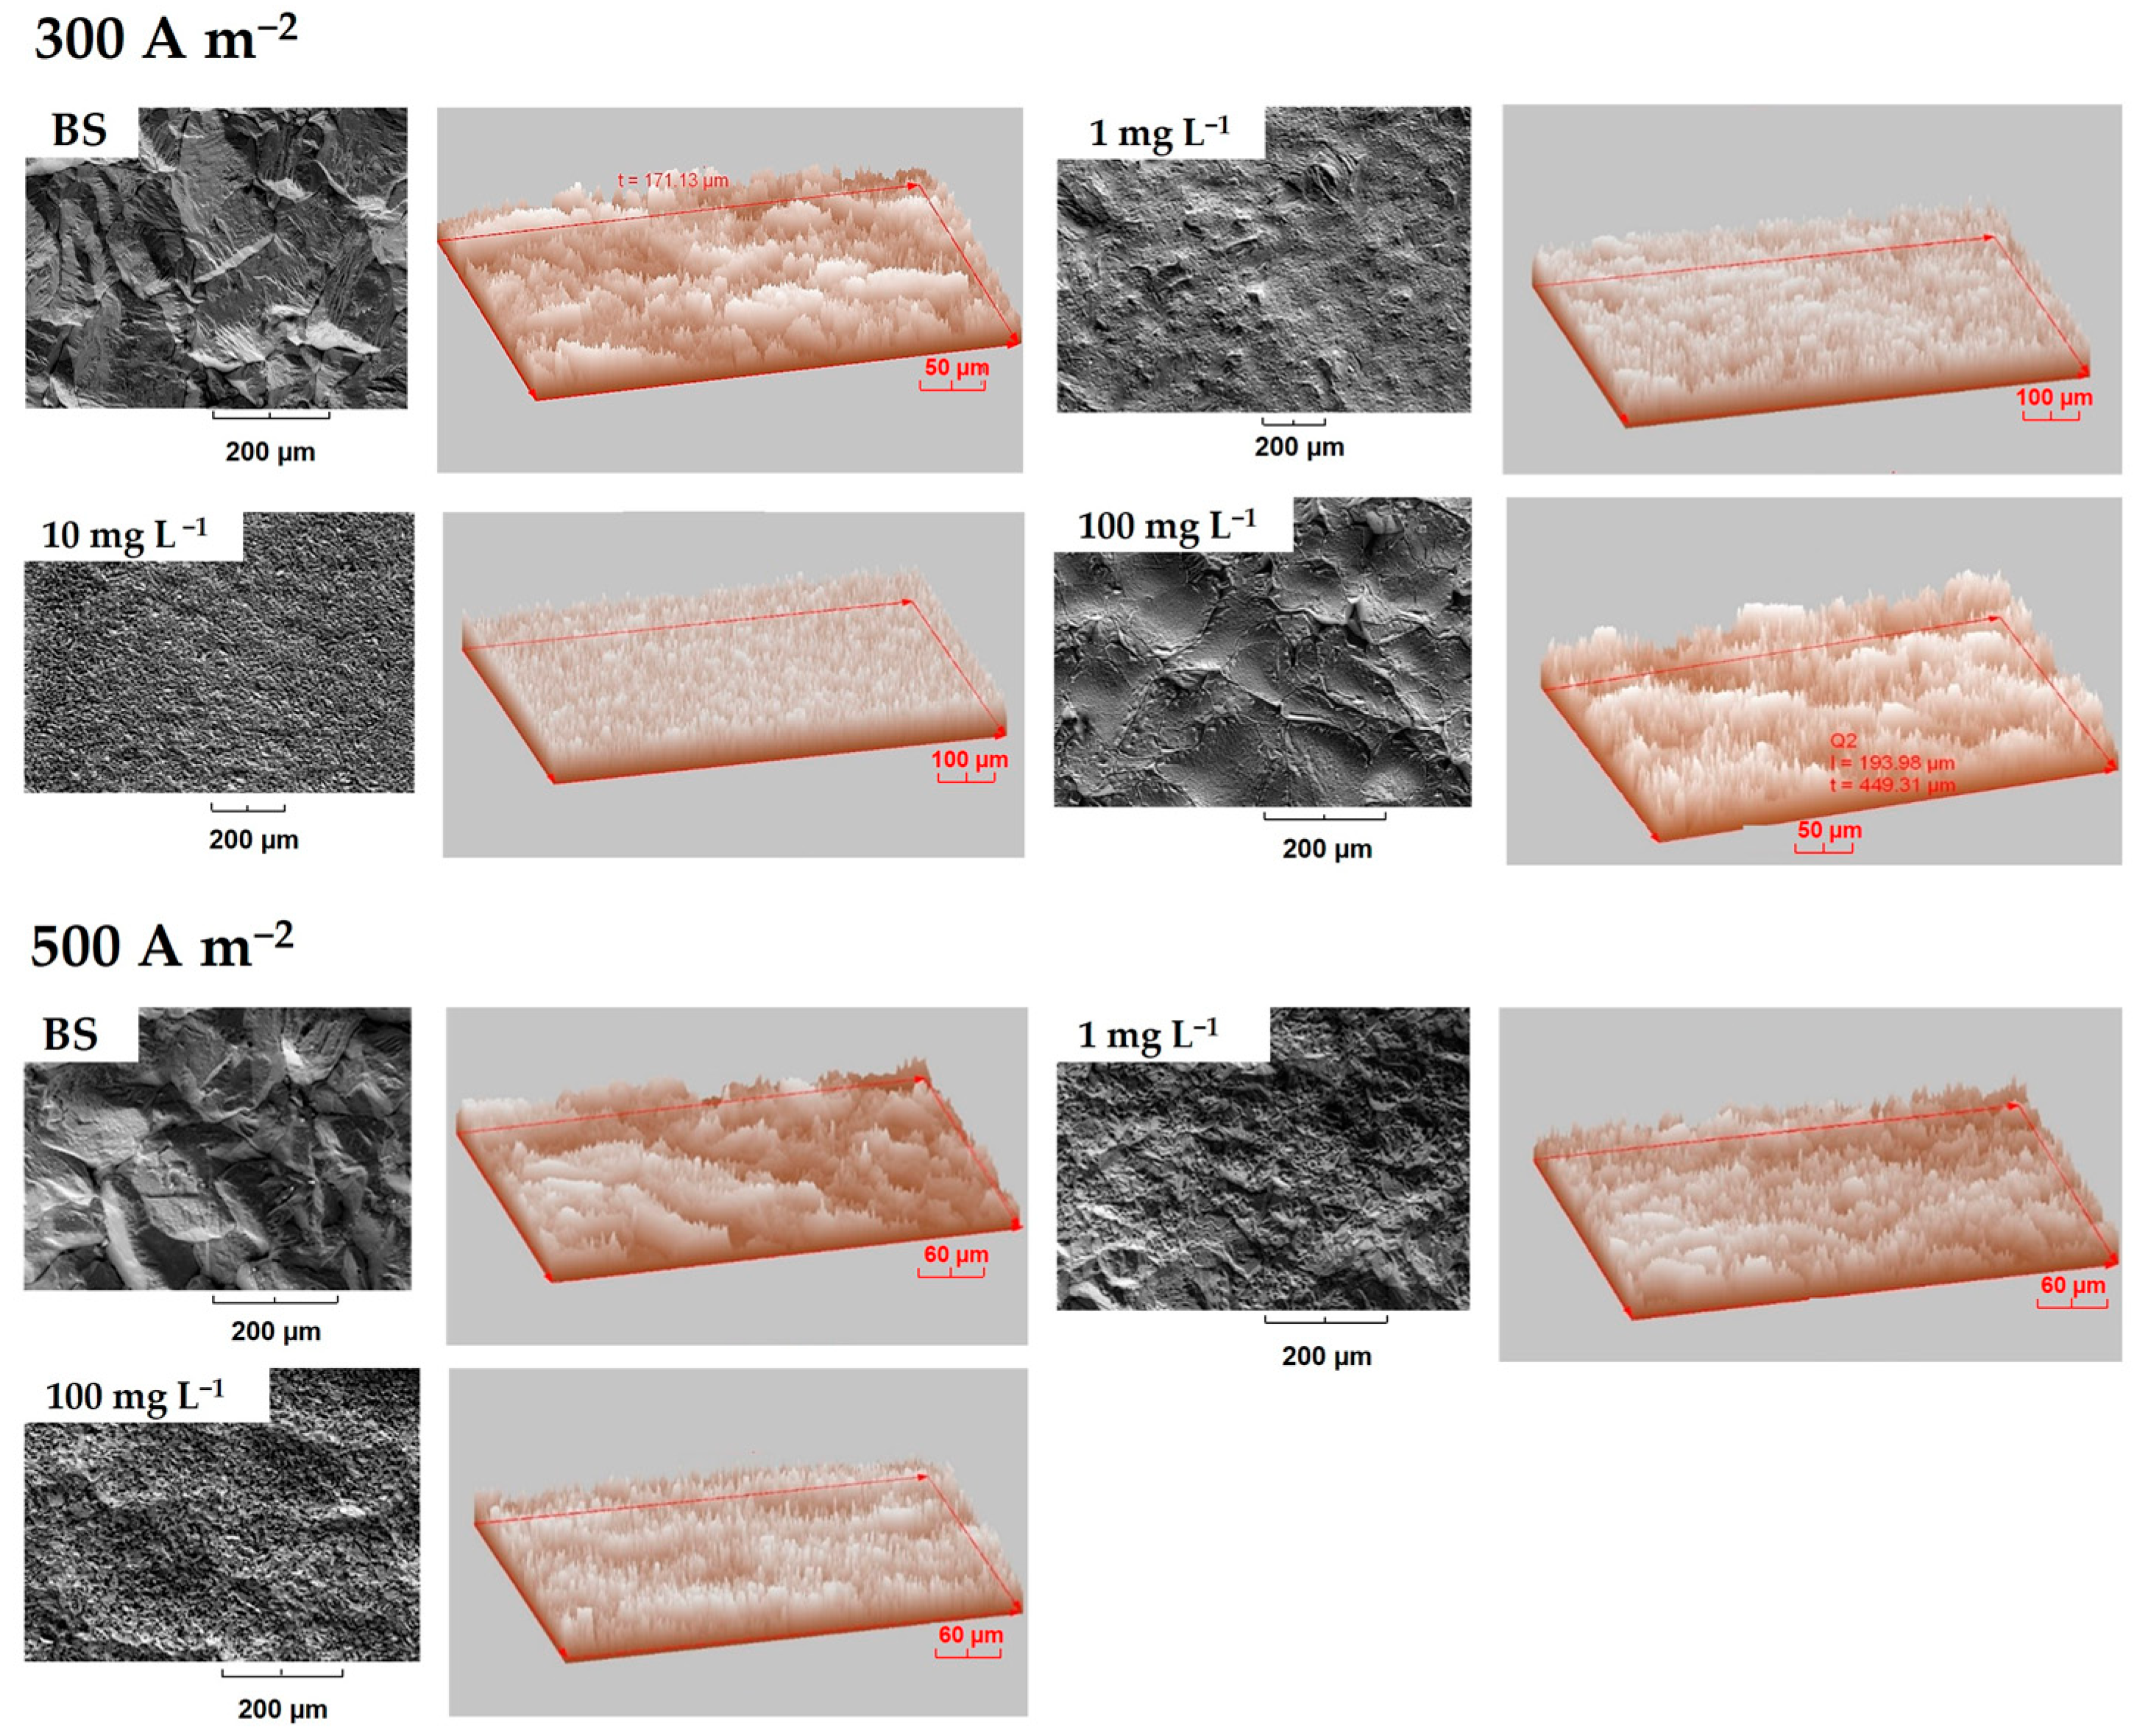
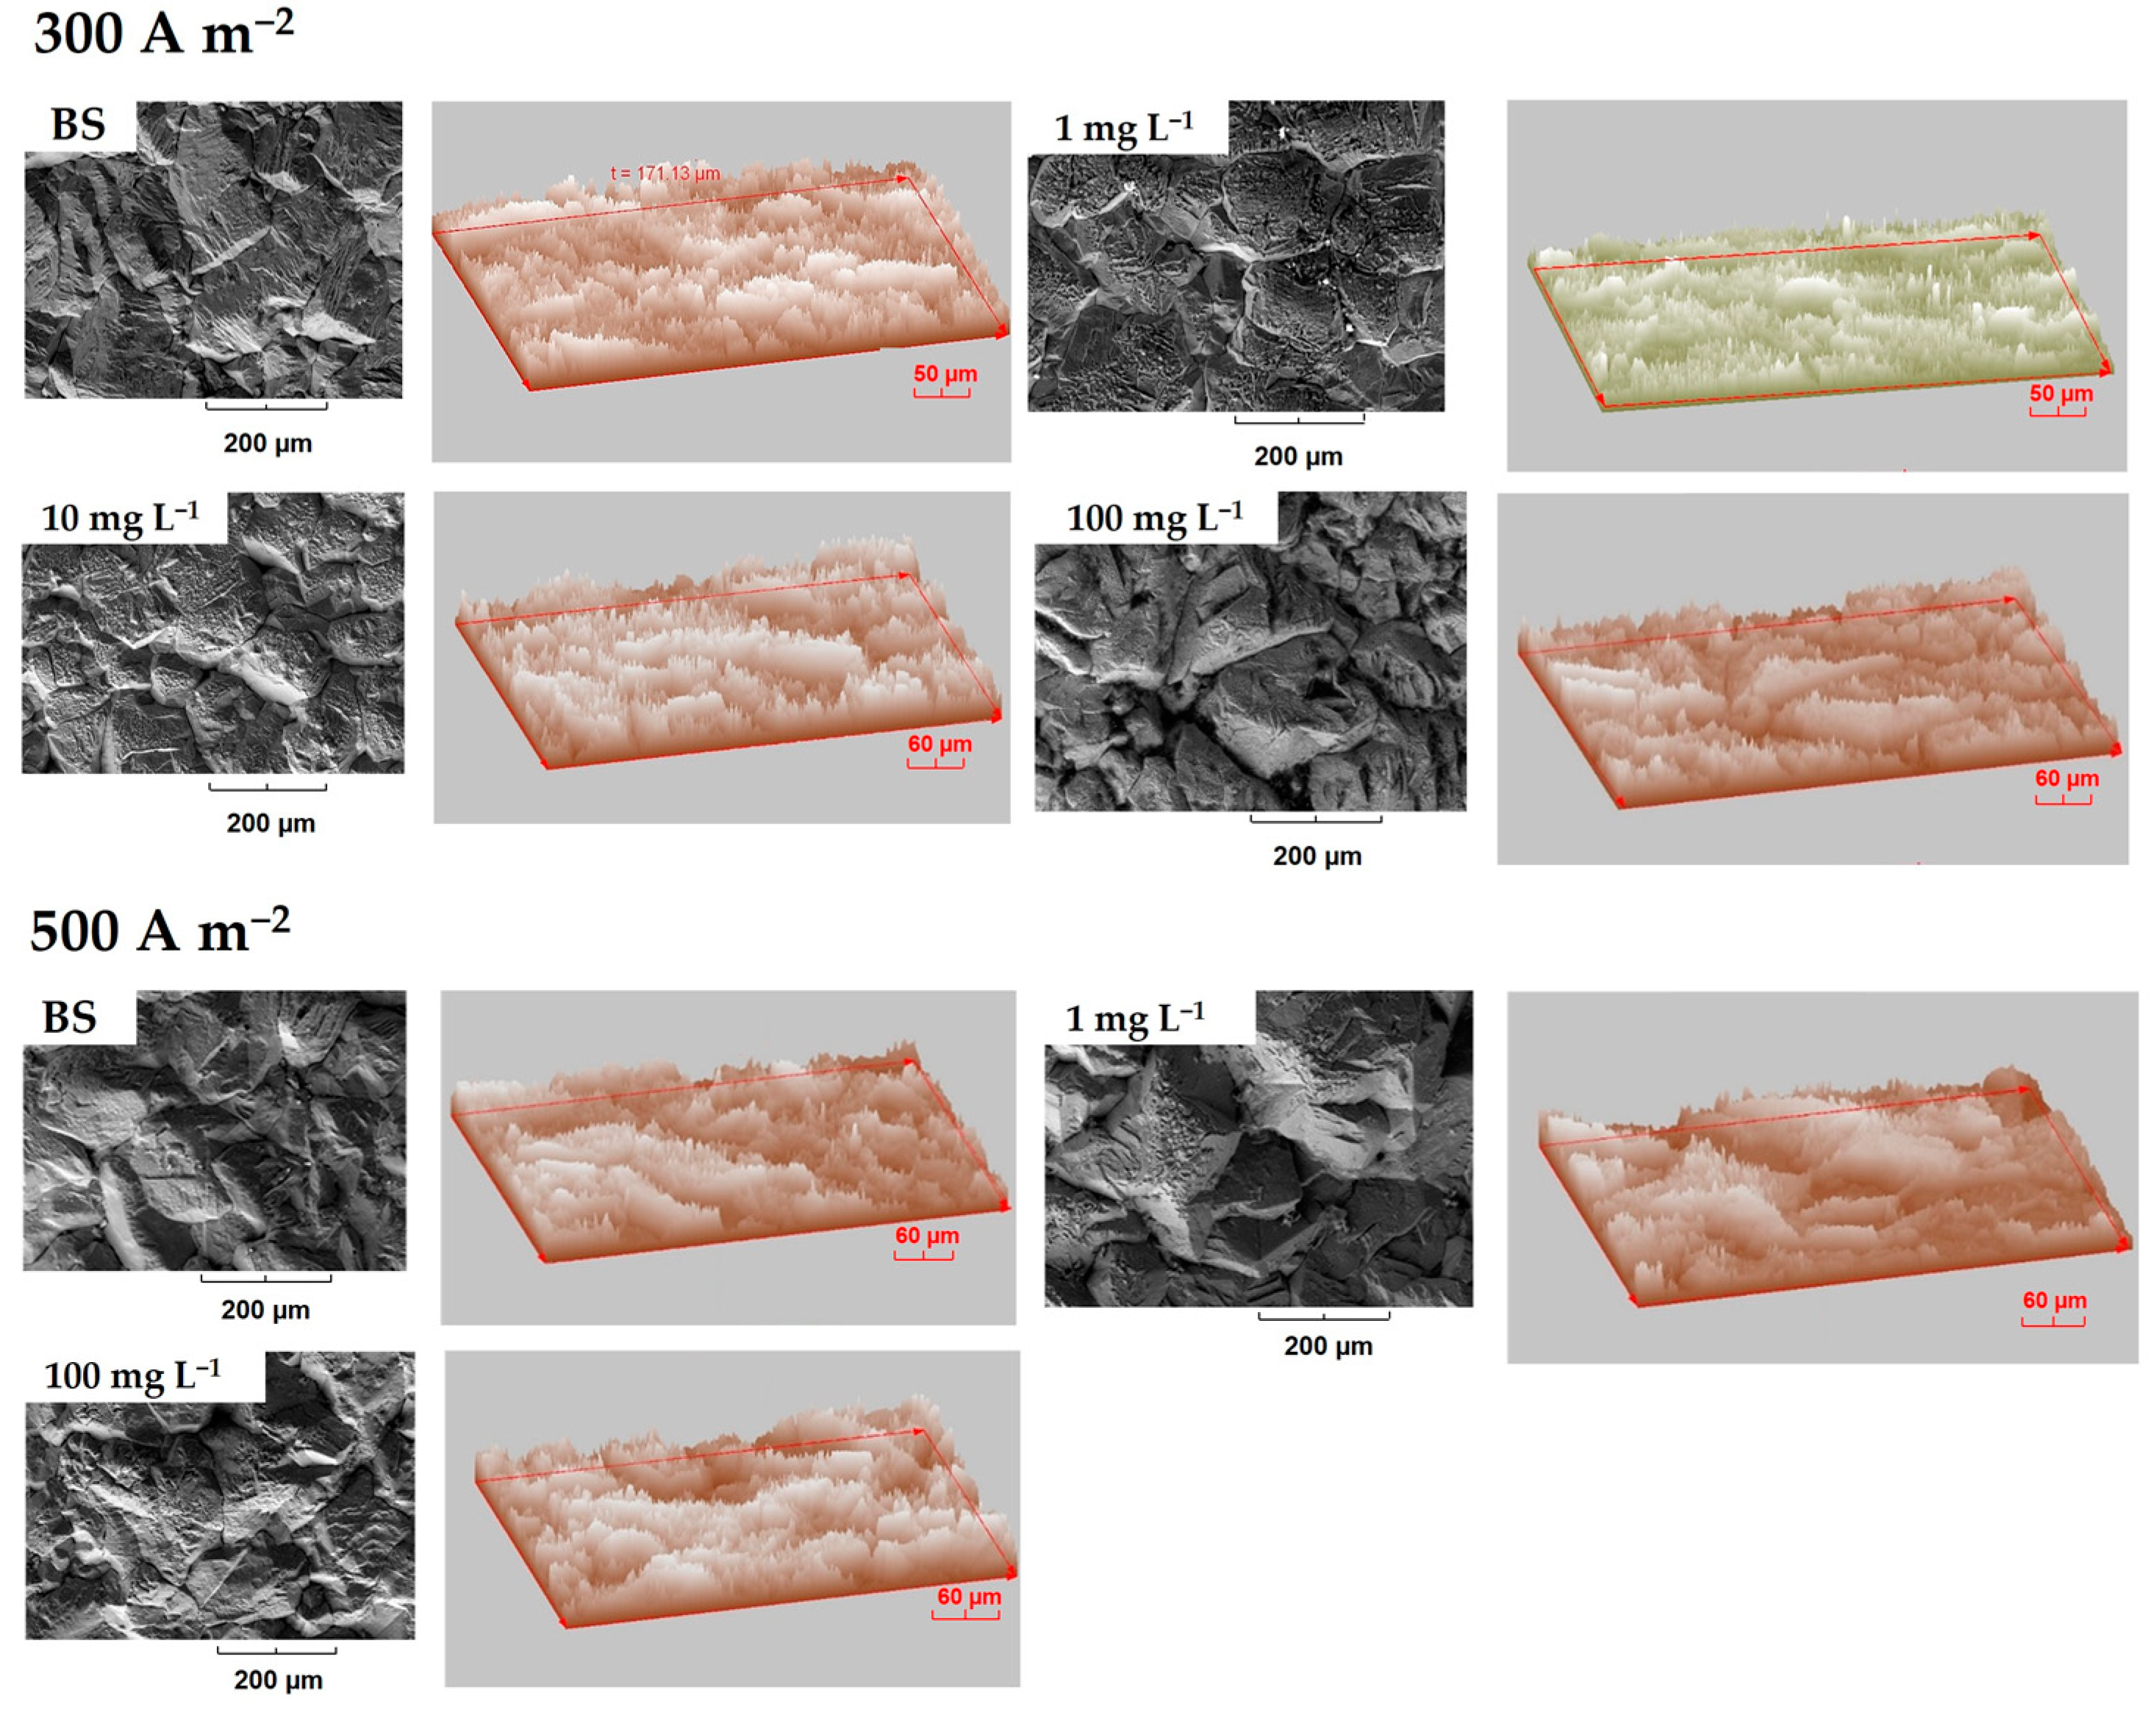
Figure 9, Figure 10 and Figure 11 show SE images of the surface of the deposits and of the three-dimensional projection obtained from the brightness histograms. The analysis of these images allowed us to obtain statistical parameters to characterize the roughness of the deposits using Pearson’s asymmetry coefficient A and kurtosis.
The third moment of the surface height distribution (Equation (19)) represents the degree of asymmetry of the height distribution in relation to the average value given by Pearson’s asymmetry coefficient A, defined as:
A = 1 N i = 1 N z i z σ 3
where N is the number of brightness measurements,  z  is the mean value of the height, and σ is the standard deviation. A negative A value indicates a deviation above the mean line and therefore larger amplitude peaks; on the other hand, a positive A value indicates a deviation below the mean line and therefore a surface with sharper peaks.
Meanwhile, kurtosis indicates the degree of concentration of the distribution values regarding to a normal distribution and is associated with the geometry of the peaks and valleys, and therefore of the waviness profile of the surface. For this purpose, the kurtosis coefficient K is defined according to the expression:
K = 1 N i = 1 N z i z σ 4 3
A positive K value indicates a leptokurtic distribution with a high degree of concentration around the mean value of the distribution and therefore a large number of sharp peaks. On the other hand, a K value equal or very close to zero indicates a mesokurtic distribution or an average degree of concentration around the central values, similar to that of a normal distribution, and therefore a surface with a Gaussian-type distribution of heights. Finally, a negative K value indicates a platykurtic distribution with a low degree of concentration around the central values, indicating fewer sharp peaks, and therefore a more uniform distribution of heights on the surface of the deposit. The results of the statistical parameters calculated from the brightness measurements are shown in Table 3 and Table 4.
In general, for the base solution and for the two current density levels, the morphology of the deposit is very similar in terms of shape and degree of stepping; the last one is associated with vertical growth predominating over horizontal growth. The relative height of the deposits is observed to be heterogeneous and with similar variability for both conditions, which coincides with the similarity of the calculated kurtosis and asymmetry values.
In the case of organic additives, a significant effect on the surface appearance of the deposits is observed even at low concentrations. At a current density of 300 A m−2, the deposits appear more compact, thin, and homogeneous regarding the base solution; however, the levelling effect of the additives is dependent on their concentration in the electrolyte. In the case of glue, the effect is greater at concentrations of 1 and 100 mg L−1, while in the case of thiourea, it is greater at 1 and 10 mg L−1. Under these conditions, the effect of the additives on morphology is consistent with negative values of kurtosis and asymmetry that are lower than those of the base solution. The other way around, at 10 mg L−1 of glue and 100 mg L−1 of thiourea, the deposit presents morphological characteristics very similar to those of the base solution, which is reflected in the similarity of the kurtosis and asymmetry values.
In contrast, at a higher current density, 500 A m−2, even though changes in the surface appearance of the deposits are observed in the presence of the organic additives regarding the base case, the effect of the glue on the morphology of the deposits is less in comparison to the addition of thiourea. This agrees with the lower values of kurtosis and asymmetry in relation to the base solution, although the differences observed are smaller at 300 A m−2. According to the results, the addition of chloride does not significantly modify the surface aspect of the deposits, with the exception of a certain tendency to the formation of grains with less angular edges than that observed for the deposits obtained with the base solution, and the maintaining of the three-dimensional growth of the deposit, regardless of the current density level applied.
The results show that organic additives have a significant effect on the morphology of the deposits, acting as levelers. However, the degree of inhibition depends on the type and concentration of the additive and the current density level applied. It is clear that the current density has a considerable effect on the characteristics of the deposits in terms of their growth and development, which defines, to a large extent, their surface appearance. As the current density increases, the inhibitory effect decreases, probably due to the lower capacity of the substrate to adsorb the additive. Then, the increase in current density leads to higher nucleation velocities associated with higher incorporation rates of copper atoms that compete with the additive molecules to occupy active sites, thus decreasing the area available for adsorption; consequently, the deposit will develop a surface morphology similar to the condition in the absence of additive. It should be considered that to promote the inhibitory action at high current values, it is necessary to increase the concentration of additives in the electrolyte; an excess of these can cause adverse effects, for example, the weakening of massive deposits.

3.3.2. Effect of Additives on Deposit Texture Coefficient

The texture is used to describe the growth of the deposit and is determined by the conditions of the electrodeposition process and the presence of inhibiting and grain-refining agents in the electrolyte. The texture of an electrolytic deposit has its origin in the different growth velocities of the grains oriented in different crystallographic planes.
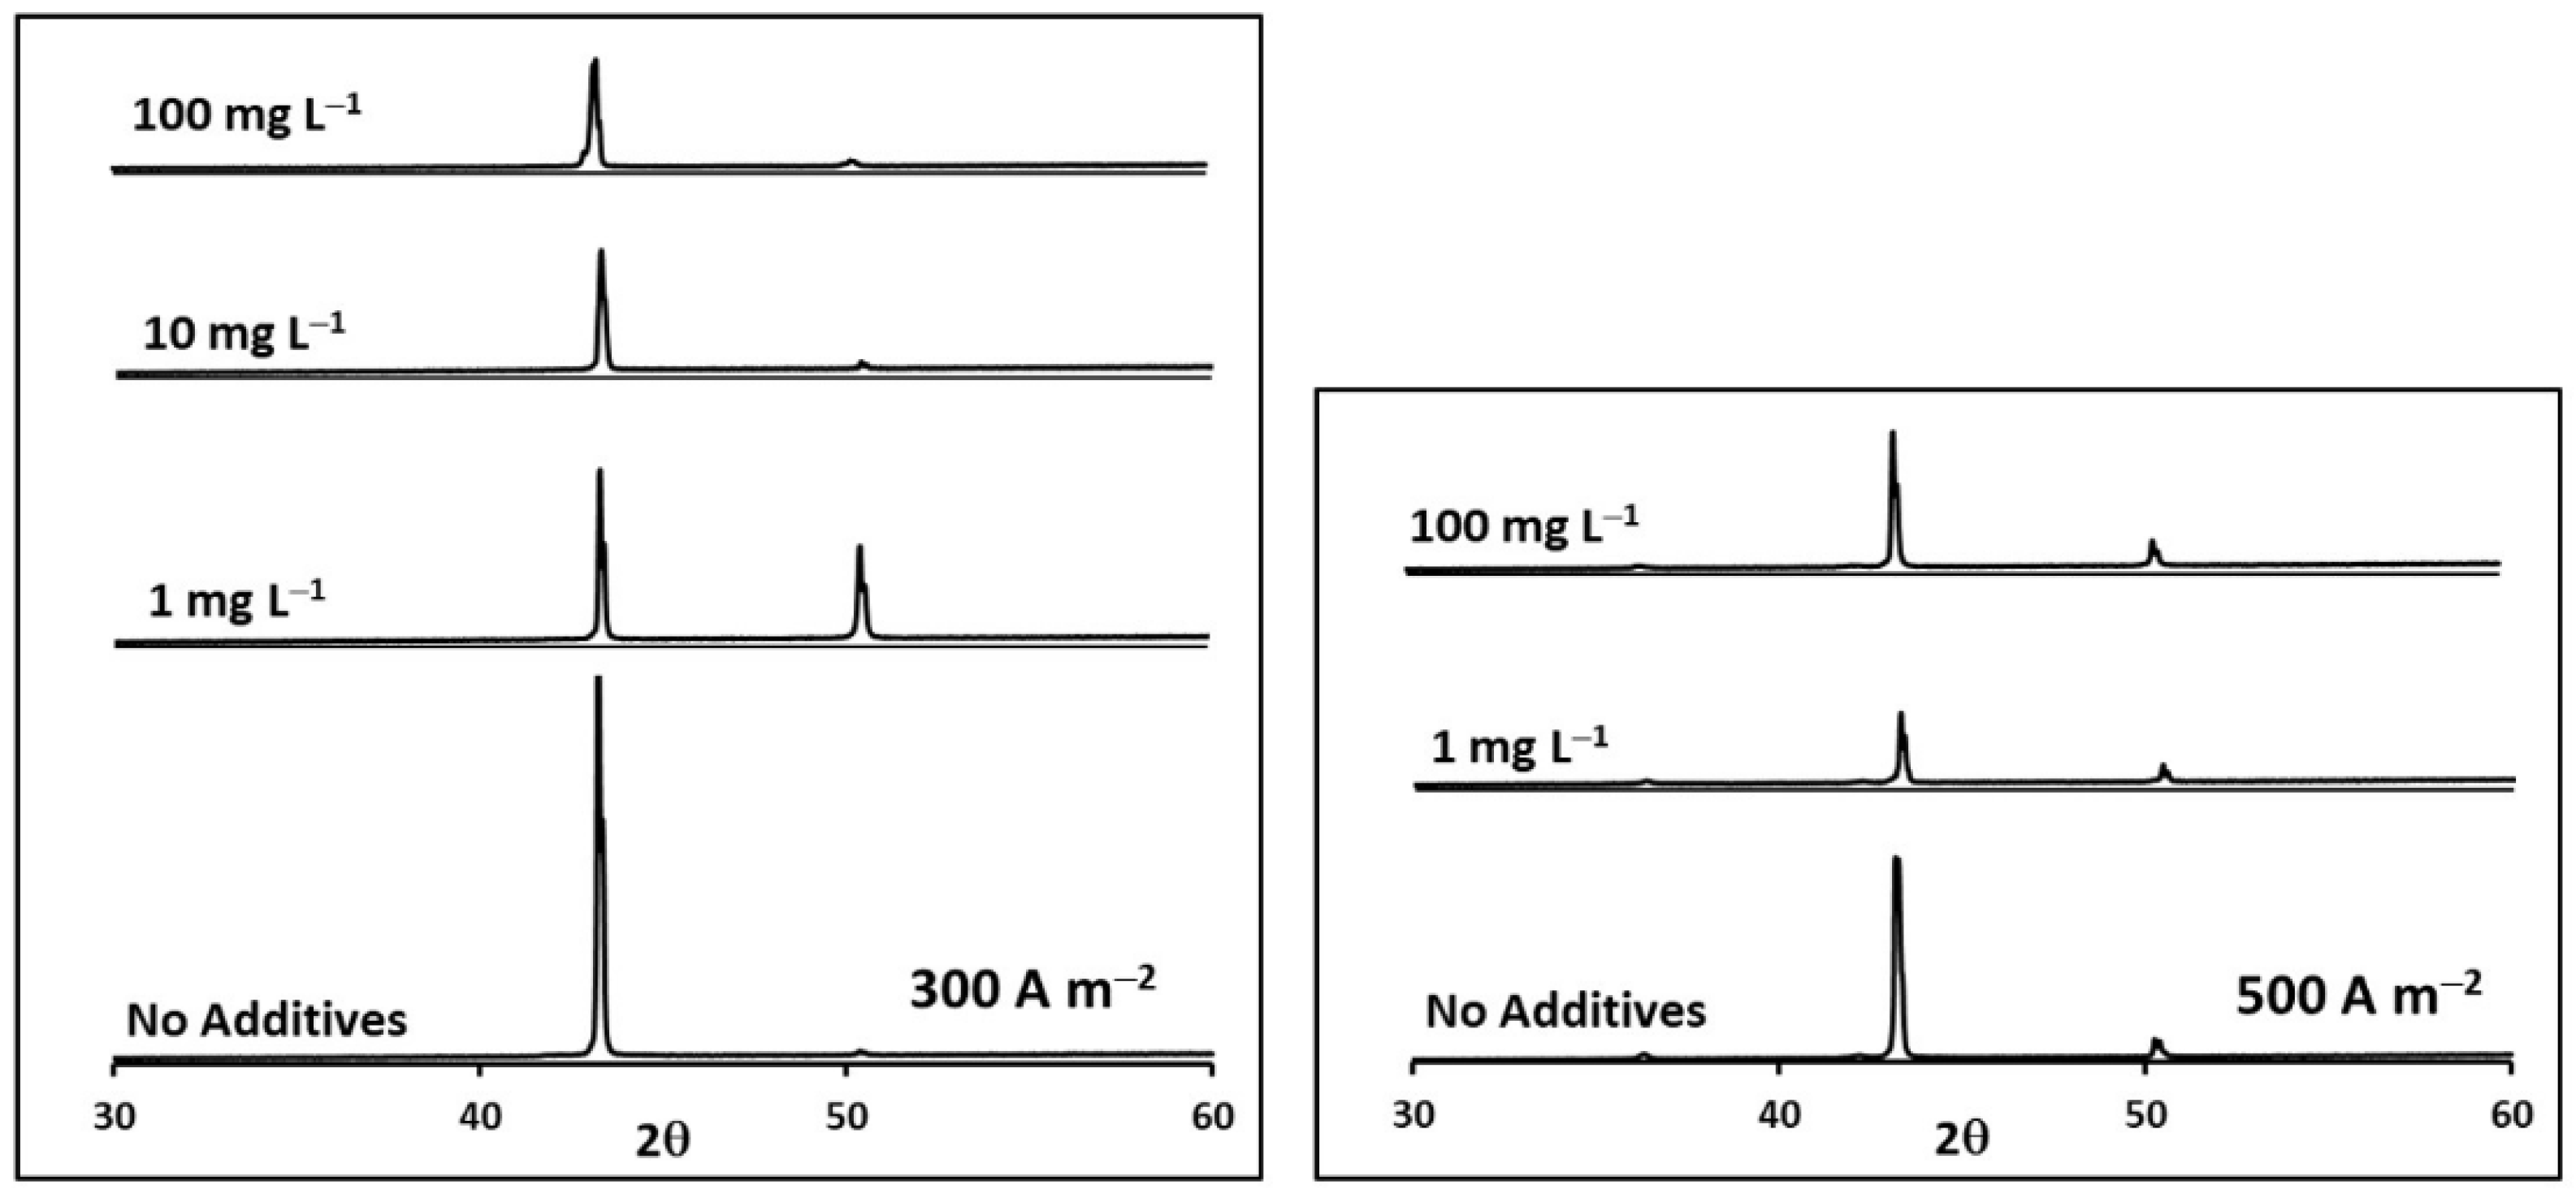
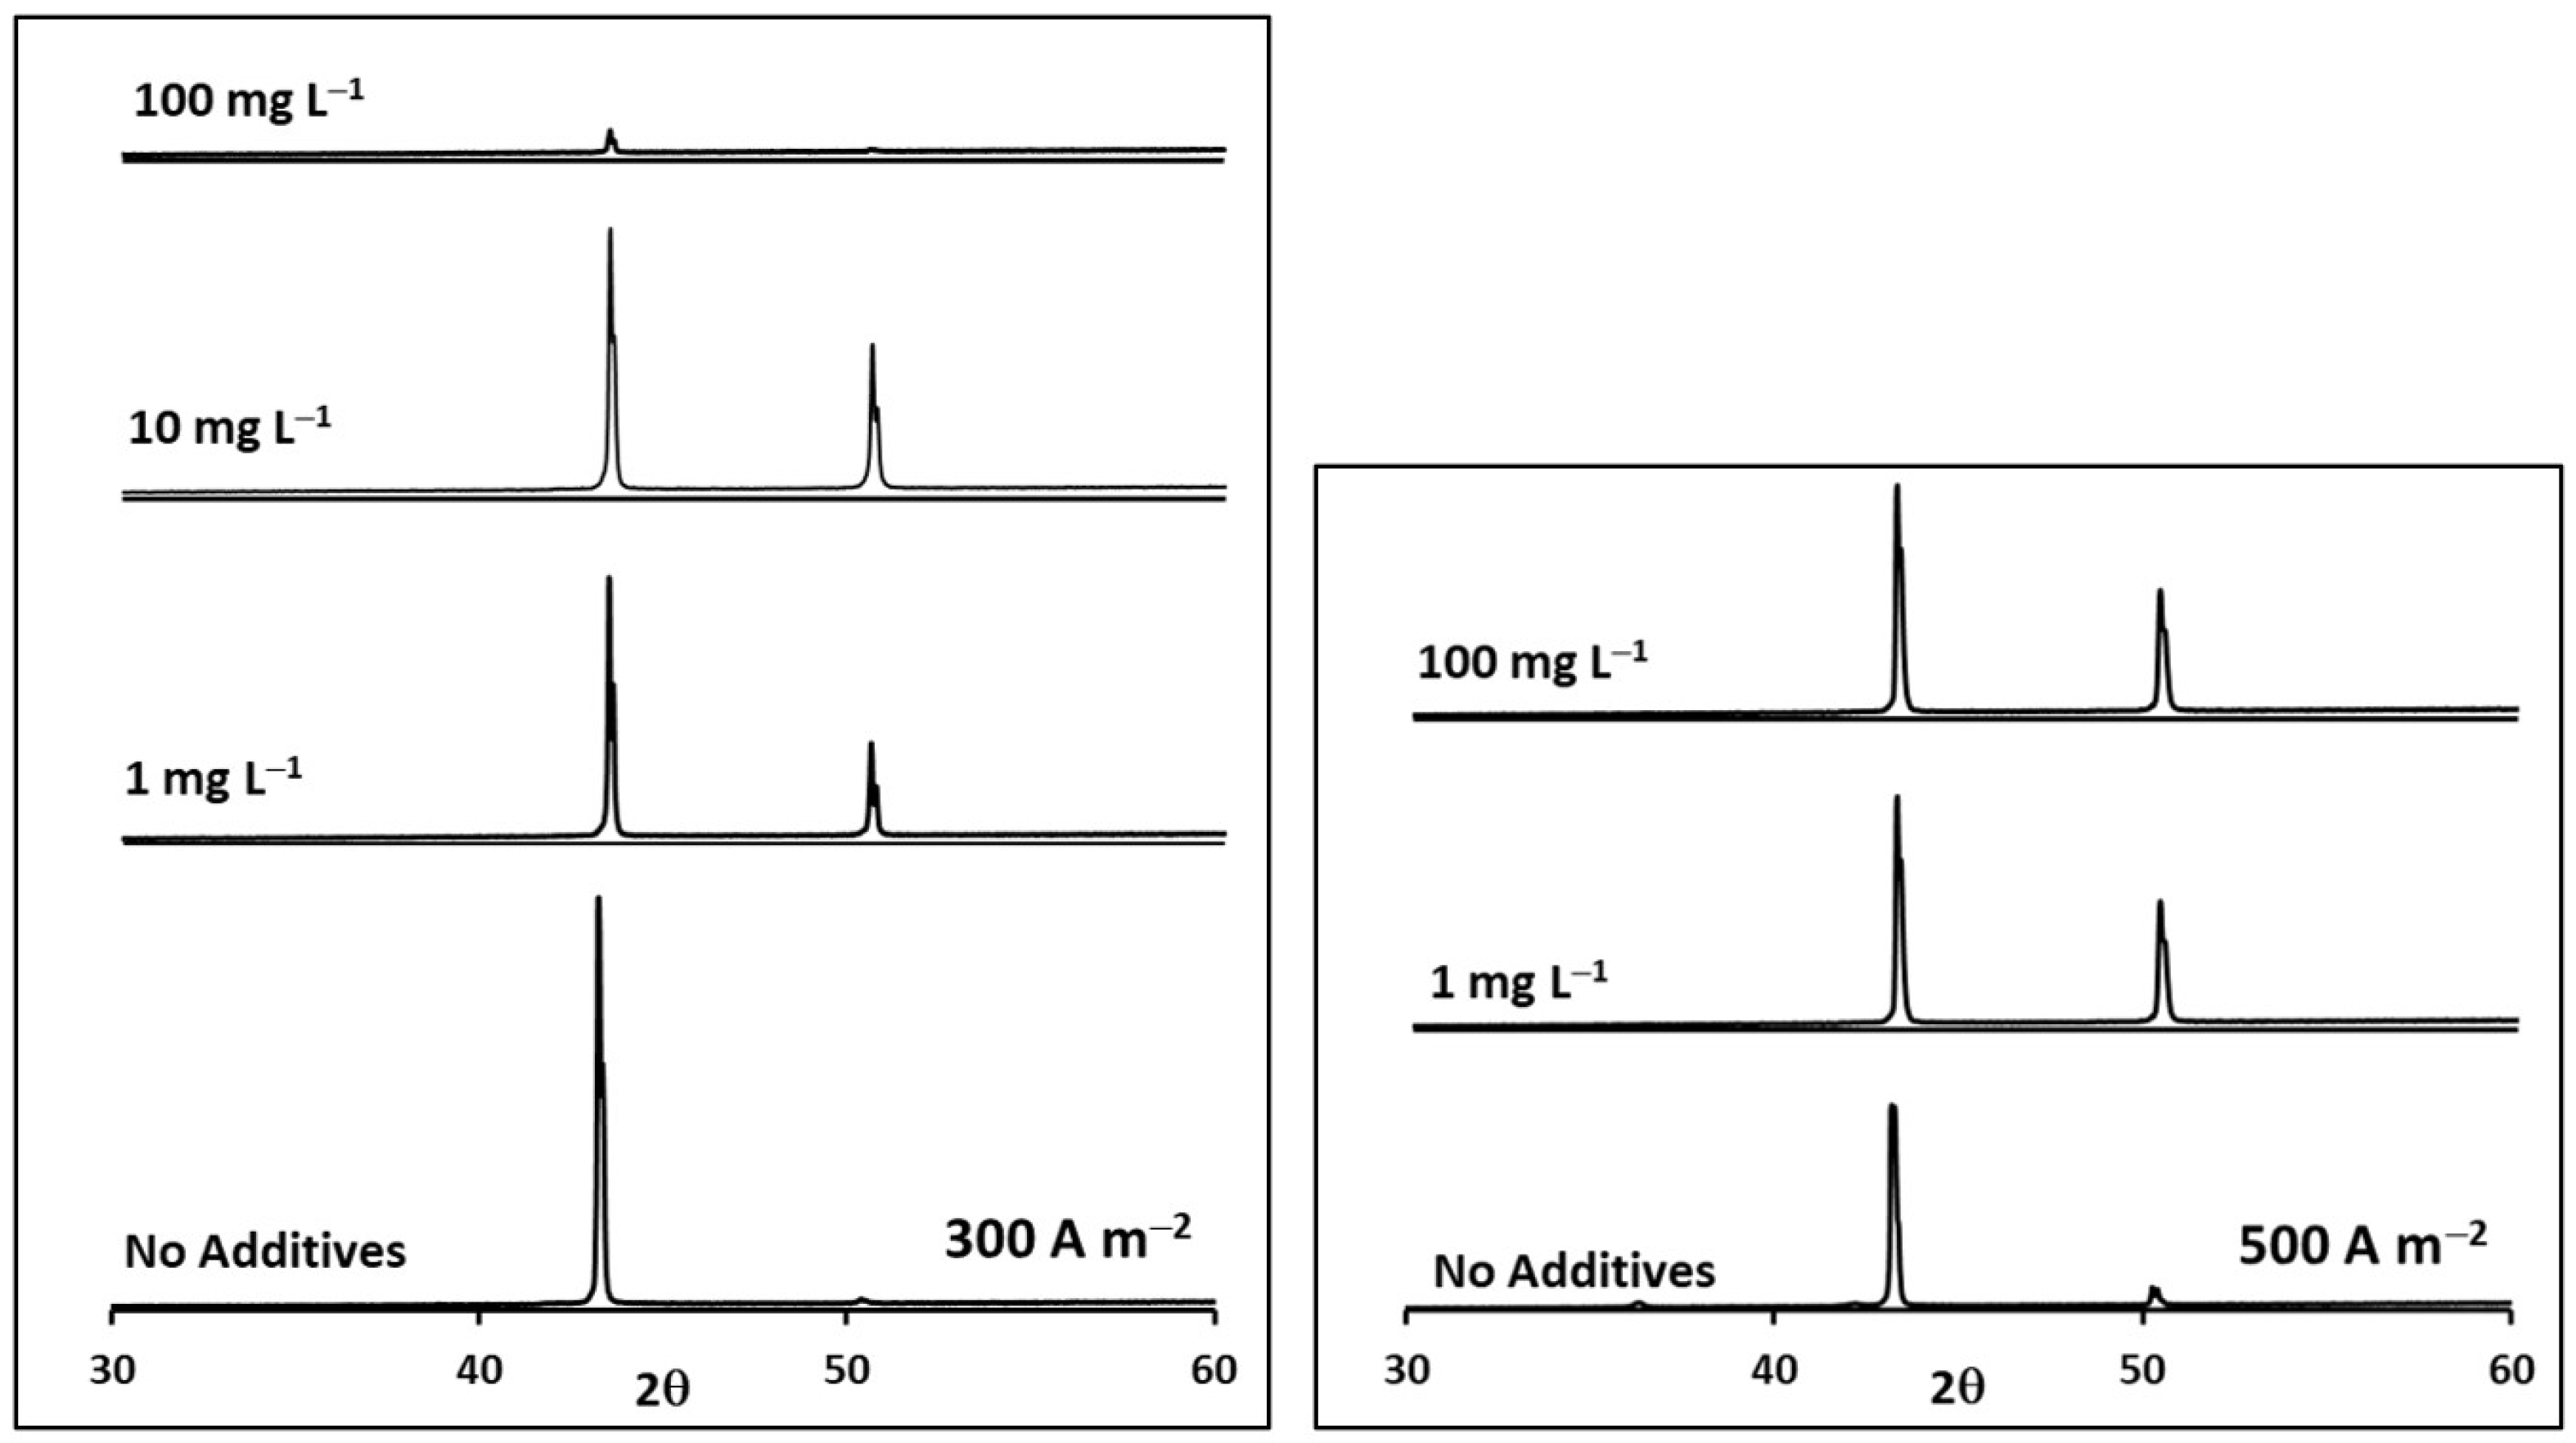
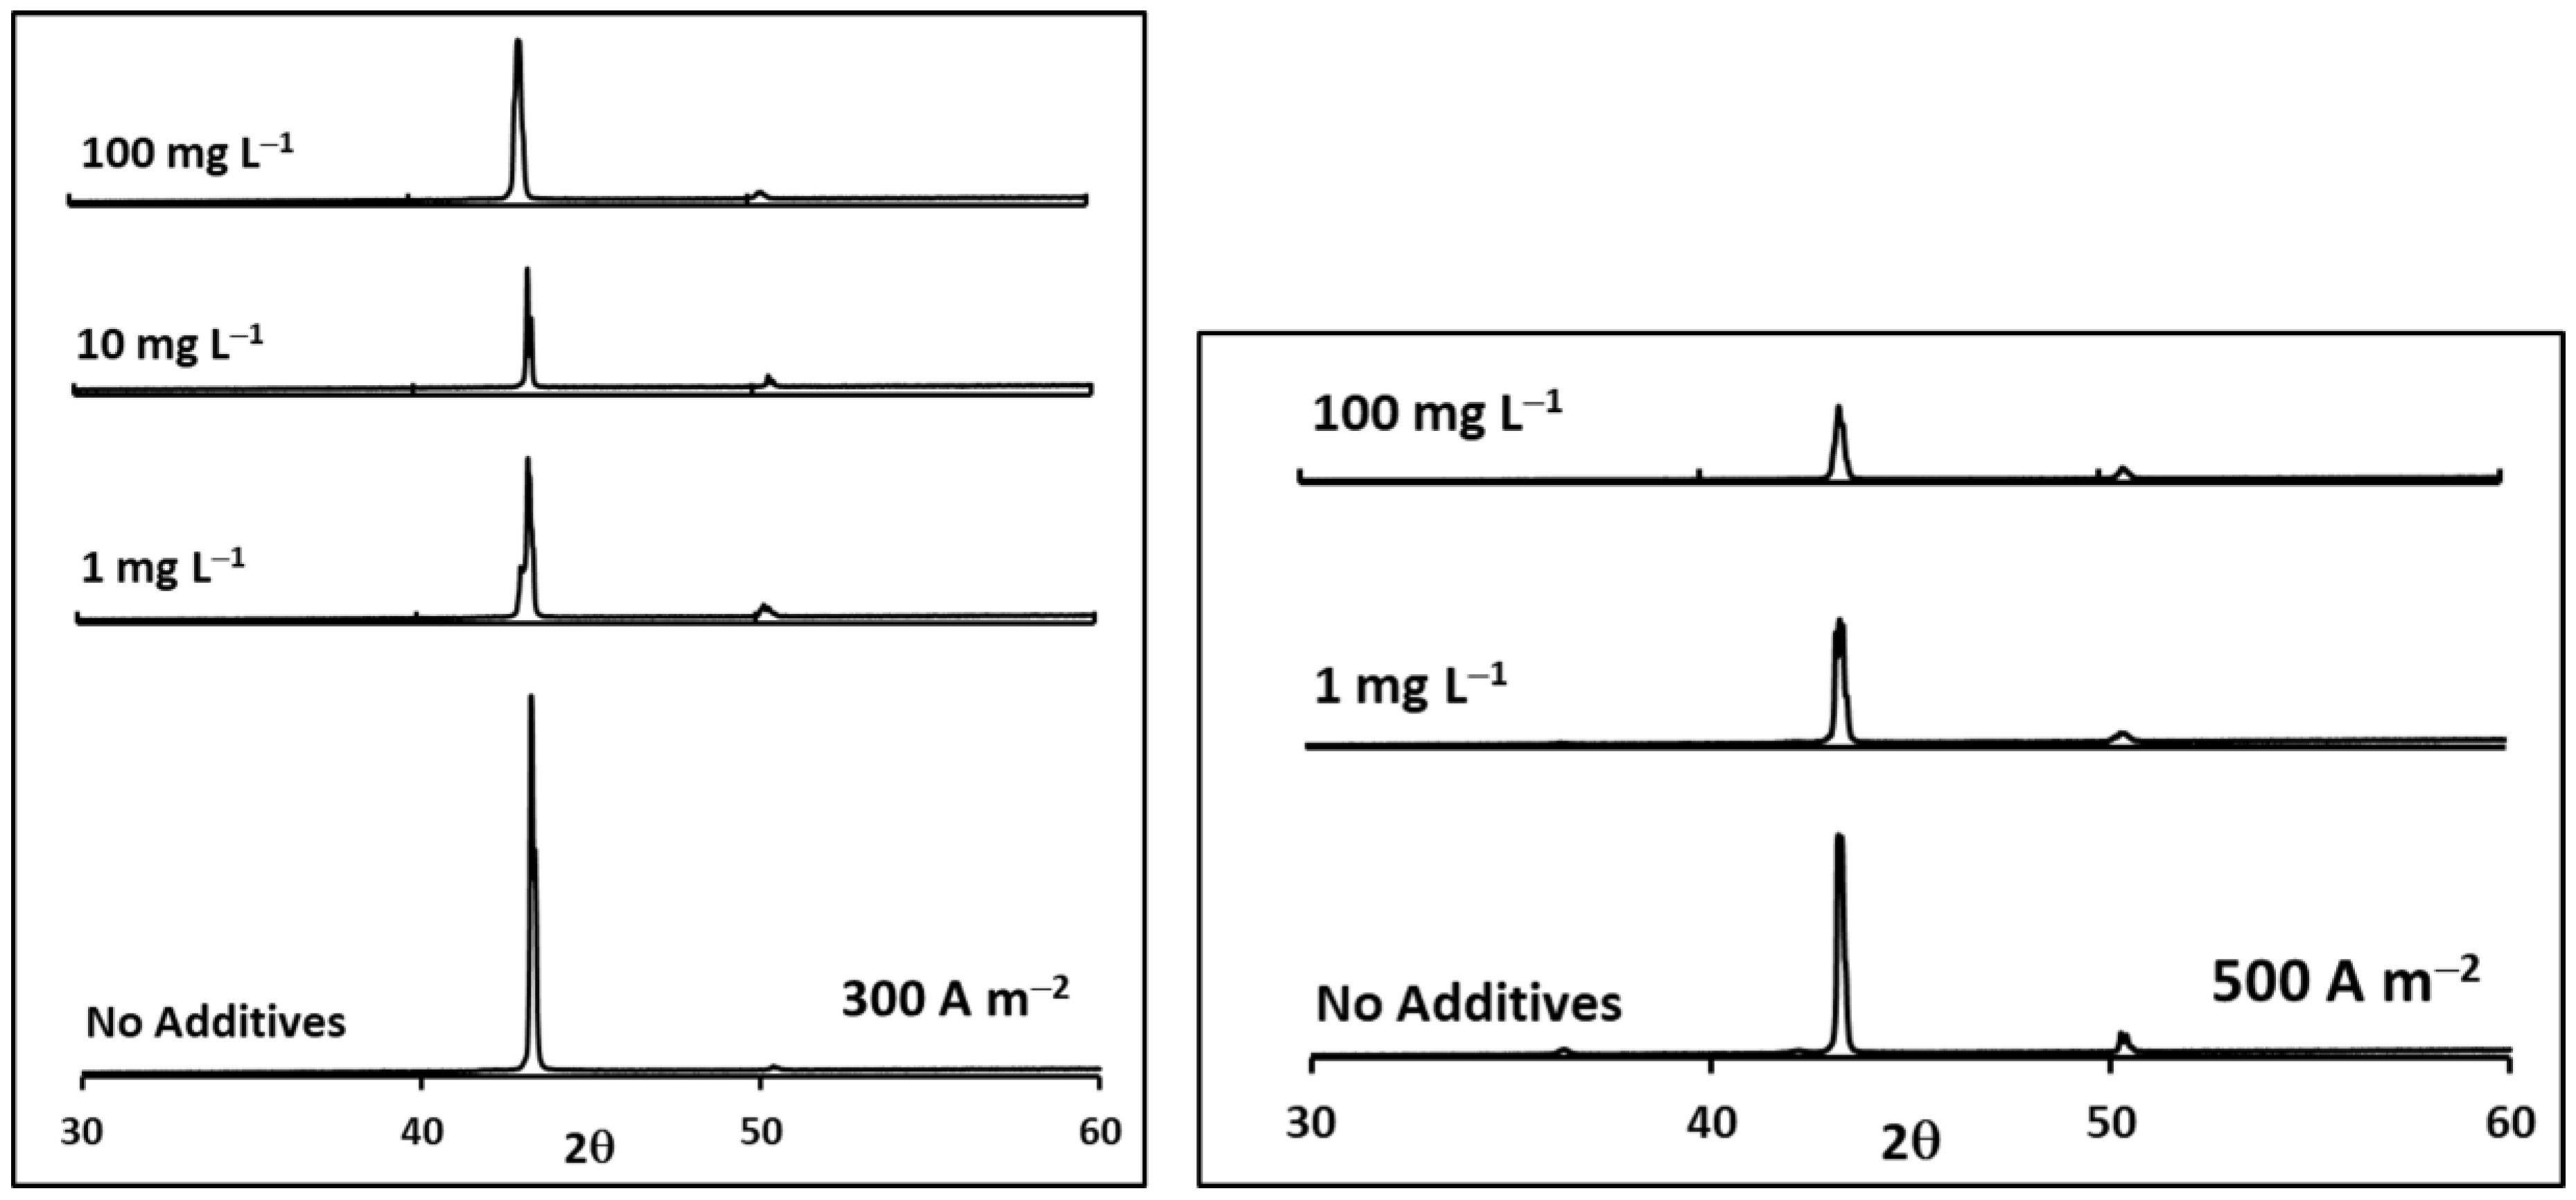
Figure 12, Figure 13 and Figure 14 show the X-ray diffraction spectra acquired on the surface of copper deposits obtained at two current density levels, 300 and 500 A m−2, during 18 h of electrodeposition at 60 °C. The results obtained for the base solution in the absence of additives are compared with those of the solutions with the addition of glue, thiourea, and chloride at different concentrations.
For all experimental conditions, the diffractograms show the existence of two diffraction peaks at 43.3° and 50.4°, which correspond to the (111) and (200) planes, respectively, in the case of copper with an FCC structure.
Table 5, Table 6 and Table 7 show the values of intensity and position of the diffraction peaks as a function of the concentration of glue, thiourea, chloride, and current density, as well as the texture coefficient (TC) for the (hkl) plane, defined as the ratio between the intensity of the diffraction peak normalized for the (hkl) plane in relation to the total normalized intensity measured with a standard sample of pure metallic copper, according to the following expression:
T C ( h k l ) = I h k l / I 0 h k l I h k l / I 0 h k l
where I(hkl) is the measured intensity of the diffraction peak (hkl) and I0 (hkl) is the intensity of the diffraction peak (hkl) of the copper metal standard sample spectrum.
In general, a crystallographic plane of lower planar density has a higher surface energy, thus facilitating the incorporation of atoms from a liquid or electrolyte phase. Under theoretical conditions of free growth, the crystal tends to grow in simpler, more compact forms with lower surface energy σi (Gibbs–Wulff theorem [45,46,47]), and propagates at a slower growth rate.
In the case of the base solution, at moderate current densities (300 A m−2), the high texture coefficient for the (111) plane would represent a condition close to that of free growth. As the current density increases to 500 A m−2, the texture coefficient of the (111) plane decreases in favor of the development of less compact planes, such as (200).
In the deposits obtained in solutions with the presence of additives and for both current density levels studied, the significant appearance of the (200) plane is observed when compared to the base solution. A particular case refers to the texture of the deposits obtained with solutions with glue, since a strong dependence of the TC with the concentration of the additive is observed. Even at the lowest concentration investigated, the development of the (200) plane is greater than that of the (111) plane. In the case of the solutions with thiourea, deposits with high TC (200) values were obtained when compared to the base solution; however, they are independent of the additive concentration. This same situation occurs for the deposits obtained with chloride in the electrolyte; however, it is observed that the effect of the current density was more relevant than the presence of this additive on the preferential growth development of the planes.
In the case of organic additives, i.e., glue and thiourea, their incorporation into the electrolyte modified the texture of the deposit in favor of the growth of less compact planes. This is explained in terms of the mechanism of action of the organic additives, which consists of the adsorption on non-singular faces or less compact planes with a higher surface energy, as is the case of the {200} family of planes, which was defined based on the adjustment of the electrochemical measurements with the Temkin isotherm. Thus, the growth rate of these planes would be decreased, and the crystal develops less compact planes, thus increasing its texture coefficient.
The copper electrodeposition process at industrial level is carried out under mixed kinetic control conditions, in which the charge transfer process is influenced by mass transfer processes, and physicochemical processes such as solvation and electrocrystallization, among others. On the other hand, the complexity of the industrial process associated with the diversity of operational variables involved, and the scarce fundamental information regarding the action of additives in the copper reduction process, lead to an inadequate operational practice for the control of the physical and chemical quality of the deposit. Thus, the experimental results obtained in this study represent an important contribution to the understanding of the effect of levelling and refining additives during the electrochemical reduction process to obtain massive metallic copper deposits.
The quality of the cathode product is evaluated based on the chemical and physical characteristics of the deposit. The first aspect defines the maximum permissible content of impurities in the product based on international standards, while the second is fundamentally related to the surface morphology of the deposit. The physical control of the product basically refers to the inspection of the surface and its characterization according to nodular or dendritic growth in terms of distribution, size, and density of irregularities. These are associated not only with operational practices under the standard but also with cathodic contamination by trapping impurities, thus generating a product that can be rejected or classified as lower quality.
Proper operational practice includes the optimization of operational variables such as homogeneous current density distribution, controlled impurity content in the electrolyte, and feed flow, among others. However, even under the strict control of these variables, the industrial process leads to deposits with imperfections, and to mitigate this, it is essential to use additives to improve the quality of the product. However, imperfections in the surface aspect of the deposit are commonly related to the strength of the metallic product. This is relevant when operating with impure electrolyte solutions and therefore the probability of contamination by mechanical entrapment or co-deposition is high. However, in applications where the electrolyte solution is of high purity, as in the case of the production of thin films for the manufacture of electronic devices, the surface characteristics of the deposit are more important than the chemical quality. Therefore, the present study not only contributes to a better understanding of the action of the additives and optimizes their dosage during the electrorefining process, but also provides fundamental information for better control of the surface characteristics in the formation of thin films via electrodeposition.

4. Conclusions

An experimental study under activation kinetic control conditions was carried out to investigate the effect of the use of glue, thiourea, and chloride as additives in the electrochemical reduction of metallic copper from electrolyte solutions of Cu2+ and a sulfuric acid composition with a temperature similar to those used in the industrial copper electrorefining process.
  • The results of linear voltammetry indicate that the addition of glue and thiourea lead to a decrease in the exchange current density,  i 0 , and an increase in the cathodic charge transfer coefficient,  β . In contrast, the addition of chloride ions did not substantially modify these kinetic parameters.
  • It was determined that the partial order of the Cu2+/Cu reduction reaction concerning the concentration of glue and thiourea results in negative values, inhibiting the reduction kinetics.
  • It was also determined that organic additives are adsorbed on the cathodic surface, blocking the active sites available for the cupric ions reduction process.
  • The fraction of the cathodic surface covered increased significantly with the concentration of glue and thiourea, and the Temkin adsorption model was verified in both cases. In contrast, the addition of chloride did not significantly modify the fraction of the cathodic surface covered, nor was it possible to correlate any adsorption model in the presence of this ion.
  • In the same sense, the inhibitory effect of the organic additives on the morphology and texture of the massive deposits obtained for two levels of current density compared to the base solution was verified.
  • The levelling effect of the additives was dependent on both the concentration and current density. It was found that the presence of chloride has no effect on the morphological characteristics of the deposit.
The experimental information of this work represents an important contribution to the understanding of the effect of leveling and grain-refining additives during the electrorefining process to obtain massive metallic copper deposits.

Author Contributions

Conceptualization, E.A.A.-H. and V.R.P.-S.; methodology, É.D.N.-L. and E.A.A.-H.; validation, E.A.A.-H.; formal analysis, E.A.A.-H. and V.R.P.-S.; investigation, E.A.A.-H.; resources, E.A.A.-H.; data curation, E.A.A.-H. and E.A.V.-G.; writing—original draft preparation, E.A.A.-H.; writing—review and editing, V.R.P.-S. and E.A.V.-G.; visualization, É.D.N.-L. and E.A.V.-G.; supervision, E.A.A.-H. and V.R.P.-S.; project administration, E.A.A.-H. All authors have read and agreed to the published version of the manuscript.

Funding

This research received no external funding.

Data Availability Statement

The data presented in this study are available on request from the corresponding author.

Conflicts of Interest

The authors declare no conflict of interest.

References

  1. Pourgharibshahi, M.; Khorasani, S.M.J.; Yaghoobi, N.; Lambert, P. A Descriptive Model for Twin-Textured Growth and Nodulation of Copper Cathodes. Electrocatalysis 2023, 14, 138–147. [Google Scholar] [CrossRef]
  2. Fabbri, L.; Giurlani, W.; Mencherini, G.; De Luca, A.; Passaponti, M.; Piciollo, E.; Fontanesi, C.; Caneschi, A.; Innocenti, M. Optimisation of Thiourea Concentration in a Decorative Copper Plating Acid Bath Based on Methanesulfonic Electrolyte. Coatings 2022, 12, 376. [Google Scholar] [CrossRef]
  3. Lee, J.-Y.; Yim, S.-B.; Hwang, Y.-J.; Lee, K.-H. Effect of Thiourea on the Copper Electrodeposition. J. Korean Inst. Surf. Eng. 2010, 43, 289–296. [Google Scholar] [CrossRef]
  4. Soares, D.M.; Wasle, S.; Weil, K.G.; Doblhofer, K. Copper Ion Reduction Catalyzed by Chloride Ions. J. Electroanal. Chem. 2002, 532, 353–358. [Google Scholar] [CrossRef]
  5. Chibwe, C.; Tadie, M. An Experimental Review of the Physicochemical Properties of Copper Electrowinning Electrolytes. Min. Metall. Explor. 2021, 38, 1225–1237. [Google Scholar] [CrossRef]
  6. Coetzee, C.; Tadie, M.; Dorfling, C. Evaluating the Effect of Molecular Properties of Polyacrylamide Reagents on Deposit Growth in Copper Electrowinning. Hydrometallurgy 2020, 195, 105407. [Google Scholar] [CrossRef]
  7. Guo, J.; Li, B.; Wei, Y.; Wang, H. Effect of Thiourea on Copper Cathode from Simulated Leachate of Copper and Cadmium Residues by Cyclone Electrowinning Technology. J. Sustain. Metall. 2021, 7, 1876–1885. [Google Scholar] [CrossRef]
  8. Kasach, A.A.; Kharitonov, D.S.; Makarova, I.V.; Wrzesińska, A.; Zharskii, I.M.; Kurilo, I.I. Effect of Thiourea on Electrocrystallization of Cu–Sn Alloys from Sulphate Electrolytes. Surf. Coat. Technol. 2020, 399, 126137. [Google Scholar] [CrossRef]
  9. Gabrielli, C.; Moçotéguy, P.; Perrot, H.; Wiart, R. Mechanism of Copper Deposition in a Sulphate Bath Containing Chlorides. J. Electroanal. Chem. 2004, 572, 367–375. [Google Scholar] [CrossRef]
  10. Sun, M.; O’Keefe, T.J. The Effect of Additives on the Nucleation and Growth of Copper onto Stainless Steel Cathodes. Metall. Trans. B 1992, 23, 591–599. [Google Scholar] [CrossRef]
  11. Hölzle, M.H.; Apsel, C.W.; Will, T.; Kolb, D.M. Copper Deposition onto Au(111) in the Presence of Thiourea. J. Electrochem. Soc. 1995, 142, 3741–3749. [Google Scholar] [CrossRef]
  12. Aragón, J.; Camus, J. Efecto de La Concentración de Ión Cloruro En La Estructura de Electrodepósitos de Cobre. Rev. Latinoam. Metal. Mater. 2011, 11, 128–133. [Google Scholar]
  13. Kang, M.S.; Kim, S.K.; Kim, K.; Kim, J.J. The Influence of Thiourea on Copper Electrodeposition: Adsorbate Identification and Effect on Electrochemical Nucleation. Thin Solid Film. 2008, 516, 3761–3766. [Google Scholar] [CrossRef]
  14. Quinet, M.; Lallemand, F.; Ricq, L.; Hihn, J.-Y.; Delobelle, P.; Arnould, C.; Mekhalif, Z. Influence of Organic Additives on the Initial Stages of Copper Electrodeposition on Polycrystalline Platinum. Electrochim. Acta 2009, 54, 1529–1536. [Google Scholar] [CrossRef]
  15. Shao, W.; Pattanaik, G.; Zangari, G. Influence of Chloride Anions on the Mechanism of Copper Electrodeposition from Acidic Sulfate Electrolytes. J. Electrochem. Soc. 2007, 154, D201–D207. [Google Scholar] [CrossRef]
  16. Nagy, Z.; Blaudeau, J.P.; Hung, N.C.; Curtiss, L.A.; Zurawski, D.J. Chloride Ion Catalysis of the Copper Deposition Reaction. J. Electrochem. Soc. 1995, 142, L87–L89. [Google Scholar] [CrossRef]
  17. Tantavichet, N.; Pritzker, M.D. Effect of Plating Mode, Thiourea and Chloride on the Morphology of Copper Deposits Produced in Acidic Sulphate Solutions. Electrochim. Acta 2005, 50, 1849–1861. [Google Scholar] [CrossRef]
  18. Tantavichet, N.; Damronglerd, S.; Chailapakul, O. Influence of the Interaction between Chloride and Thiourea on Copper Electrodeposition. Electrochim. Acta 2009, 55, 240–249. [Google Scholar] [CrossRef]
  19. Veilleux, B.; Lafront, A.M.; Ghali, E. Computerized Scaled Cells to Study the Effect of Additive Ratios and Concentrations on Nodulation during Copper Electrorefining. J. Appl. Electrochem. 2001, 31, 1017–1024. [Google Scholar] [CrossRef]
  20. Zeng, T.W.; Yen, S.C. Effects of Additives in an Electrodeposition Bath on the Surface Morphologic Evolution of Electrodeposited Copper. Int. J. Electrochem. Sci. 2021, 16, 210245. [Google Scholar] [CrossRef]
  21. Collet, T.; Hallemans, N.; Wouters, B.; Ramharter, K.; Lataire, J.; Pintelon, R.; Hubin, A. An Operando ORP-EIS Study of the Copper Reduction Reaction Supported by Thiourea and Chlorides as Electrorefining Additives. Electrochim. Acta 2021, 389, 138762. [Google Scholar] [CrossRef]
  22. Bockris, J.O.; Enyo, M. Mechanism of Electrodeposition and Dissolution Processes of Copper in Aqueous Solutions. Trans. Faraday Soc. 1962, 58, 1187–1202. [Google Scholar] [CrossRef]
  23. Szymaszek, A.; Biernat, J.; Pajdowski, L. Polarographic Studies on the Effect of Thiourea on Deposition of Copper in the Presence of 2M H2SO4. Electrochim. Acta 1977, 22, 359–364. [Google Scholar] [CrossRef]
  24. Collet, T.; Wouters, B.; Hallemans, N.; Ramharter, K.; Lataire, J.; Hubin, A. The Time-Varying Effect of Thiourea on the Copper Electroplating Process with Industrial Copper Concentrations. Electrochim. Acta 2023, 437, 141412. [Google Scholar] [CrossRef]
  25. Ren, P.; An, M.; Yang, P.; Zhang, J. Unveiling the Synergistic Inhibition of Cl Copper Plating: Pivotal Roles of Adsorption and Desorption. J. Electroanal. Chem. 2021, 898, 115624. [Google Scholar] [CrossRef]
  26. Collet, T.; Wouters, B.; Eeltink, S.; Schmidt, P.; Ramharter, K.; Hubin, A. An Ex Situ and Operando Analysis of Thiourea Consumption and Activity during a Simulated Copper Electrorefining Process. J. Electroanal. Chem. 2022, 920, 116581. [Google Scholar] [CrossRef]
  27. Ahmadi, A.; Sheibani, S.; Mokmeli, M.; Khorasani, S.M.J.; Yaghoobi, N.S. Factors Affecting the Cathode Edge Nodulation in Copper Electrorefining Process. Int. J. Eng. Trans. C Asp. 2022, 35, 2370–2376. [Google Scholar] [CrossRef]
  28. Mori, K.; Yamakawa, Y.; Oue, S.; Taninouchi, Y.K.; Nakano, H. Effect of Impurity Ions and Additives in Solution of Copper Electrorefining on the Passivation Behavior of Low-Grade Copper Anode. Mater. Trans. 2023, 64, 242–251. [Google Scholar] [CrossRef]
  29. Hinatsu, J.T.; Foulkes, F.R. Electrochemical Kinetic Parameters for the Cathodic Deposition of Copper from Dilute Aqueous Acid Sulfate Solutions. Can. J. Chem. Eng. 1991, 69, 571–577. [Google Scholar] [CrossRef]
  30. Cifuentes, L.; Simpson, J. Temperature Dependence of the Cathodic and Anodic Kinetics in a Copper Electrowinning Cell Based on Reactive Electrodialysis. Chem. Eng. Sci. 2005, 60, 4915–4923. [Google Scholar] [CrossRef]
  31. Milora, C.J.; Henrickson, J.F.; Hahn, W.C. Diffusion Coefficients and Kinetic Parameters in Copper Sulfate Electrolytes and in Copper Fluoborate Electrolytes Containing Organic Addition Agents. J. Electrochem. Soc. 1973, 120, 488. [Google Scholar] [CrossRef]
  32. Pearson, I.M.; Schrader, G.F. The Ac Impedance at Cu Electrodes and the Electrodeposition of Cu. Electrochim. Acta 1968, 13, 2021–2028. [Google Scholar] [CrossRef]
  33. Sahu, S.; Rani Sahoo, P.; Patel, S.; Mishra, B.K. Oxidation of Thiourea and Substituted Thioureas: A Review. J. Sulfur Chem. 2011, 32, 171–197. [Google Scholar] [CrossRef]
  34. Ratajczak, H.M.; Pajdowski, L.; Ostern, M. Polarographic Studies on Aqueous Copper(II) Solutions with Thiourea-II. Electrochim. Acta 1975, 20, 431–434. [Google Scholar] [CrossRef]
  35. Doona, C.J.; Stanbury, D.M. Equilibrium and Redox Kinetics of Copper(II)-Thiourea Complexes. Inorg. Chem. 1996, 35, 3210–3216. [Google Scholar] [CrossRef] [PubMed]
  36. Tarallo, A.; Heerman, L. Influence of Thiourea on the Nucleation of Copper on Polycrystalline Platinum. J. Appl. Electrochem. 1999, 29, 585–591. [Google Scholar] [CrossRef]
  37. Jin, S.; Ghali, E. Effect of Thiourea on the Copper Cathode Polarization Behavior in Acidic Copper Sulfate at 65 °C. Metall. Mater. Trans. B Process Metall. Mater. Process. Sci. 2001, 32, 887–893. [Google Scholar] [CrossRef]
  38. Stanković, Z.D.; Vuković, M. The Influence of Thiourea on Kinetic Parameters on the Cathodic and Anodic Reaction at Different Metals in H2SO4 Solution. Electrochim. Acta 1996, 41, 2529–2535. [Google Scholar] [CrossRef]
  39. Blechta, V.K.; Wang, Z.Z.; Krueger, D.W. Glue Analysis and Behavior in Copper Electrolyte. Metall. Trans. B 1993, 24, 277–287. [Google Scholar] [CrossRef]
  40. Bockris, J.O.; Reddy, A.K.N.; Gamboa-Aldeco, M. Modern Electrochemistry 2A, 2nd ed.; Kluwer Academic Publishiers: London, UK, 2002; Volume 2A. [Google Scholar]
  41. Arafat, Y.; Sultana, S.T.; Dutta, I.; Panat, R. Effect of Additives on the Microstructure of Electroplated Tin Films. J. Electrochem. Soc. 2018, 165, D816–D824. [Google Scholar] [CrossRef]
  42. Horányi, G.; Vértes, G. Study of the Adsorption of Chloride Ions in the Course of Electrosorption of Copper on Platinized Platinum Electrodes. J. Electroanal. Chem. Interfacial Electrochem. 1973, 45, 295–299. [Google Scholar] [CrossRef]
  43. Winand, R. Electrocristallisation. Théorie et Applications. J. Phys. IV JP 1994, 4, 55–73. [Google Scholar] [CrossRef]
  44. Bastidas, D.M.; Gómez, P.P.; Cano, E. The Isotherm Slope. A Criterion for Studying the Adsorption Mechanism of Benzotriazole on Copper in Sulphuric Acid. Rev. Metal. 2005, 41, 98–106. [Google Scholar] [CrossRef]
  45. Budevski, E.; Staikov, G.; Lorenz, W.J. Electrochemical Phase Formation and Growth: An Introduction to the Initial Stages of Metal Deposition; John Wiley & Sons: Hoboken, NJ, USA, 1996; Volume 28, ISBN 3527282734. [Google Scholar]
  46. Markov, I. Crystal Growth for Beginners: Fundamentals of Nucleation, Crystal Growth and Epitaxy, 2nd ed.; World Scientific Publishing Co. Pte. Ltd.: Singapore, 2003. [Google Scholar]
  47. Milchev, A. Electrocrystallization: Fundamentals of Nucleation and Growth; Kluwer Academic Publishiers: London, UK, 2002. [Google Scholar]
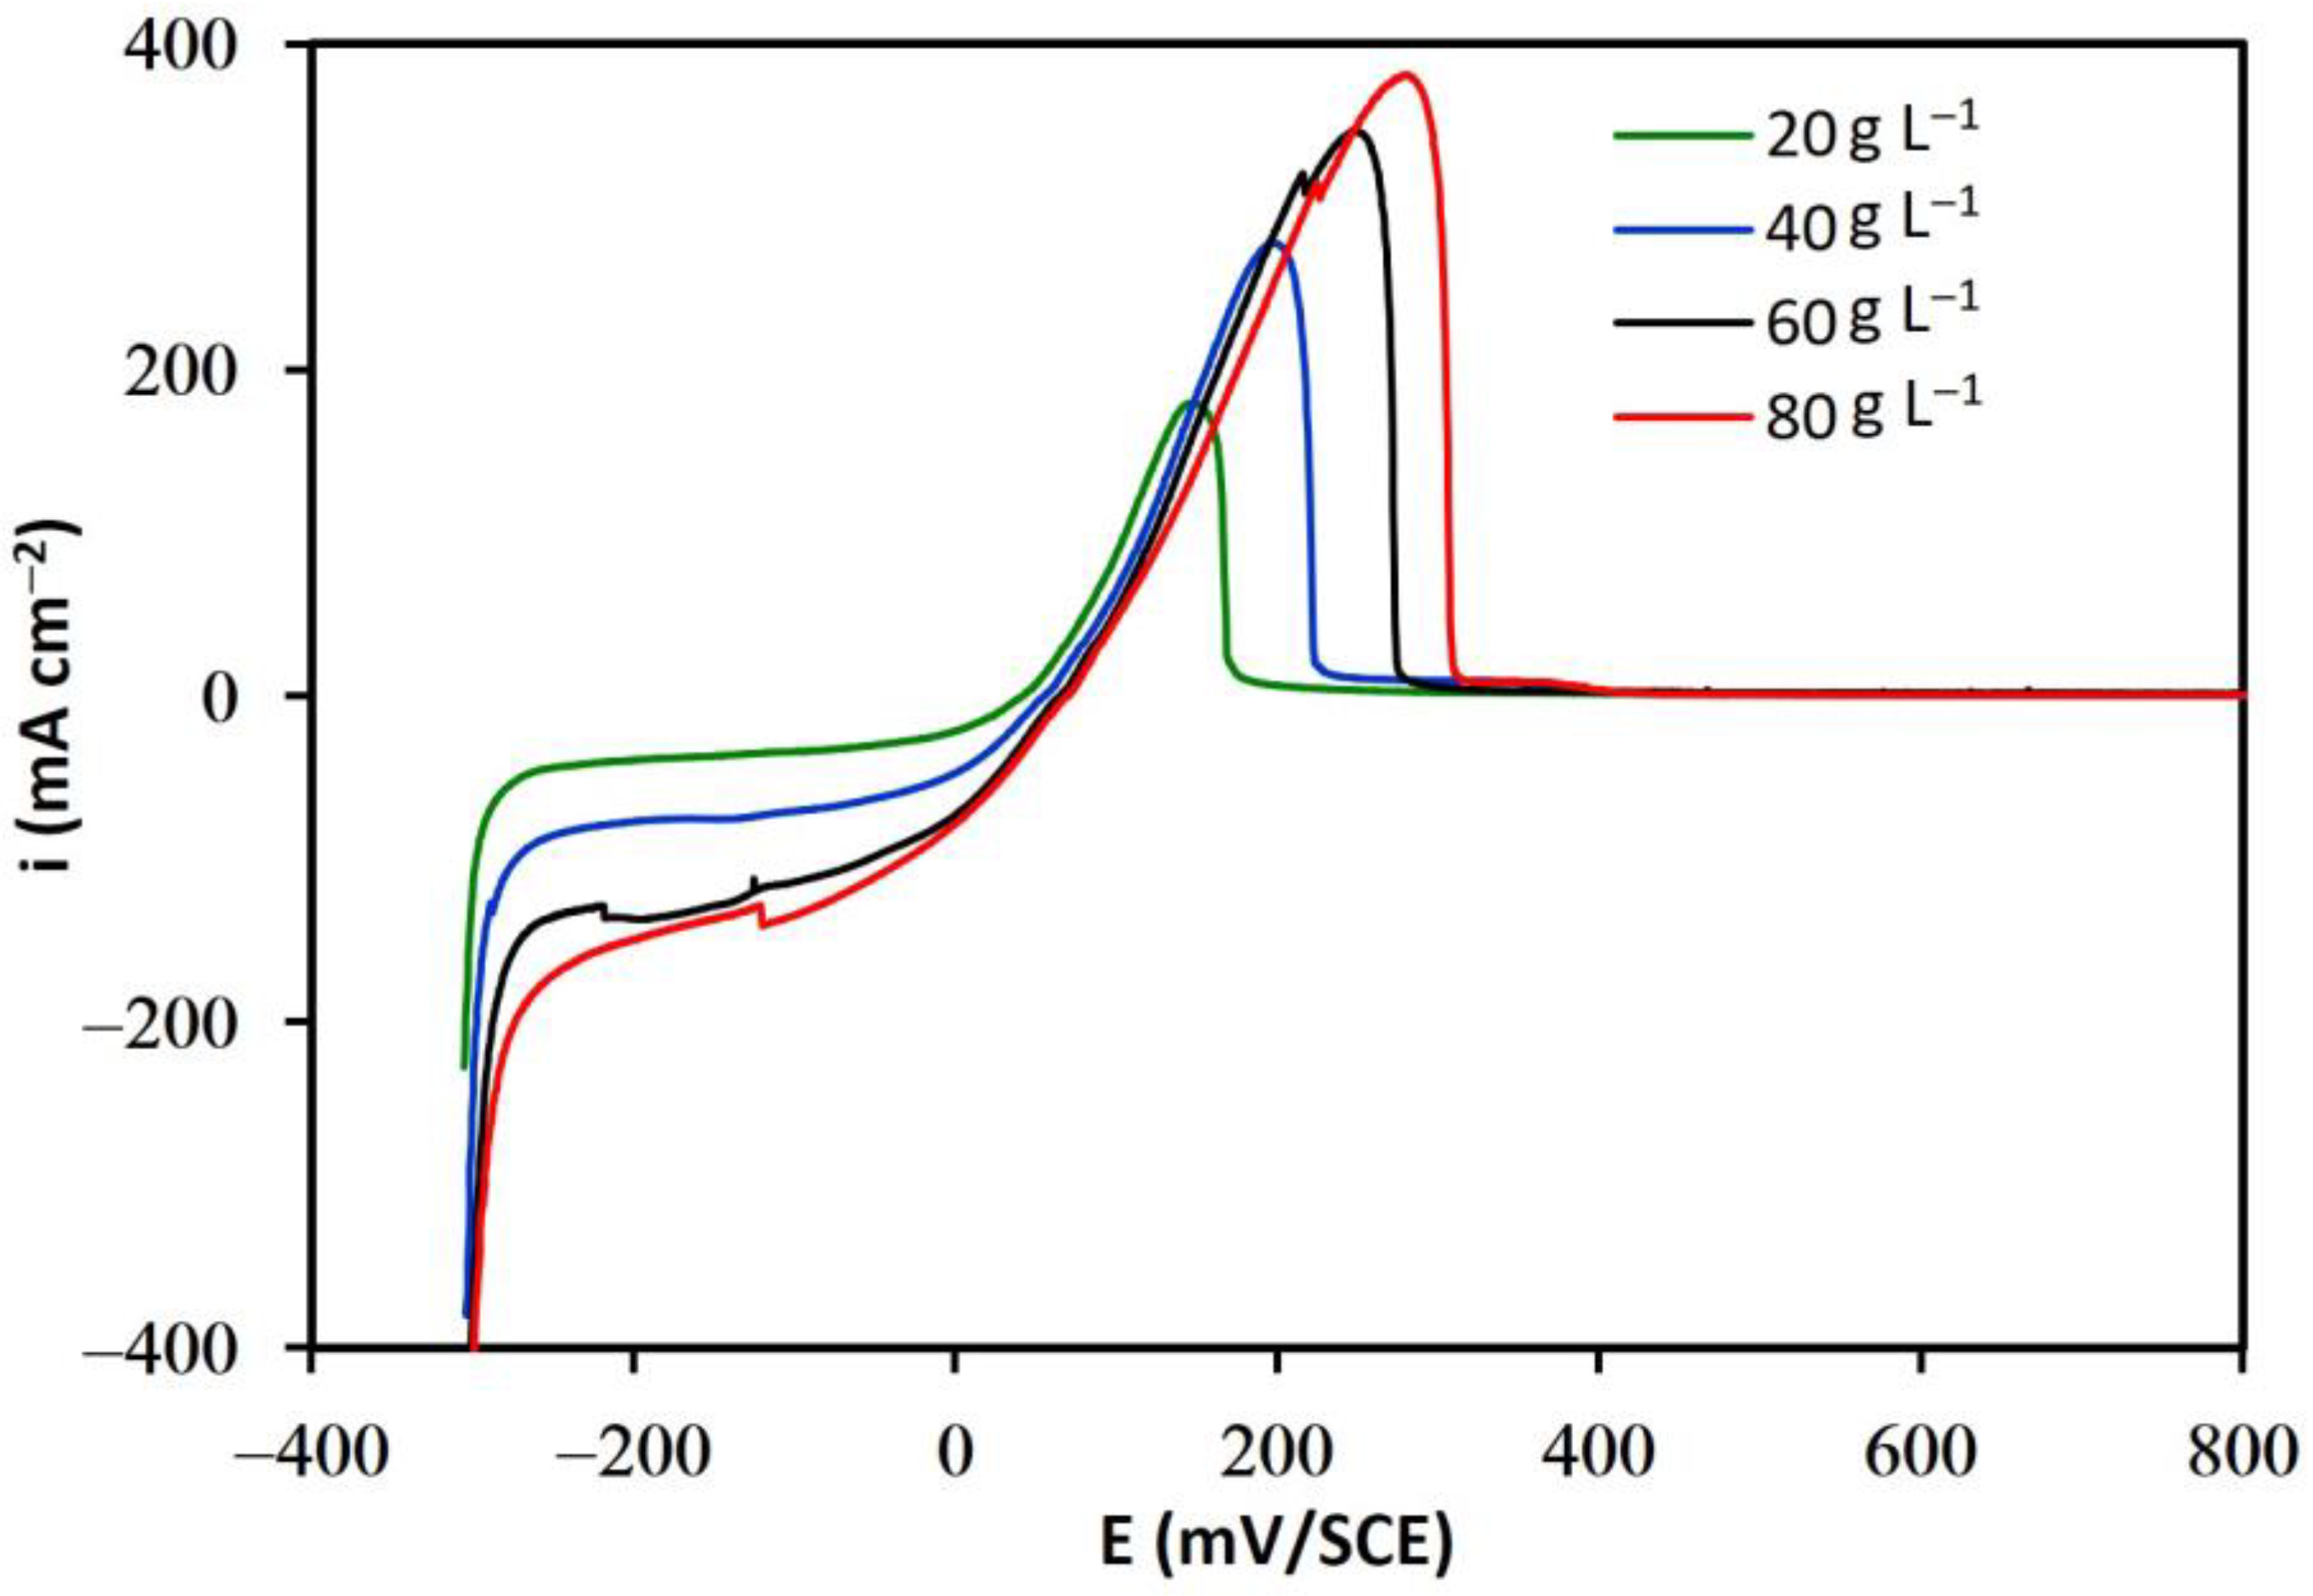
Figure 1. Polarization curves of the Cu2+/Cu system at different Cu2+ concentrations at 60 °C, obtained via linear voltammetry on the Pt electrode.
Metals 13 00891 g001
Figure 2. Arrhenius-type dependence of the exchange current density and temperature in the range of 20 °C to 80 °C with 40 g of L−1 and Cu2+ on the Pt electrode.
Metals 13 00891 g002
Figure 3. Effect of glue concentration on the polarization curve of the Cu2+/Cu system on Pt in solutions of a base composition at 60 °C and a sweep rate of 10 mV s−1. The inset shows the voltammogram of the whole sweep range, and a magnification of the cathodic region is shown in the main figure.
Metals 13 00891 g003
Figure 4. Effect of thiourea concentration on the polarization curve of the Cu2+/Cu system on Pt in solutions of a base composition at 60 °C and a sweep rate of 10 mV s−1. The inset shows the voltammogram of the whole sweep range, and a magnification of the cathodic region is shown in the main figure.
Metals 13 00891 g004
Figure 5. Effect of chloride concentration on the polarization curve of the Cu2+/Cu system on Pt over solutions of a base composition at 60 °C and a sweep rate of 10 mV s−1. The inset shows the voltammogram of the whole sweep range, and a magnification of the cathodic region is shown in the main figure.
Metals 13 00891 g005
Figure 6. Additive concentration effect on the exchange current density,  i 0 , for the reduction of cupric ions on the Pt electrode in solutions of a base composition at 60 °C.
Metals 13 00891 g006
Figure 7. Cathodic current density as a function of (a) glue, (b) thiourea, and (c) chloride concentration for overpotentials of −30, −35, −55, and −60 mV on the Pt electrode.
Metals 13 00891 g007
Figure 8. Variation of the fraction of the cathodic surface covered, θ, as a function of the concentration of additives: (a) glue, (b) thiourea, and (c) chloride ions.
Metals 13 00891 g008
Figure 9. Effect of glue concentration and current density on the morphology of copper deposits obtained at 60 °C and with 18 h of reduction.
Metals 13 00891 g009
Figure 10. Effect of thiourea concentration and current density on the morphology of copper deposits obtained at 60 °C and with 18 h of reduction.
Metals 13 00891 g010
Figure 11. Effect of chloride concentration and current density on the morphology of copper deposits obtained at 60 °C and with 18 h of reduction.
Metals 13 00891 g011
Figure 12. Effect of glue concentration on X-ray diffraction spectra acquired on the surface of copper deposits obtained at 60 °C and 18 h of reduction at 300 A m−2 and 500 A m−2.
Metals 13 00891 g012
Figure 13. Effect of thiourea concentration on X-ray diffraction spectra acquired on the surface of copper deposits obtained at 60 °C and 18 h of reduction at 300 A m−2 and 500 A m−2.
Metals 13 00891 g013
Figure 14. Effect of chloride concentration on the X-ray diffraction spectra acquired on the surface of copper deposits obtained at 60 °C and 18 h of reduction at 300 A m−2 and 500 A m−2.
Metals 13 00891 g014
Table 1. Values of the exchange current density  i 0 , and cathodic charge transfer coefficient  β  for cupric ion reduction on the Pt electrode as a function of glue, thiourea, and chloride concentration.
AdditiveConcentration mg L−1   i 0
mA cm−2
  β
Base solution022.90.19
Glue115.70.26
104.790.32
1001.960.38
Thiourea120.90.25
107.740.48
1002.050.61
Chloride2018.20.27
4016.40.28
8016.40.29
10018.90.26
100015.30.29
Table 2. Parameter values of the Temkin model in solutions with the addition of glue and thiourea at 60 °C. R2 represents the correlation coefficient of the experimental data with the Temkin model.
AdditiveBfR2
Glue21.78.140.91
Thiourea2.146.551.00
Table 3. Statistical parameters of surface roughness distribution as a function of additive concentration. Current density = 300 A m−2.
SolutionAdditive
Concentration
(mg L−1)
Average
Relative Height
Standard
Deviation
KurtosisAsimmetry
Base
Solution
-88.650.50.600.90
Glue1113.964.2−0.600.40
1079.450.00.801.00
100102.862.8−0.200.70
Thiourea198.056.6−0.020.59
1094.057.8−0.380.41
100101.848.60.860.96
Chloride171.544.60.800.90
1076.752.10.901.00
10085.4447.31.221.05
Table 4. Statistical parameters of surface roughness distribution as a function of additive concentration. Current density = 500 A m−2.
SolutionAdditive
Concentration
(mg L−1)
Average
Relative Height
Standard
Deviation
KurtosisAsimmetry
Base
Solution
-83.650.80.610.85
Glue186.159.8−0.020.76
10088.544.90.390.74
Thiourea183.851.70.270.77
10094.051.00.020.52
Chloride152.941.51.471.19
10084.546.90.740.91
Table 5. Effect of glue concentration and current density on texture parameters for copper deposits obtained at 60 °C and 18 h of electrolysis.
i
(A m−2)
Glue
Concentration(mg L−1)
Relative Intensity
P(111)/P(200)
TC(111)TC(200)
30000.970.940.06
10.640.450.55
100.890.790.21
1000.900.810.19
50000.900.800.20
10.760.590.41
1000.810.670.33
Table 6. Effect of thiourea concentration and current density on texture parameters for copper deposits obtained at 60 °C and 18 h of electrolysis.
i
(A m−2)
Thiourea
Concentration(mg L−1)
Relative Intensity
P(111)/P(200)
TC(111)TC(200)
30000.970.940.06
10.720.550.45
100.640.450.55
1000.730.550.45
50000.900.800.20
10.810.660.34
1000.640.450.55
Table 7. Effect of chloride concentration and current density on texture parameters for copper deposits obtained at 60 °C and 18 h of electrolysis.
i
(A m−2)
Chloride
Concentration (mg L−1)
Relative Intensity
P(111)/P(200)
TC(111)TC(200)
30000.970.940.06
10.900.800.20
100.870.750.25
1000.930.850.15
50000.900.800.20
10.890.800.20
1000.840.710.29
Disclaimer/Publisher’s Note: The statements, opinions and data contained in all publications are solely those of the individual author(s) and contributor(s) and not of MDPI and/or the editor(s). MDPI and/or the editor(s) disclaim responsibility for any injury to people or property resulting from any ideas, methods, instructions or products referred to in the content.