Article

Microstructure, Mechanical and Wear Properties of W-Si-C Composites Consolidated by Spark Plasma Sintering

1
Chaozhou Branch of Chemistry and Chemical Engineering Guangdong Laboratory (Hanjiang Laboratory), Chaozhou 521000, China
2
State Key Laboratory of Advanced Technology for Materials Synthesis and Processing, Wuhan University of Technology, Wuhan 430070, China
3
School of Mechanical Engineering, North China University of Water Resources and Electric Power, Zhengzhou 450045, China
4
School of Electromechanical Engineering, Henan University of Technology, Zhengzhou 450001, China
5
National United Engineering Laboratory for Advanced Bearing Tribology, Henan University of Science and Technology, Luoyang 471000, China
6
School of Mechanics and Safety Engineering, Zhengzhou University, Zhengzhou 450001, China
*
Authors to whom correspondence should be addressed.
Metals 2023, 13(5), 937; https://doi.org/10.3390/met13050937
Submission received: 29 March 2023 / Revised: 27 April 2023 / Accepted: 8 May 2023 / Published: 11 May 2023
(This article belongs to the Special Issue Metal-Ceramic Composites Fabricated by Powder Metallurgy Method)

Abstract

:
W-Si-C composites with high relative densities and good mechanical and wear properties were successfully prepared by spark plasma sintering. The influence of SiC content on the relative density, microstructure, mechanical properties and wear characteristics was investigated. The results indicated that the reaction between SiC and W at their interface produced W2C and W5Si3. SiC also reacted with oxygen impurities at the W grain boundary to form SiO2. The purification of the grain boundaries of W was carried out by SiO2 synthesis. Reactive sintering reduces the free energy of the system and facilitates the densification process of W-Si-C composites. This results in a significant increase in the relative density of W-Si-C composites, which reaches a maximum of 98.12%, higher than the 94.32% of pure tungsten. The hardness significantly increases from 4.33 GPa to 8.40 GPa when the SiC content is 2 wt% compared to pure tungsten due to the generation of the hard ceramic phase and the increase in relative density. The wear resistance of the W-Si-C composites was significantly improved with little SiC addition. The wear rate significantly decreased from 313.27 × 10⁻³ mm3/N·m of pure tungsten to 5.71 × 10⁻³ mm3/N·m of W-0.5 wt% SiC. SEM analyses revealed that the dominant wear mechanism of pure tungsten was attributed to fatigue wear, while that of W-Si-C composites was due to abrasive wear.

1. Introduction

Tungsten(W) and its composites have the advantages of a high melting point [1], high thermal conductivity [2], low thermal expansion coefficient [3], low vapor pressure [4] and low tritium retention [5], which give them have important applications in aerospace, the electronics industry and the nuclear industry, such as for rocket nozzles, electronic packaging materials in computer chips and plasma-facing materials (PFMs) in fusion reactors [4,6,7,8]. These are the most common applications for W-based composites. Tungsten and composite materials are also often used in welding applications. Friction Stir Welding (FSW) is a popular solid-state joining method because it gets around many of the issues that fusion welding frequently encounters. The technology has been successfully applied to the welding of low-melting-point materials such as aluminum alloys. For the welding of hard alloys such as steel and titanium alloys, stir friction welding tools are subjected to extreme stresses and temperatures. Pulsed laser welding is commonly used for welding between NiTi alloys and stainless steel. However, brittle intermetallic compounds are produced in the NiTi alloys and stainless steel welding layers by this welding method [9,10,11]. The formation of these brittle intermetallic compounds can seriously damage the mechanical properties of the material [12]. Therefore, it is necessary to study FSW for welding between hard materials. As a result of its exceptional strength and hardness under extreme temperatures, W-based composites are a potential tool material for the stirring and friction machining of hard alloys. However, in actual situations, the application of W-based composites is restricted by low temperature brittleness and wear rapidly when used as a tool material for FSW of hard material [13,14,15].
There are two main factors of brittleness in tungsten. First, tungsten with a body-centered cubic structure (BCC) has a very high Peierls stress result when the dislocation core of tungsten diffuses into the slip system [16,17]. Tungsten’s brittleness at room temperature is mainly caused by this reason. Second, the low-temperature brittleness of W is mainly due to interstitial impurity elements such as O, N and P (especially O) along the grain boundaries distribution [18]. To alleviate these problems, the addition of metals [19] and uniformly dispersed nanoparticles significantly improves the mechanical properties of W-based composites [20]. The addition of the rare metal rhenium (Re) significantly improves the ductility of W-Re alloys. The reduction of the tough–brittle transition temperature (DBTT) of W-Re alloys can happen by influencing the Peierls stress for the motion of the dislocations. It has been reported that the addition of carbides such as ZrC [21], HfC [22] and SiC [23] can absorb the impurity O elements at the W grain boundaries to form oxide particles, eliminating the influence of impurity oxygen and improving the grain boundary bonding.
FSW of hard alloys places high demands on tool materials, such as adequate strength, toughness at welding temperatures and high wear resistance. The microstructure and mechanical properties of the tool material influence the wear performance of FSW tools. Polycrystalline cubic boron nitride (PCBN) and WC-Co tool materials are currently used due to their high hardness and strength at high temperatures. It has been reported that FSW of steels using PCBN involves boron and nitrogen diffusion, which could result in pitting corrosion of the steel [24]. Wang et al. showed that the WC-Co stirrer head is susceptible to fracture during the welding process [25]. These limitations make the W-based composites a suitable candidate for FSW tools materials of hard alloys, such as steel and titanium alloys. Among the family of tungsten alloys, the W-25 wt% Re alloy is the most popular FSW tool material of hard alloys. However, the use of Re is costly, so the development of other W-based materials is therefore necessary.
The addition of uniformly dispersed nanoparticles such as carbides or oxides can significantly improve the mechanical properties of W-based composites. Among these carbide and oxide particles, SiC possesses a range of advantages including high hardness, excellent high-temperature strength, good oxidation resistance, and excellent wear resistance [23]. The mechanical properties of W-Si-C composites prepared by a melting method were investigated by Kang et al. [26]. With the addition of 1 wt% SiC, the ultimate compressive strength was significantly raised from 850 MPa to 1670 MPa, and the highest UCS strain (21.9%) was three times that of pure W (7.4%). Lee et al. [27] created W-based composites enhanced with SiC nanowire. There was an increase in the flexural strength of W-Si-C composites from 706 MPa to 924 MPa. At high temperatures, the ablation resistance was also improved. Selim et al. [28] prepared W-Si-C composites with high SiC concentrations by spark plasma sintering. The addition of SiC significantly increased the hardness of the W-Si-C composites, according to the results. However, the wear characteristics have not been investigated in detail. It has been reported that the introduction of ceramic phases can improve the hardness and wear resistance of metallic materials [29].
Due to W-based composites having a high melting point, the powder metallurgy method is usually used to prepare them. However, high sintering temperatures and prolonged holding times are typically needed for the traditional powder process to sinter W, which results in significant grain growth. In order to decrease the sintering temperature and duration, a more efficient sintering process is used to solidify the W-based composites. In recent years, spark plasma sintering has come forward as a new sintering method. Pulsed direct current and vertical pressure can densify sintered powder more quickly than traditional sintering methods, while also accelerating heating rate and reducing sintering temperature. Grain coarsening is significantly suppressed. Additionally, this has been widely used in the sintering of various materials.
In this study, spark plasma sintering was used to prepare the W-Si-C composites that were doped with various SiC contents. A thorough analysis of the W-Si-C composites’ microstructure, mechanical characteristics, and wear characteristics was conducted.

2. Experimental Details

2.1. Powder and Consolidation

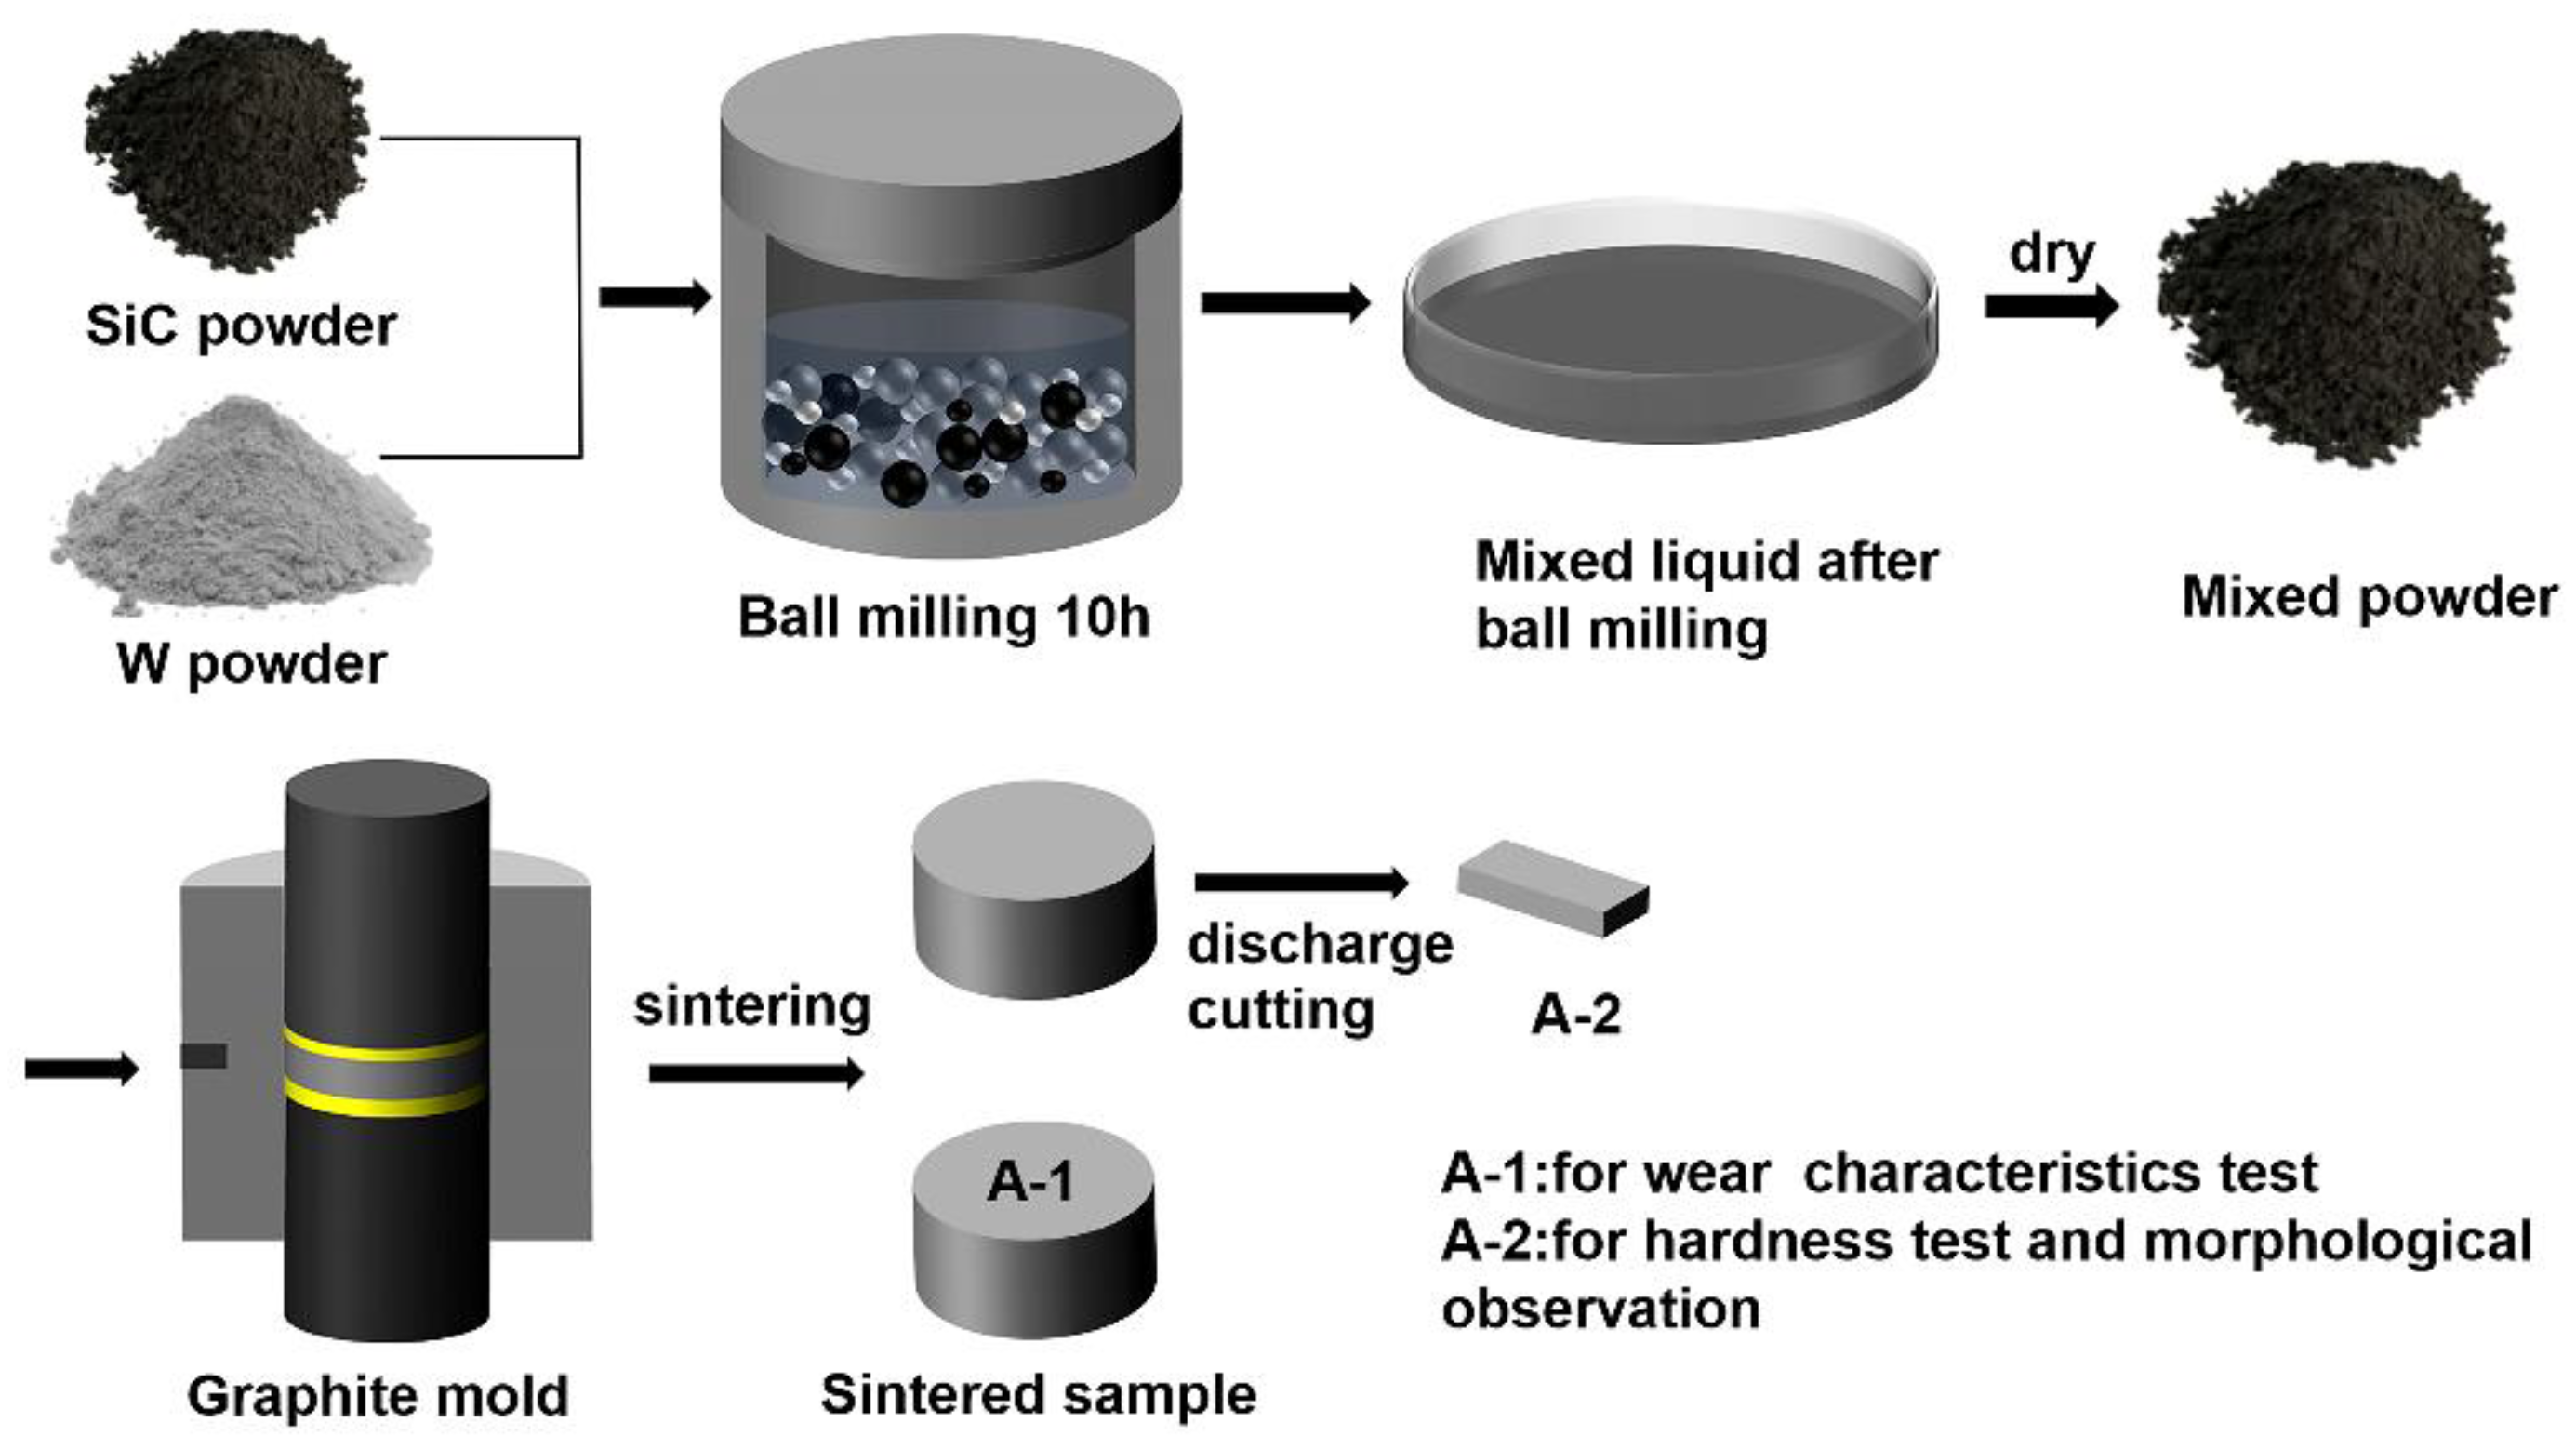
Pure commercial W powder (Aladdin, Shanghai, China) and β-SiC powder (Aladdin, Shanghai, China) were used as the raw powders in this study. The purity of the two raw powders was both 99.9 wt%. The average diameters of W powder and β-SiC powder were 1 μm and 0.15 μm, respectively. The scanning electron microscopy (SEM) morphologies of pure tungsten (PW) powder and SiC powder are shown in Figure 1. The mixed powders (W + 0.5 wt% SiC, W + 1 wt% SiC, W + 2 wt% SiC, abbreviated as WS05, WS1 and WS2, respectively) were milled at a speed of 300 rpm for 10 h using a planetary ball mill with a weight ratio of 10:1 for ball to powder, and ethanol was applied for the process control agent. After mixing, the powders were dried at 80 °C in a vacuum oven for 12 h and then placed into a graphite mold with an inner diameter of 15 mm. The composites were prepared by sintering via the SPS system (ED-PASIII, ELENIX Ltd., Kanagawa, Japan). During the sintering, by focusing the optical infrared device on the hole (about 2 mm in diameter) on the surface of the SPS die, the temperature was detected. The samples were heated to 600 °C within 1 min, then ramped up to 1700 °C at a heating rate of 100 °C/min and held at 1700 °C for 5 min. Heating and holding stages were at constant mechanical pressure (50 MPa). The specific experimental process and sintering procedure are shown in Figure 2 and Figure 3, respectively.

2.2. Microscopic and Phase Analysis

The phase composition of the sintered samples was analyzed by X-ray diffraction (XRD, X’Pert PRO, PANalytical, Almelo, The Netherlands). Before testing, the specimens were sandpapered and smoothed to remove the surface layer of impurities, then cleaned with ultrasonic waves. The test conditions were Cu Kα with a wavelength of 1.5406 Å, scanning step was 0.02°, scanning speed was 4°/min, measurement range (2θ) was between 10° to 90°, operating voltage and current of 40 kV and 40 mA, respectively. The elemental distribution of the W-Si-C composite was determined by electron probe microanalysis (EPMA-8050G, Shimadzu, Kyoto, Japan). SEM (FESEM, FEI Quanta FEG250, Thermo Fisher Scientific, Waltham, MA, USA) with Energy Dispersive X-ray spectrometry was used to examine the morphology and microstructure of the raw powders and sintered samples.

2.3. Density Measurements

The sintered sample was subjected to a grinder to strip the carbide from its surface. The Archimedes method was used to calculate the density of pure W and the W-Si-C composites. The polished samples were soaked in deionized water for 12 h. The samples were then weighed for their floating weight (m1) in deionized water and their wet weight (m2) in air. After measurement, the samples were dried for 24 h in an oven. The oven temperature was set to 80 °C. The samples were then weighed in the air for their dry weight (m0). To ensure the accuracy of experimental data, each sample was weighed three times. The measured density (ρ1) and the relative density (ρ2) of the sintered samples were calculated using Formulas (1) and (2).
ρ 1 = m 0 ρ w m 2 m 1
ρ 2 = ρ 1 ρ t h × 100 %
where ρw is the density of deionized water and ρth is the theoretical density of the W-Si-C composites.

2.4. Micro-Hardness Tests

In this paper, Vickers micro-hardness testers (Wilson Tukon 1202, Buehler, Lake Bluff, IL, USA) were used to measure the hardness of the pure W and the W-Si-C composites under a load of 300 gf and a hold time of 15 s. To minimize errors, each sample was measured in at least 5 different positions and then the average value was taken.

2.5. Wear Characteristics Tests

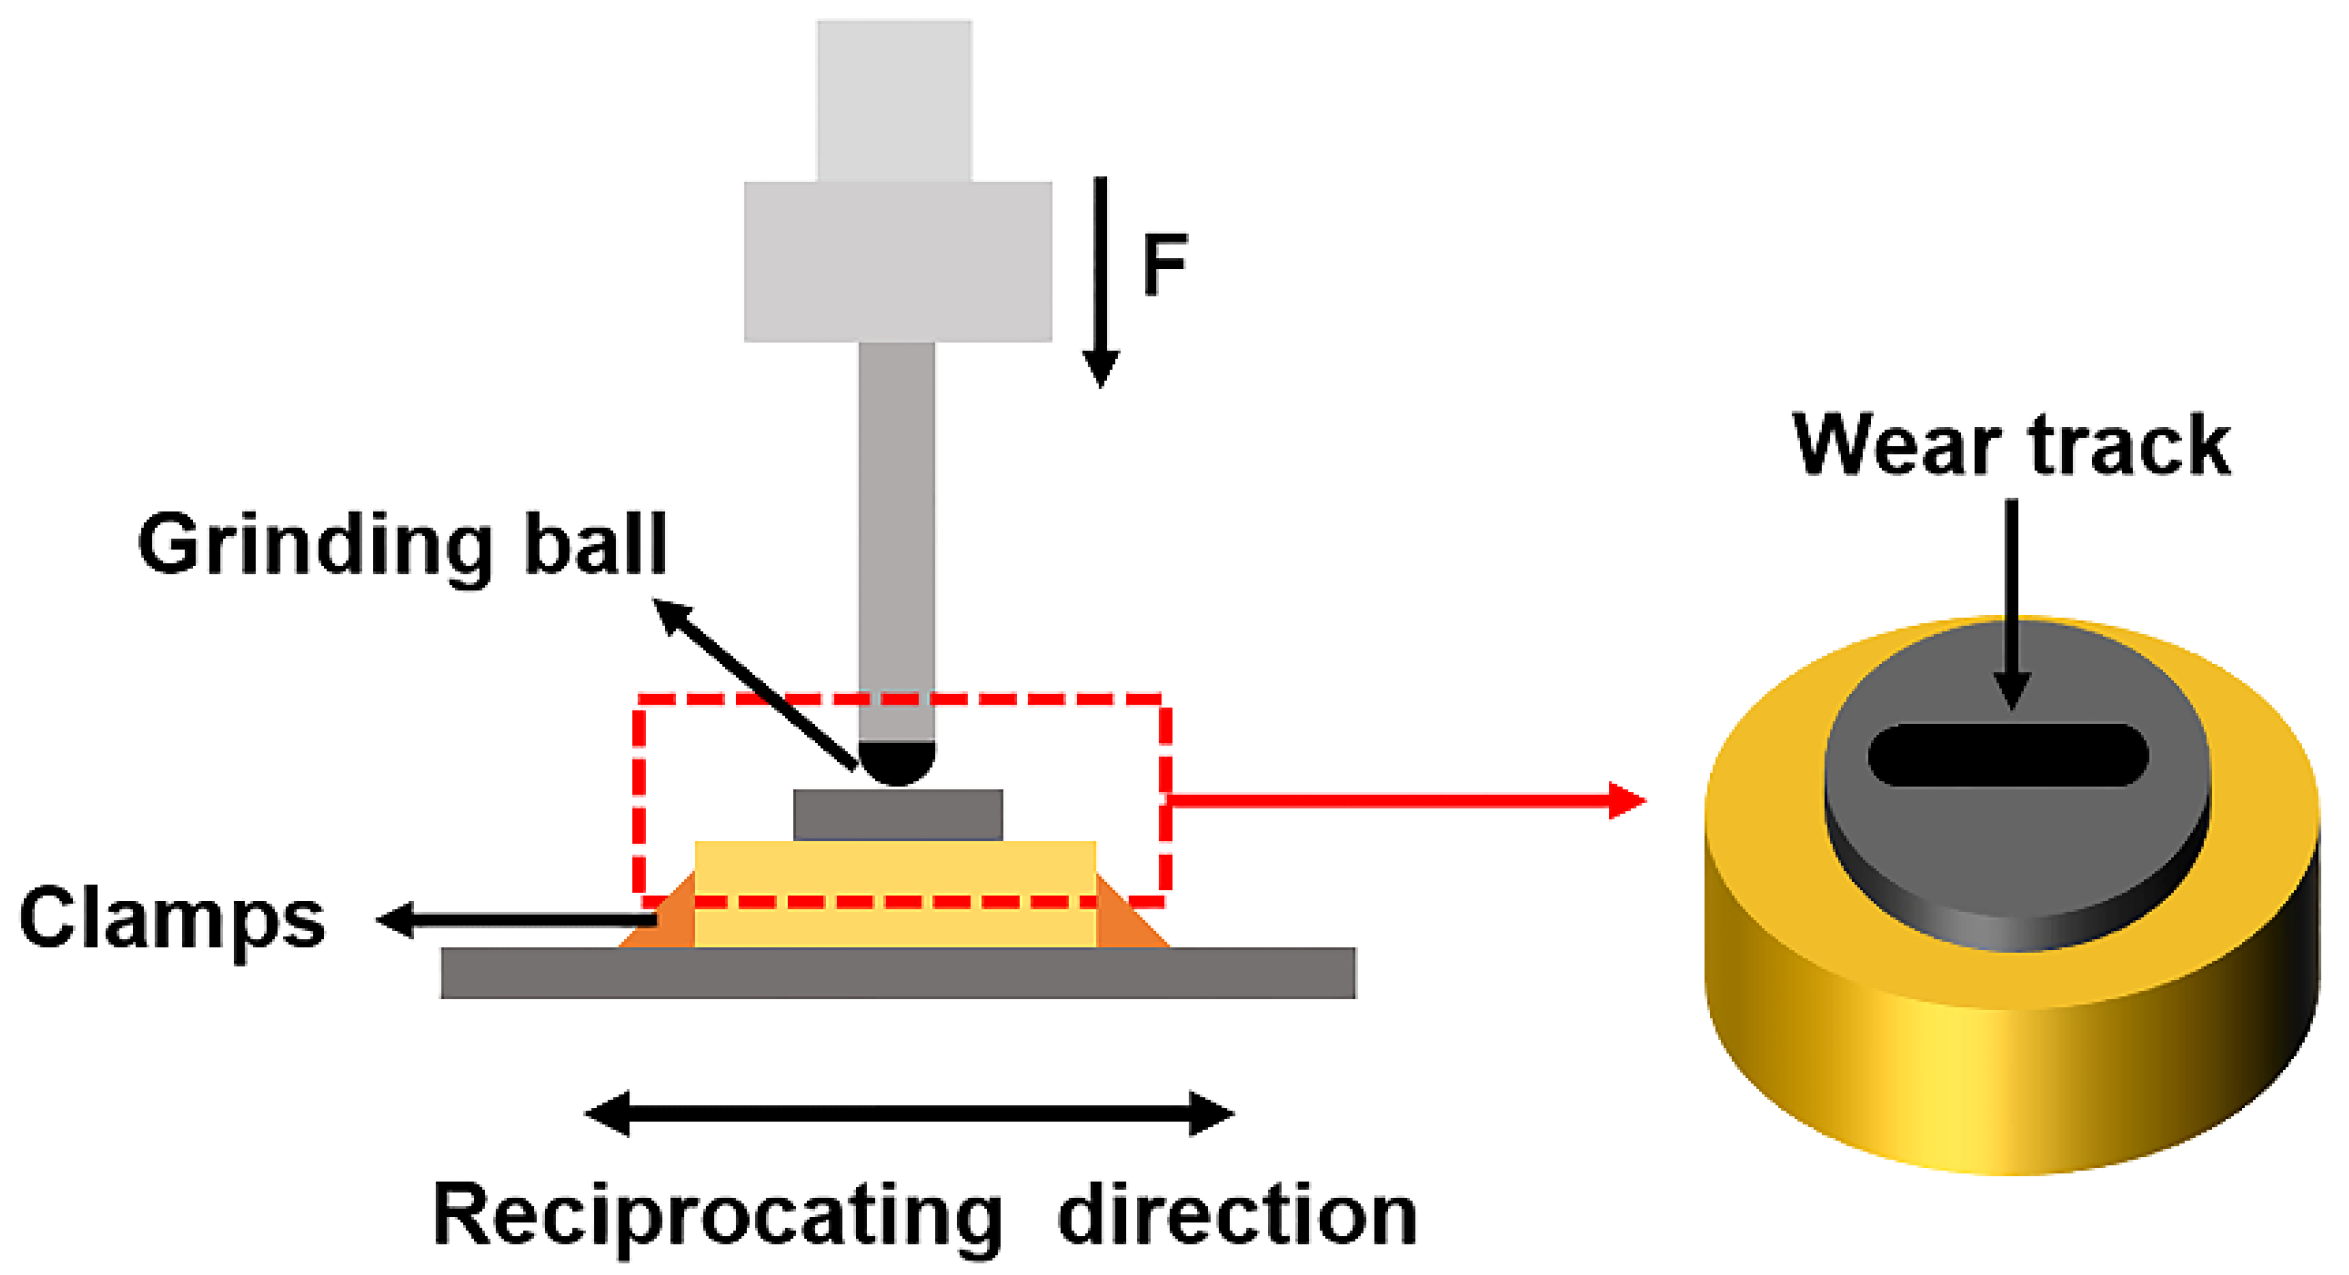
Dry sliding friction tests were performed using a reciprocating wear tester (MDW-02G, Jinan Yihua Tribological Testing Technology Co., Ltd., Jinan, China). Figure 4 shows the friction test. After grinding and polishing, the surfaces of the specimens were rubbed with a GCr15 ball of Φ2 mm. Additionally, the specimens were rubbed with a loading force of 80 N for 60 min. The one-way sliding distance was 5 mm, and the frequency was 3 Hz. All tests were performed at room temperature. The volume wear rate kv was calculated as follows:
k v = V P · S
where V is the wear volume in mm3, S is the sliding distance in m, and F is the applied load in N. The surfaces’ morphologies of W-Si-C composites after wear were observed with FE-SEM, and the wear mechanism of the material was determined from the morphological characteristics of the worn surface. The width and depth of wear cracks was established using a three-dimensional profilometer (ST400, NANOVEA, California, CA, USA).

3. Results and Discussion

3.1. Microstructure and Phase Composition of W-Si-C Composites

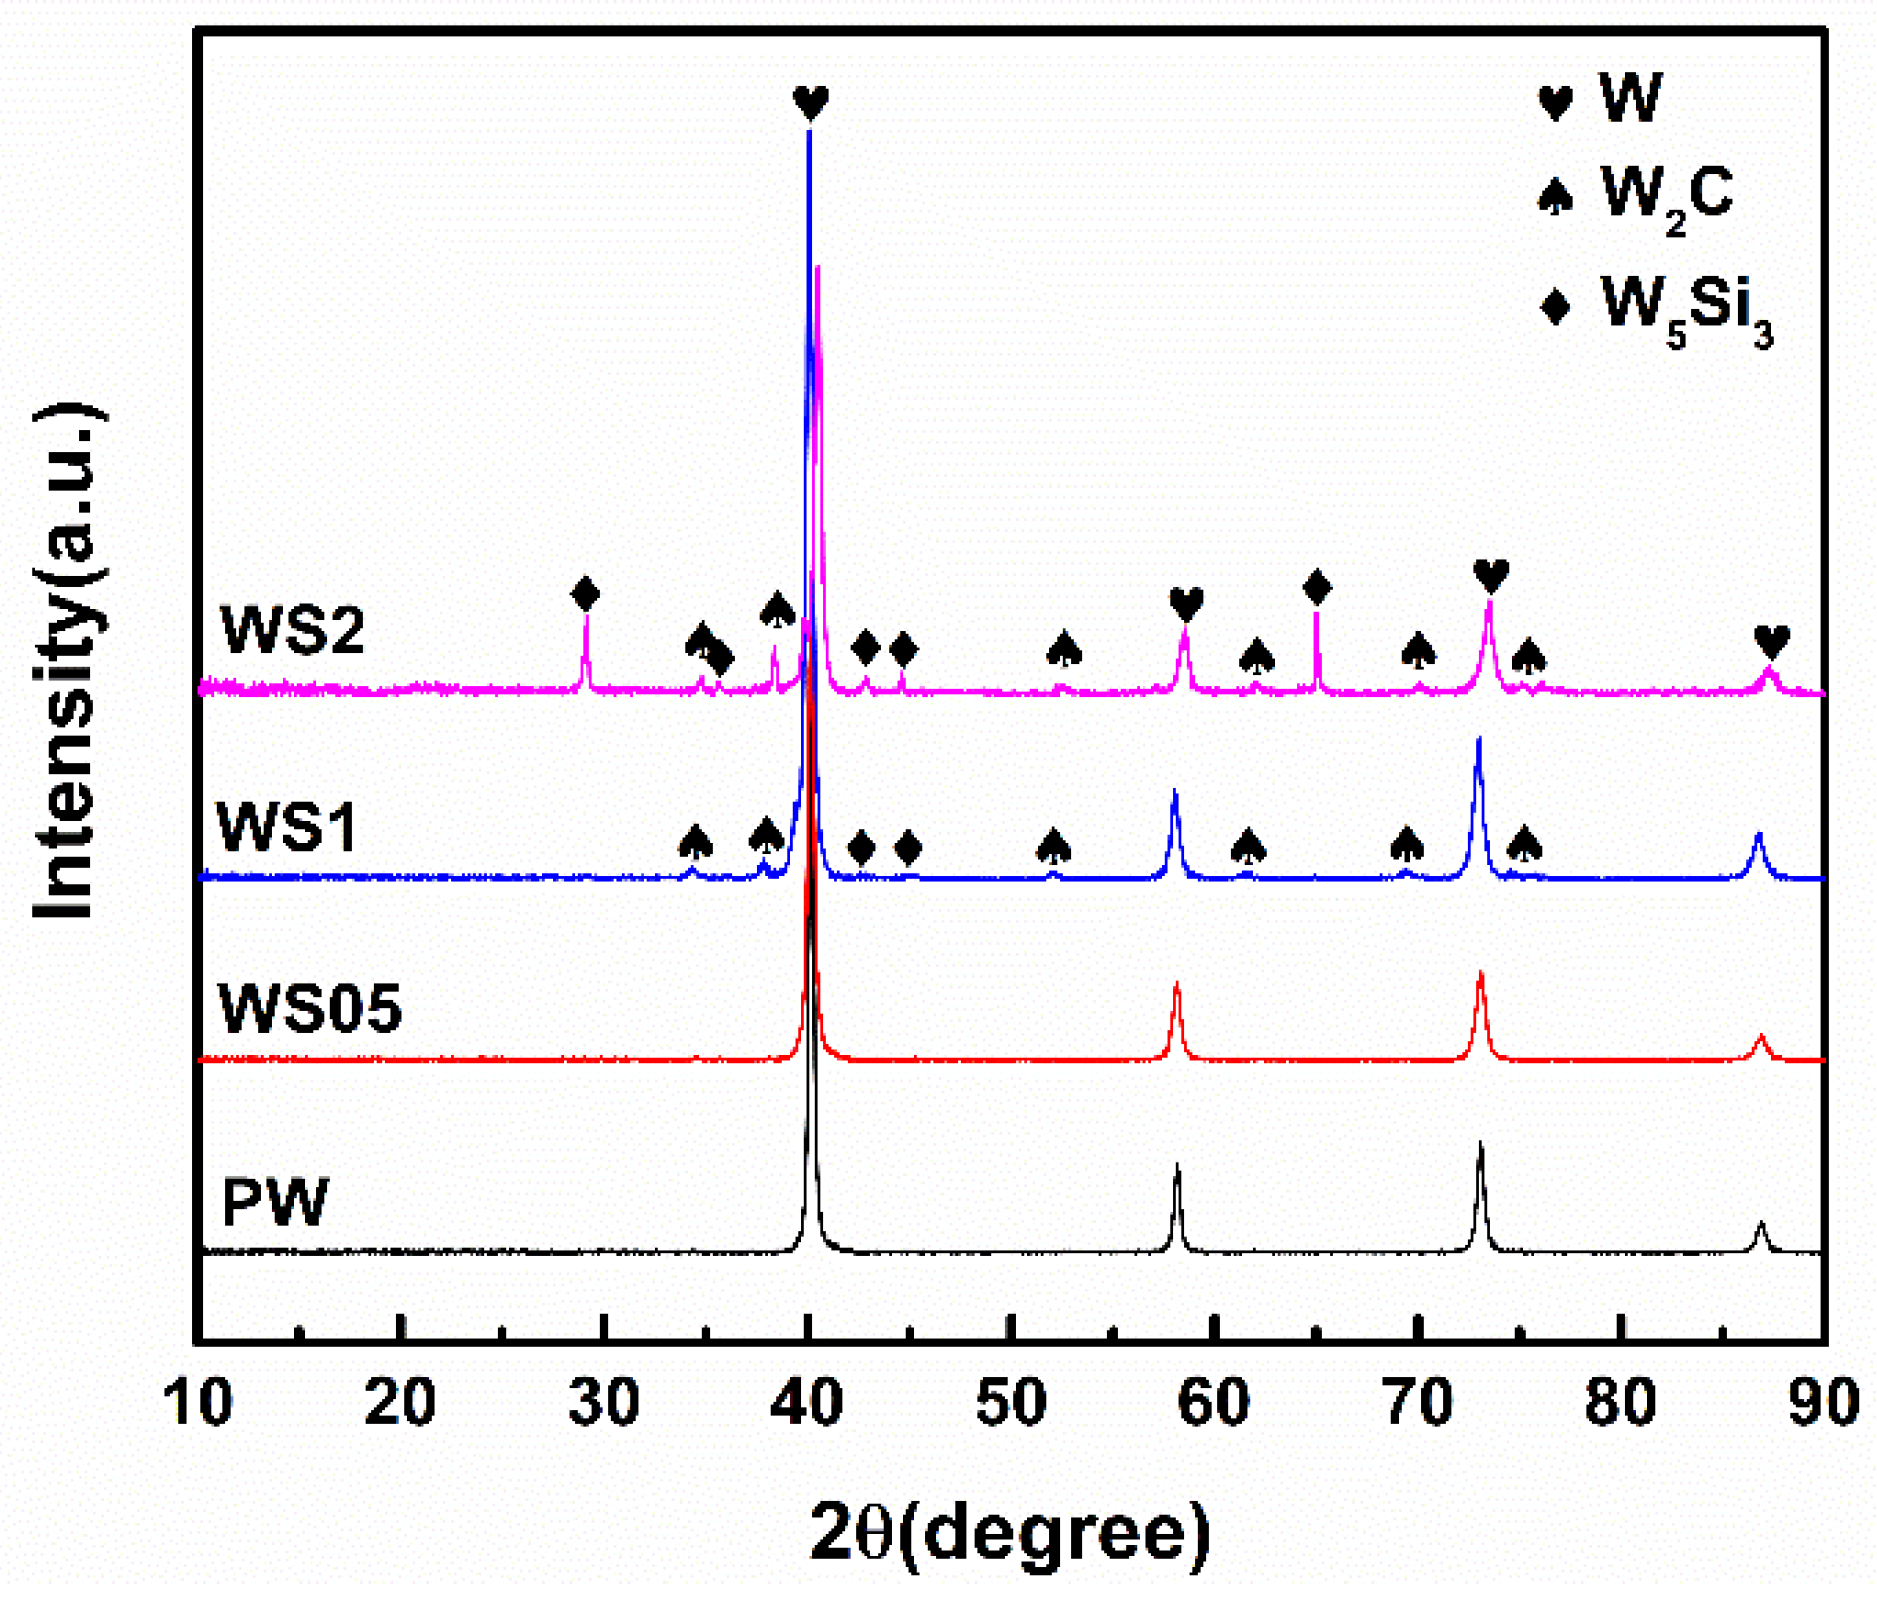
Figure 5 displays the XRD patterns of pure W and W-Si-C composites. Compared to the XRD pattern of the pure W, the W2C phase and W5Si3 phase were detected on XRD patterns of the WS1 and the WS2, and only W was detected in the WS05. The intensities of the W peaks of the WS2 were reduced, while that of W5Si3 increased compared to the other samples. The reaction of W and SiC to form W2C and W5Si3 led to a reduction in the W amount, which may account for the reduction in the W peaks.
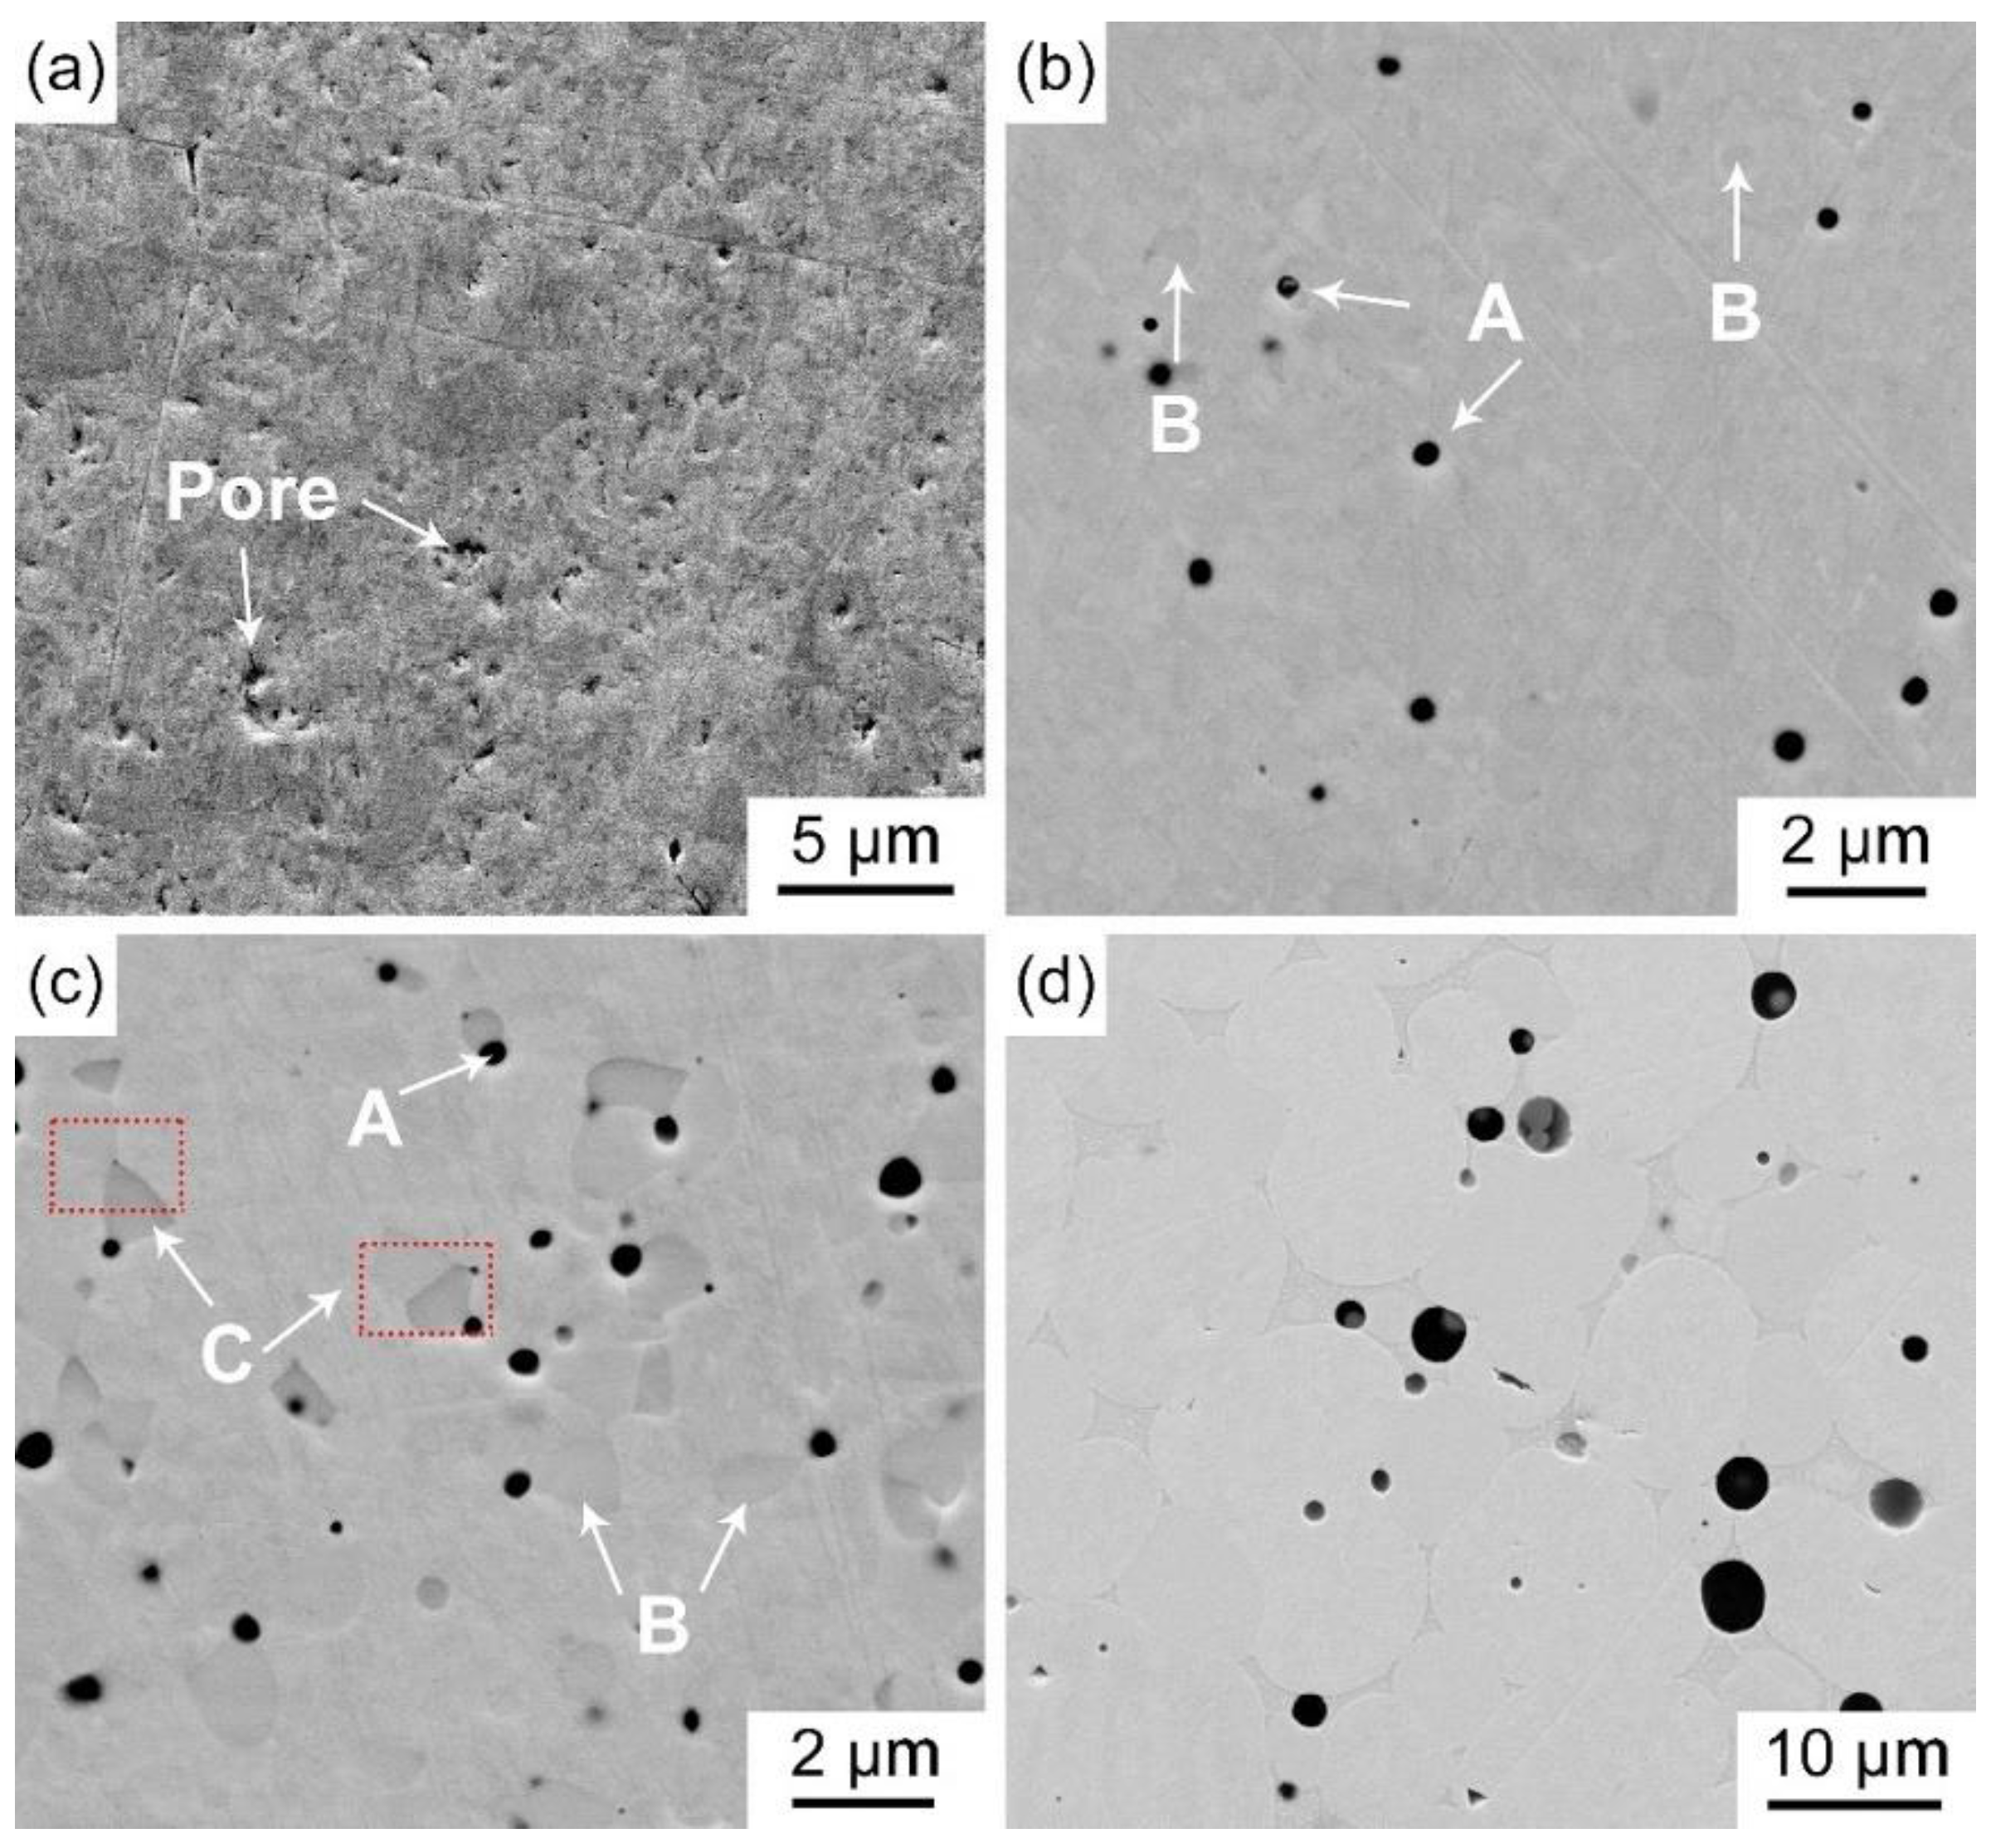
Surface BSE-SEM images of pure W and the W-Si-C composites are shown in Figure 6. There were numerous pores in pure W, and the quantity of pores significantly decreased with an increase in SiC content in the W-Si-C composites. Black phases (denoted A) and another grey phase (denoted B) were visible and evenly distributed in the W matrix when the SiC content reaches 0.5 wt%. The A phase and B phase were also visible as the SiC content increased further to 1 wt%, and another phase (denoted C) was produced in the W matrix. The EDS analyses of phase A, phase B and phase C are shown in Figure 7. The elements of phase A included W, Si, C and O, consisting mainly of the elements Si and O. The results show that the atomic ratio of Si:O is about 35.47:55.62. Therefore, it is speculated that phase A is SiO2 and the speculation is also supported by previous study [23,30]. The elements of phase B contained W and C, and the contents of W and C were 31.22 At% and 68.78 At%, respectively. The C/W atomic ratio of phase B was about 2.2. Combined with XRD results, phase B is W2C. Phase C contained mainly the elements W, Si and C, and the atomic ratio of W:Si:C was about 39.69:14.44:45.87. It is reported that W, Si and C do not form a ternary compound [31]. The C phase was composed of W2C and W5Si3 combined with the XRD results and EDS analysis.
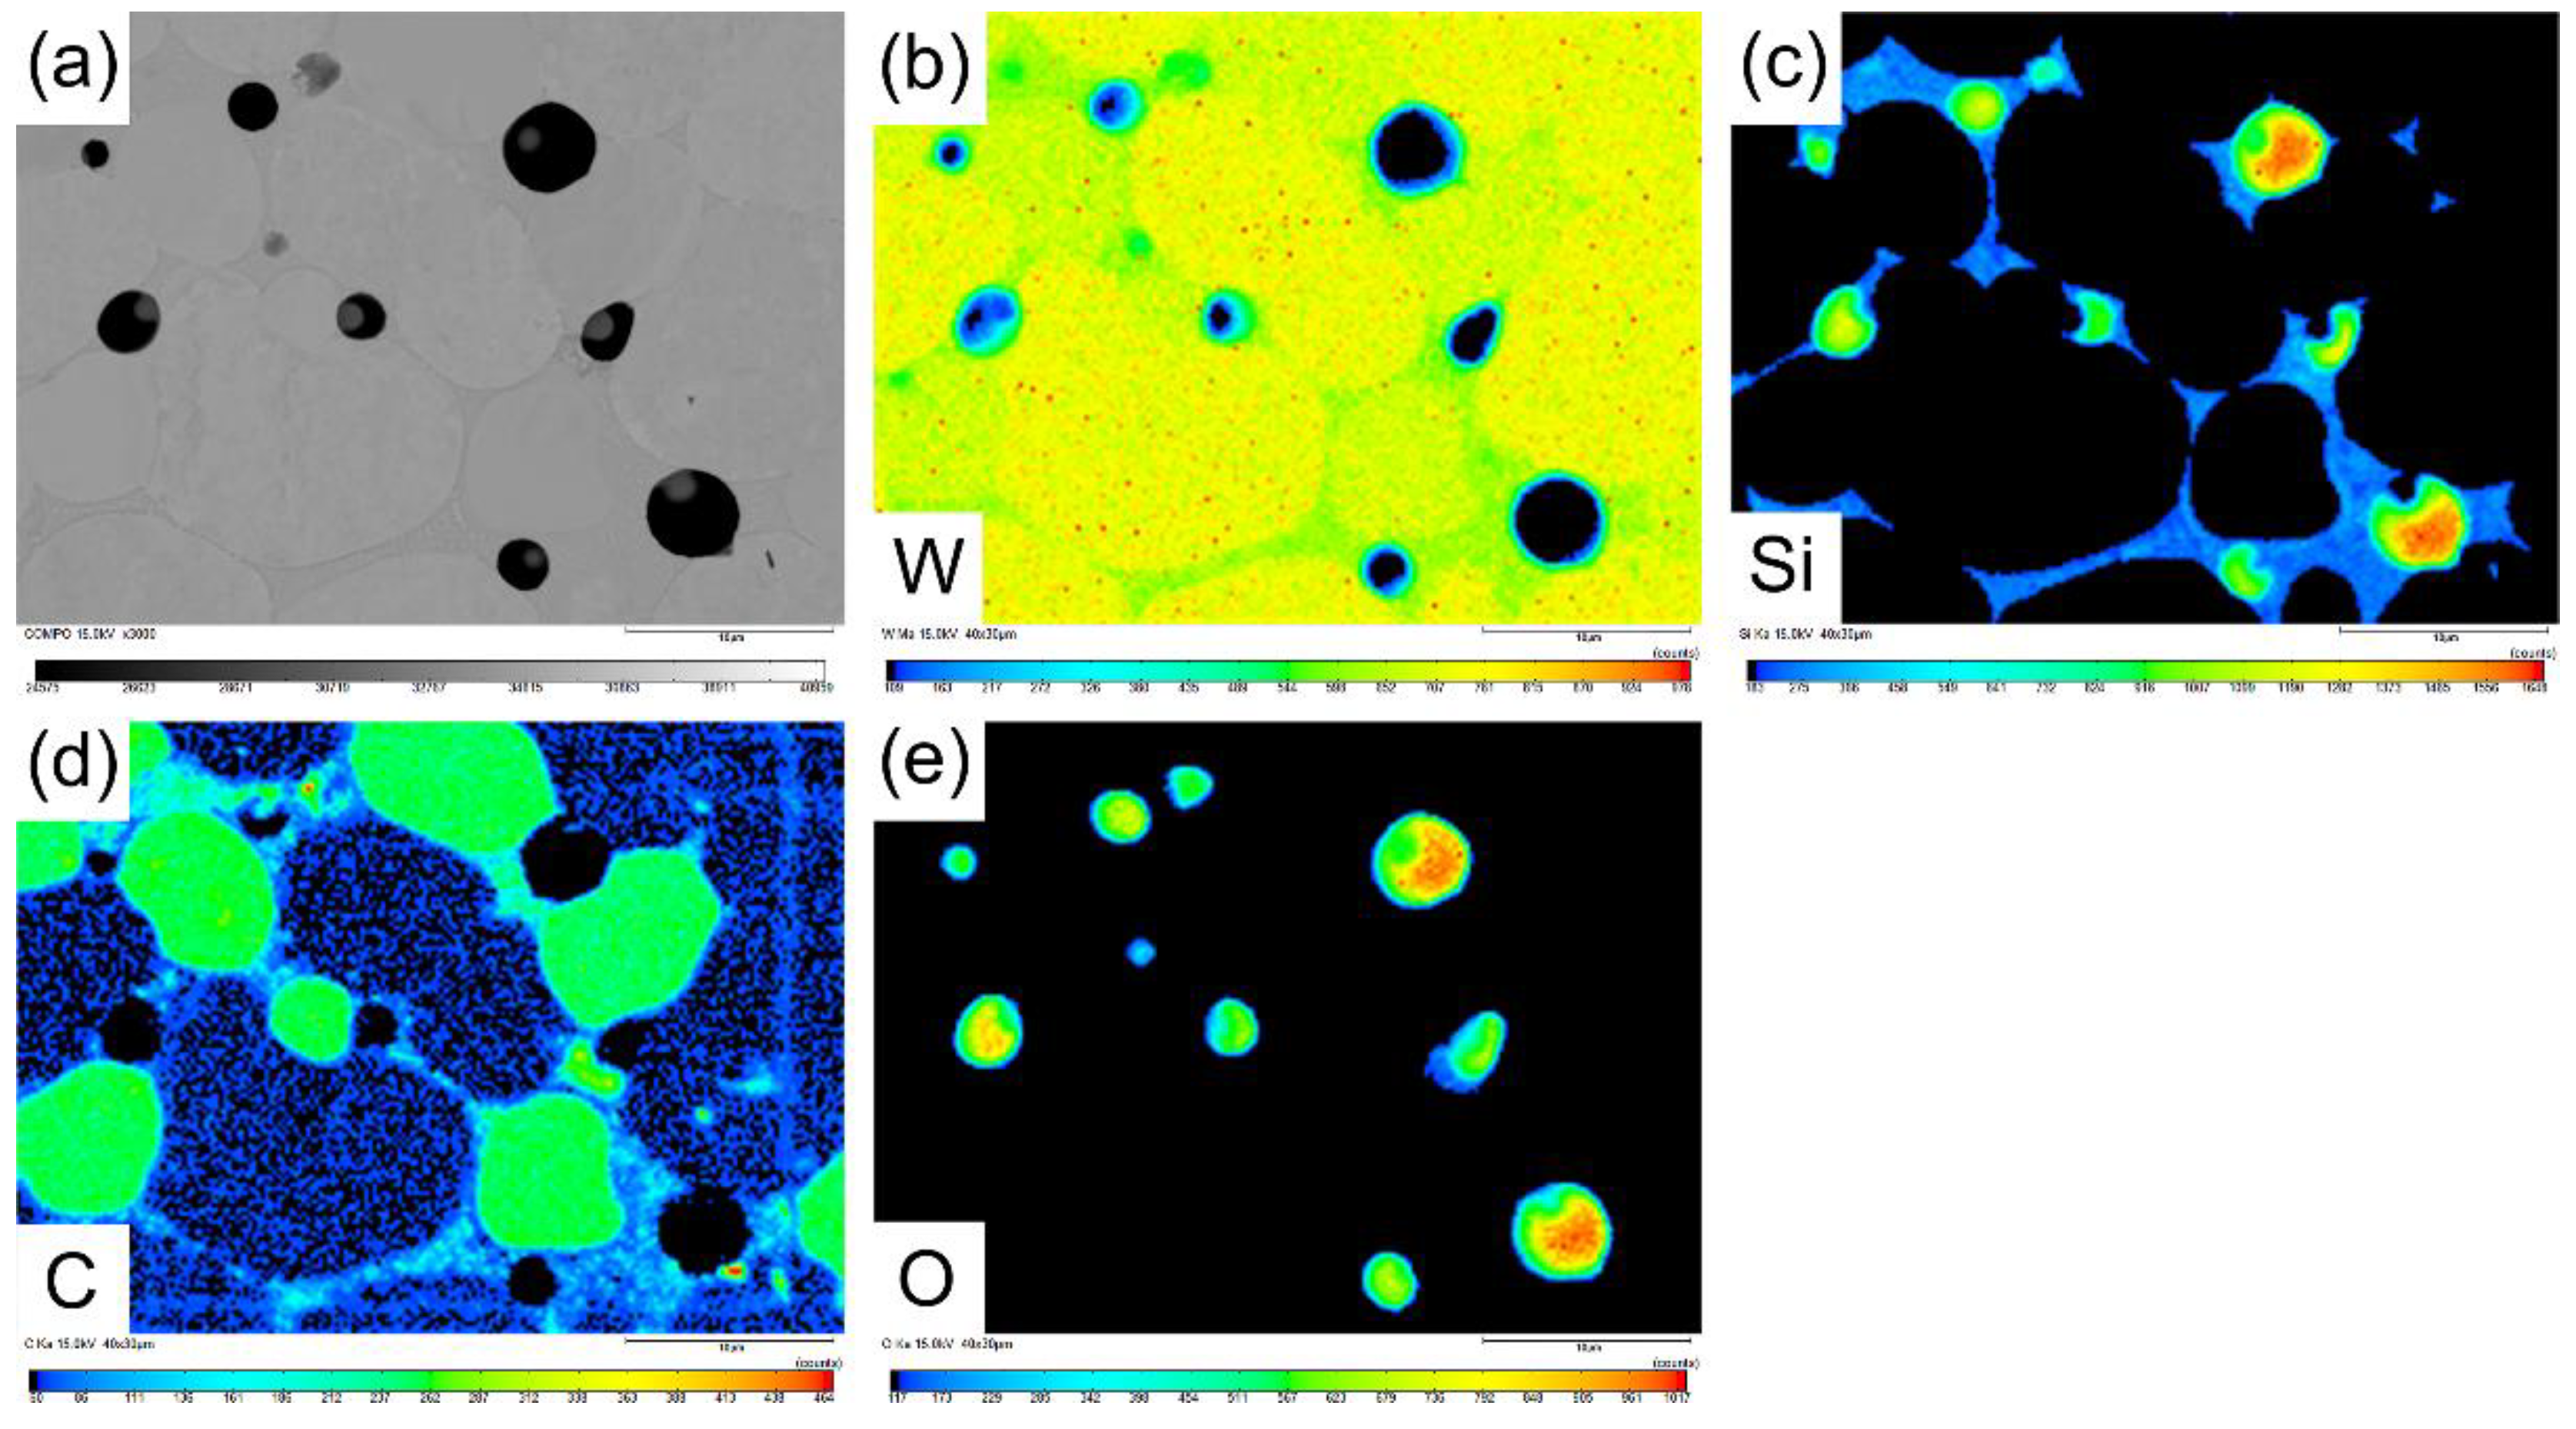
Figure 8 shows the EPMA analysis of the WS2. Figure 8b shows the distribution of W element in WS2. Yellow areas are enriched with large amounts of element W. The green area is enriched to some extent by W, but less than the yellow area. The black area indicates that there is no element W in this area. The W element is almost everywhere, except at the black particles in Figure 8a. Figure 8c shows the distribution of Si element in WS2. The yellow area is the main enrichment zone for element Si, the green and blue areas are the secondary enrichment zones and the black area has no enrichment for elemental Si. Therefore, Si element is mainly enriched in the black particles in Figure 8a, with a secondary distribution between the tungsten particles. Figure 8d shows the distribution of C element in WS2. The yellow area is the major enrichment zone for element C, the green area is the minor enrichment zone, and the black area has no enrichment for element C. The C element is mainly distributed between the tungsten particles. Figure 8e shows the distribution of O element in WS2. Yellow and green areas are the main enrichment areas for element O. Black areas are not enriched for element O. The O element is mainly found in the black particles in Figure 8a. In combination with Figure 8b–d, the area between the W particles is enriched in W element, Si element and C element. Therefore, the phase in this region is W2C and W5Si3. W2C with a larger particle size was also generated between the W particles. Combining Figure 8c,e, the black particles in Figure 8a are enriched in elements Si and O, the black particles can be further identified as SiO2, and the SiO2 particles also become coarse. SiO2 was not detected on XRD patterns of W-Si-C composites due to the lower SiO2 production. Similarly, W2C was not detected in WS05 for the same reason.
The following are the main reactions of W-Si-C composites that are determined to occur during SPS:
S i C + 8 / 3 W 1 / 3 W 5 S i 3 + W C
W C + W W 2 C
S i C + O 2 S i O 2 + C
C + 2 W W 2 C
To make the phase formation process clear, Table 1 shows the variation of Gibbs free energy of Reactions (4)–(7) with temperatures, which were calculated by the HSC chemistry database. When the Gibbs free energy is negative (ΔG < 0), the reaction can proceed spontaneously. Reactions (4)–(7) can all proceed spontaneously under the conditions of this experiment. SiC reacts preferentially with oxygen due to its better affinity with oxygen [23]. In WS05, only Reactions (6) and (7) occurred due to the low content of SiC. In WS1 and WS2, Reactions (4)–(7) all took place.

3.2. Relative Density and Grain Size of W-Si-C Composites

Figure 9 shows the average grain size and relative density of pure W and the W-Si-C composites. As the SiC content increased, the relative density of the material first increased and then tended to remain a constant. The relative densities of pure W and WS05 were 94.32% and 97.08%, respectively. Increasing the SiC content to 1 wt%, the relative density of the material rose to 97.99%, and the relative density of the W-Si-C composites barely increased above 1 wt% SiC content. The relative density of WS2 was 98.12%. The W matrix reacted with SiC, reduced the free energy of the sintering system and promoted the process of densification [23]. Pure W had an average grain size of 9.10 μm. The average grain size of WS05 was 8.02 μm. When the SiC content increased to 1 wt%, the average grain size of the WS1 decreased to 7.69 μm. However, when the SiC content reached 2%, the average grain size of W particles increased. The microstructure of the WS2 exhibited the characteristics of liquid phase sintering, which made the average grain size of WS2 larger. The results demonstrate that SiC can prevent tungsten from growing into larger grains during the sintering process. W-TiC [32] and W-HfC [22] composites also showed that the grain size of W can be effectively reduced by a small amount of ceramic particles. Grain refinement can produce larger grain volume fractions or sub-grain boundaries, which effectively inhibit dislocation movement, resulting in higher strengths [33].

3.3. Mechanical Properties

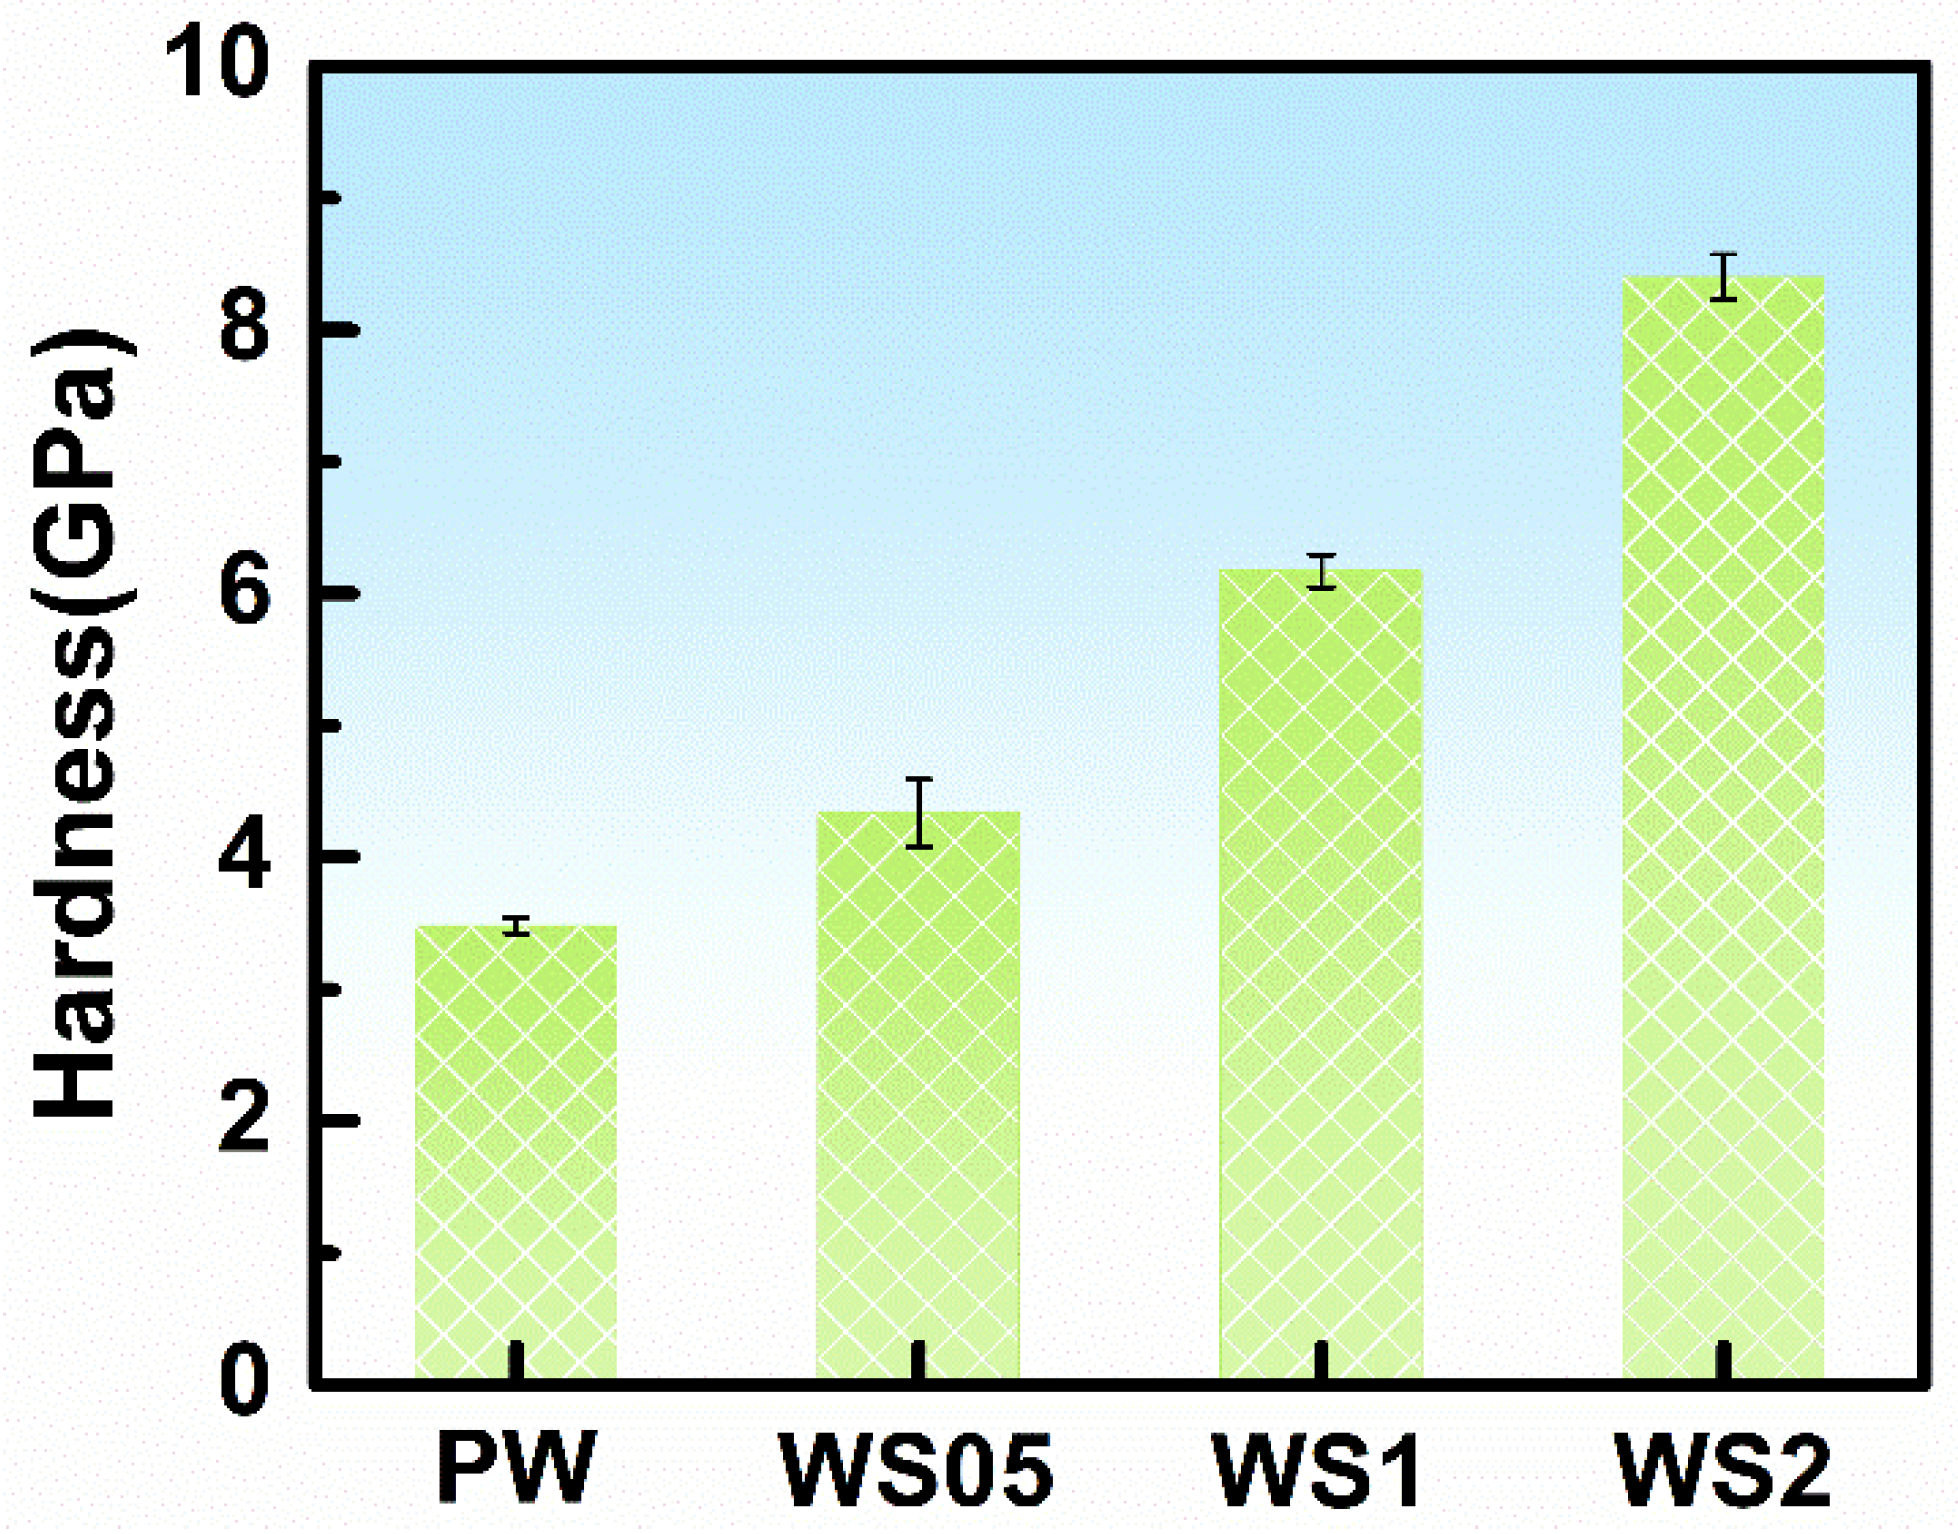
The content of SiC has a large influence on the hardness of the composites. As shown in Figure 10, the hardness of W-Si-C composites ranges from 4.33 to 8.40 GPa, which is significantly higher than the hardness of pure W. (3.48 GPa). The grain diameter and porosity fraction have an important effect on Vickers hardness, as shown by the following equations [34]:
H v = H 0 e x p b ρ
H v = H 0 + k H d 1 / 2
where H0 is the Vickers hardness value corresponding to a specimen with zero porosity. b is a material dependence constant. kH is the Hall–Petch coefficient, the influence coefficient of the grain boundary on hardness. ρ represents the porosity fraction, and d represents the grain diameter. The reduction in grain size and porosity fraction of the material can lead to an improvement in hardness. It can be also seen that the hardnesses of WS05 and WS1 are higher than pure W, which is due to the combined effects of reduced grain size and reduced porosity fraction. WS2 has a larger grain size than WS1 and almost the same relative density. However, compared to WS1, the hardness of WS2 significantly increased. The hardness of a material is determined by its phase composition and microstructure, and the continuous distribution of W5Si3 and a high content of W2C led to the improvement of the hardness of the WS2.

3.4. Wear Characteristics

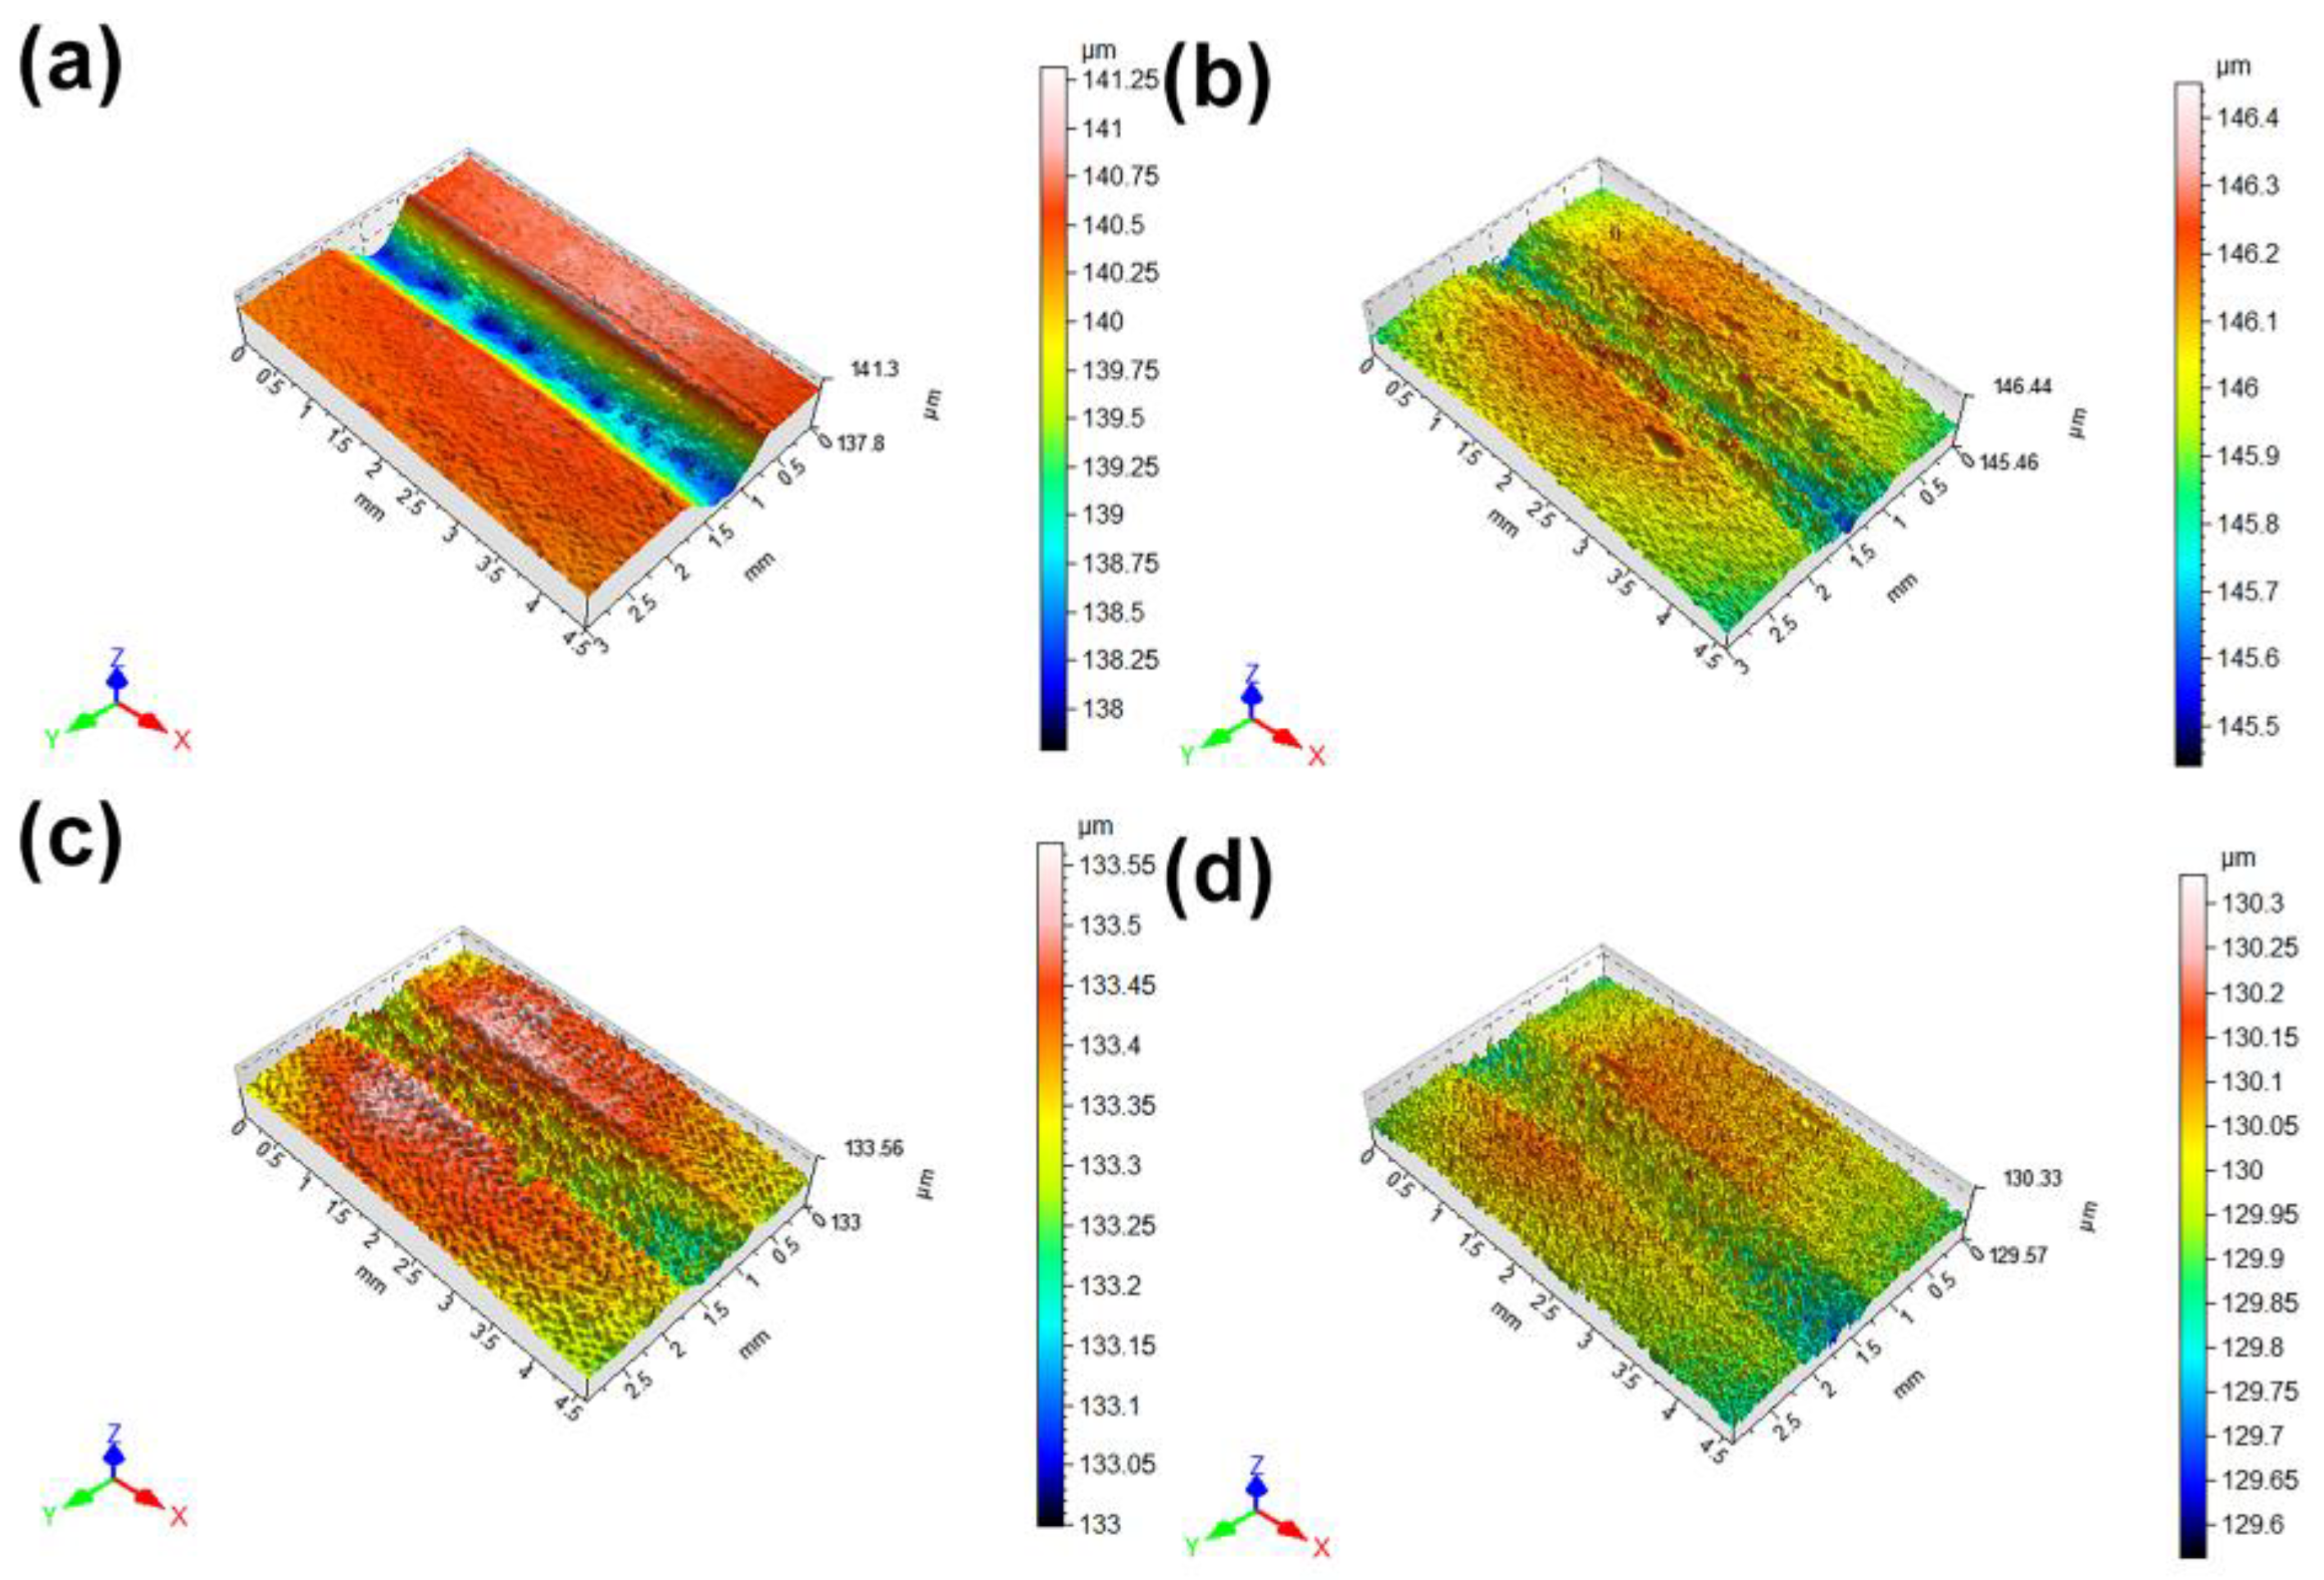
Figure 11 shows the three-dimensional topography of the wear tracks of pure W and the W-Si-C composites. It can be observed that the size of the wear track profile varies for pure tungsten as well as for W-Si-C composites with different SiC contents. The wear track of the pure W had the largest depth. The wear depth of the W-Si-C composites significantly decreased with a low SiC content. The depth of the wear track did not change significantly after continuing to increase the SiC content. The comparison of the images in Figure 11 clearly show that the addition of SiC results in a reduction in the wear track depth and a significant improvement in wear resistance. As previously explained and reported by other researchers, the improvement in wear resistance can be attributed to the increase in density and hardness, as well as the reduction in porosity [35].
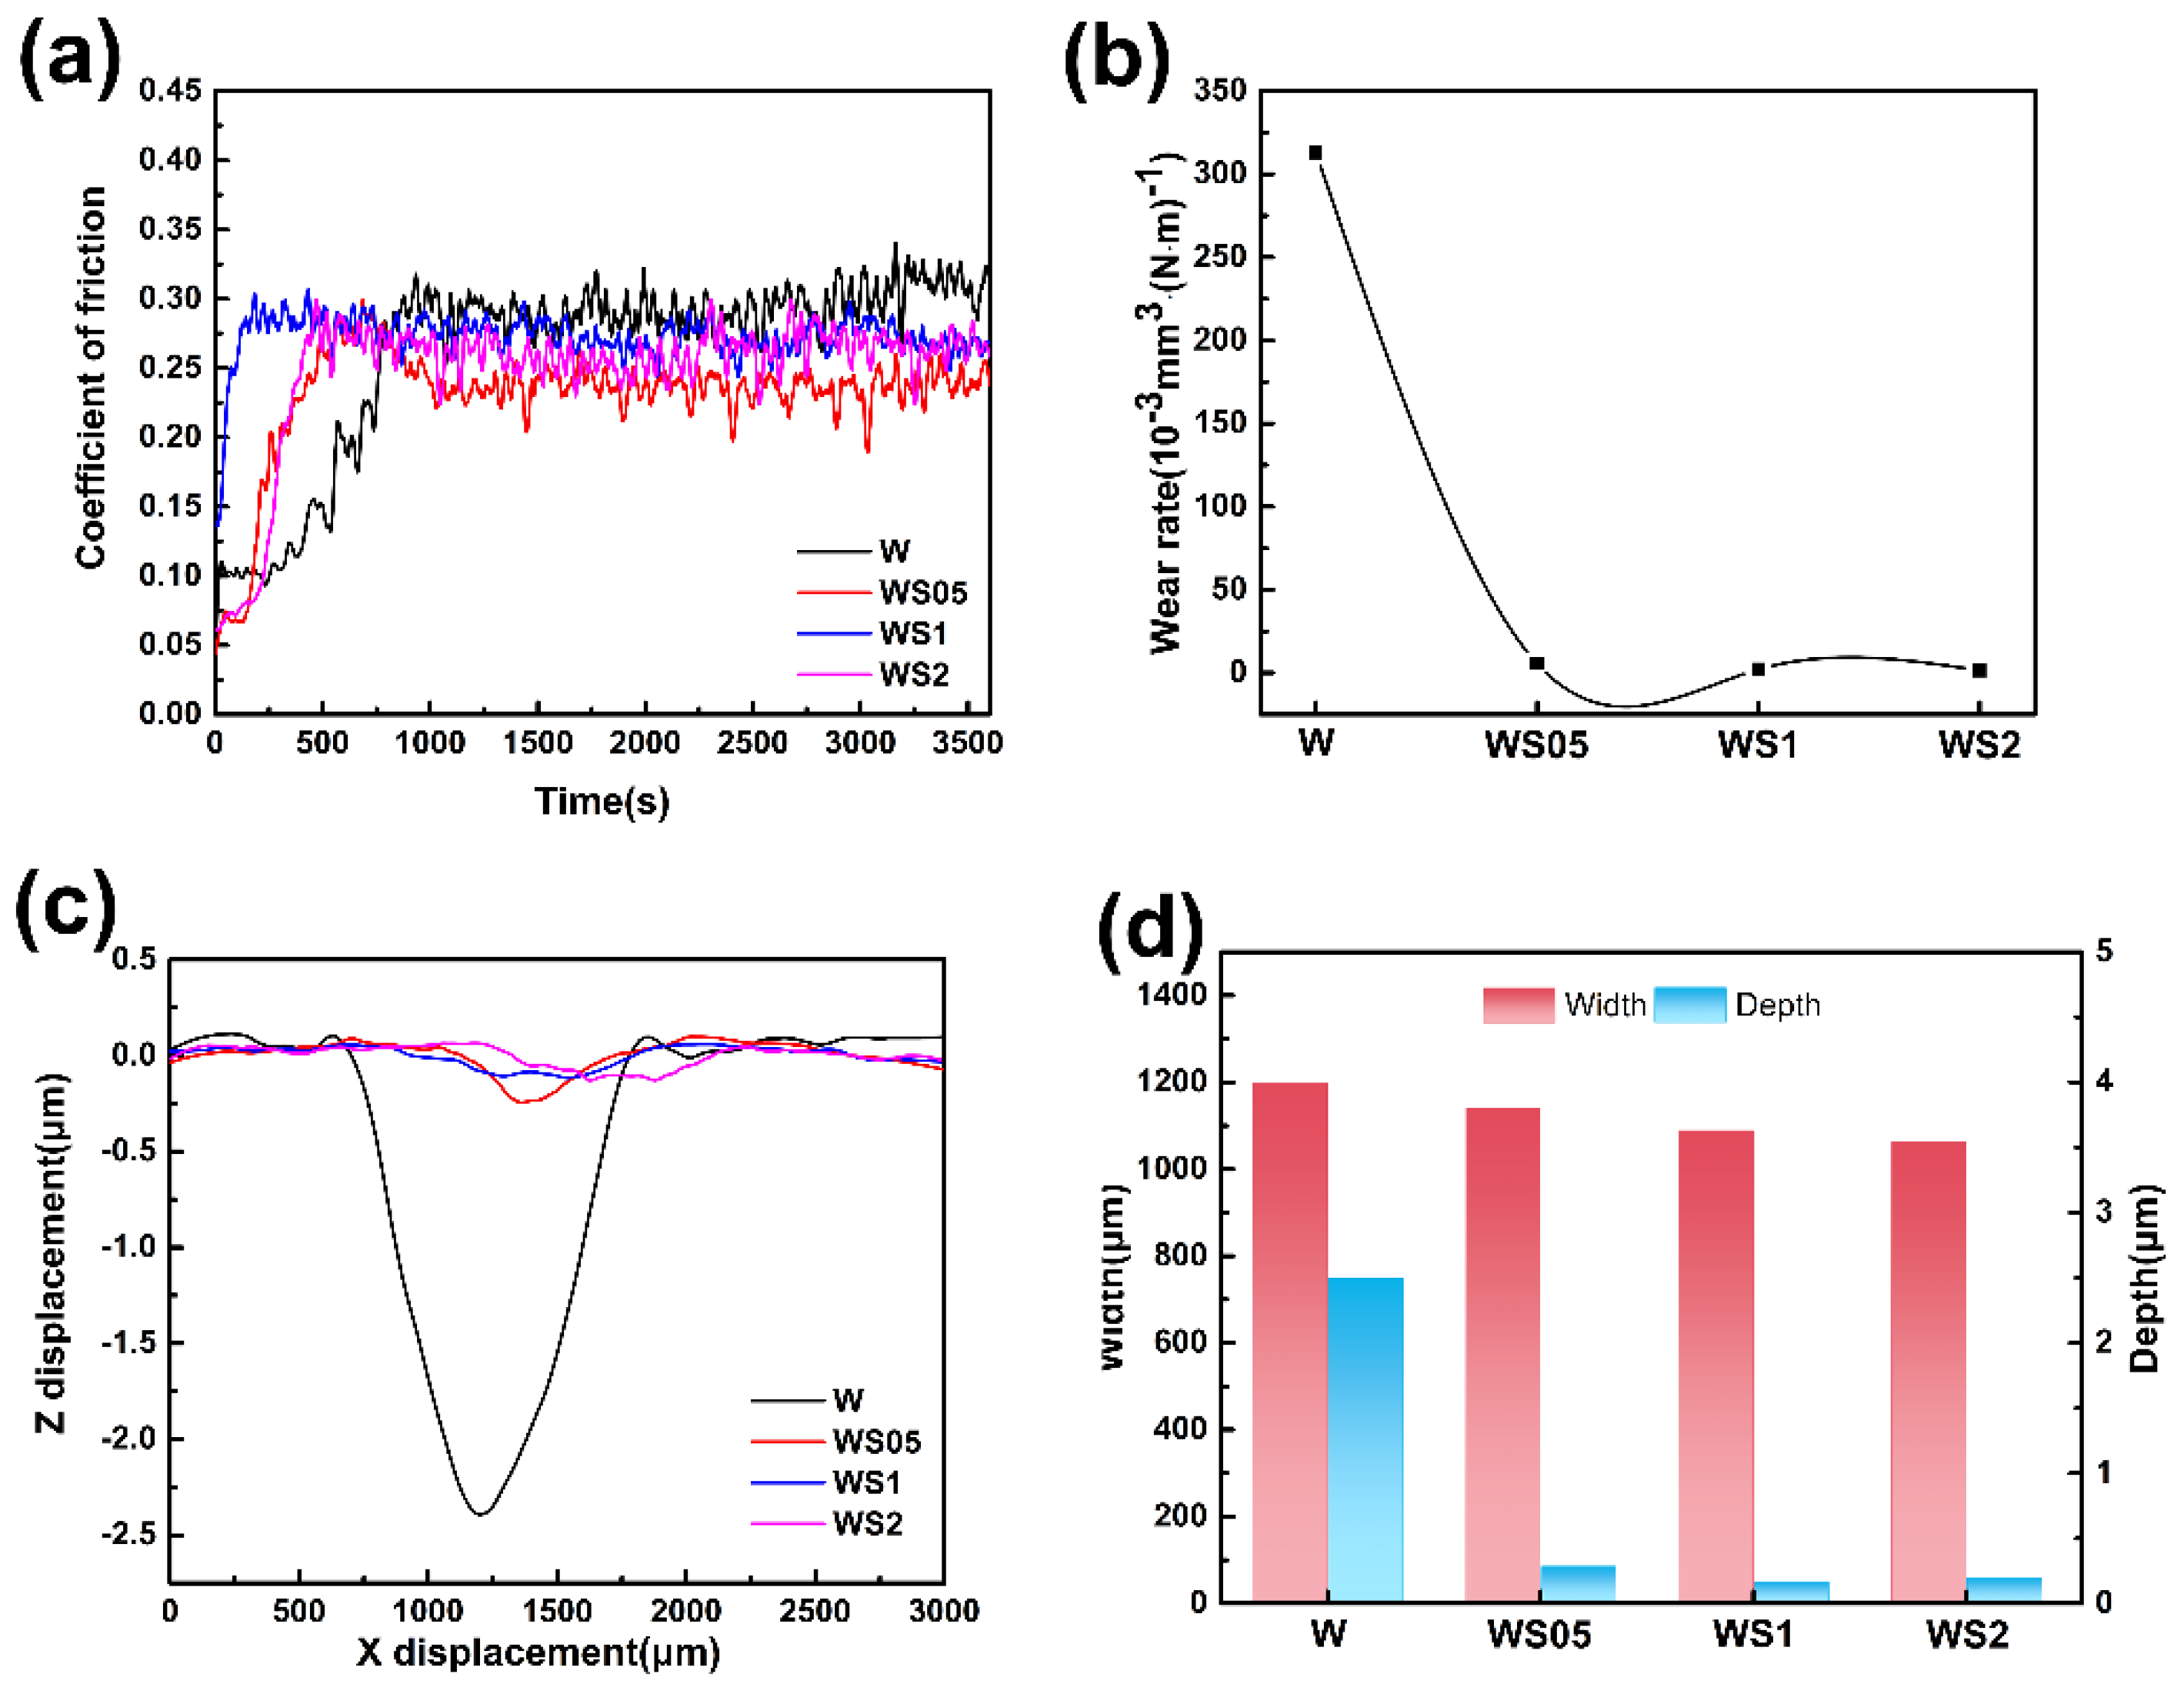
Figure 12 shows the specific tribological property of the pure W and the W-Si-C composites. Figure 12a shows the variation in friction coefficient with sliding time for pure W and the W-Si-C alloy. The coefficient of friction for pure W ranged between 0.26 and 0.34. The SiC content was raised to 0.5 wt%. The coefficient of friction of material ranged between 0.20 and 0.26. As the SiC content further increased to 1 wt%, the coefficient of friction of composites slightly increased, and the WS1 had a coefficient of friction that ranged between 0.24 and 0.29. The coefficient of friction of the WS2 ranged between 0.22 and 0.29. It has been shown that there was no significant difference in the coefficient of friction of pure W and W-Si-C composites. It can be seen that the coefficient of friction of pure W and the W-Si-C composites increased at the beginning of the test and gradually stabilized over the remainder of the test. At the start of the wear process, the contact between the friction pair and the samples was mostly point contact, with a small amount of area contact. As a result, the initial friction coefficient was small. As time passed, the contact area expanded, resulting in an increase in the friction coefficient. It is also clear that the friction coefficient was not constant, and fluctuates as shown in Figure 12a.
The addition of SiC significantly increases wear resistance, as seen in Figure 12b. The wear rates of the pure W and the WS05 were 313.27 × 10⁻³ mm3/N·m and 5.71 × 10⁻³ mm3/N·m, respectively. The wear rate barely increased with a further increase in SiC content. This was consistent with the 3D morphologies analysis of the wear profiles discussed earlier. Under the same experimental conditions of friction, the pure W showed the deepest wear track depth of 2.50 μm, while the WS05 showed only 0.29 μm, with a substantial decrease in wear track depth. A further increase in the amount of SiC added continued to reduce the wear track depth, but the change was not significant, as shown in Figure 12c. Compared to the depth of the abrasion marks, the width of the abrasion marks changed less. The hardness of the material significantly affected the wear properties of the material [36]. The hardness of W-Si-C composites increased as the SiC content increased, as shown in Figure 10. W5Si3 and W2C are both highly abrasion resistant [37,38]. Wear resistance improvements in the W-Si-C composites were primarily due to the production of in situ ceramic phases and the improved composite hardness as the SiC content increased.
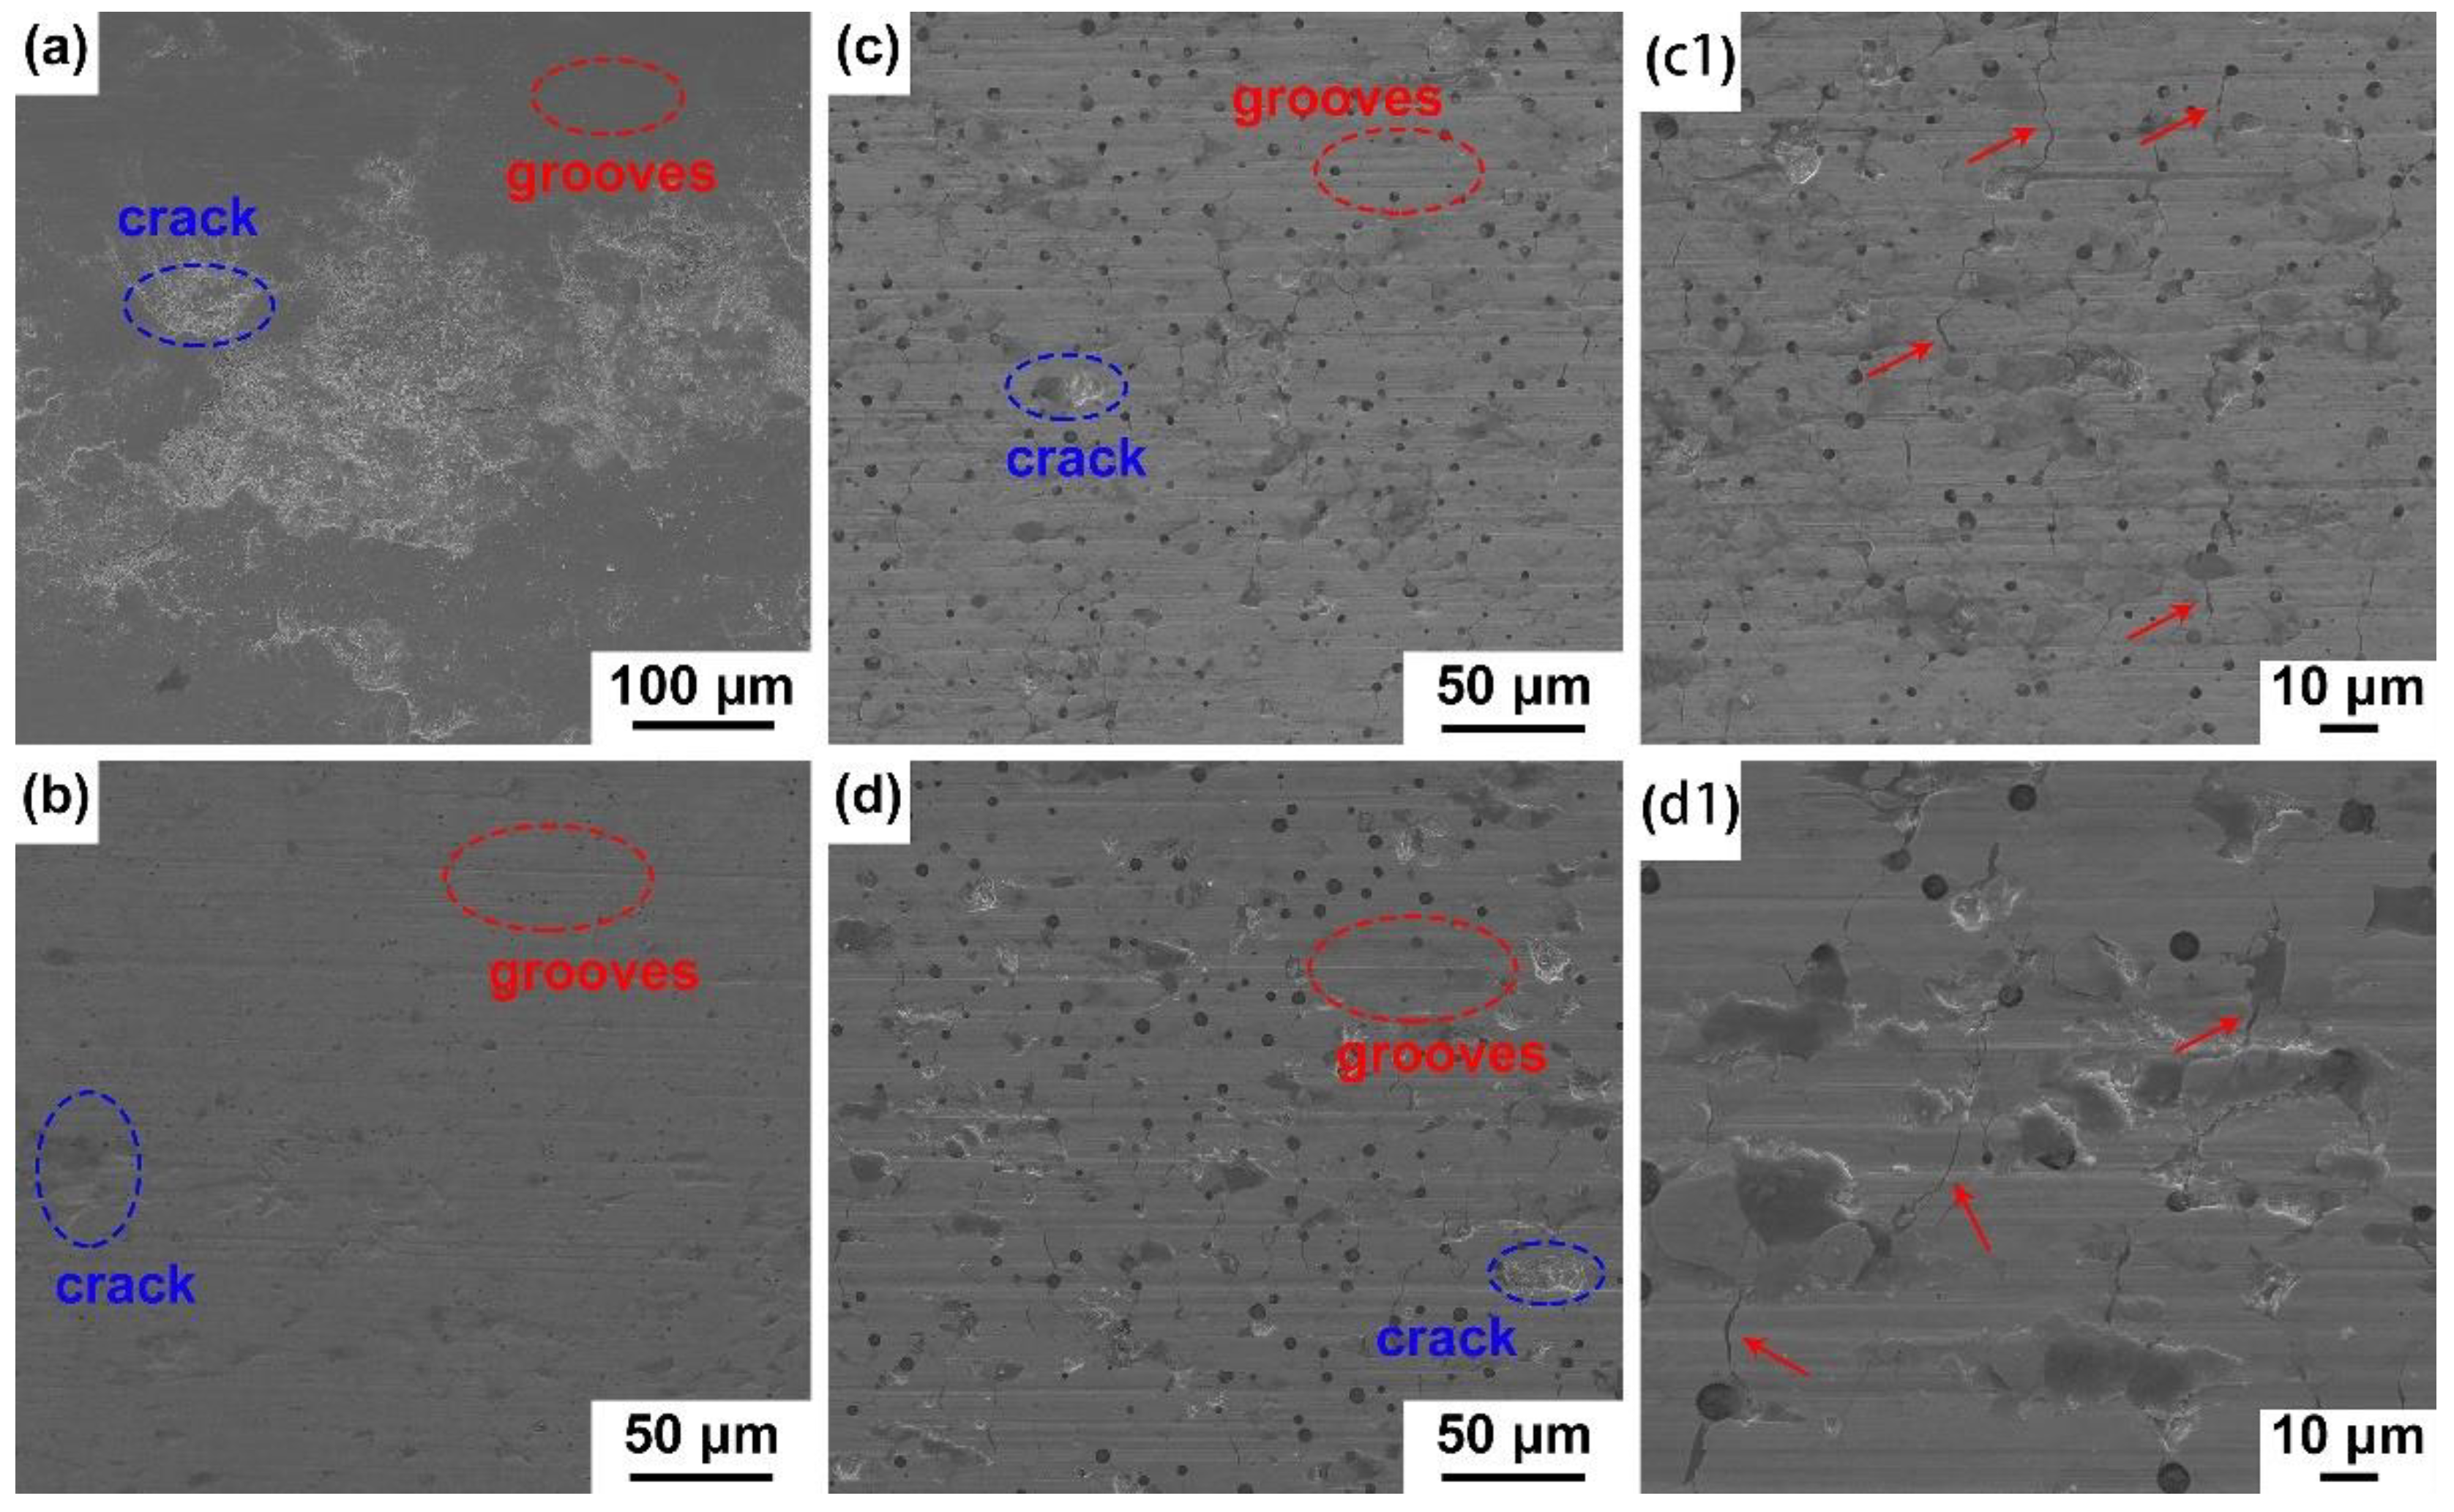
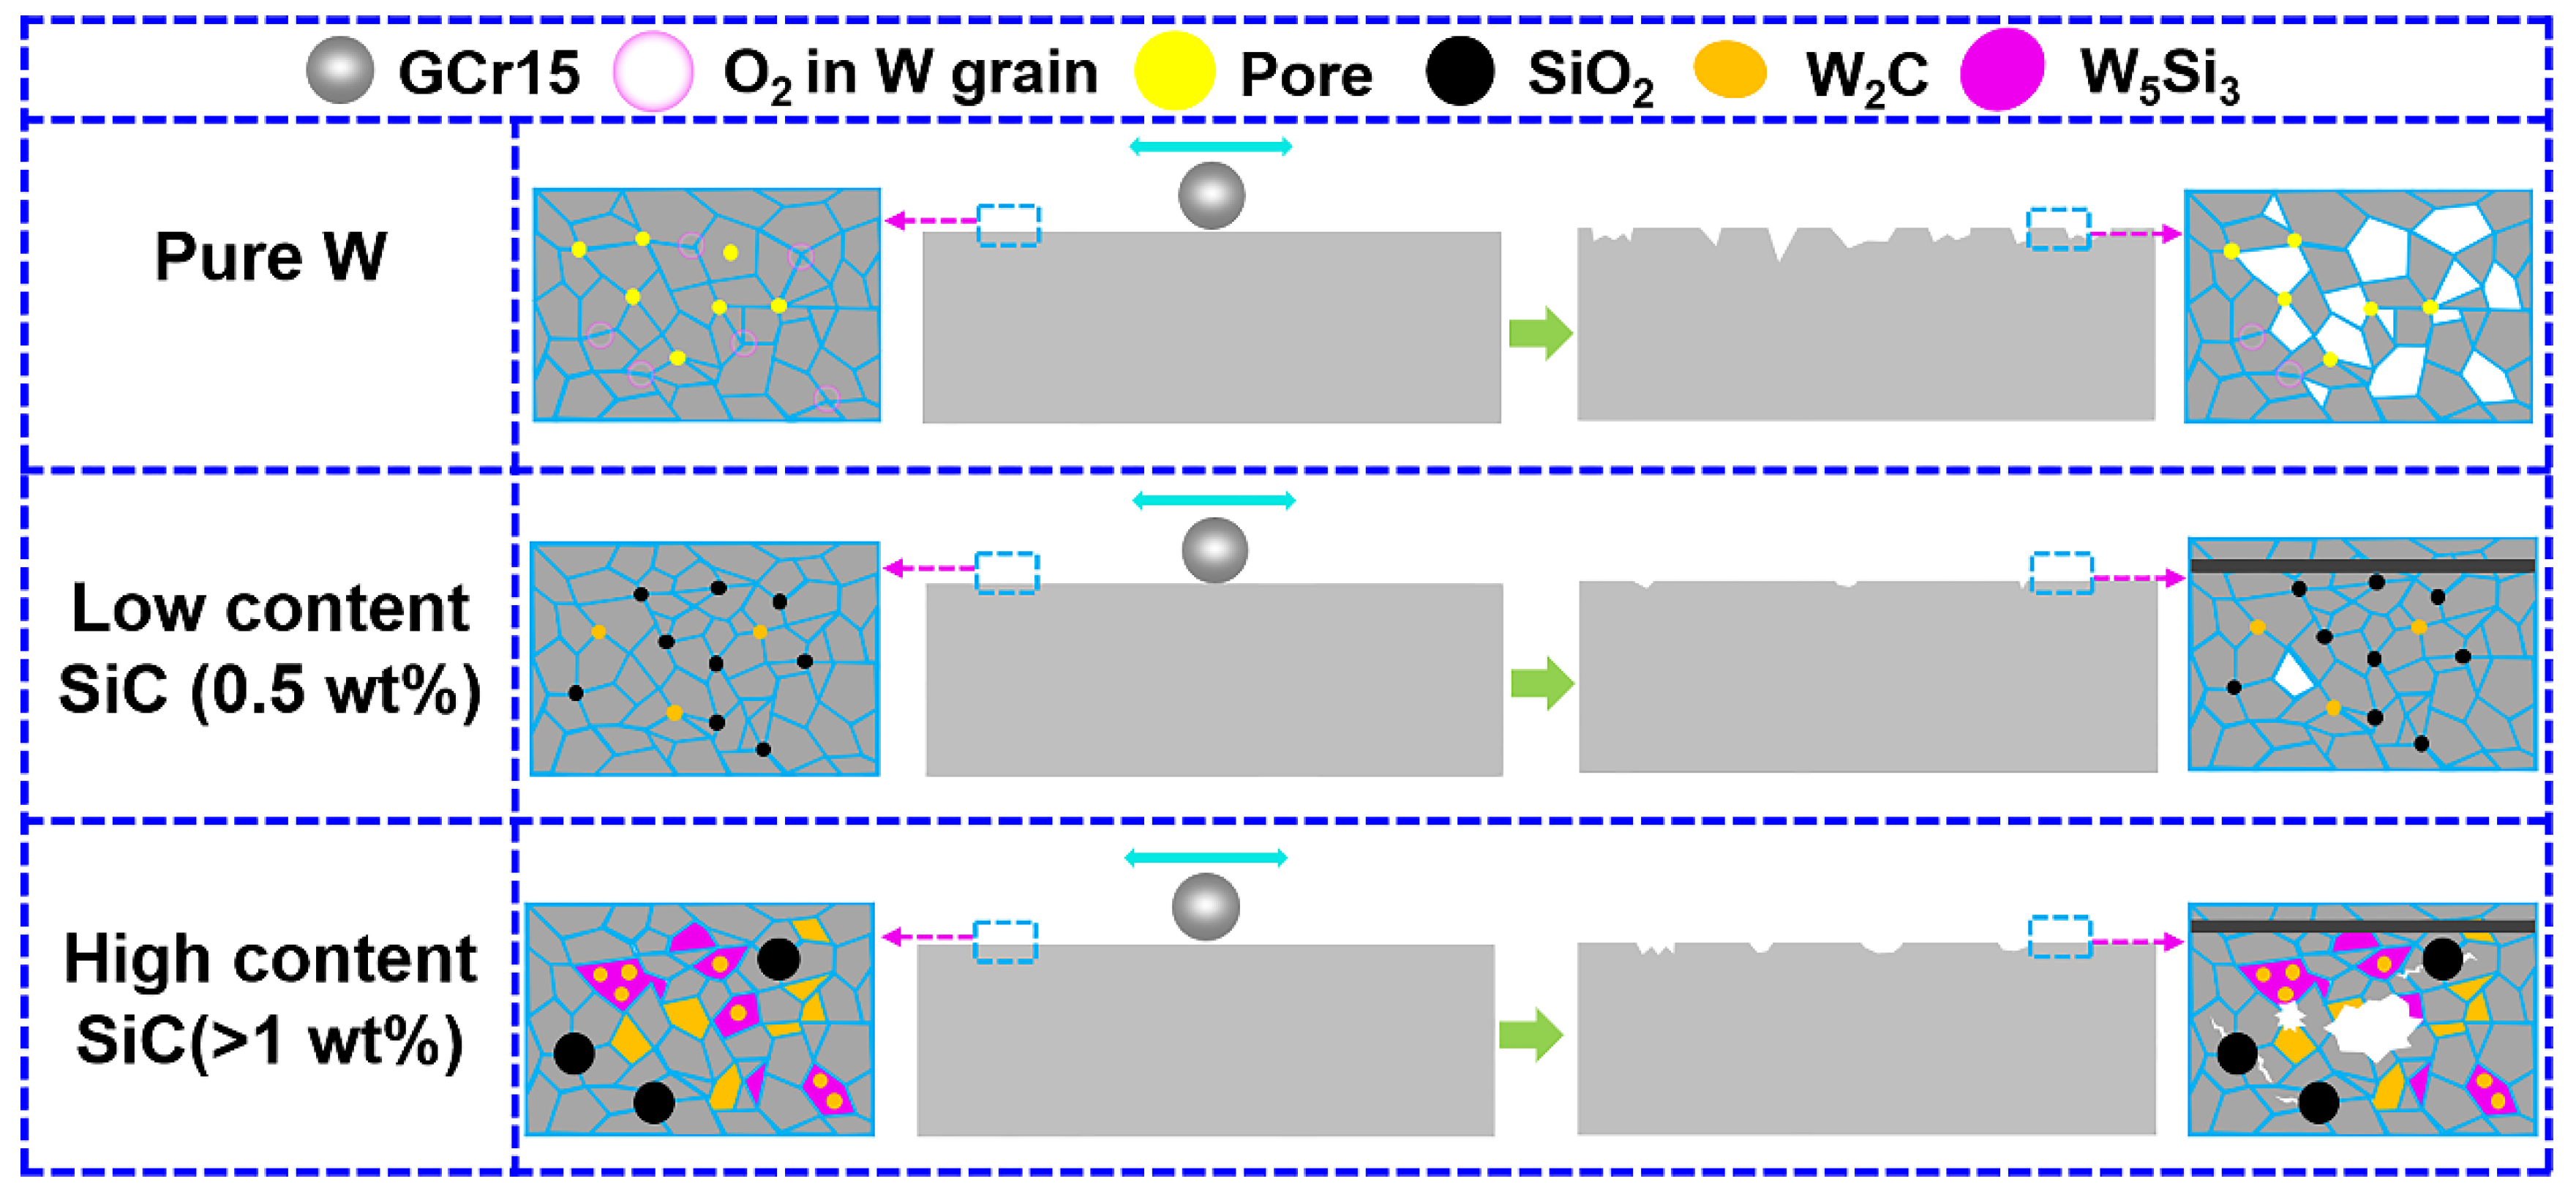
To further analyze the wear mechanism of pure W and W-Si-C composites, SEM was used to investigate wear surfaces. Figure 13a shows the worn surfaces of pure W; a large number of peeling pits on the wear surface can be observed. The matrix material was removed from the surface during the friction and wear process. The severe flaking phenomenon was also seen in other W-based materials during the friction and wear process [39]. This is probably due to the weak bond between the tungsten particles and the eventual separation of the tungsten particles from the substrate under shear stress during prolonged friction and wear, resulting in the formation of peeling pits. The wear of powder metallurgy materials is determined by the number of pores in the sample [40]. As can be seen from Figure 6a, the sintered pure tungsten has high porosity and is not dense, which is one of the reasons why pure tungsten flakes so badly during the friction and wear process. The shallow plowing grooves were also formed during the wear process of pure W. The formation of spalling pits was a typical fatigue wear state. Therefore, fatigue wear is the main wear mechanism of pure W. Lots of plowing grooves were generated during the wear process of WS05, WS1 and WS2, as shown in Figure 13b–d. During prolonged wear, the hard particles eventually break away from the substrate under shear stress, forming abrasive grains that form grooves on the surface. There was a significant reduction in the number of spalling pits during the friction and wear process of WS05. The addition of SiC can absorb the impurity O elements at the W grain boundaries and improve the grain boundary bonding. WS05 has a higher hardness and relative density than pure tungsten. Therefore, the wear resistance of WS05 was significantly improved. The abrasive wear is the main wear mechanism of WS05. As the SiC content increases, a few peeling pits appear. Numerous instances of microcracking in WS1 and WS2 are shown in Figure 13c1,d1. During the wear process, this leads to local stress concentration due to the formation of large SiO2 particles of WS1 and WS2, forming microcracks. The wear mechanism of WS1 and WS2 is abrasive wear and fatigue wear. A diagram of the wear mechanism is shown in Figure 14.

4. Conclusions

Spark plasma sintering was used to prepare pure W and W-Si-C composites in this study. The results show that the addition of SiC had a significant effect on the microstructure, mechanical properties, and wear properties of W-Si-C composites. The following are the main conclusions:
(1)
The SiC reacted with the W matrix to produce in situ W2C and in situ W5Si3. SiO2 can also be formed when SiC reacts with free oxygen, improving grain boundary bonding. The content of in situ ceramic phases increased as SiC content increased. The grain size of SiO2 increases with the addition of SiC.
(2)
Reactive sintering promoted the densification process of W-Si-C composites. The relative density and micro-hardness of W-Si-C composites increased as SiC content increased, with maximum values of 98.12% and 8.40 GPa, respectively. The increase in hardness was due to the increase in the relative density and the reduction in grain size of W-Si-C composites, and the production of ceramic phases.
(3)
The wear resistance of W-Si-C composites was significantly improved with little SiC addition. Pure W and WS05 have wear rates of 313.27 × 10⁻³ mm3/N·m and 5.71 × 10⁻³ mm3/N·m, respectively. The improvement of the wear properties of W-Si-C composites was due to the increase in hardness, the purification and enhancement of grain boundaries and the generation of ceramic phases. The wear mechanisms of pure W and W-Si-C composites were attributed to abrasive wear and fatigue wear.

Author Contributions

Conceptualization, S.H., Y.H., X.Z. and R.W.; methodology, C.W., Y.C., K.K. and Y.H.; software, Y.C.; validation, S.H., K.K., Y.H., X.Z. and R.W.; formal analysis, Y.C.; investigation, Y.C. and K.K.; resources, C.W., Y.H., X.Z. and R.W.; data curation, Y.C. and K.K.; writing—original draft preparation, Y.C.; writing—review and editing, S.H. and K.K.; visualization, Y.C.; supervision, K.K. and G.L.; project administration, C.W. and G.L.; funding acquisition, C.W. and G.L. All authors have read and agreed to the published version of the manuscript.

Funding

This work was supported by the National Key R&D Program of China [2021YFB3802300], the Guangdong Major Project of Basic and Applied Basic Research [2021B0301030001], the National Natural Science Foundation of China [No. 51932006, 52001115], the Chaozhou Branch of Chemistry and Chemical Engineering Guangdong Laboratory [HJL202202A004], the National United Engineering Laboratory for Advanced Bearing Tribology, Henan University of Science and Technology project [No. 202001], financial supports from the Doctorial Foundation of Henan University of Technology [No. 2019BS053], and the postdoctoral research grant of Henan Province [No. 202101008].

Institutional Review Board Statement

Not applicable.

Informed Consent Statement

Not applicable.

Data Availability Statement

The authors confirm that the data supporting the findings of this study are available within the article.

Conflicts of Interest

The authors declare no conflict of interest.

References

  1. Li, Y.; Du, Z.; Fan, J.; Lv, Y.; Lv, Y.; Ye, L.; Li, P. Microstructure and texture evolution in warm-rolled fine-grained tungsten. Int. J. Refract. Met. Hard Mater. 2021, 101, 105690. [Google Scholar] [CrossRef]
  2. Dong, Z.; Liu, N.; Hu, W.; Kong, X.; Ma, Z.; Liu, Y. The effect of Y2O3 on the grain growth and densification of W matrix during low temperature sintering: Experiments and modelling. Mater. Des. 2019, 181, 108080. [Google Scholar] [CrossRef]
  3. Song, G.; Wang, Y.; Zhou, Y. Elevated temperature ablation resistance and thermophysical properties of tungsten matrix composites reinforced with ZrC particles. J. Mater. Sci. 2001, 36, 4625–4631. [Google Scholar] [CrossRef]
  4. Philipps, V. Tungsten as material for plasma-facing components in fusion devices. J. Nucl. Mater. 2011, 415, S2–S9. [Google Scholar] [CrossRef]
  5. Livramento, V.; Nunes, D.; Correia, J.B.; Carvalho, P.A.; Mardolcar, U.; Mateus, R.; Hanada, K.; Shohoji, N.H.; Fernandes, H.; Silva, C.; et al. Tungsten–microdiamond composites for plasma facing components. J. Nucl. Mater. 2011, 416, 45–48. [Google Scholar] [CrossRef]
  6. Dickerson, M.B.; Wurm, P.J.; Schorr, J.R.; Hoffman, W.P.; Wapner, P.G.; Sandhage, K.H. Near net-shape, ultra-high melting, recession-resistant ZrC/W-based rocket nozzle liners via the displacive compensation of porosity (DCP) method. J. Mater. Sci. 2004, 39, 6005–6015. [Google Scholar] [CrossRef]
  7. Rai, R.; De, A.; Bhadeshia, H.K.D.H.; DebRoy, T. Friction stir welding tools. Sci. Technol. Weld. Join. 2011, 16, 325–342. [Google Scholar] [CrossRef]
  8. German, R.M.; Hens, K.F.; Johnson, J.L. Powder metallurgy processing of thermal management materials for microelectronic applications. Int. J. Powder Metall. 1994, 30, 205–215. [Google Scholar]
  9. Chen, Y.; Sun, S.; Zhang, T.; Zhou, X.; Li, S. Effects of post-weld heat treatment on the microstructure and mechanical properties of laser-welded NiTi/304SS joint with Ni filler. Mater. Sci. Eng. A 2020, 771, 138545. [Google Scholar] [CrossRef]
  10. Chen, Y.; Mao, Y.; Lu, W.; He, P. Investigation of welding crack in micro laser welded NiTiNb shape memory alloy and Ti6Al4V alloy dissimilar metals joints. Opt. Laser Technol. 2017, 91, 197–202. [Google Scholar]
  11. Zhu, Z.; Liu, Y.; Gou, G.; Gao, W.; Chen, J. Effect of heat input on interfacial characterization of the butter joint of hot-rolling CP-Ti/Q235 bimetallic sheets by Laser + CMT. Sci. Rep. 2021, 11, 10020. [Google Scholar] [CrossRef] [PubMed]
  12. Tayyebi, M.; Adhami, M.; Karimi, A.; Rahmatabadi, D.; Alizadeh, M.; Hashemi, R. Effects of strain accumulation and annealing on interfacial microstructure and grain structure (Mg and Al3Mg2 layers) of Al/Cu/Mg multilayered composite fabricated by ARB process. J. Mater. Res. Technol. 2021, 14, 392–406. [Google Scholar] [CrossRef]
  13. Dong, Z.; Ma, Z.; Dong, J.; Li, C.; Yu, L.; Liu, C.; Liu, Y. The simultaneous improvements of strength and ductility in W–Y2O3 alloy obtained via an alkaline hydrothermal method and subsequent low temperature sintering. Mater. Sci. Eng. A 2020, 784, 139329. [Google Scholar] [CrossRef]
  14. Kurishita, H.; Arakawa, H.; Matsuo, S.; Sakamoto, T.; Kobayashi, S.; Nakai, K.; Pintsuk, G.; Linke, J.; Tsurekawa, S.; Yardley, V.; et al. Development of nanostructured tungsten based materials resistant to recrystallization and/or radiation induced embrittlement. Mater. Trans. 2013, 54, 456–465. [Google Scholar] [CrossRef]
  15. Zhang, S.; Wen, Y.; Zhang, H. Low temperature preparation of tungsten nanoparticles from molten salt. Powder Technol. 2014, 253, 464–466. [Google Scholar] [CrossRef]
  16. Wurster, S.; Motz, C.; Romaner, L.; Ambrosch-Draxl, C.; Pippan, R. Dislocation-core symmetry and slip planes in tungsten alloys: Ab initio calculations and microcantilever bending experiments. Acta Mater. 2012, 60, 748–758. [Google Scholar]
  17. Gröger, R.; Bailey, A.; Vitek, V. Multiscale modeling of plastic deformation of molybdenum and tungsten: I. Atomistic studies of the core structure and glide of 1/2< 1 1 1> screw dislocations at 0 K. Acta Mater. 2008, 56, 5401–5411. [Google Scholar]
  18. Gludovatz, B.; Wurster, S.; Weingärtner, T.; Hoffmann, A.; Pippan, R. Influence of impurities on the fracture behaviour of tungsten. Philos. Mag. 2011, 91, 3006–3020. [Google Scholar] [CrossRef]
  19. Liu, K.; Gu, D.; Guo, M.; Sun, J. Effects of processing parameters on densification behavior, microstructure evolution and mechanical properties of W–Ti alloy fabricated by laser powder bed fusion. Mater. Sci. Eng. A 2022, 829, 142177. [Google Scholar] [CrossRef]
  20. Cheng, X.; Jing, K.; Xie, Z.; Liu, R.; Wu, X.; Wang, X.; Fang, Q.; Liu, C. Microstructure and mechanical properties of in-situ formed ZrC nanoparticles dispersion-strengthened tungsten alloy. Int. J. Refract. Met. Hard Mater. 2022, 107, 105912. [Google Scholar] [CrossRef]
  21. Zhao, B.; Xie, Z.; Liu, R.; Wang, H.; Wang, M.; Zhang, L.; Gao, R.; Wu, X.; Hao, T.; Fang, Q.; et al. Fabrication of an ultrafine-grained W-ZrC-Re alloy with high thermal stability. Fusion Eng. Des. 2021, 164, 112208. [Google Scholar] [CrossRef]
  22. Zhang, J.; Ma, S.; Zhu, J.; Kang, K.; Luo, G.; Wu, C.; Shen, Q.; Zhang, L. Microstructure and compression strength of W/HfC composites synthesized by plasma activated sintering. Met. Mater. Int. 2019, 25, 416–424. [Google Scholar] [CrossRef]
  23. Li, Y.; Fan, J.; Han, Y.; Cheng, H.; Ye, L.; Du, Z.; Li, Y. The effects of SiC addition on the sintering densification, phases, microstructure and mechanical properties of W. Int. J. Refract. Met. Hard Mater. 2021, 98, 105528. [Google Scholar] [CrossRef]
  24. Park, S.H.C.; Sato, Y.S.; Kokawa, H.; Okamoto, K.; Hirano, S.; Inagaki, M. Boride formation induced by pcBN tool wear in friction-stir-welded stainless steels. Metall. Mater. Trans. A 2009, 40, 625–636. [Google Scholar] [CrossRef]
  25. Wang, J.; Su, J.; Mishra, R.S.; Xu, R.; Baumann, J.A. Tool wear mechanisms in friction stir welding of Ti–6Al–4V alloy. Wear 2014, 321, 25–32. [Google Scholar] [CrossRef]
  26. Kang, K.; Zhang, L.; Luo, G.; Zhang, J.; Tu, R.; Wu, C.; Shen, Q. Microstructural evolution and mechanical behavior of W-Si-C multi-phase composite prepared by arc-melting. Mater. Sci. Eng. A 2018, 712, 28–36. [Google Scholar] [CrossRef]
  27. Lee, D.; Park, H.; Ryu, H.; Jeon, S.; Hong, S. Microstructure and mechanical properties of SiC-nanowire-augmented tungsten composites. J. Alloys Compd. 2011, 509, 9060–9064. [Google Scholar] [CrossRef]
  28. Coşkun, S.; Öveçoğlu, M.L.; Özkal, B.; Tanoğlu, M. Characterization investigations during mechanical alloying and sintering of W–20 vol% SiC composites. J. Alloys Compd. 2010, 492, 576–584. [Google Scholar] [CrossRef]
  29. Zhang, Z.; Yang, Q.; Yu, Z.; Wang, H.; Zhang, T. Influence of Y2O3 addition on the microstructure of TiC reinforced Ti-based composite coating prepared by laser cladding. Mater. Charact. 2022, 189, 111962. [Google Scholar] [CrossRef]
  30. Li, Y.; Fan, J.; Han, Y.; Lu, Q. SiC as sintering aids: A tactic to remove impurity oxygen and reaction interface structure characterization. Int. J. Refract. Met. Hard Mater. 2021, 100, 105640. [Google Scholar] [CrossRef]
  31. Seng, W.F.; Barnes, P.A. Calculations of tungsten silicide and carbide formation on SiC using the Gibbs free energy. Mater. Sci. Eng. B 2000, 72, 13–18. [Google Scholar] [CrossRef]
  32. Wei, Y.; Chen, Y.; Guo, B.; Zhu, L. The microstructure and mechanical properties of TiC-reinforced W-matrix composites prepared by spark plasma sintering. Int. J. Refract. Met. Hard Mater. 2023, 112, 106158. [Google Scholar] [CrossRef]
  33. Liang, L.; Xu, M.; Chen, Y.; Zhang, T.; Tong, W.; Liu, H.; Wang, H.; Li, H. Effect of welding thermal treatment on the microstructure and mechanical properties of nickel-based superalloy fabricated by selective laser melting. Mater. Sci. Eng. A 2021, 819, 141507. [Google Scholar] [CrossRef]
  34. Huang, L.; Pan, Y.; Zhang, J.; Du, Y.; Zhang, Y.; Zhang, S. Densification, grain growth mechanism and mechanical properties of Mo10Nb refractory targets fabricated by SPS. Int. J. Refract. Met. Hard Mater. 2021, 99, 105575. [Google Scholar] [CrossRef]
  35. Venkateswarlu, K. Influence of the size and morphology of silicon particles on the physical, mechanical and tribological properties of some aluminium-silicon alloys. Mater. Sci. Lett. 1996, 15, 1773–1776. [Google Scholar]
  36. Zhang, F.; Zhao, W.; Zhang, W.; Liao, Z.; Xiang, X.; Gou, H.; Li, Z.; Wei, H.; Wu, X.; Shan, Q. Microstructure, mechanical properties and wear resistance of rare earth doped WC/steel matrix composites: Experimental and calculations. Ceram. Int. 2023, 49, 2638–2647. [Google Scholar] [CrossRef]
  37. Taimatsu, H.; Sugiyama, S.; Kodaira, Y. Synthesis of W2C by reactive hot pressing and its mechanical properties. Mater. Trans. 2008, 49, 1256–1261. [Google Scholar] [CrossRef]
  38. Cai, L.; Wang, H. Microstructure and dry-sliding wear resistance of laser clad tungsten reinforced W5Si3/W2Ni3Si intermetallic coatings. Appl. Surf. Sci. 2004, 235, 501–506. [Google Scholar] [CrossRef]
  39. Huang, Y.; Zhou, X.; Hua, N.; Que, W.; Chen, W. High temperature friction and wear behavior of tungsten–copper alloys. Int. J. Refract. Met. Hard Mater. 2018, 77, 105–112. [Google Scholar] [CrossRef]
  40. Huei-Long, L.; Wun-Hwa, L.; Chan, S.L.-I. Abrasive wear of powder metallurgy Al alloy 6061-SiC particle composites. Wear 1992, 159, 223–231. [Google Scholar] [CrossRef]
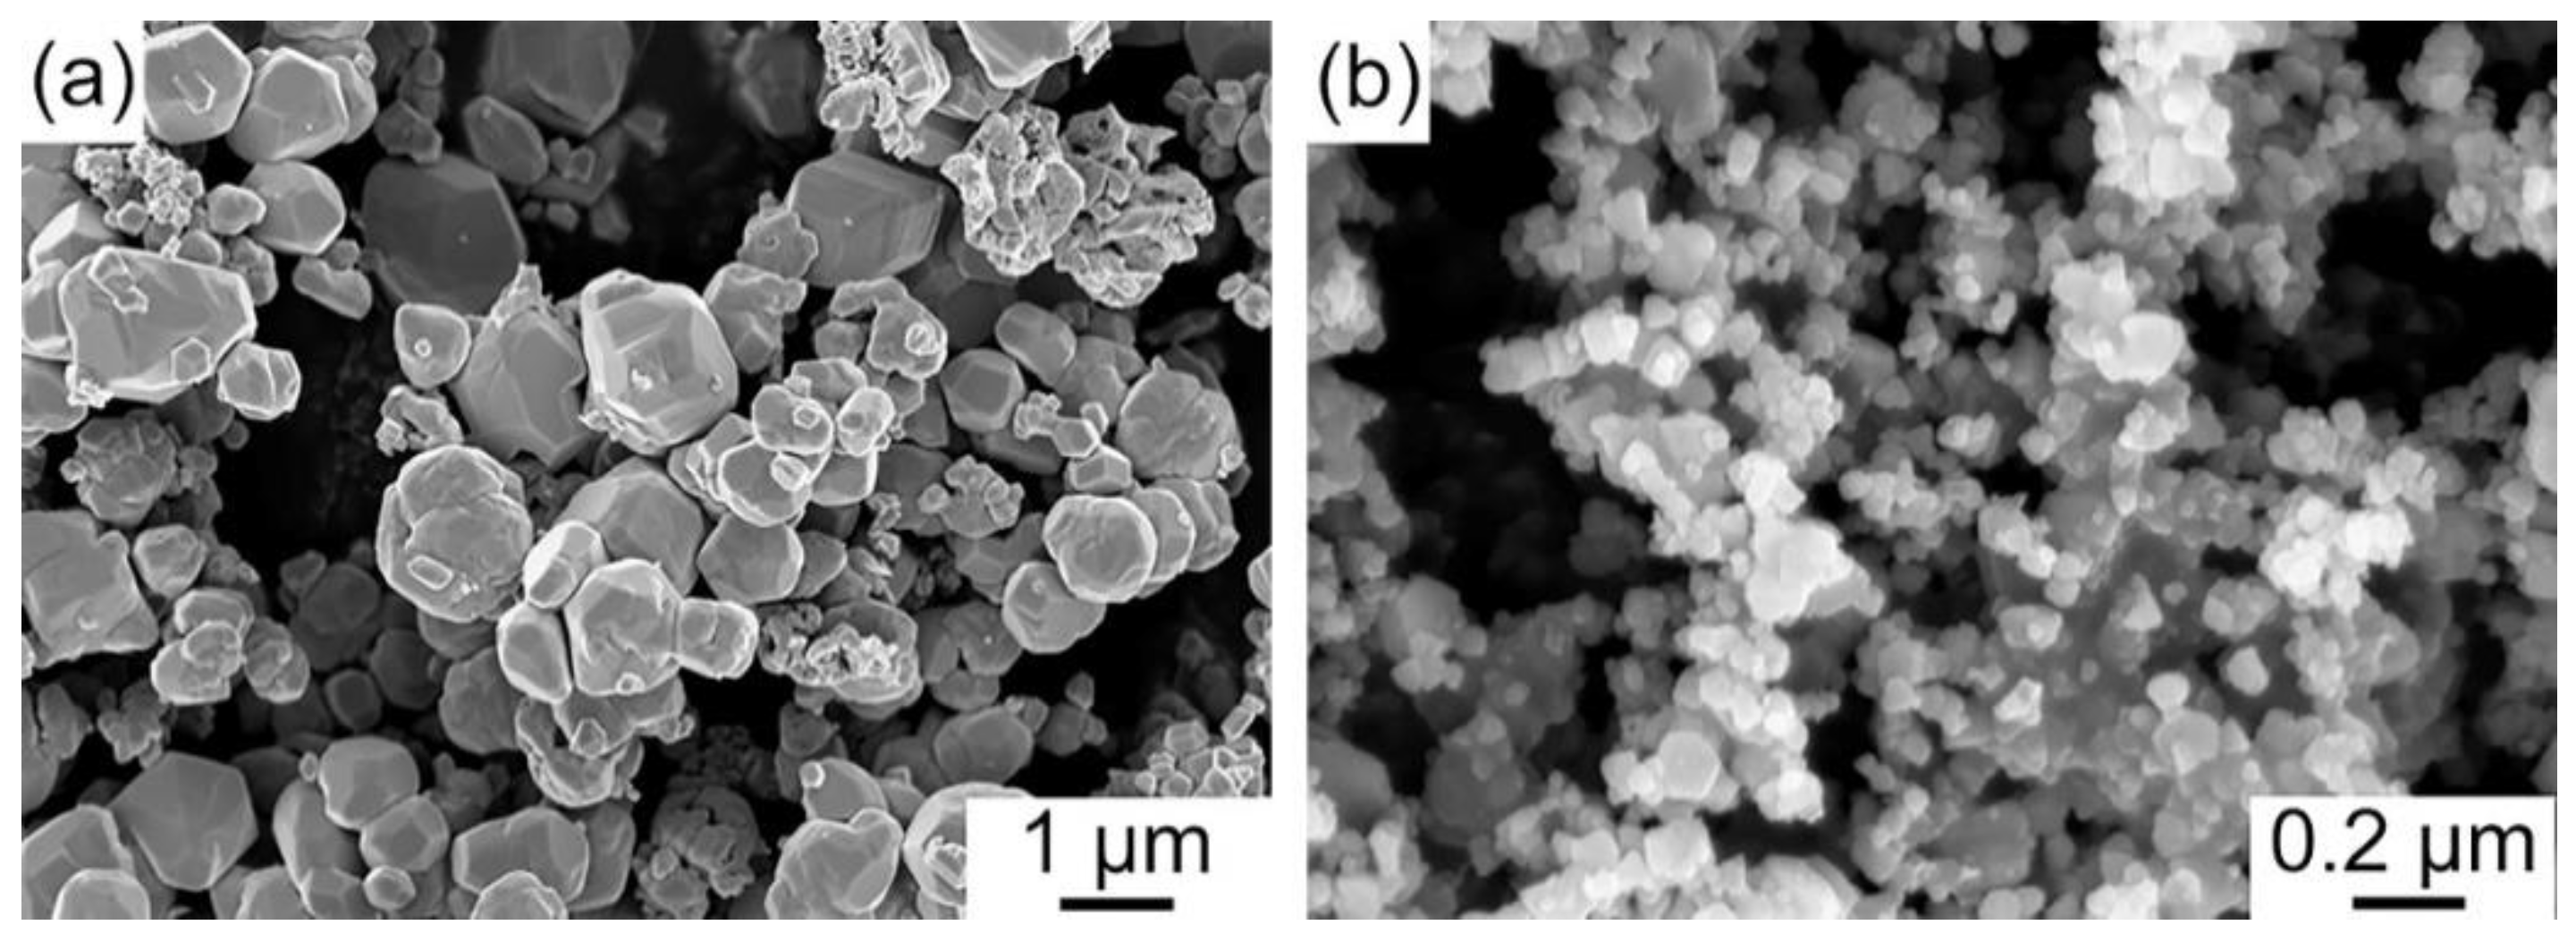
Figure 1. SEM images of the (a) PW powder and (b) SiC powder.
Metals 13 00937 g001
Figure 2. The schematic of preparation of W-Si-C composites.
Metals 13 00937 g002
Figure 3. Sintering process at 1700 °C via SPS.
Metals 13 00937 g003
Figure 4. Schematic diagram of the reciprocating friction and wear tester.
Metals 13 00937 g004
Figure 5. XRD patterns of pure W and W-Si-C composites.
Metals 13 00937 g005
Figure 6. BSE-SEM images of the sintered pure W and W-Si-C composites: (a) PW, (b) WS05, (c) WS1, (d) WS2.
Metals 13 00937 g006
Figure 7. EDS spectra of phase A, phase B and phase C.
Metals 13 00937 g007
Figure 8. EPMA analysis of the WS2 composite: (a) morphology of WS2 composite, (b) the distribution of W, (c) the distribution of Si, (d) the distribution of C, (e) the distribution of O.
Metals 13 00937 g008
Figure 9. The average grain size and relative density of PW and W-Si-C composites.
Metals 13 00937 g009
Figure 10. Vickers hardness of PW and W-Si-C composites.
Metals 13 00937 g010
Figure 11. The 3D morphologies of wear tracks of PW and W-Si-C composites: (a) PW, (b) WS05, (c) WS1, (d) WS2.
Metals 13 00937 g011
Figure 12. Tribological properties of PW and W-Si-C composites: (a) the coefficient of friction curves, (b) wear rate, (c) cross-sectional profile of wear tracks, (d) width and depth of wear tracks.
Metals 13 00937 g012
Figure 13. SEM image of the worn surfaces of pure W and W-Si-C composites after sliding tests: (a) pure W, (b) WS05, (c) and (c1) WS1, (d) and (d1) WS2.
Metals 13 00937 g013
Figure 14. A diagram of the wear mechanism of pure W and W-Si-C composites.
Metals 13 00937 g014
Table 1. Temperature affects the free energy of Reactions (4) to (7).
Temperature/°C500 70090011001300150017001900
ReactionΔG/kJ⋅mol−1
SiC + 8/3W → 1/3W5Si3 + WC−22.97−25.86−28.81−31.80−34.85−37.96−41.13−44.37
WC + W → W2C15.6913.199.805.670.90−4.43−10.26−16.55
SiC + O2 → SiO2 + C−704.94−671.28−638.21−605.64−573.32−541.24−509.36−478.60
C + 2W → W2C−20.81−22.78−25.68−29.34−33.65−38.51−43.85−49.64
Disclaimer/Publisher’s Note: The statements, opinions and data contained in all publications are solely those of the individual author(s) and contributor(s) and not of MDPI and/or the editor(s). MDPI and/or the editor(s) disclaim responsibility for any injury to people or property resulting from any ideas, methods, instructions or products referred to in the content.