Abstract
The effect of tensile strains on the microstructure of Hadfield steel was studied by transmission electron microscopy (TEM). Stages of the obtained stress–strain curves were observed, and correlated well with the evolution of the dislocation substructure. Based on an analysis of TEM images, quantitative parameters were determined, such as the material volume fractions, in which slip and twinning occurred, as well as twinning, which developed in one, two and three systems. Some transformation mechanisms were reported that caused great hardening of Hadfield steel. In particular, a complex defect substructure formed in a self-organized manner due to the formation of cells, the dislocations retarded by their walls, as well as the deceleration of dislocations on twins and, vice versa, of twins on dislocations. These factors affected both the average and excess local density of dislocations. Additionally, they resulted in elastic stress fields, which manifested themselves in the curvature–torsion gradient of the crystal lattice. A high level of stresses caused by solid-solution strengthening prevented the relaxation of elastic ones, contributing to the strain hardening of the Hadfield steel.
1. Introduction
Hadfield steel possesses a good combination of strength, ductility and tribological properties [1,2,3]. Hence, it is widely applied as a structural material in a variety of industries for the manufacture of armor products, hammers of crushing and grinding machines, teeth of excavator buckets, railroad turnouts, etc. Hadfield steel belongs to the austenitic class, characterized by the dominance of one slip system in any orientation within a wide strain range under tensile load [4]. In such cases, microstructural transformations are the subject of a significant number of studies using various methods, including infrared thermography (IRT) [5,6], in situ digital image correlation (DIC) [5,6,7], synchrotron X-ray [8], neutron [9] and X-ray diffraction (XRD) [10,11], electron backscatter diffraction (EBSD) [12,13], as well as transmission electron microscopy (TEM) [14,15,16]. Some mechanisms of its plastic deformation have been described as well [17,18].
Many authors have discussed the reasons for enhancing strength of the Hadfield steel. For example, an increase in hardness from 200 up to 520–600 HB as a result of impact loads has been associated with martensitic transformations [3,19]. At the same time, only 0.5–1.5% of martensite has formed of the 110G13L grade at high strains [20], which cannot be a determining factor in enhancing strength, since limiting dislocation density is achieved and deformation twins are formed [19,20]. Another approach to hardening such medium-manganese steels is connected to the formation of the ε phase as a result of shear processes without manganese redistribution via diffusion [21]. An important feature of this process is the formation of new martensite regions, which is not only due to the growth of previously formed martensite lamellae [22,23]. A number of authors have shown that the enhanced hardness of such steels after plastic deformation is mainly caused by the increased density of dislocations, as well as the concentration of twins and stacking faults (SFs) [24,25,26,27]. At the initial deformation stage, twins are located in one shear system, the number of which increases then. The formed martensite region sizes are of the nanoscale and undergo transformation into α-martensite. Its amount depends on the orientation of austenite grains relative to the load direction [25].
Despite the large number of papers that have been devoted to the study of the medium-manganese austenitic grades, there is no generally accepted theory of the hardening of both Hadfield steel and manganese austenite so far. In this regard, an advanced synergistic approach should be noted, which has been actively developed for more than two decades. It is based on the fact that a deformable body is a highly nonequilibrium multilevel system capable of internal self-organization [28,29]. Some authors have reported quite interesting results in the study of different classes of materials and at various scales. For example, a periodic change in the amplitude of increments of local εxx elongations is associated with the mutually self-consistent development of centers of the local εxx elongations, εxy shears and ωz rotations during the deformation of single-crystal Hadfield steel [30].
Based on the analysis of the published data, some specific patterns can be noted that significantly affect both the strength and ductility of Hadfield steel [31]: (1) low-stacking fault energy; (2) variations in the sliding mechanisms for partial and/or full dislocations, as well as deformation twinning with rising strains; (3) changes in the slip mechanisms during the formation of deformation-induced ε-martensite; (4) the presence of several types of the deformation-induced martensitic transformations.
As shown in [28,32], the formation of ordered spatial structures at different scales is observed when an external field is applied to a strongly nonequilibrium open (poly- or single-crystal) system. This process is controlled by the internal characteristics of the crystal and is aimed at dissipating energy input from an environment in order to preserve crystal integrity for as long as possible. Consequently, the formation and successive change in the type of dislocation substructures should be considered a self-organizing process at the microlevel. It should be noted that self-organizing processes are those in which more complex and perfect structures arise [33]. They are possible in systems (1) that are thermodynamically open, (2) in which the emergence and amplification of fluctuations is energetically favorable, (3) that are characterized by positive feedback, (4) that have a sufficient amount of interaction between external factors that must be accumulated and enhanced by themselves and (5) that possess a sufficient number of interacting elements [31,33]. Hence, all these conditions are met by the deformation processes occurring in Hadfield steel. Therefore, it is of interest to relate changes in its microstructure during deformation with such self-organization processes.
The aim of the present study was to reveal a relationship between self-organization processes in a defect substructure in the deformed Hadfield steel and the evolution of both dislocations and twins.
2. Materials and Methods
The study was performed using plates of Hadfield steel (Fe-13%Mn-(1.0–1.3)%C (wt.%) of the 110G13 grade according the Russian classification), quenched from a temperature of 1050–1100 °C. The plate dimensions were 140 × 15 × 1.5 mm.
The plates were deformed with an ‘Instron’ uniaxial tension machine at a strain rate of 10–3 s–1. Based on the obtained data, both true stresses and true strains were assessed using the σtrue = (1 + ε)σ and εtrue = ln(1 + ε) ratios, where σ is engineering stress and ε is engineering strain [34]. The θ = dσtrue/dεtrue strain hardening coefficient was determined as a result of differentiation of the stress–strain curve in the ‘σtrue–εtrue’ coordinates.
For TEM examinations with an ‘EM-125′ microscope (Sumy Plant of electron microscopes, Sumy, Ukraine), foils were fabricated from the deformed Hadfield steel plates via the electric spark method and subsequent electropolishing. The dislocation substructure was investigated by analyzing the obtained TEM images, for which quantitative description was carried out by measuring the following parameters: both scalar and excess dislocation densities, the density of deformation twins, and the sizes of dislocation cells in the substructure.
Strains were calculated using the following formula:
where is the sample length change and is the initial sample length.
The samples were strained up to 2, 5, 10, 14, 20, 28, and 36%. Before that, a reference row of diamond pyramid imprints had been preliminarily applied on the polished sample surface with a step of 50 μm. At each strain value, a change in the distance between the reference points was assessed.
The scalar dislocation density was determined via the secant method with a correction for the invisibility of dislocations [35]. A rectangular grid was used as a test line. Then, the scalar density of dislocations was calculated using TEM images using the following formula:
where M is the micrograph magnification, and n1 and n2 are the number of intersections of the l1 horizontal and l2 vertical lines by dislocations, respectively. At high strains, the density of dislocations was great, so the TEM images were used with a direct magnification in the microscope column of at least 40,000.
The ρ± excess dislocation density was measured locally via the misorientation gradient [35]:
where b is the Burgers vector of dislocations and is the foil curvature gradient or the χ lattice curvature, which is explained below. The χ values were determined by shifting the extinction contour at the controlled foil tilt angle in the microscope column using a goniometer. In this case, it was required that the effective reflection vector was perpendicular to the goniometer tilt axis. Otherwise, a recalculation was needed, because the effective reflection plane no longer contained the goniometer inclination axis. The foil cross section, on which the measurement was carried out, had to not contain interface boundaries or misorientations in the contour movement path, i.e., the bending of the foil had to be continuous. In terms of misorientations in the FCC alloys based on nickel, copper, and iron, the contour width was ~1° [35]. This value in combination with the contour width enabled the determination of the misorientation gradient.
The density of deformation microtwins was determined via the secant method [36] (a rectangular grid was used as a test line):
where M is the micrograph magnification and n1 and n2 are the number of intersections of the l1 horizontal and l2 vertical lines by twins, respectively.
The scalar density of dislocations was assessed from the TEM images [35]. According to the theory of dislocations, they were divided into both ρ+, positively charged, and ρ−, negatively charged. The scalar dislocation density was calculated using the following expression:
ρ = ρ+ + ρ−.
The excess dislocation density was calculated as follows:
ρ± = ρ+ − ρ−.
According to [35,36], it was possible to determine the χ lattice curvature, which was related to the ρ± excess dislocation density, as in the following:
where b is the Burgers vector, φ is the angle of inclination of the crystallographic plane, and l is the distance on the plane. The value could be determined either from the S width of the bending extinction contour, or from its displacement when the foil was tilted using a goniometer [35,36]. In this study, the first option was applied.
3. Results
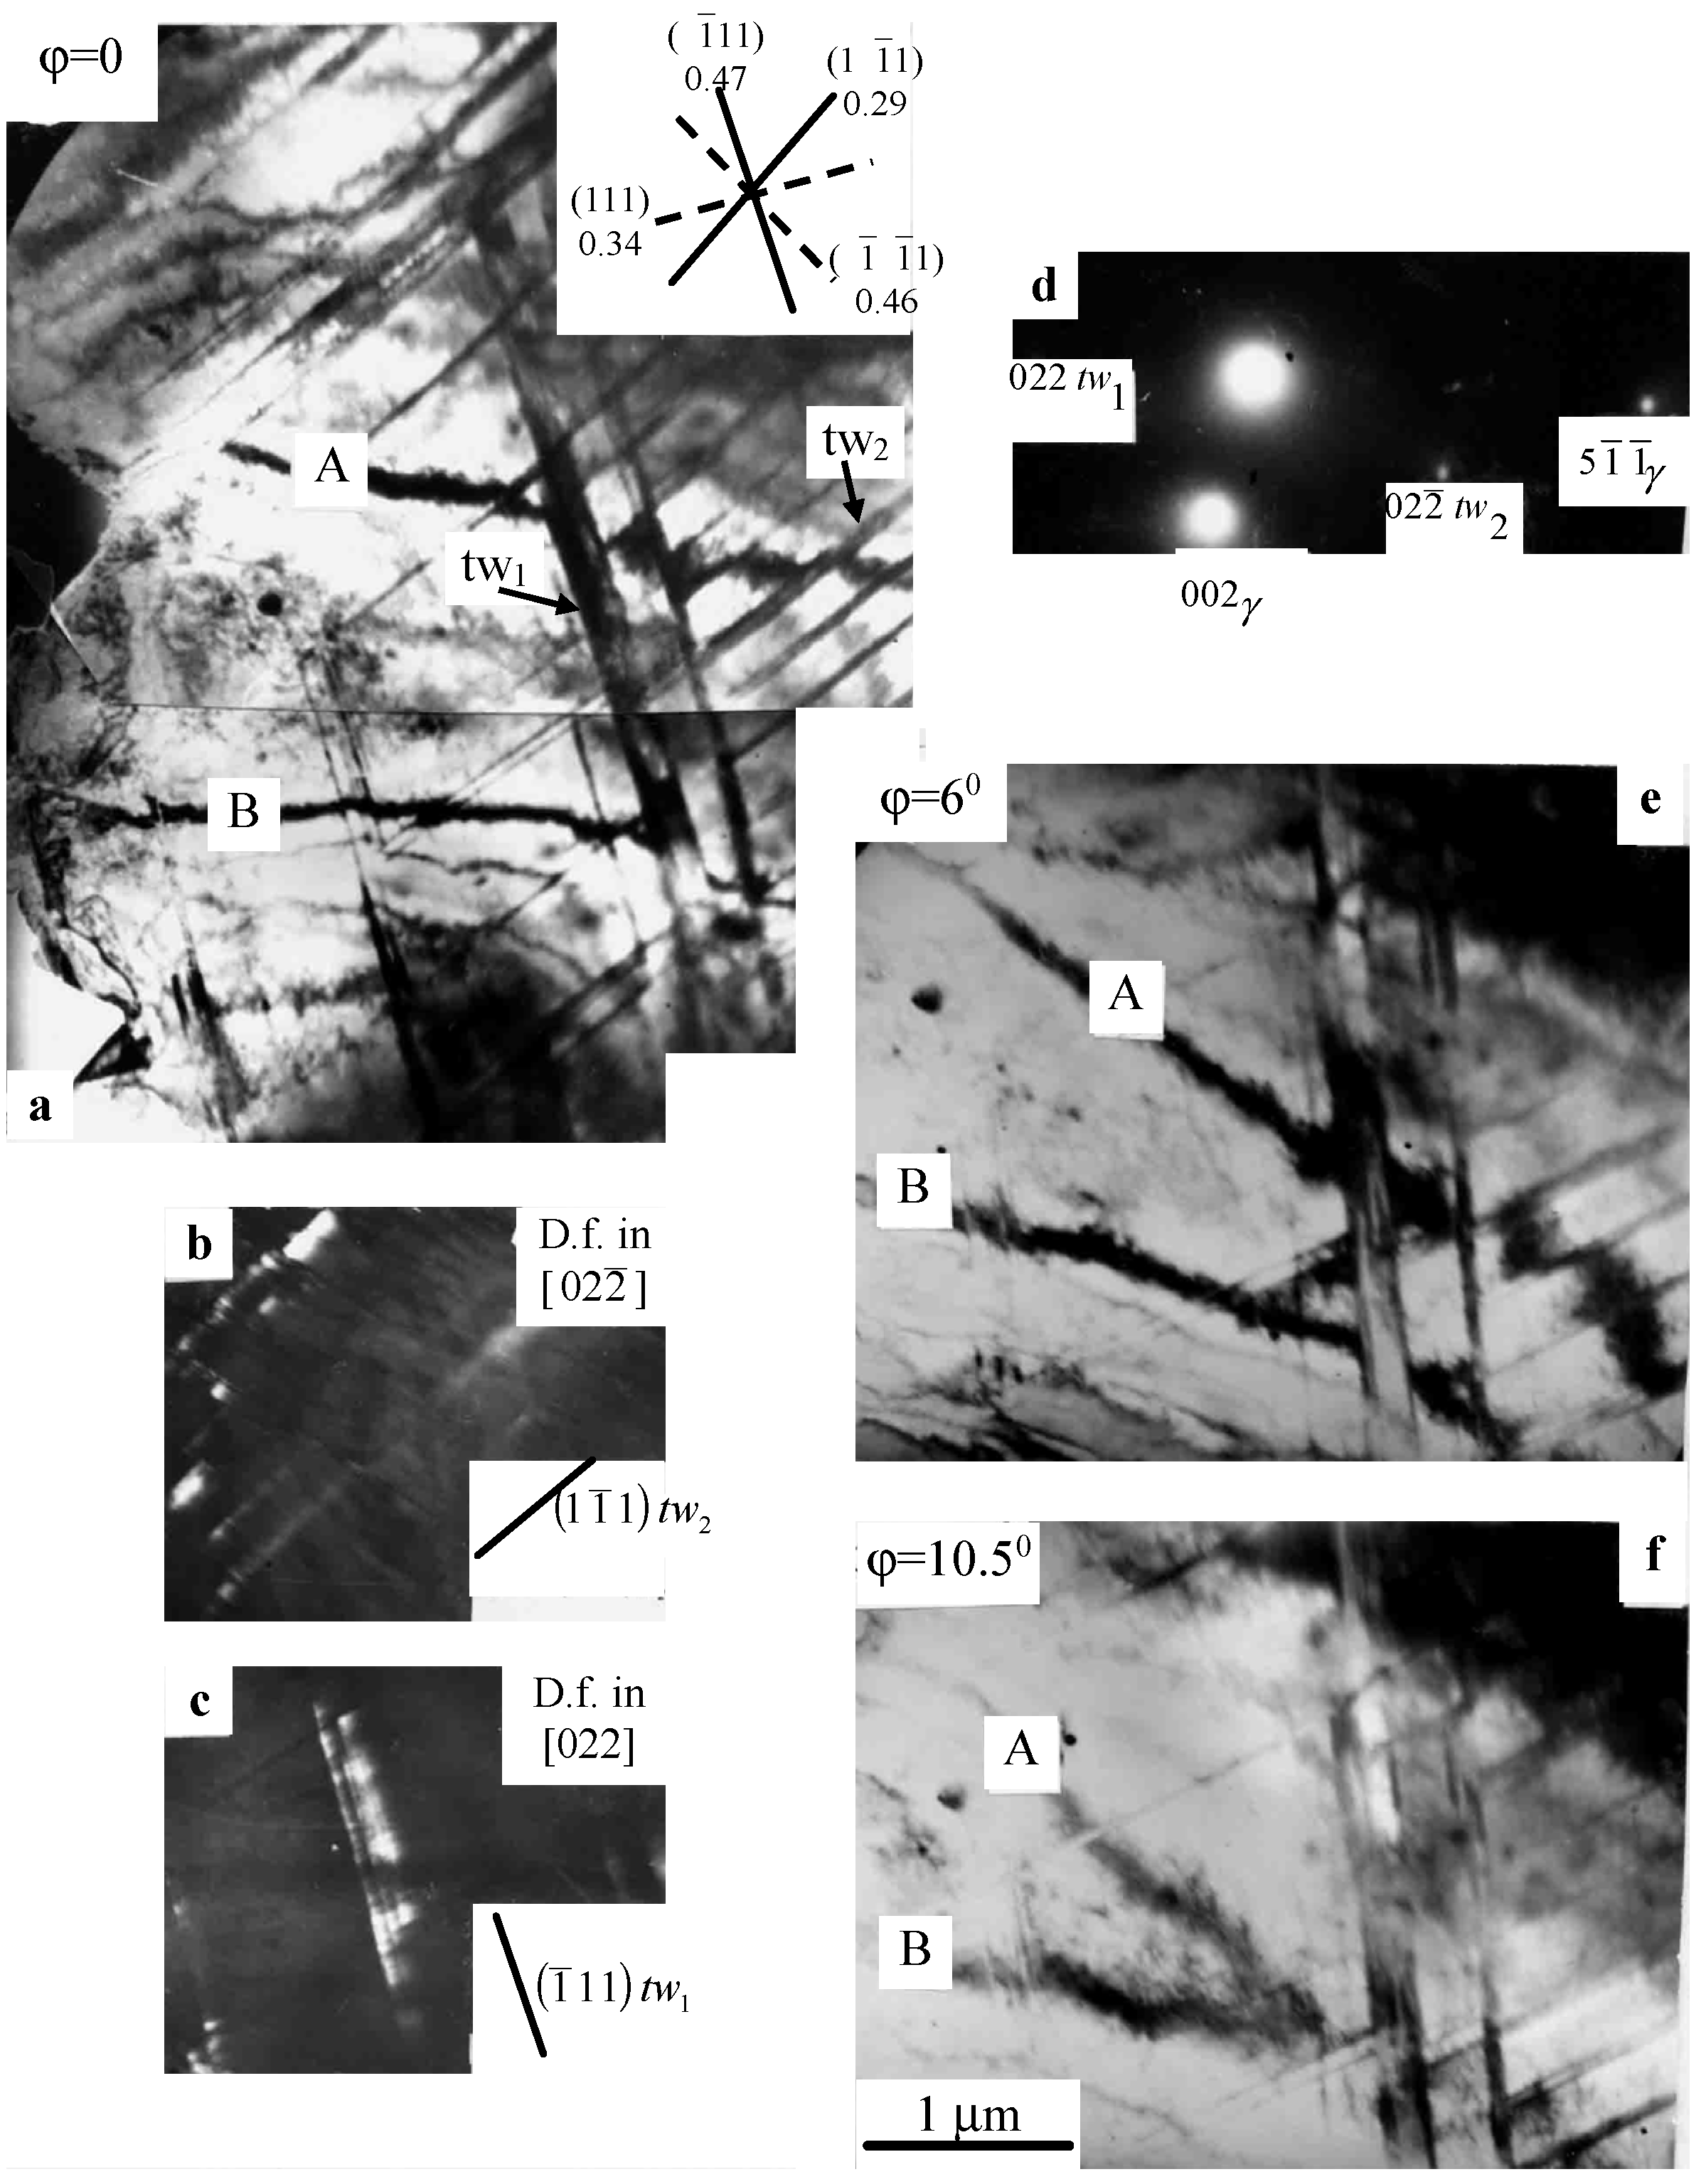
In the Hadfield steel, deformation typically led to the formation of microtwins [27,37], while areas of their initiation and deceleration were the sources of internal stresses. This phenomenon was also confirmed in the present study. In particular, Figure 1 presents an instance of bending near a twin deceleration region at a tensile strain of 13%. According to Figure 1a, twinning in a grain developed in both ()[] and ()[] systems along the maximum and minimum loaded planes (indicated by solid lines in Figure 1a; the Schmid factor values are also presented). At the intersection of these systems of microtwins, deceleration occurred. As a result, two parallel A and B contours were observed on the TEM image. When the goniometer inclination angle (φ) changed from 0 up to 10.5 degrees, the A [002]γ and B []γ bending contours moved towards each other (Figure 1a,e,f). This meant that the crystal was bent around an axis parallel to the bending contours in the twin deceleration region.
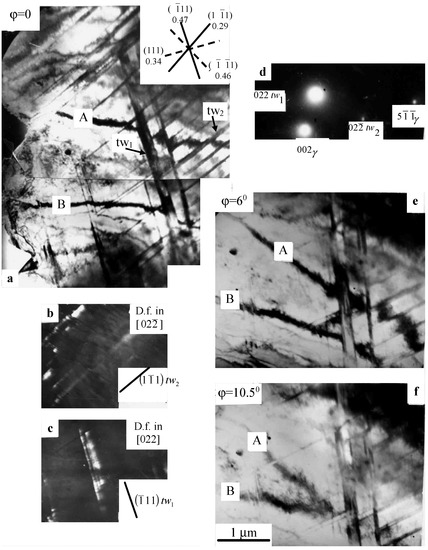
Figure 1.
The crystal lattice bending near the region of deceleration of twins in two systems in the Hadfield steel at the tensile strain of 13%: (a)—bright-field image obtained at the goniometer tilt angle (φ) of 0°; (b)—dark-field image obtained in the reflection of the twin []tw2; (c)—dark-field image obtained in the reflection of the twin [ ]tw1; (d)—microdiffraction pattern of area (a); (e)—bright-field image obtained at the goniometer tilt angle (φ) of 6°; (f)—bright-field image obtained at the goniometer tilt angle (φ) of 10.5°. Tw1 and Tw2 are two intersecting systems of twins; A and B are extinction contours.
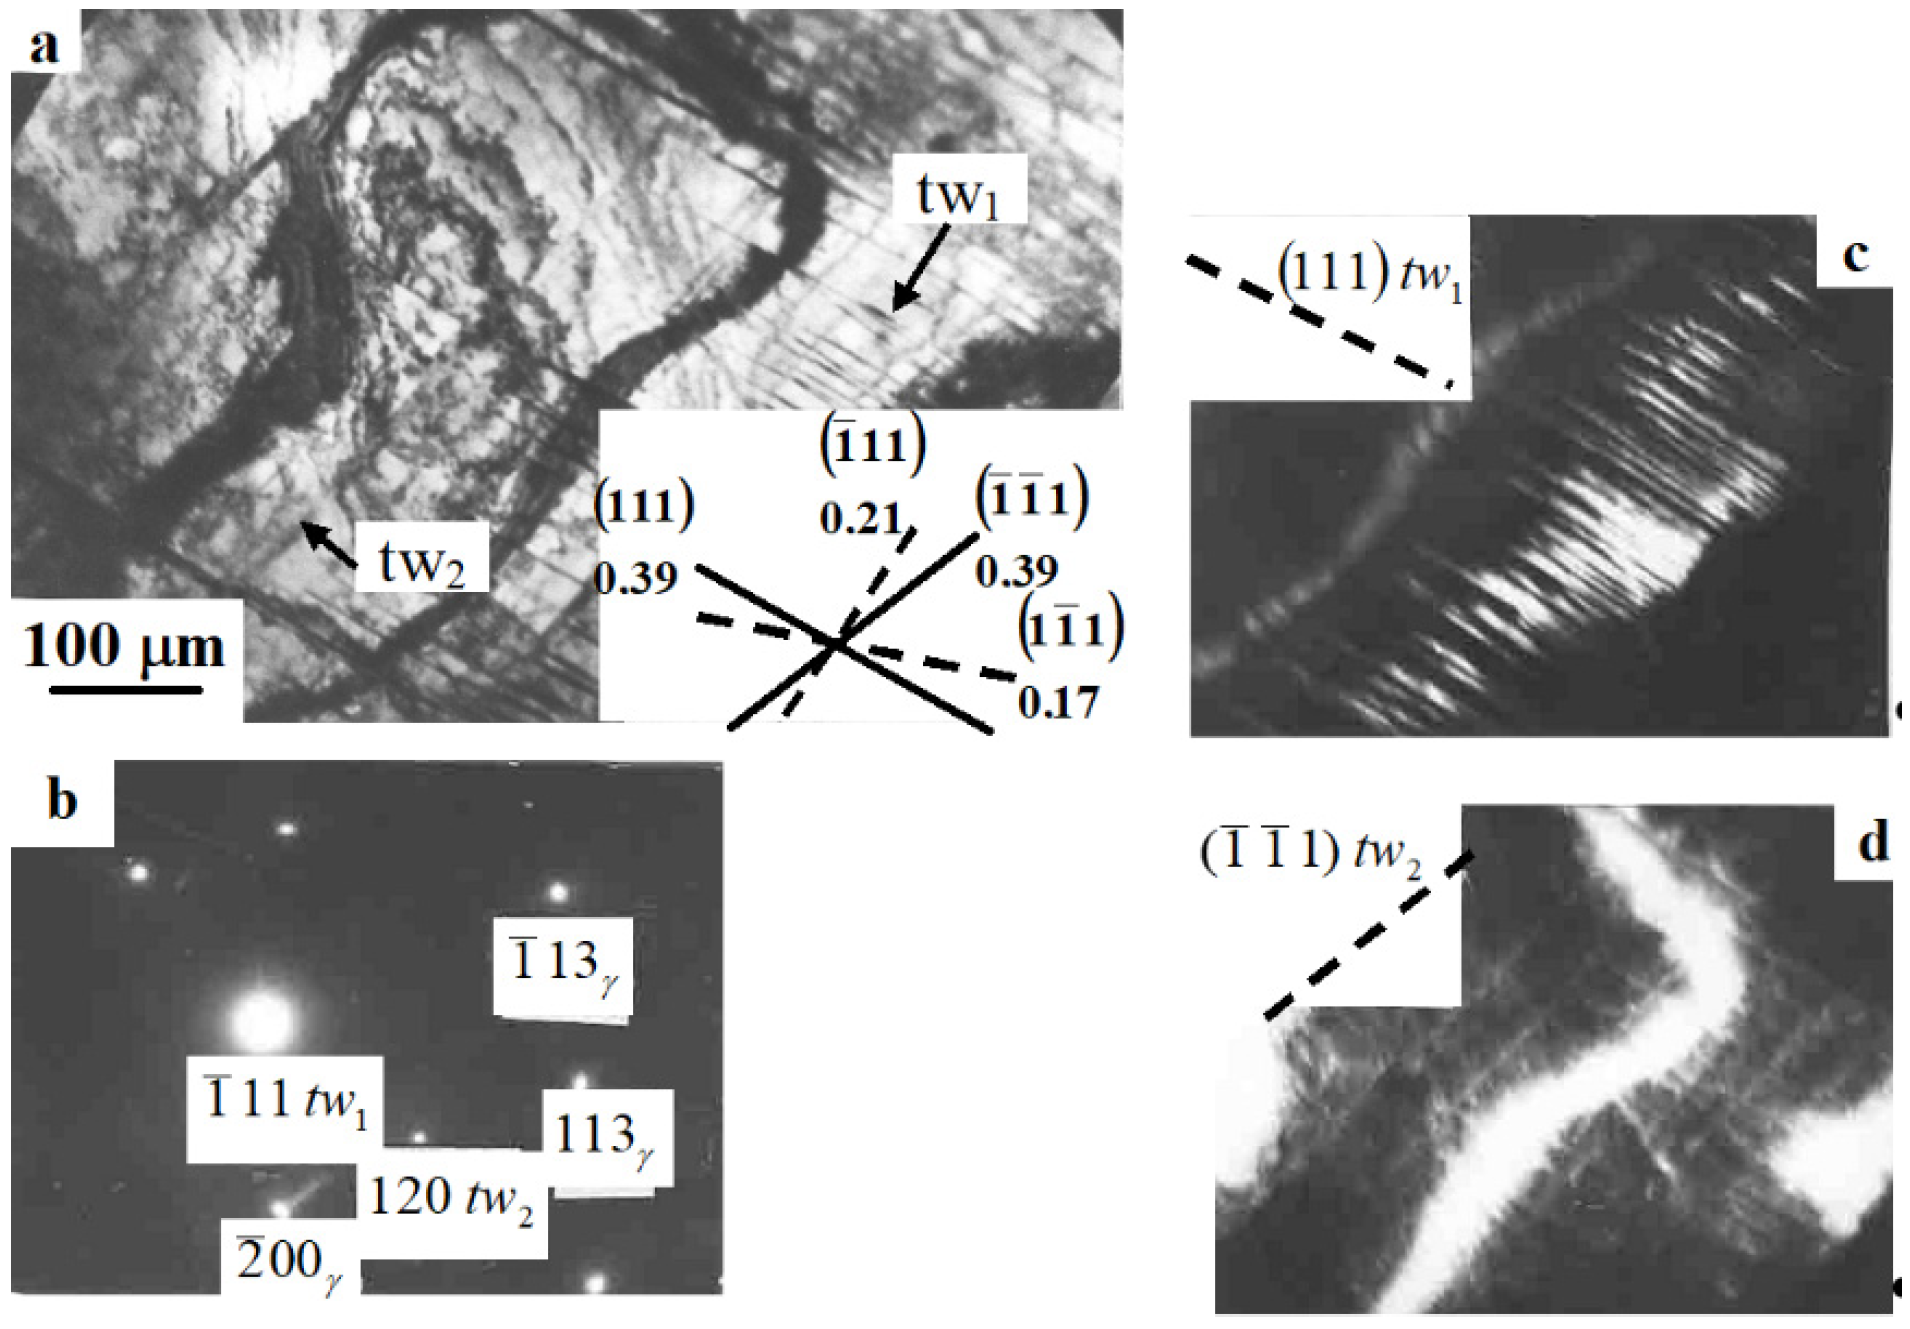
Figure 2 shows another example of complex bending near the twin deceleration region in the Hadfield steel at a tensile strain of 25%. In this case, the result of deceleration was a complex closed loop, in which twinning had developed along two maximally loaded planes. Twins of the (111)[] system had been decelerated by the ()[112] ones. Respectively, a complex pattern of elastic–plastic bending of the crystal lattice arose.
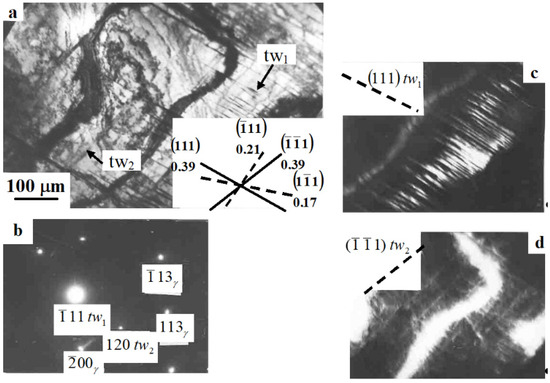
Figure 2.
The crystal lattice bending near the region of deceleration of twins in two systems in the Hadfield steel at the tensile strain of 25%: (a)—bright-field image; (b)—microdiffraction pattern; (c)—dark-field image obtained in the reflection of the []tw1 twin; (d)—dark-field image obtained in the reflection of the [ ]tw2 twin.
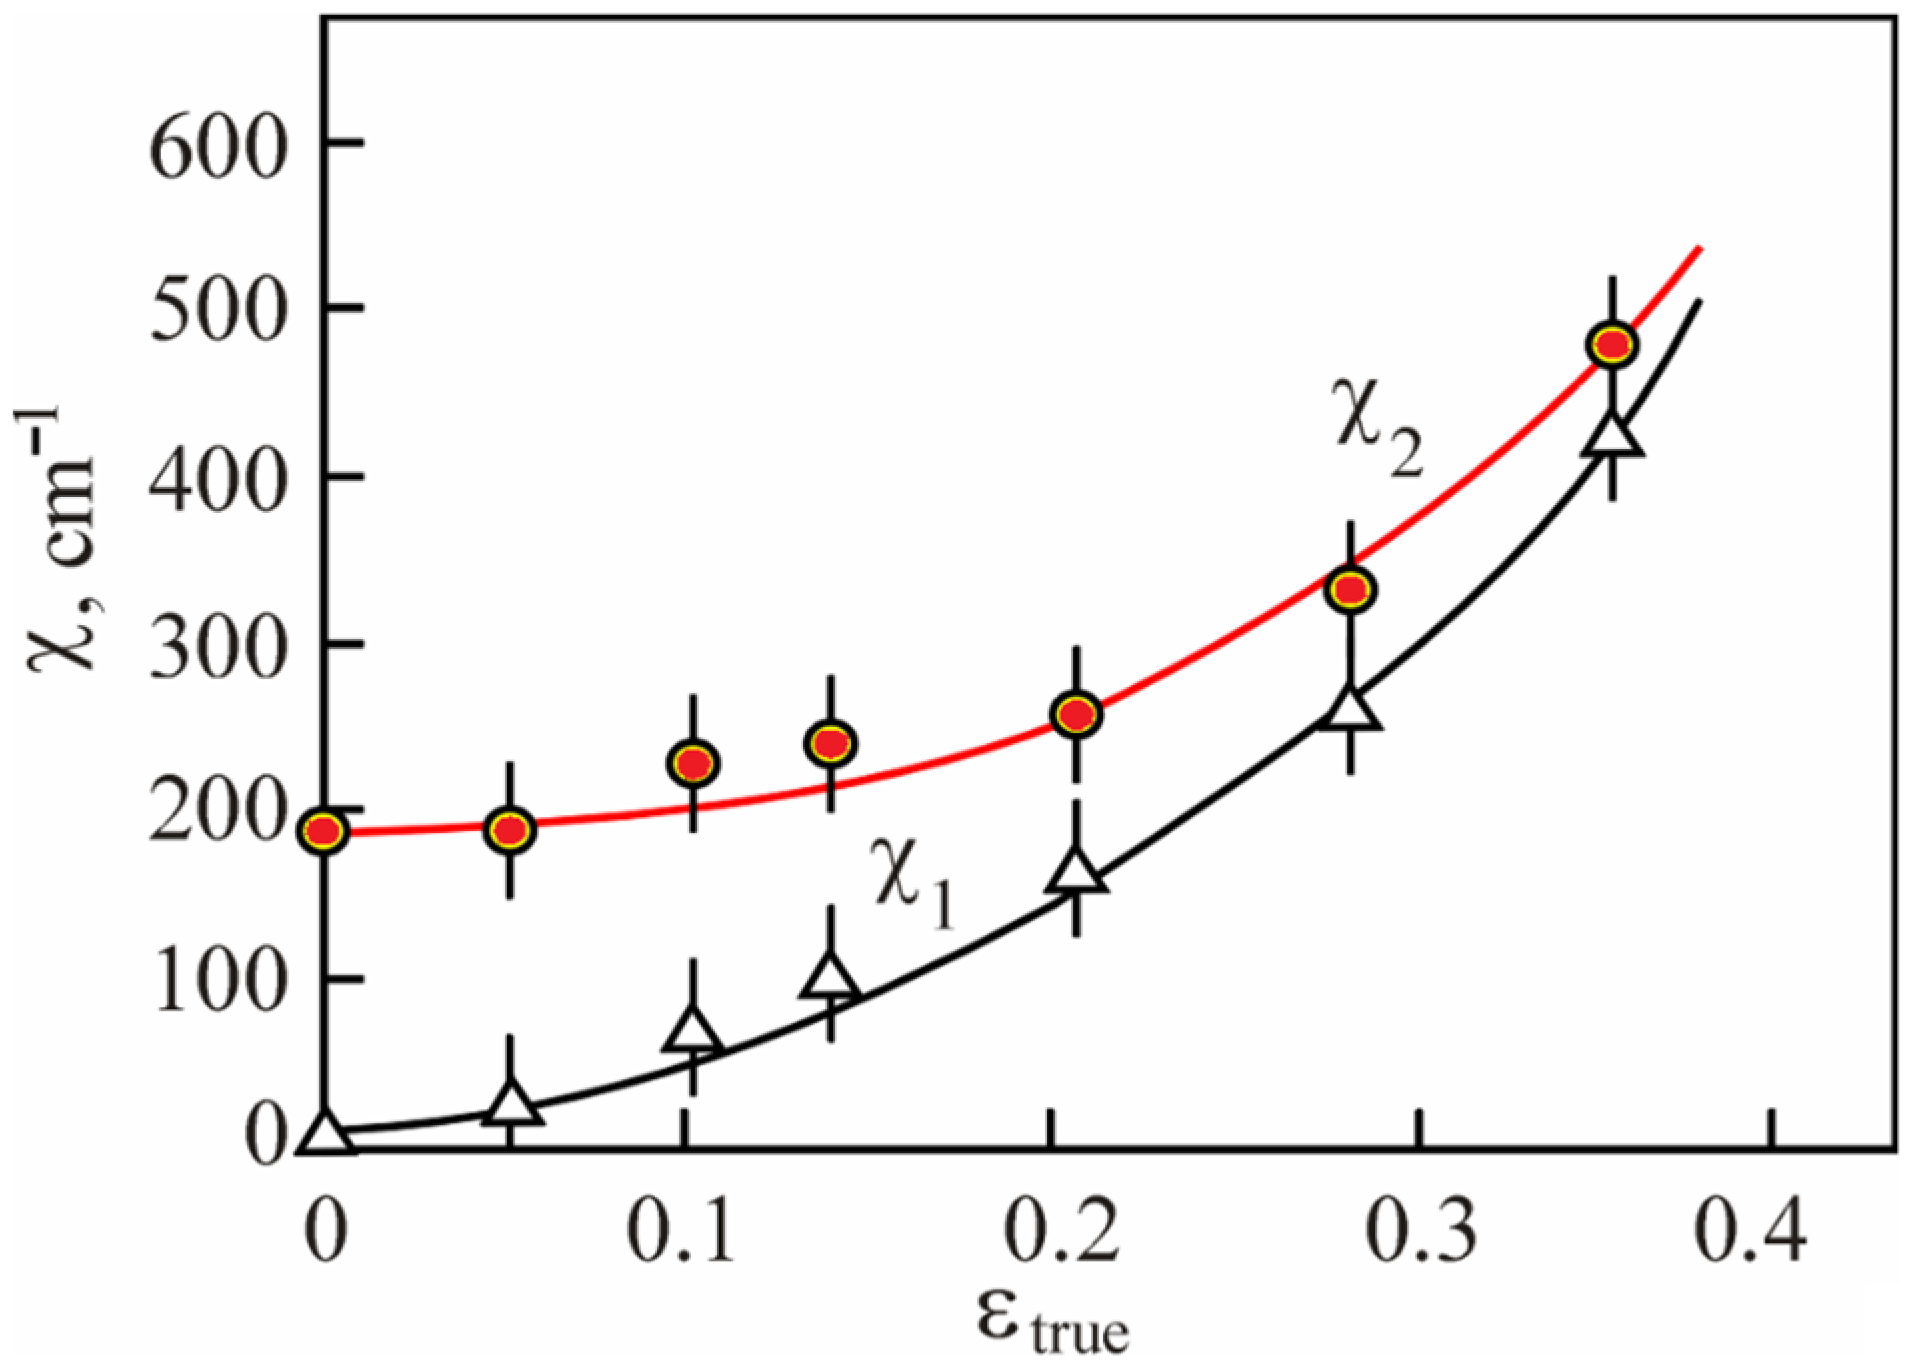
With the development of strains, the curvature–torsion gradient increased in the crystal lattice along the plate. This was reflected in the changing width of the extinction contours along their axis and their curvature. As a result, the contours were bent and the angle of their contact with the deformation twin boundary changed. Preliminary estimated values of the changes in the amplitudes of the curvature–torsion of the crystal lattice, both on average over the plate volume and in regions containing deformation microtwins, depending on the plastic strains, are shown in Figure 3. Based on their analysis, it could be stated that the regions of localization of the largest values of the curvature–torsion amplitude of the crystal lattice were the zones of the nucleation of deformation microtwins. With the rising plastic strain, curves 1 and 2 gradually converge in Figure 3. As noted above, twinning was random through the plate volume in the strain range from 0 up to 5%, so the average χ1 value over the plate volume was low. At εtrue > 5%, twinning developed intensively and the χ1 value increased sharply.
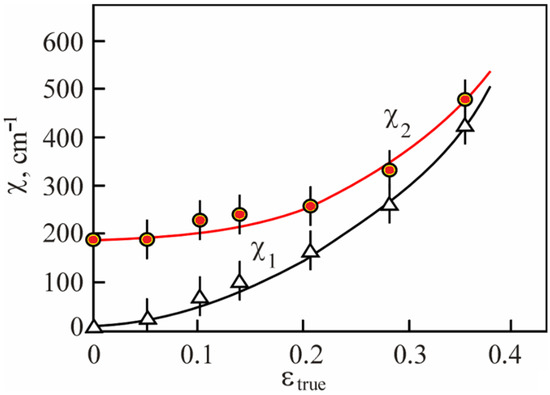
Figure 3.
The effect of the changes in the amplitudes (χ) of the curvature–torsion of the crystal lattice on the εtrue value on average over the plate volume (1) and in the regions of deformation microtwins (2) in the Hadfield steel.
As it was found in [27] based on the results of TEM investigations, the fraction of the Hadfield steel volume, in which intense twinning occurred, increased with rising tensile strains. In this case, twinning developed most intensively in the strain (ε) interval of 5–20%. In this study, the TEM images in Figure 1 and Figure 2 showed that mutually intersecting systems of microtwins could be present in one grain. An important feature of the material response to rising tensile strain was the enhancement in the proportion of the material which included two or even three systems of twins, as well as the tendency to form packets from microtwins. At the same time, the number of microtwins per package increased with the rising tensile strain (from 3–4 at ε~10% up to 6–8 at ε~20%). Finally, almost the entire plate volume was covered by twinning at ε~36%. As a result, both amplitudes of the curvature–torsion of the crystal lattice, namely the χ1 averaged over the plate volume and the χ2 value in the deformation microtwin regions, actually coincided; i.e., χ1~χ2 according to Figure 3.
4. Discussion
4.1. The ‘σ–ε’ and ‘θ–ε’ Dependences
It was found for all metals, alloys and steels, that the ‘σ–ε’ dependences in the plastic strain region possessed stages differing in the strain hardening intensity. For single crystals and single-phase materials, such staging was discovered in early studies (see reviews [37,38]). Then, it was confirmed for polycrystals of pure metals with different syngonies [39,40,41], as well as for solid solutions and intermetallic compounds of FCC metals [42,43,44]. Data on the stages of plastic stress–strain curves for various metallic materials were summarized in [45,46,47,48].
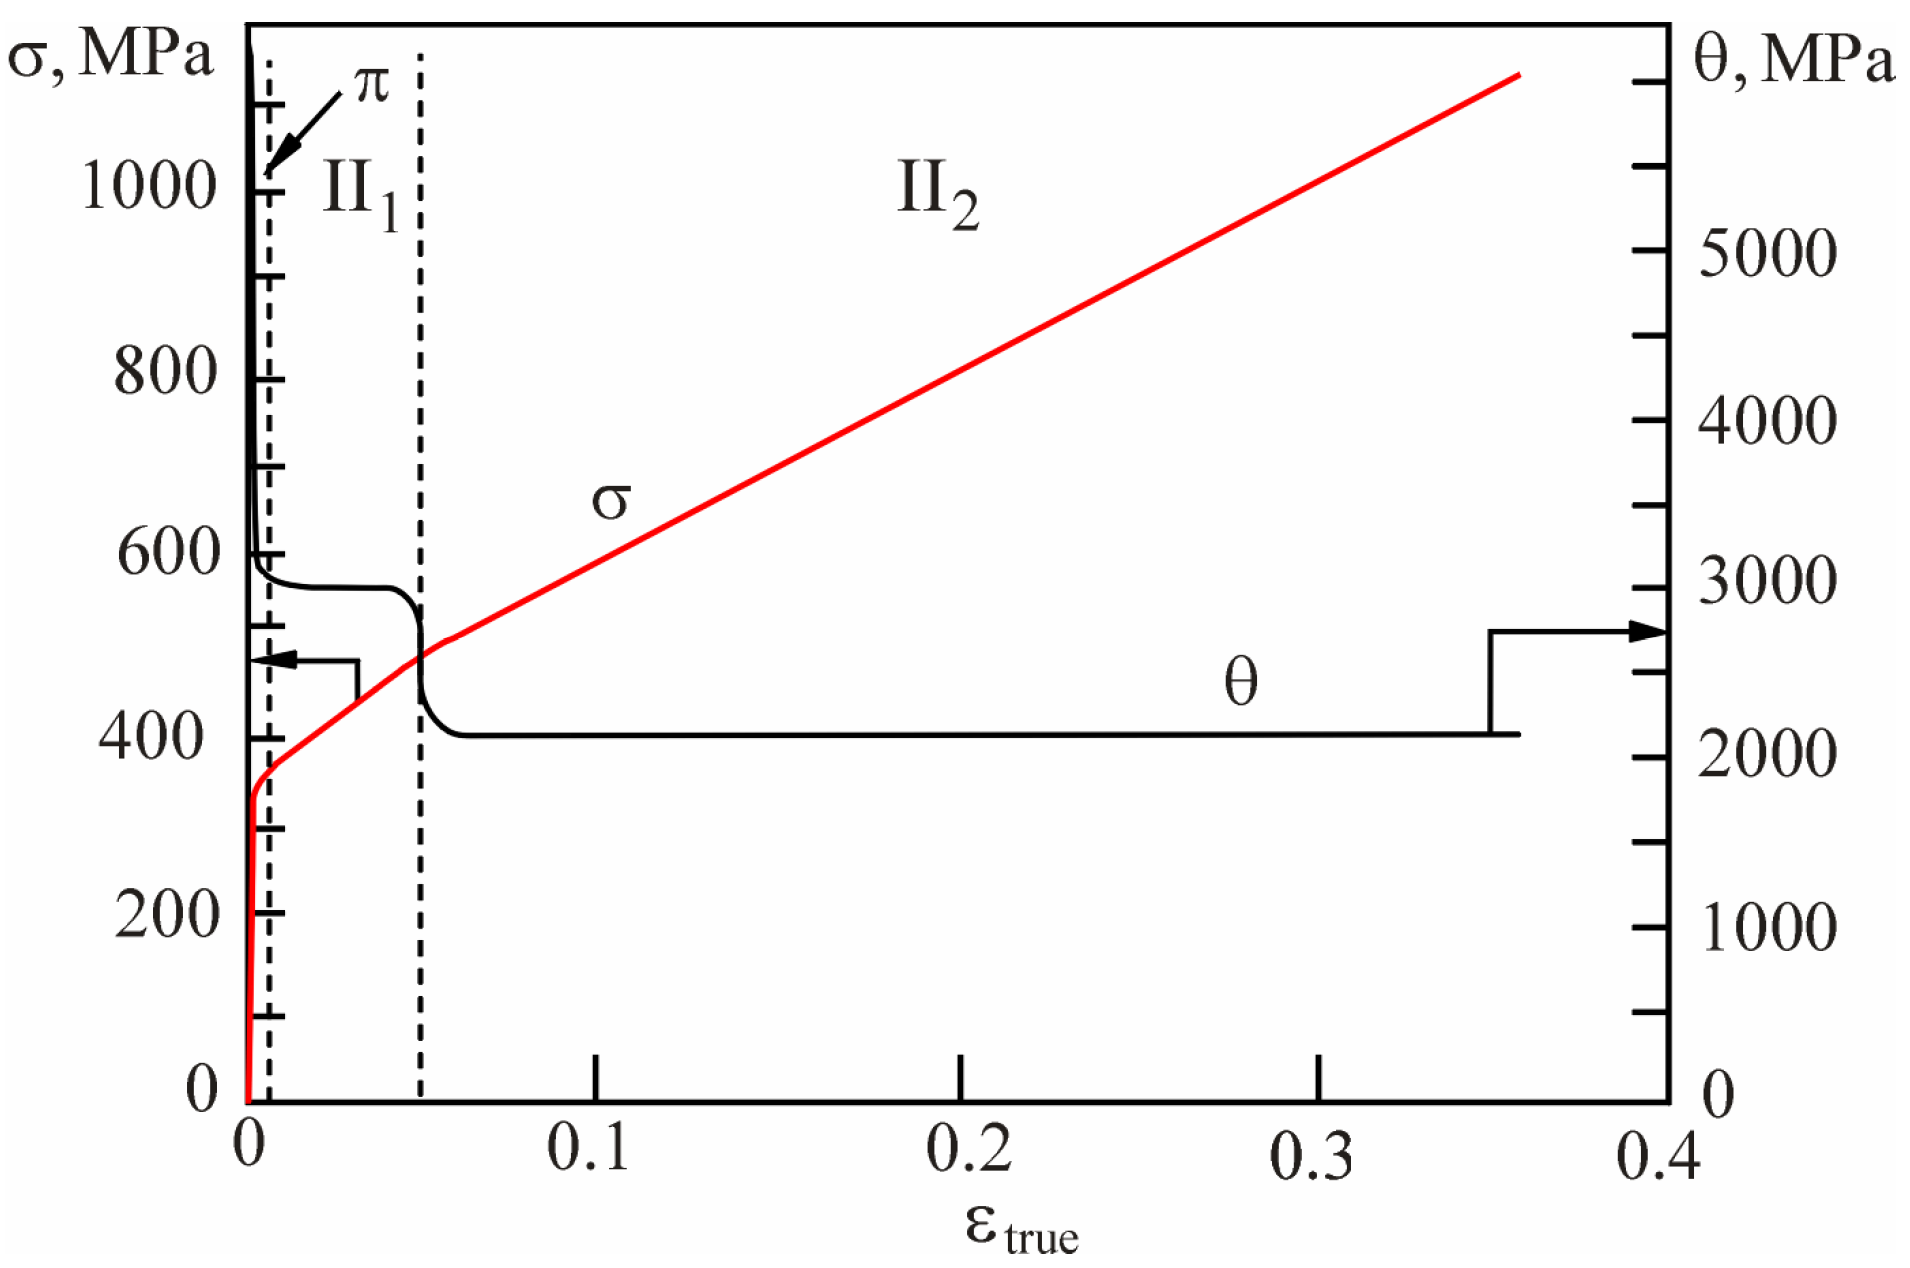
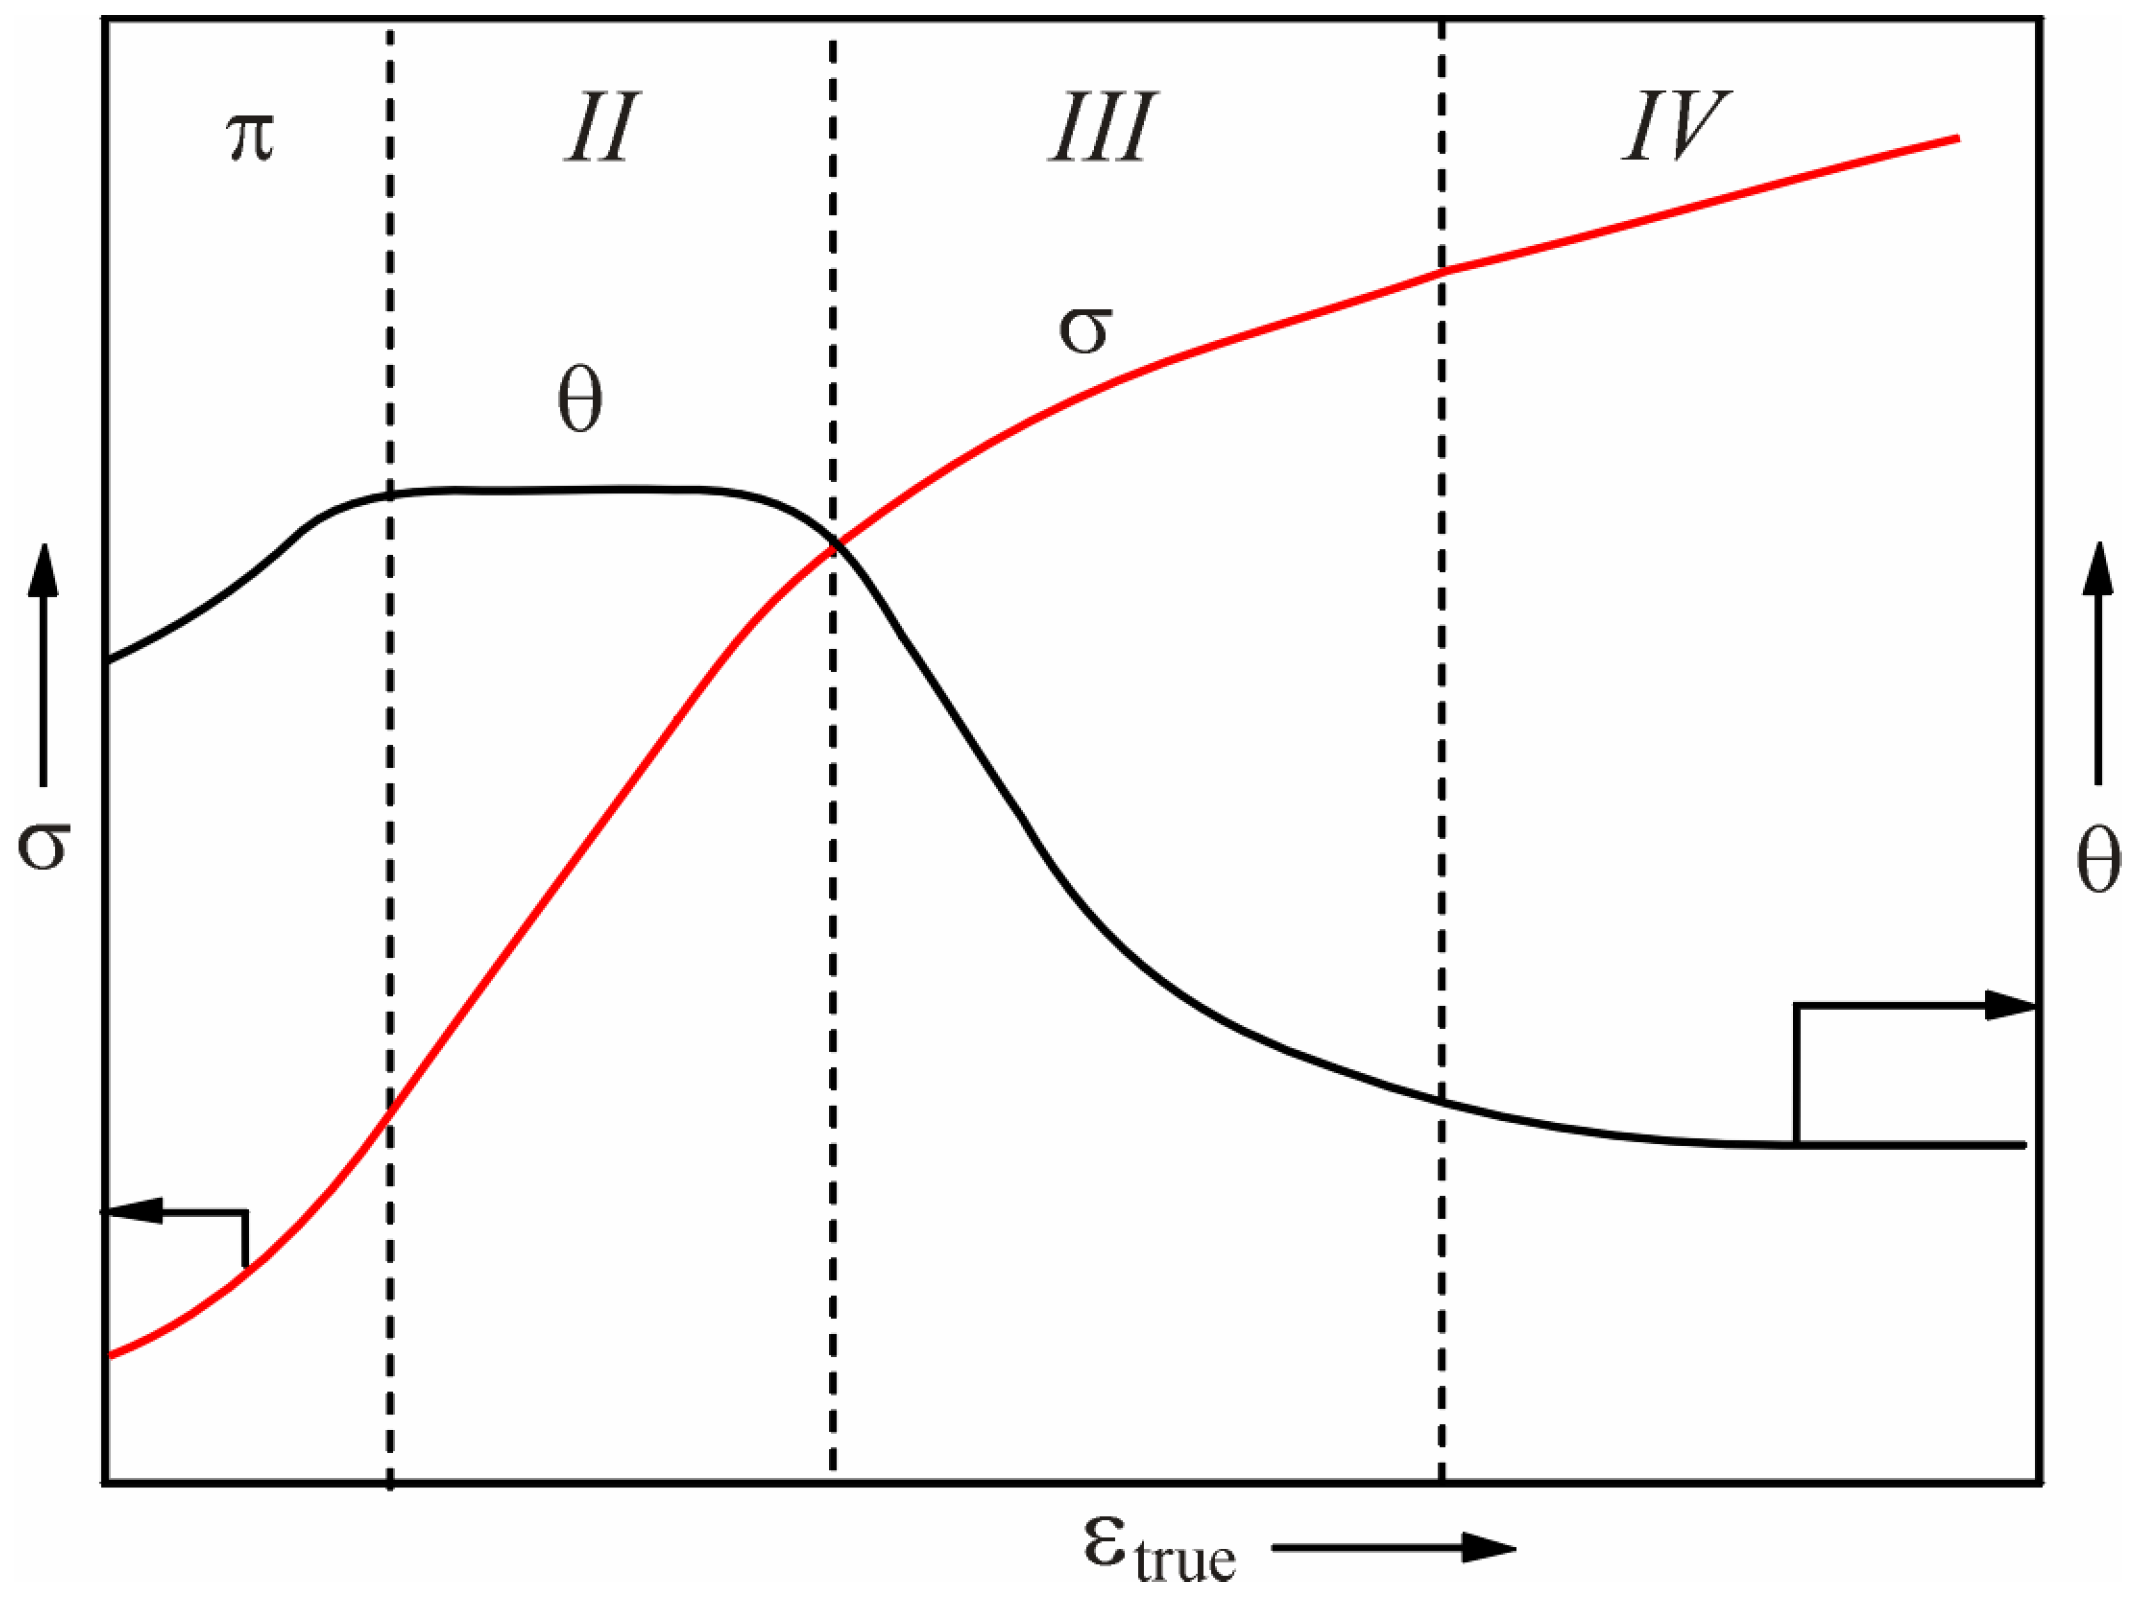
An analysis of a large amount of data showed that the ‘σ–ε’ dependences were multi-stage in general. The following stages were distinguished one after another. Firstly, the π transitional one was accentuated, which followed the yield point and demonstrated either an increase or a decrease in the θ = dσ/dε strain-hardening coefficient. After π, stage II was typically observed, characterized by an almost constant coefficient (θ). A further increase in external stresses resulted in the parabolic hardening stage, stage III, with a decreased coefficient (θ). Then, the transition from stage III to IV was reflected by a very low and constant coefficient (θ). Up until fracture, further dynamics of the changing coefficient (θ) could be characterized by either decreases or increases [19,20,47,48]. For the 110G13 Hadfield steel, both the stress–strain curve and the strain hardening coefficient (θ) versus the plastic strain (ε) dependence during a tensile test were given in [27] with marked the stages described above (Figure 4).
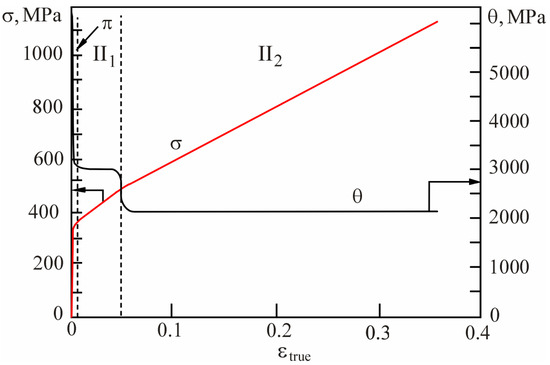
Figure 4.
The dependence of the flow stress (σ) and the strain hardening coefficient (θ) on the εtrue value for the Hadfield steel deformed by tension. Roman numerals II1, II1 indicate the stages of deformation hardening. π—transitional stage.
As can be seen in Figure 4, stage II could be divided into two substages with different hardening factors: = 3 × 10³ MPa and = 2.1 × 10³ MPa. A turning-point of the ‘σ–ε’ curve corresponded to a strain of 5%, coinciding with the beginning of the twinning process and decreasing the strain hardening coefficient (θ) (discussed in detail below). In many papers [1,20,24,49,50,51,52,53,54,55,56,57,58,59,60,61,62], the high hardenability of the Hadfield steel was highlighted when studying the mechanical properties of both poly [1,20,55,56,57,58,59,60,61] and single crystals [1,20,24,59,60,61,62]. At the same time, high values of the strain hardening coefficient (θ) and the linear nature of the ‘σ–ε’ dependence of the 110G13 Hadfield steel were associated with both sliding deformation and mechanical twinning.
Since it was known that the dislocation substructure type determined the staging of the flow curves and the strain hardening coefficient (θ) [37,39,40,63,64], their changes had to be expected for austenitic steels in general and the Hadfield grades in particular, as a result of the dislocation substructure transformation.
On the other hand, SFs were observed simultaneously with flat dislocation clusters when studying the dislocation substructure of polycrystal austenitic stainless steels [56]. Additionally, the important role of SFs of strengthening elements of the dislocation substructure was shown. Therefore, an increase in the strain hardening coefficient (θ) and the formation of a cellular dislocation substructure could be expected with the development of dislocations and SFs in the austenitic steels under tensile loads. In this case, if microtwins were formed, the density of which increasing with rising strains, then they could result in additional strengthening effects, enhancing the strain hardening coefficient (θ).
Rising strains in austenitic steels were accompanied by enhancing stresses and changes in the deformation mechanism from slip to twinning, which could become the main one. In this case, the number of active twinning systems could determine staging of the flow curves and the strain hardening coefficient (θ). It is known [42,43] that if twinning develops due to a deformation of the slip mechanism, then competition between cross slip and twinning could be observed. After slip, the development of twinning in one system has to suppress the cross-slip processes and causes an increase in the plasticity of crystals, i.e., the twinning-induced plasticity (TWIP) effect has to be observed. At low plastic strains (i.e., ε < 5%), a low strain hardening coefficient (θ) could be expected. The development of twinning in several systems had to result in a high θ value close to that in martensitic transformations. In [27], the influence of the dislocation substructure type, both slip and twinning deformation mechanisms, as well as the number of existing slip and twinning systems on the staging of the flow curve and the strain hardening coefficient (θ) of Hadfield steel was investigated in detail.
It is known that steel hardening results in the accumulation of a scalar density of dislocations organized into a substructure, which contributes to the formation of stress fields. An uncharged dislocation ensemble (i.e., one without excess dislocations) gives shear-stress fields, caused by the dislocation substructure, according to the following formula [65]:
where α varies within 0.05–1.00, depending on the dislocation ensemble type [64] (α = 0.625 for a charged dislocation ensemble [66]), G is the shear modulus, b is the Burgers vector, and ρ is the scalar density of dislocations.
In the case of a charged dislocation ensemble, when the excess dislocation density corresponded to the relation,
moment stresses were formed, and the following expression could be applied:
where αc = 1 is the Strunin coefficient [67].
ρ± = ρ+ − ρ− ≠ 0,
The dislocation substructure and the scalar dislocation density were characterized by the excess dislocation density. The latter also contributed to the formation of internal stress fields (moment stresses), which were identified via the presence of extinction contours in the steel. The point is that the bending extinction contour was caused by the diffraction contrast observed on the TEM image of the deformed crystal structure. This was the locus of points where a given family of atomic planes remained parallel to themselves and, therefore, were in the same reflective position. This was the reason for using TEM technique to measure internal stress fields, since only their presence led to the foil bending or the corresponding curvature of the crystal lattice, if the foil retained the plate shape [68]. The procedure for measuring the magnitude of internal stresses and the excess dislocation density was reduced to determining the χ = Δϕ/Δl curvature gradient of the foil or the crystal lattice (the details are discussed in the next subsection). Then, the excess density of dislocations (ρ±) was measured locally along the misorientation gradient [64,69]:
where b is the Burgers vector.
4.2. Mechanisms Providing the High Hardening of the Hadfield Steel
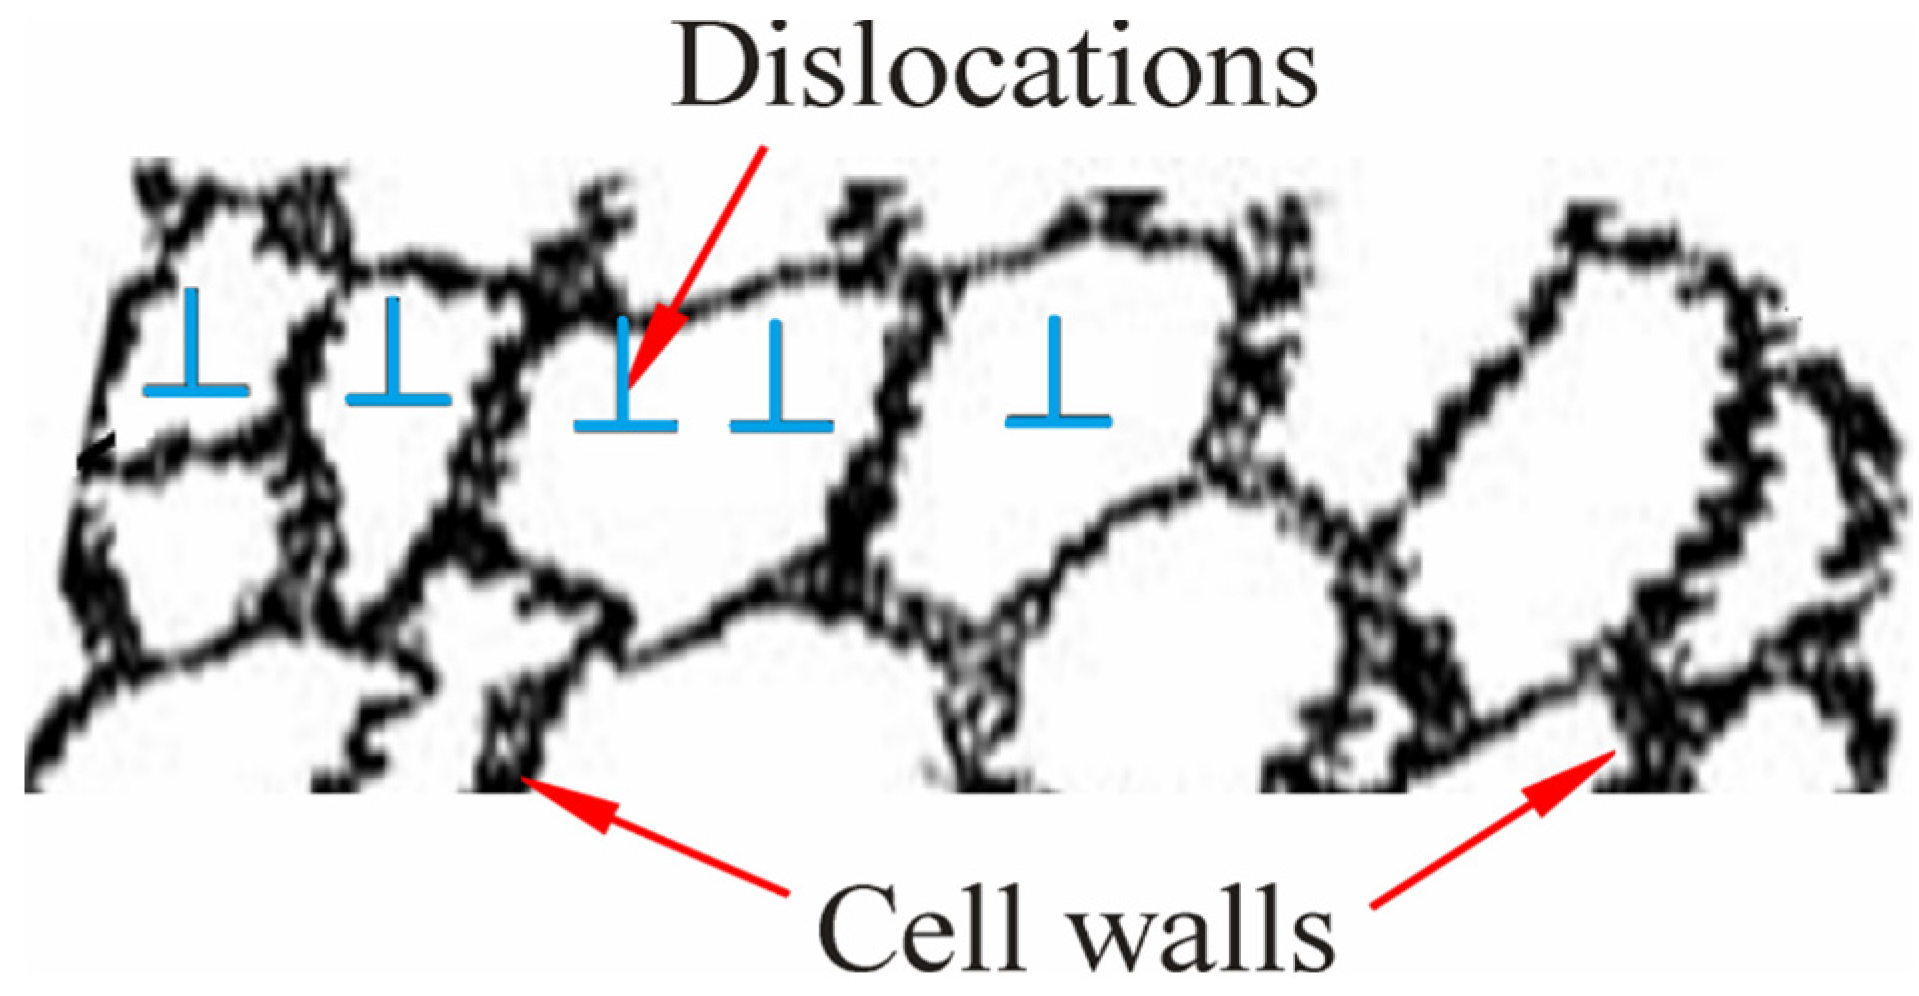
As was shown above, the Hadfield steel possessed a high strain hardening coefficient (θ) and was characterized by the atypical ‘σ–ε’ curve (Figure 3). The key point that distinguished the Hadfield steel from other materials was the linear long-term hardening stage, stage II. Figure 5 schematically shows the main hardening stages for the FCC metallic materials [37], so the greatest hardening was typically observed only at stage II and could be either short or long, depending on the plastic strain value. It was short (a few percent) as a rule, but was prolonged by up to 20% for ordered alloys with high energy values for antiphase boundaries [37]. Respectively, such materials were considered unique ones. The obtained stress–strain curve (Figure 3) indicated that the Hadfield steel had the same unique properties as the ordered FCC alloys. Firstly, it possessed the long stage, stage II, reaching ~20%. Secondly, the strain hardening coefficient (θ) was also high; it was ~3000 MPa before twinning and ~2100 MPa after that. The third feature of the Hadfield steel was the formation of the dislocation cellular substructure, which provided the θ strain hardening coefficient (θ) at stage II [37,40]. A feature of the cellular substructure was strong shear inhibition, since gliding dislocations could cross no more than 5–6 cell walls during their advance, after which the shear decayed [37,40]. For instance, Figure 6 schematically demonstrates the strong shear inhibition in a cellular substructure.
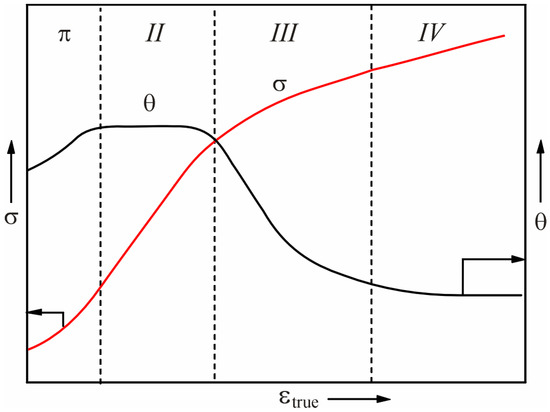
Figure 5.
A schematic representation of the four-stage stress–strain curve. Roman numerals II, III and IV indicate the stages of deformation hardening. π—transitional stage.
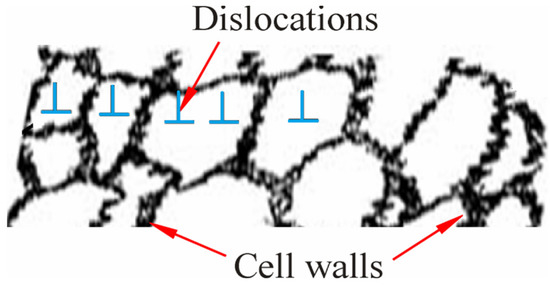
Figure 6.
A schematic representation of dislocation shear deceleration in a cellular substructure.
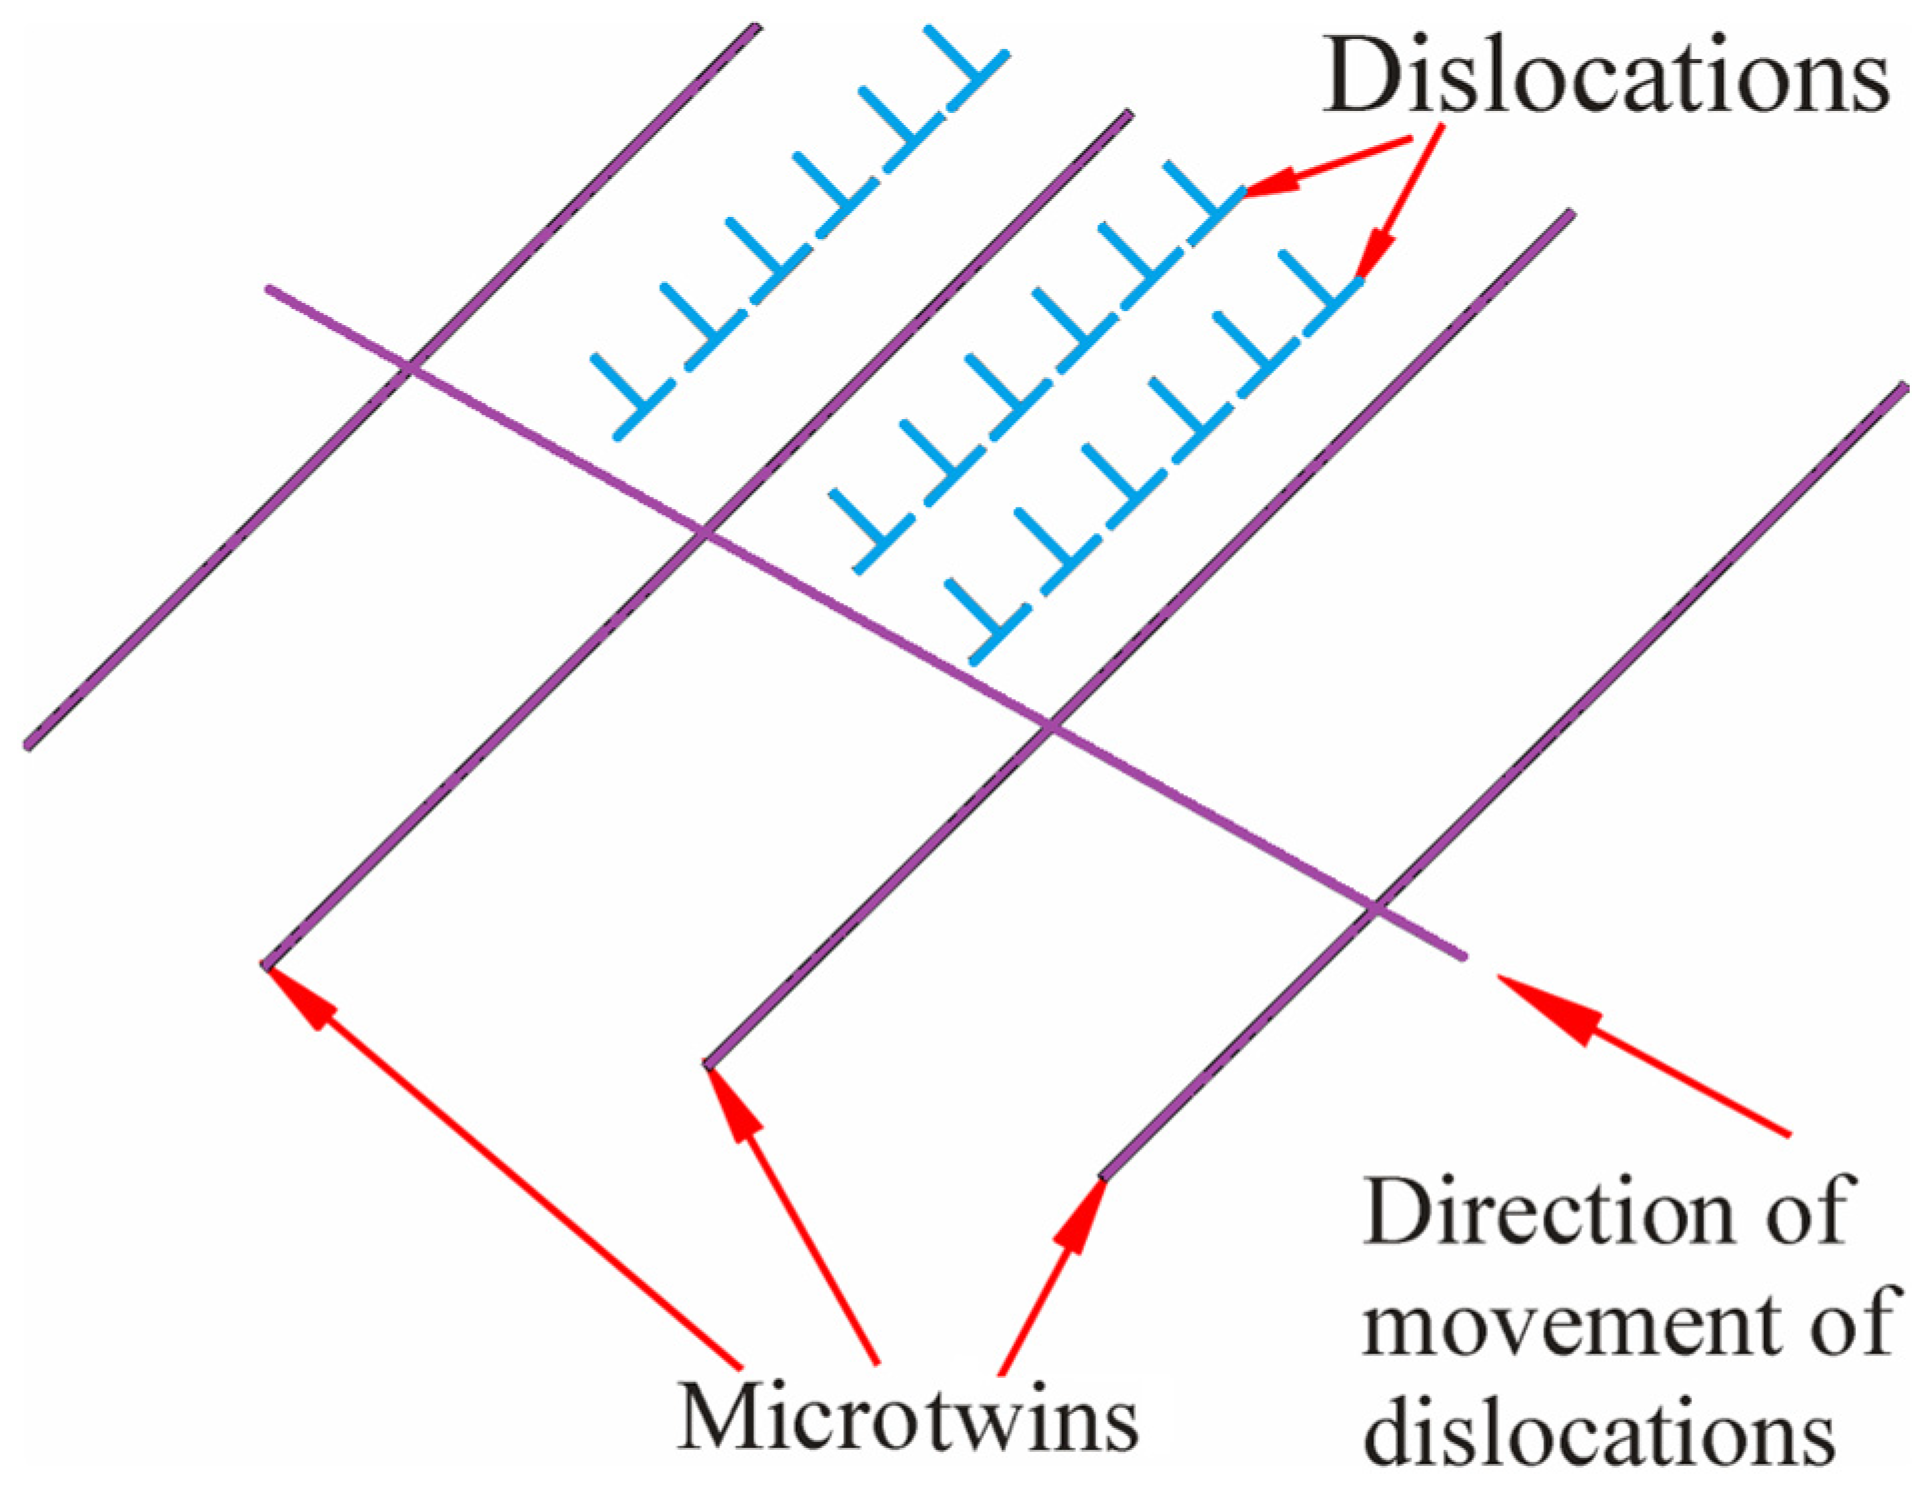
The fourth feature of the Hadfield steel was the simultaneous microtwinning with the dislocation slip. As is known, microtwins are a strong obstacle to the dislocation glide, and the shear could only cross several twins located parallel to each other. Figure 7 schematically shows the dislocation shear deceleration in a package of microtwins.
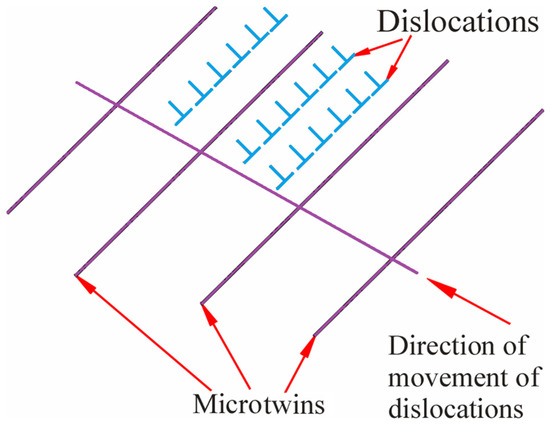
Figure 7.
A schematic representation of dislocation shear deceleration in a package of microtwins.
The fifth feature was the fact that microtwins contributed to great internal stresses, the estimated calculations of which were given in [27].
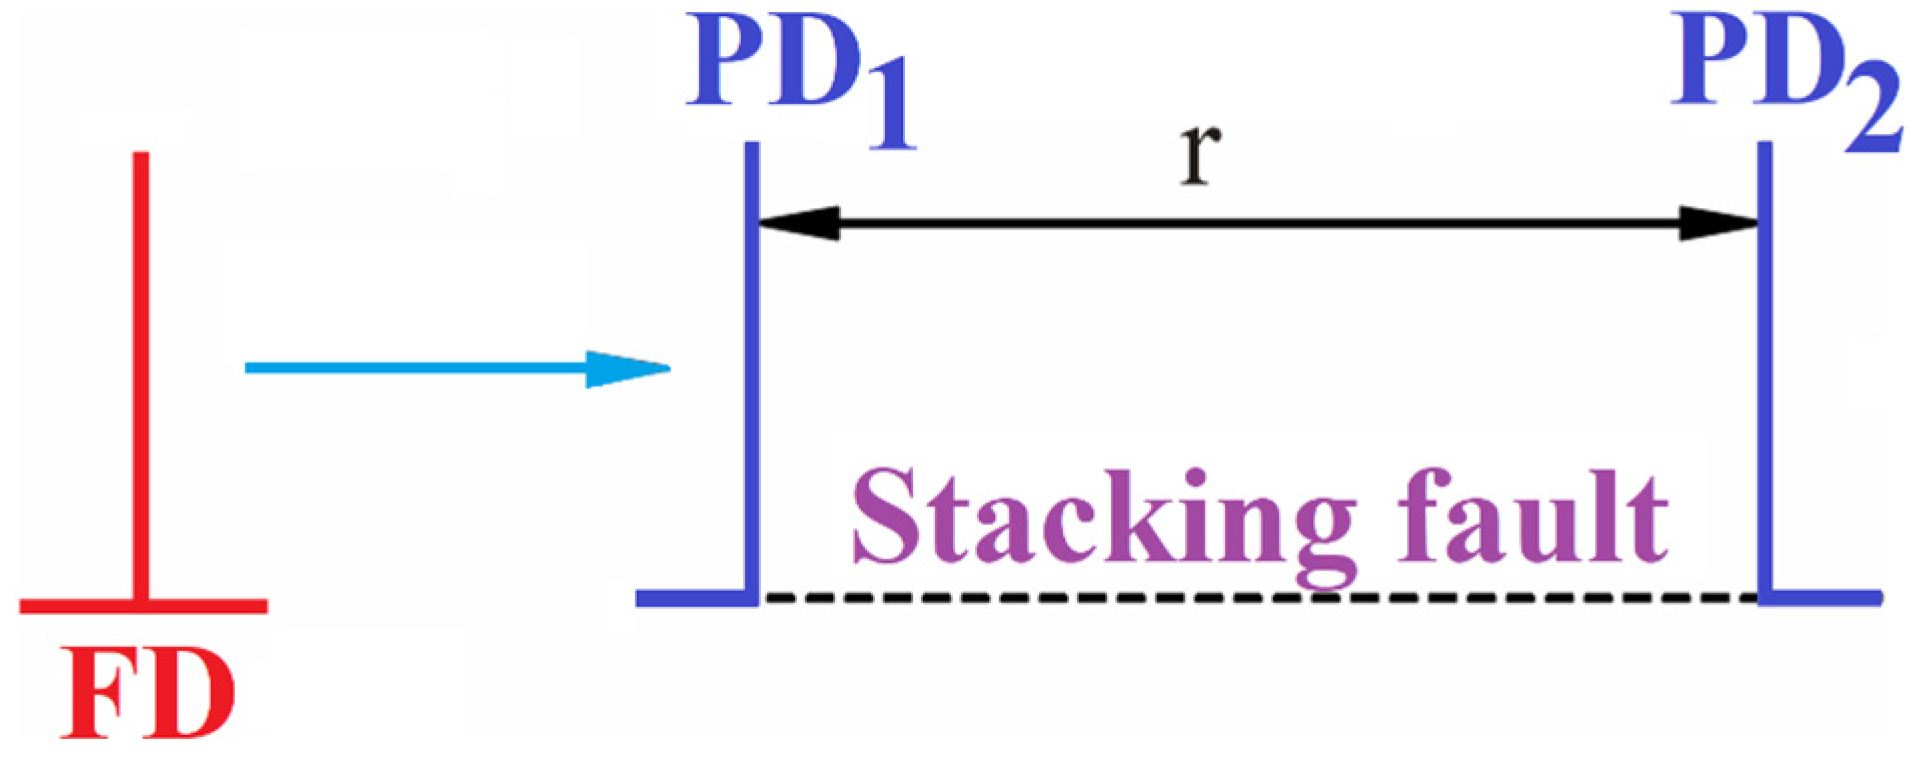
The sixth feature was related to the SF energy (SFE) value. It is known that gliding dislocations in a FCC lattice are split into partial and interconnected SFs (Figure 8) [70]. Depending on the SFE value, the presence of SFs between partial dislocations determined the splitting distance (r) of a full dislocation. This distance played an important role in plastic deformation. If the r value was negligible, dislocations easily carried out cross-slip or climbed and left their slip planes. In this case, dislocations could bypass obstacles during their sliding. If the r value was great, then the deformation process was followed only by twinning and dislocation slip played a lesser role. An intermediate case was also possible at an average r value. This took place at SFE levels of within 25–50 erg/cm2. With such splitting, a cellular substructure was formed, the wall of which were quite stable and difficult to overcome by sliding dislocations. At the same time, the twinning mechanism could be activated at these SFE values and could make a noticeable contribution to strain hardening (if it was not the main one).
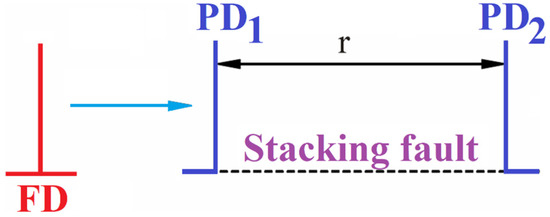
Figure 8.
A schematic representation of splitting of a full dislocation (FD) into partial ones (PD1 and PD2).
The above-mentioned main features differentiated the Hadfield steel from other FCC materials. However, they were associated only with dislocation glide and twinning, forming a contribution to the so-called substructural strengthening (σsubstrO). At the same time, σs-s solid-solution hardening (σs-s) also had a significant effect on the mechanical properties of the Hadfield steel. It included a deceleration of interstitial atoms and substitution of those dissolved in the solid solution, as well as of the ones of interstitial elements precipitated on dislocations, sub-boundaries and grain boundaries. Due to the presence of microcarbides in the Hadfield steel, albeit in small amounts [71,72], dispersion strengthening (σdisp) had to be considered as well.
Thus, according to the above data, flow stresses were contributed to in the Hadfield steel by three factors. However, this analysis of the main strengthening mechanisms was not complete, since the contribution of σis internal stresses (σis) was not taken into account. Therefore, it required additional determination and evaluation.
In view of the above, the flow stress (σ) of the Hadfield steel could be expressed, taking into account all four factors:
σ = σsubstr + σs-s + σdisp + σis.
Contributions of each component of Equation (12) to the flow (σ) stress and strengthening of the Hadfield steel are presented below.
4.3. Features of Strain Hardening and Self-Organization Processes in the Hadfield Steel during Plastic Deformation
According to Equation (12), the flow stress (σ) of the Hadfield steel included four components, and the values of each were important for predicting its deformation behavior. The solid-solution hardening (σs-s) did not depend on the ε value, i.e.,
σs-s(ε) = const.
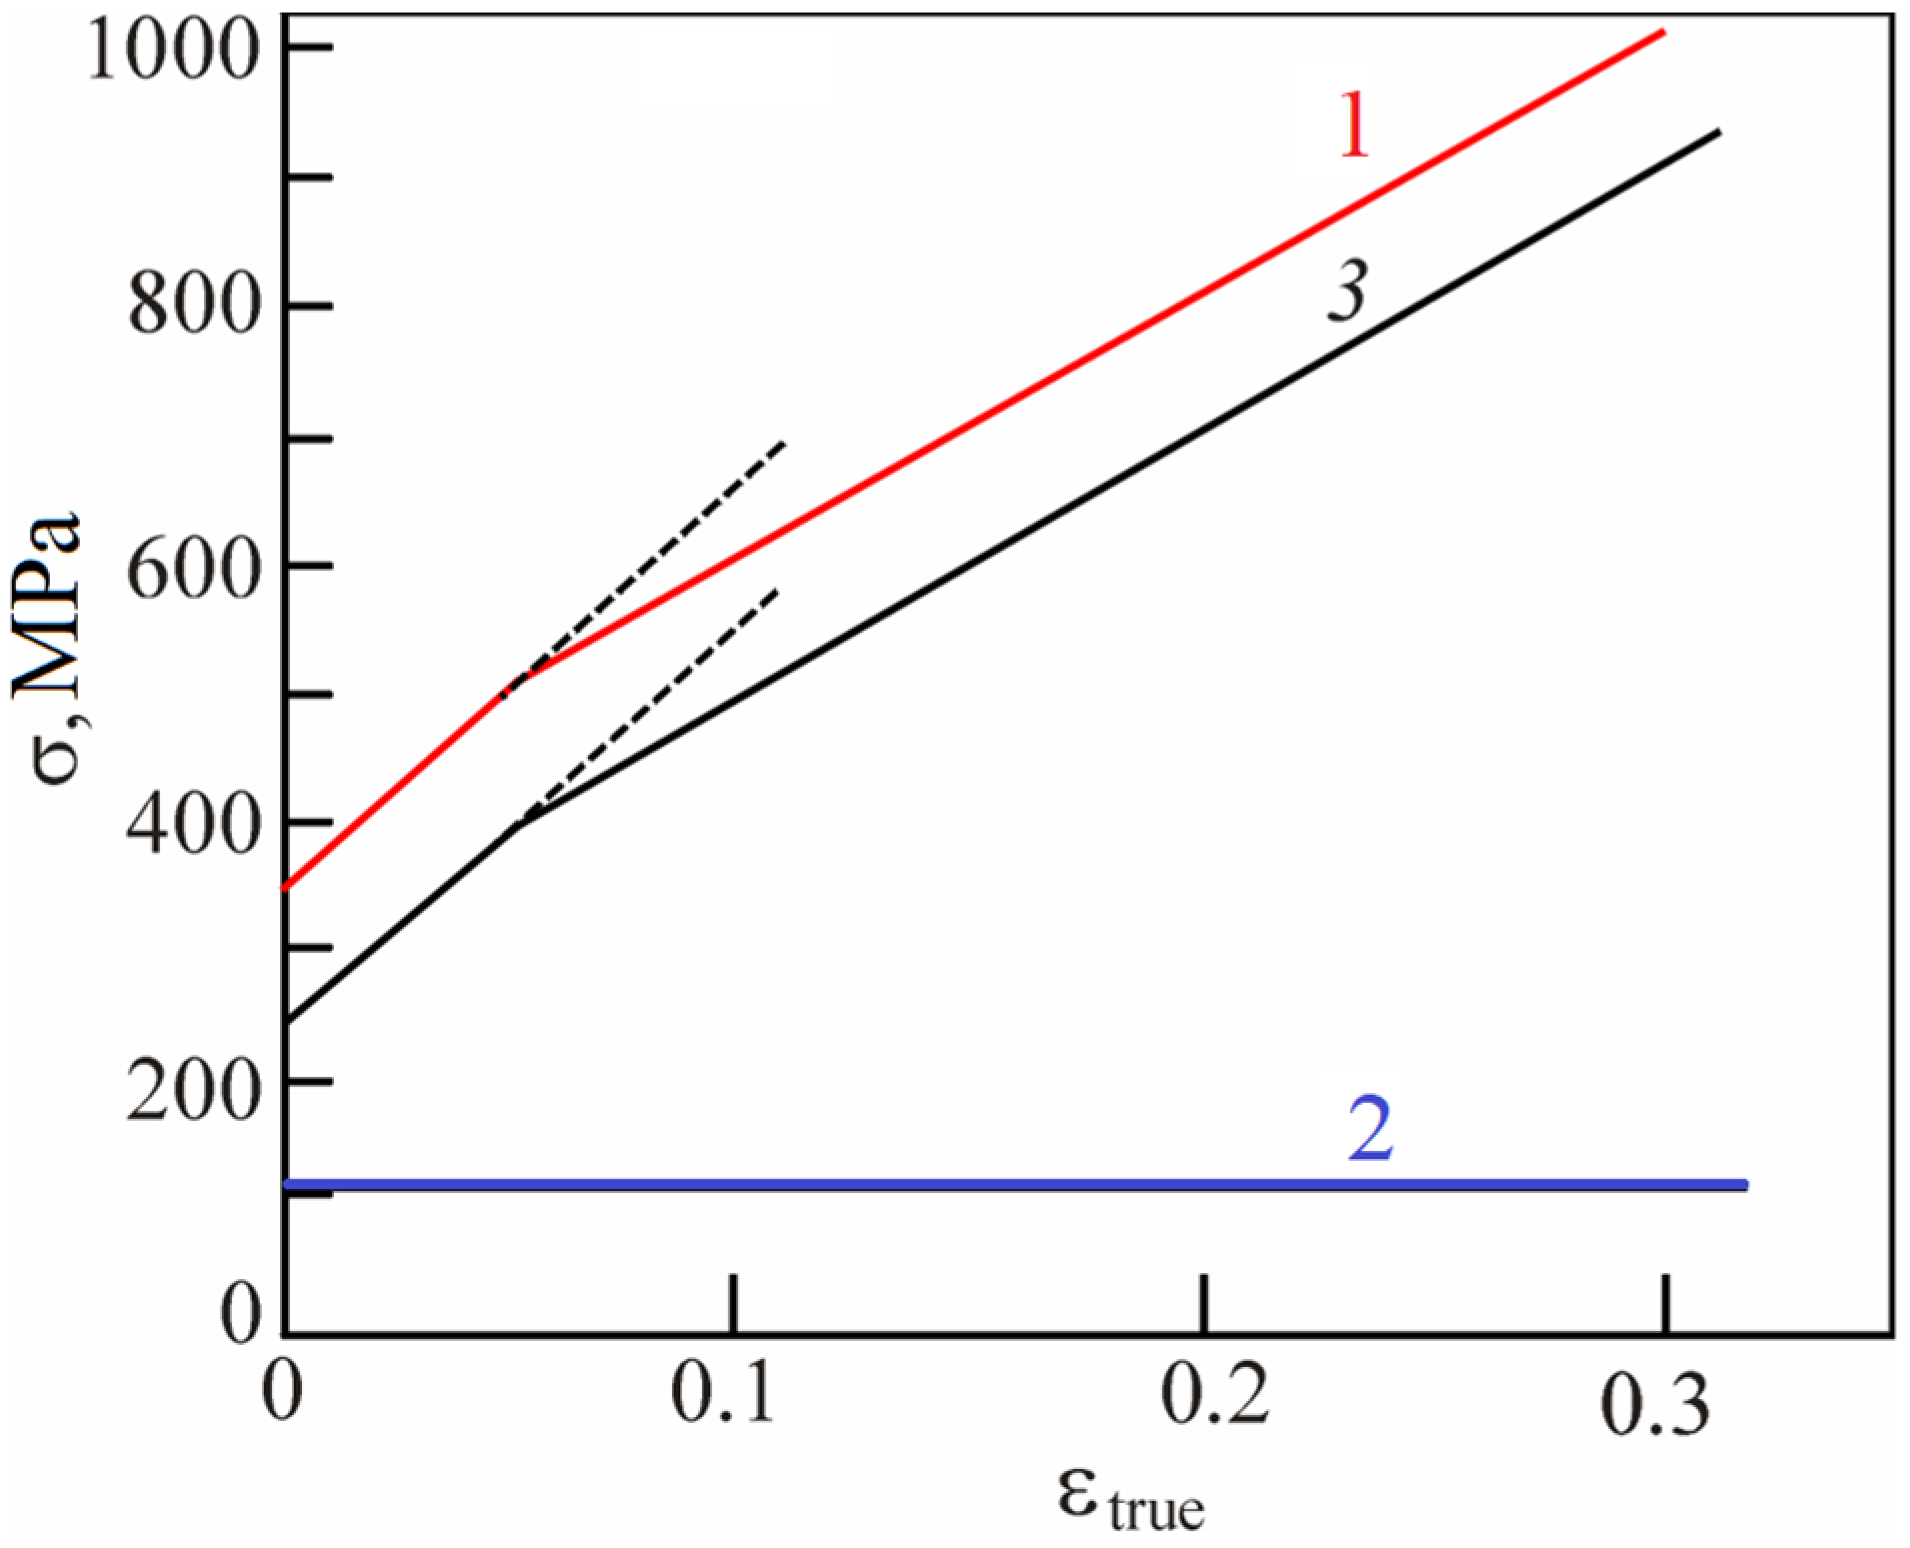
Figure 9 shows the flow stress curve (σ) and the solid-solution hardening (σs-s) contribution equal to 110–120 MPa. The difference between these two values (σ′ = σ–σs-s) was strain hardening. σs-s solid-solution hardening (σs-s) level could be determined in different ways, some of which are discussed below.
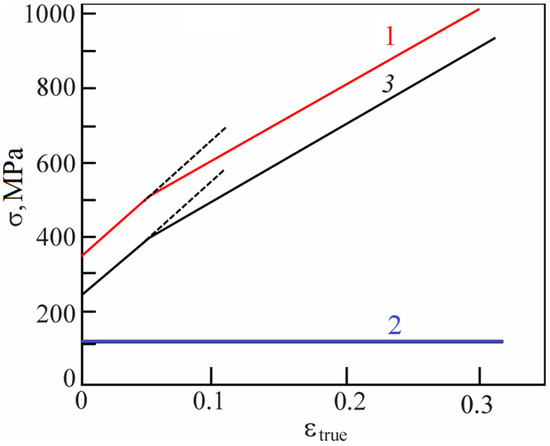
Figure 9.
The flow stress curve (σ) (1), σs-s solid-solution hardening (σs-s) contribution (2) and strain hardening value (σ′) (σ′ = σ–σs-s) (3) for the Hadfield steel.
The first method was based on the following algorithm. Contributions of (σelast)elastic stress fields (σelast)and the substructural hardening (σsubstr) could be subtracted from σ stress value (σ), i.e.,
σs-s = σ − σsubstr + σelast.
At a strain of 5%, the σs-s value was 110 MPa. It should be noted that the σdisp contribution that could give carbides (see Formula (12)) was not considered in Equation (14), since the microstructural studies showed their low concentration in the Hadfield steel. Therefore, carbides could not have a noticeable effect on the defective substructure and the dispersion hardening (σdisp) contribution could not be taken into account, respectively.
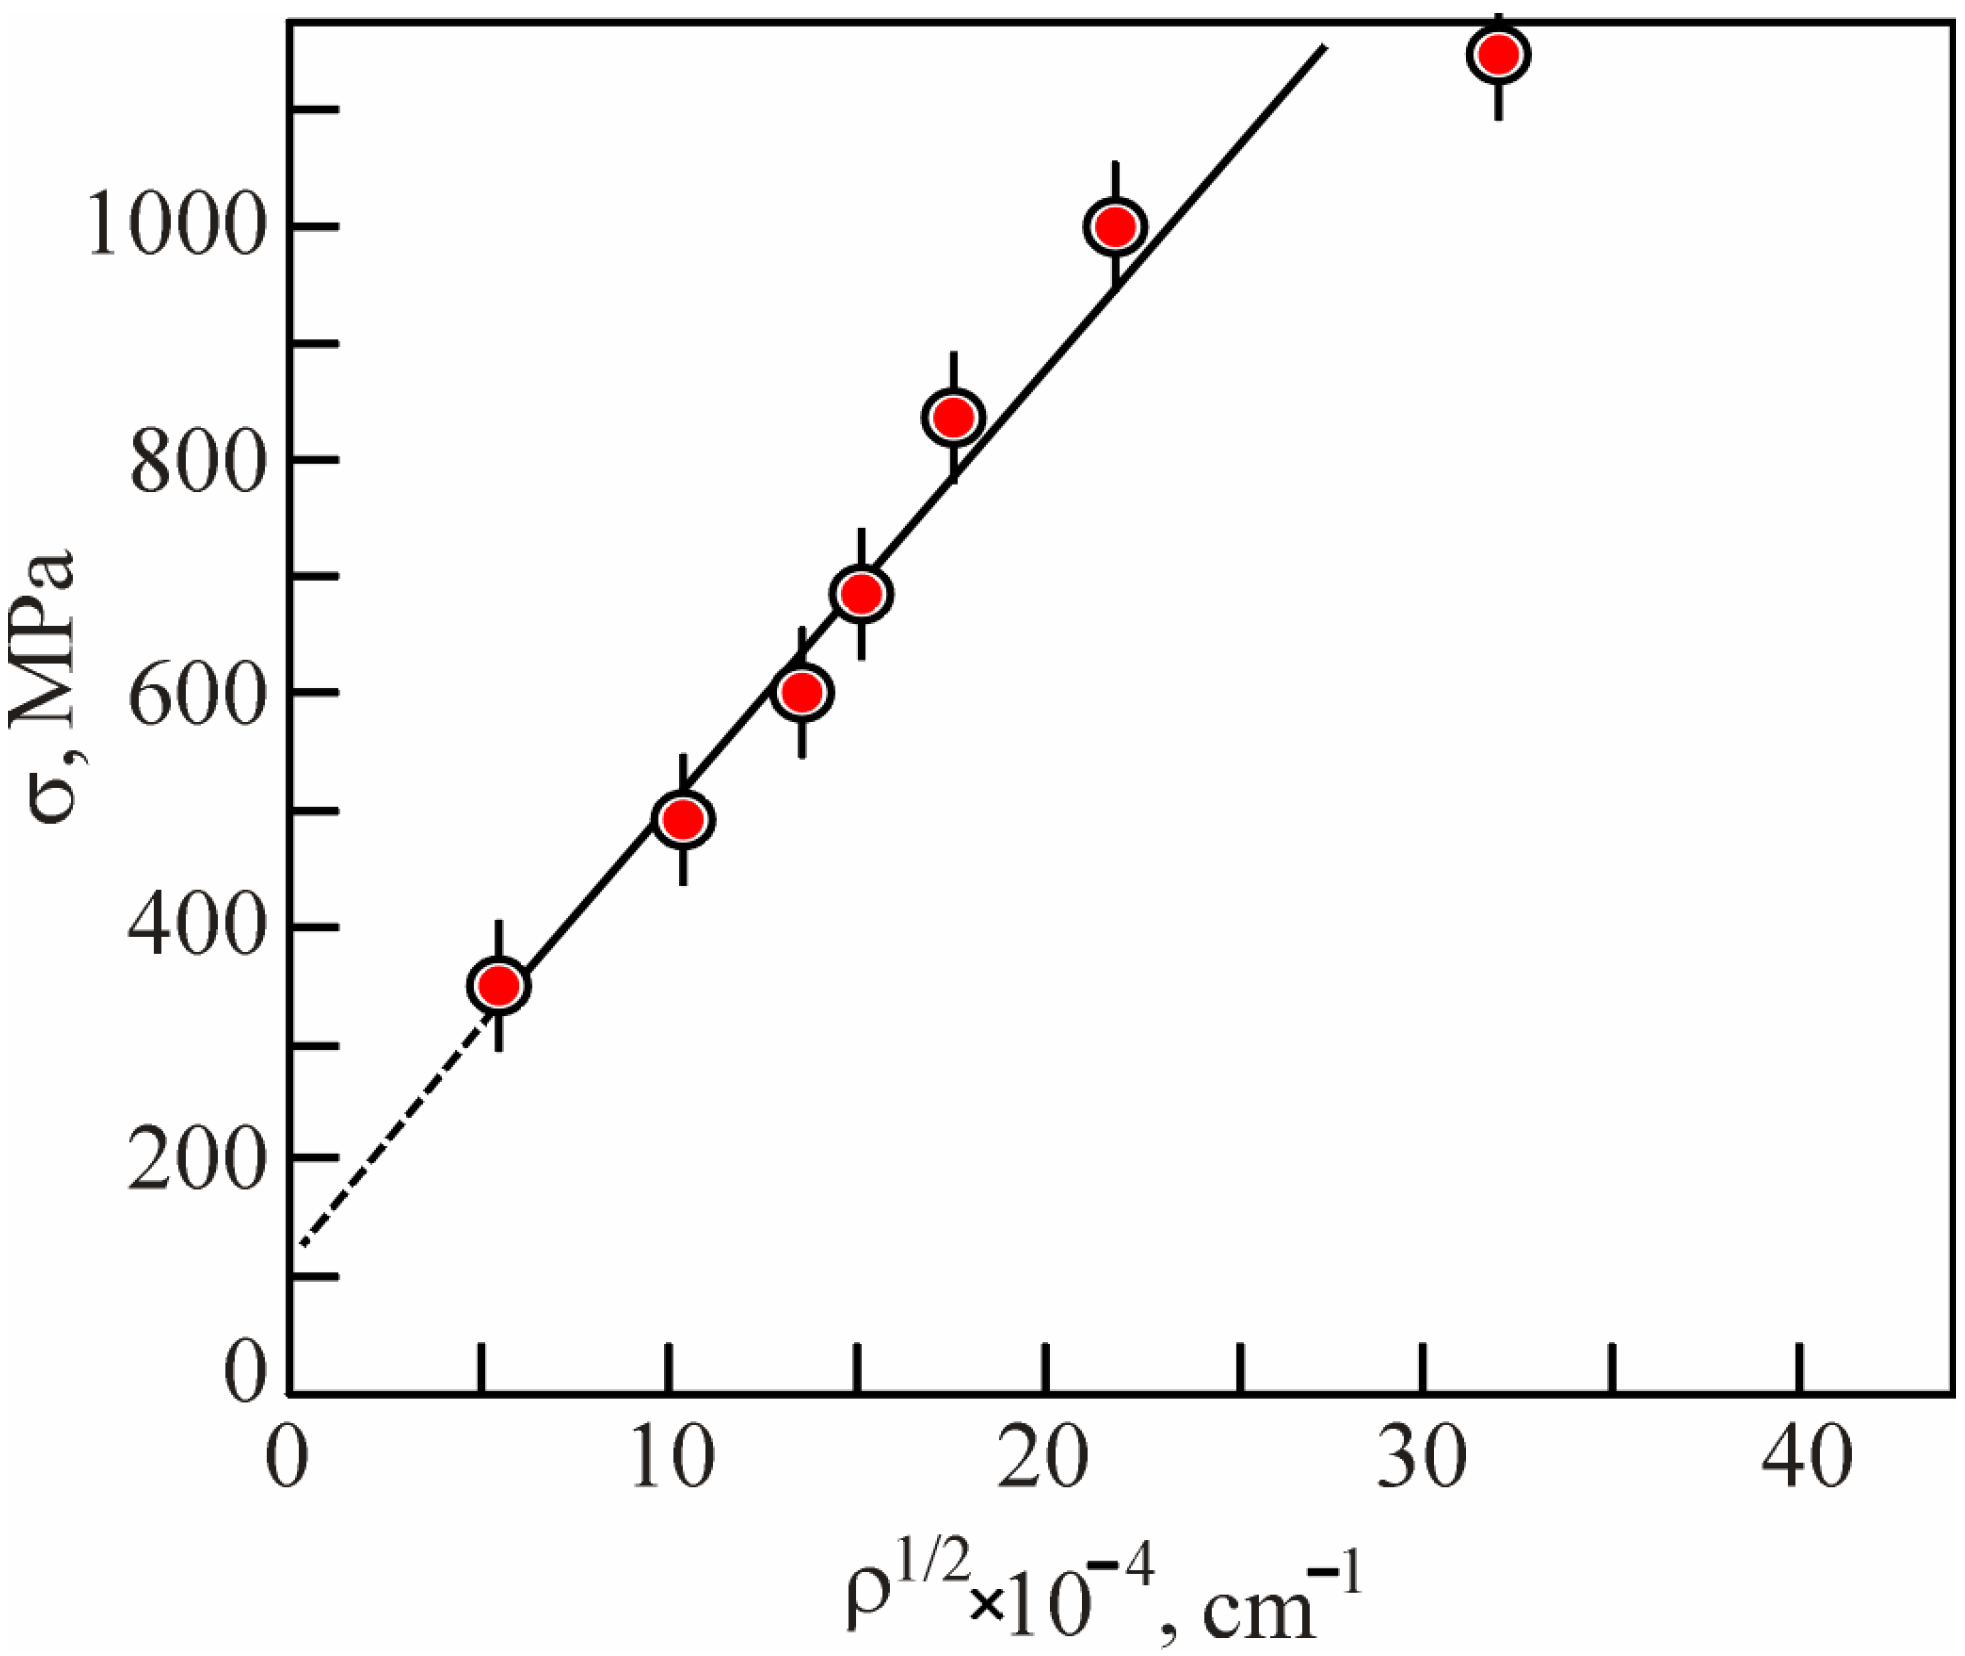
The second method was based on drawing the σ = f(ρ1/2) dependence in accordance with the well-known expression for the substructural (dislocation) contribution [65]:
In a defect-free material (at the ρ dislocation density is → 0), and the σsubstr contribution is → 0 as well. Therefore, a σ value of 120 MPa was obtained via the σsubstr = f(ρ1/2) experimental dependence after extrapolating ρ → 0 (Figure 10), which corresponded to the solid-solution hardening (σs-s) contribution. Thus, two close σs-s values of 110 and 120 MPa were estimated, and the corresponding data are also shown in Figure 9 (curve 2). Hence, it was obvious that σ′ strain hardening (σ′) of the Hadfield steel was determined by the remaining components,
which are shown in Figure 9 (curve 3).
σ′ = σ − σs-s,
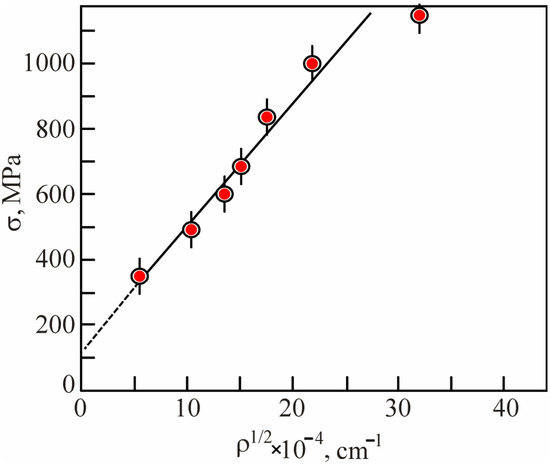
Figure 10.
The dependence of the flow stress (σ) on the square root of the ρ scalar dislocation density for determining σs-s solid-solution hardening (σs-s) value in the Hadfield steel.
Thereby, the strain hardening (σ′) of the Hadfield steel was determined via the substructural contribution of dislocations and twins:
σ′ = σdisl + σtw.
Both of these contributions (σdisl and σtw) formed elastic stress fields. In addition, the σdisl~ and σdisl~1/D dependences had to be considered, where D is the size of dislocation cells. The D values were determined via the method of random secants [36], both by measuring them in different foil planes and by averaging all available planes. Consequently, it was most expedient to divide the σ′ value.
It should be noted that elastic stress fields were formed by both dislocations and twins, but it was reasonable to separate their contributions. The reason was the fact that dislocation-induced stresses included two components: contact and barrier deceleration. The contact one, arising from the intersection of dislocations and the formation of dislocation reactions [73,74,75,76], was proportional to :
Dislocations also contributed to barrier deceleration [42]:
where σ′barrier is deceleration by the walls of dislocation cells, and σ′barrier~1/D [38,74,77,78], i.e.,
where = const~2–4 [79].
σdisl = σcontact + σ′barrier,
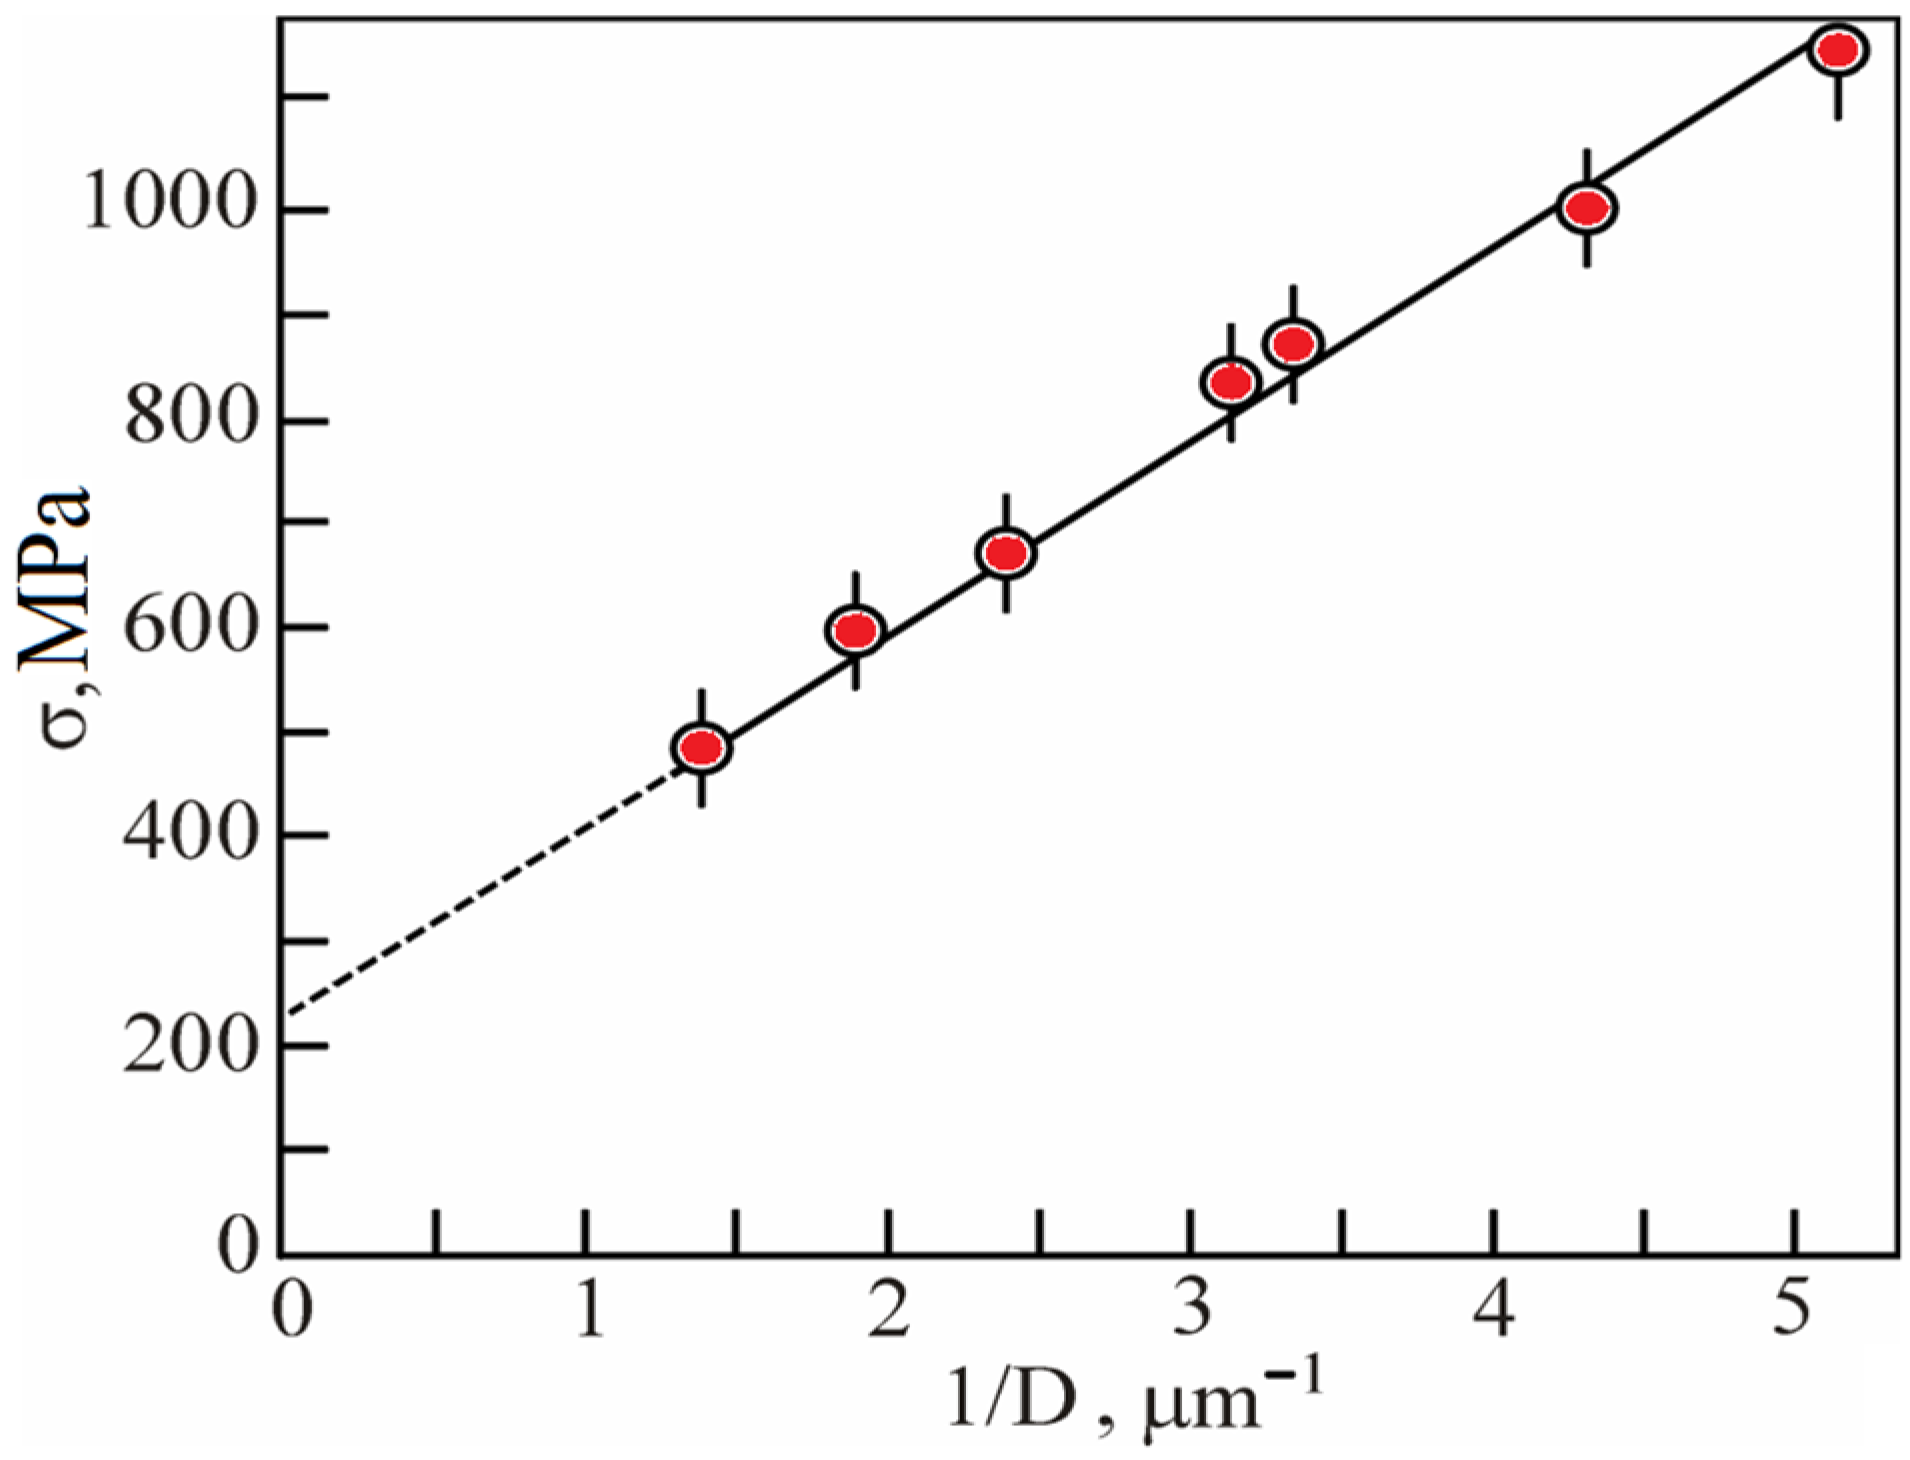
Figure 11 shows that the dependence σ = f(1/D) characterized the cellular substructure by its linearity. At 1/D = 0, the intersection point was the sum of both σs-s and σcontact contributions, i.e., the dislocations that were not organized into the walls of dislocation cells.
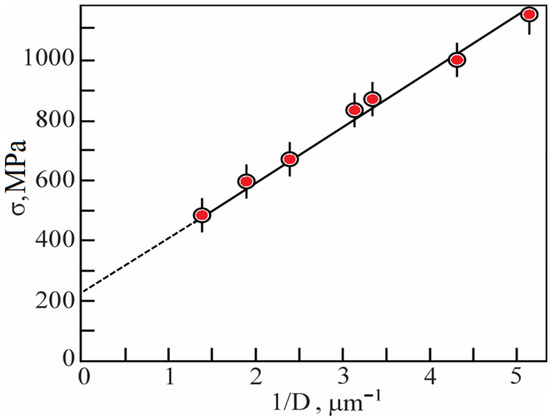
Figure 11.
The dependence of the flow stress (σ) on the 1/D dislocation cell size for the Hadfield steel.
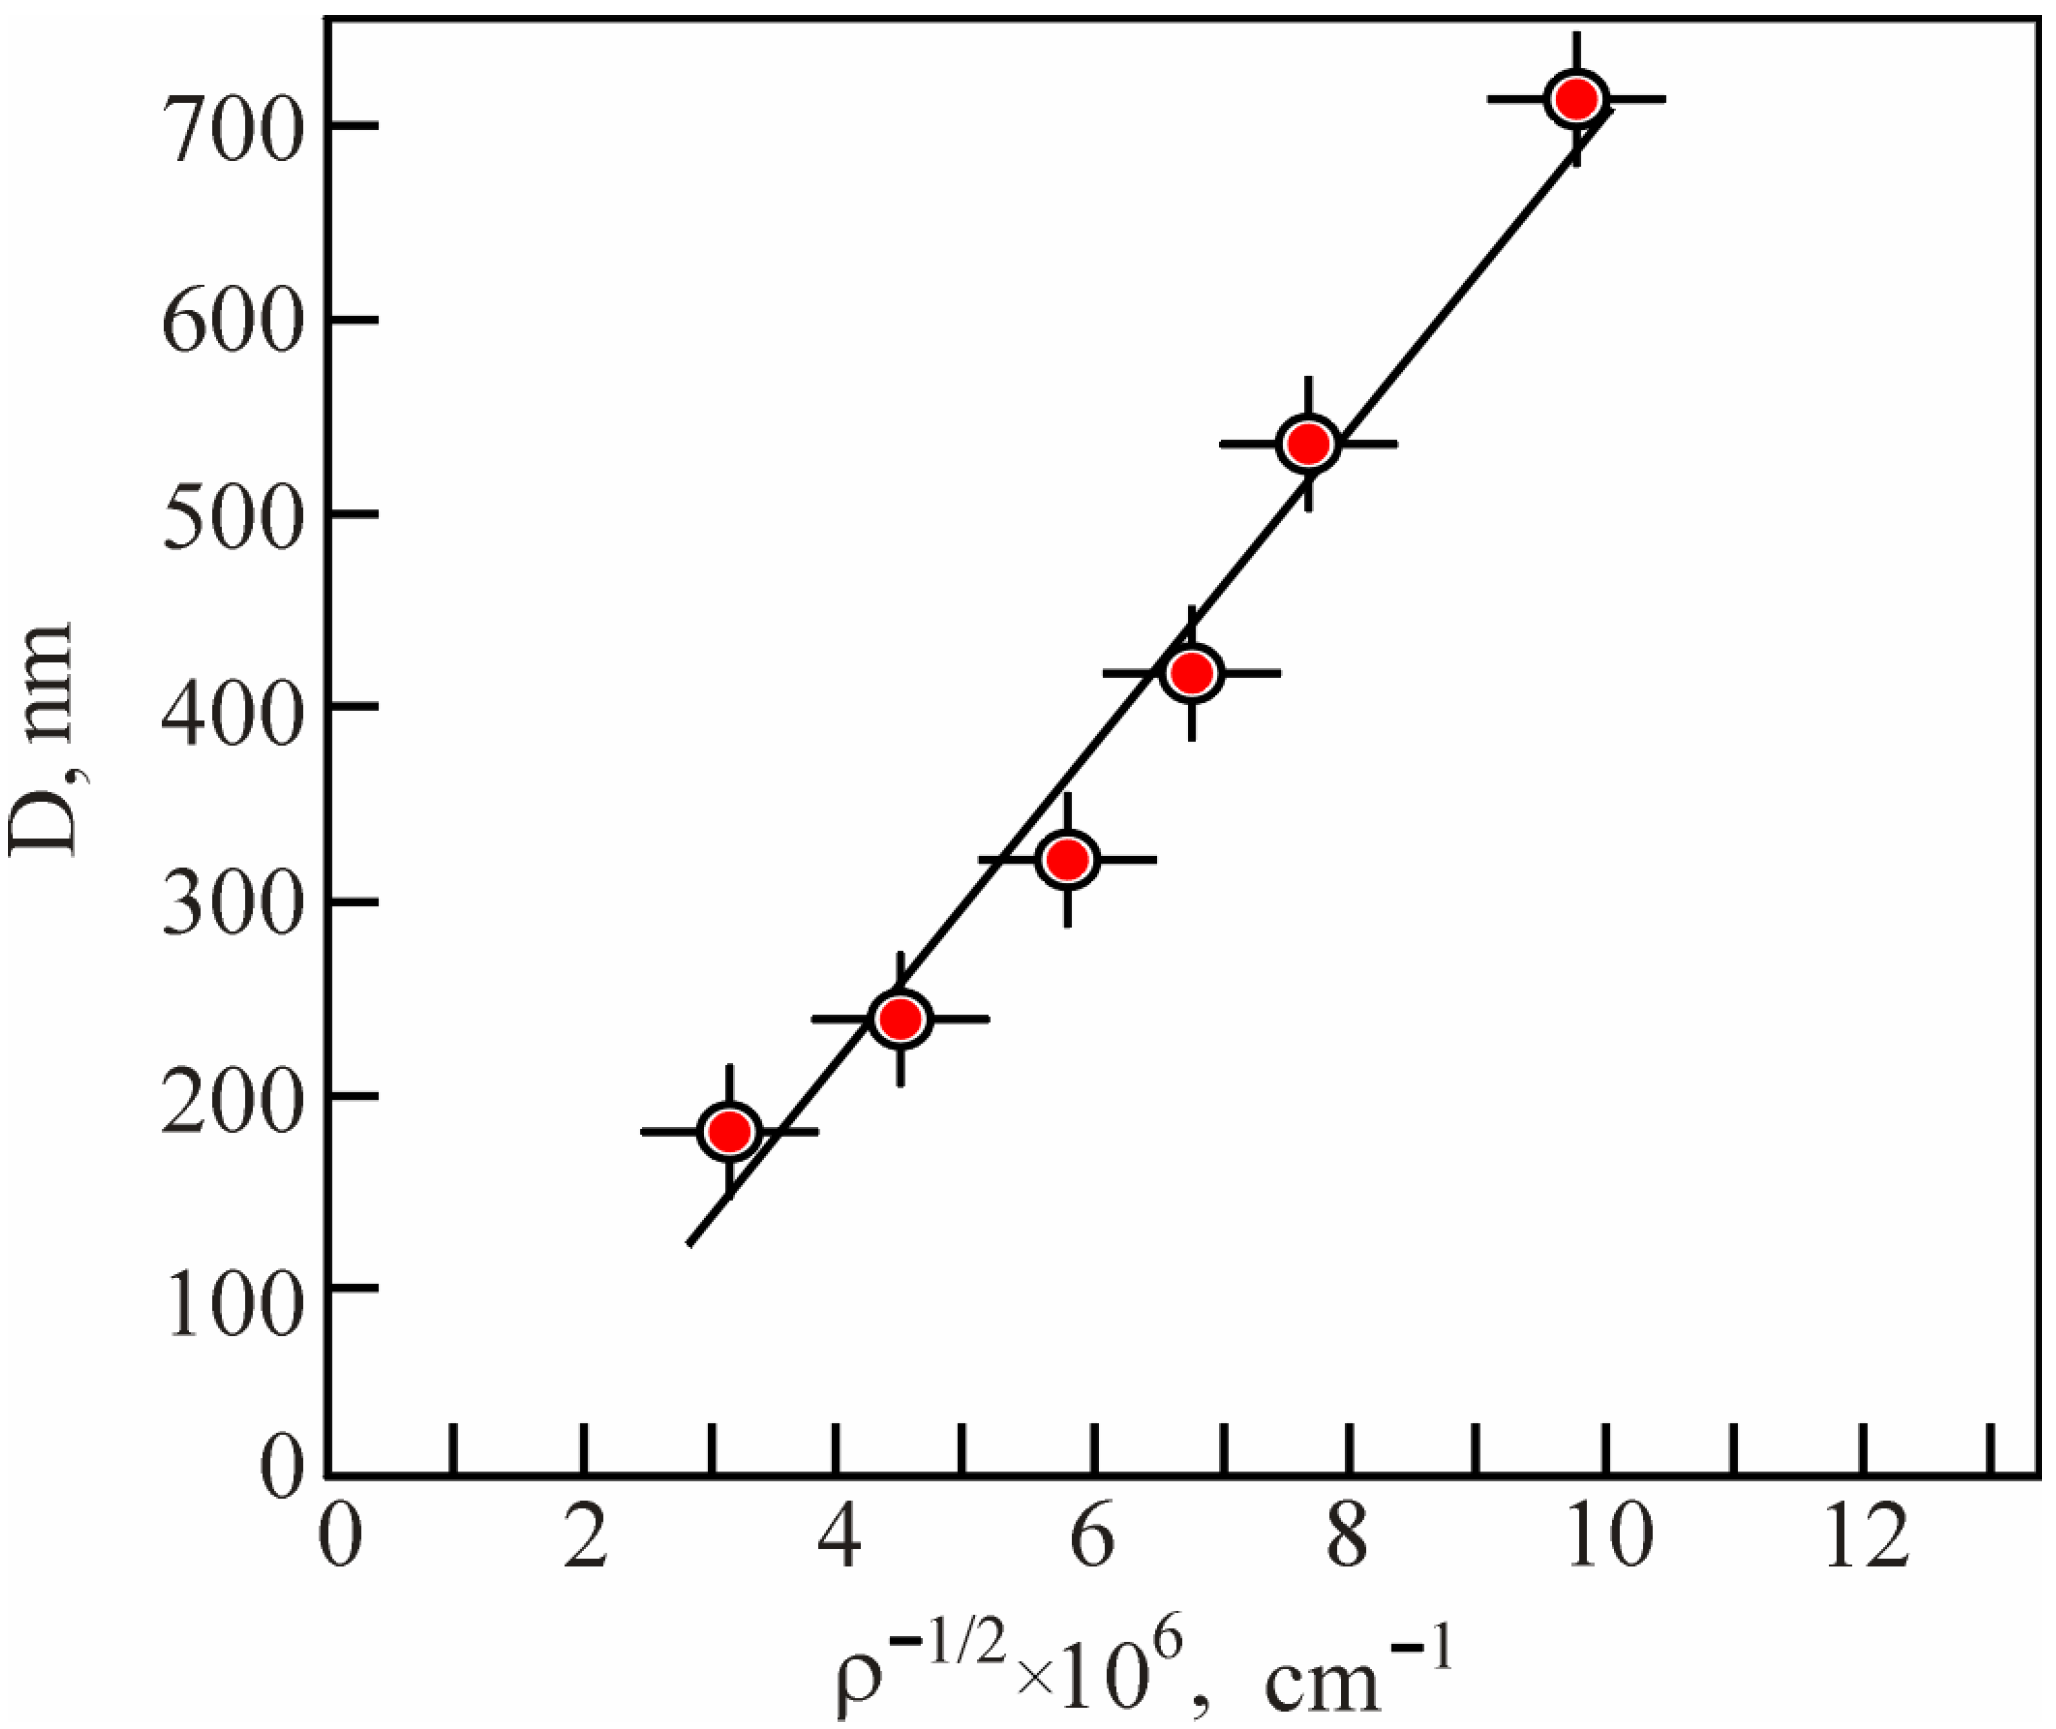
The cellular substructure formed in the Hadfield steel obeyed the basic equations of such a typical case [80,81], namely
D = Cρ−1/2.
This was the well-known Holt relation [82] that was determined via self-organization of a dislocation ensemble, which is confirmed in Figure 12. Since the Holt relation reflected high work-hardening degrees [81], it was the formation of the cellular substructure that primarily determined the high hardenability of the Hadfield steel.
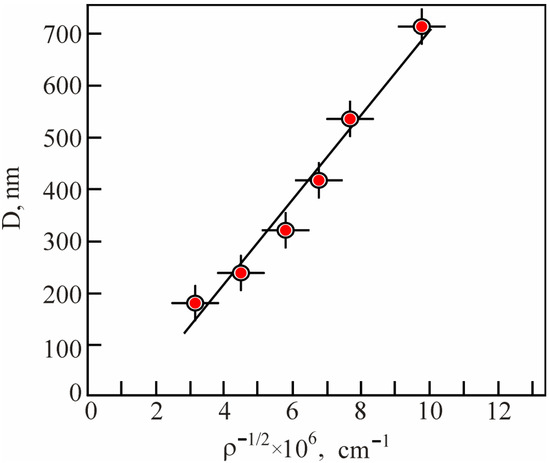
Figure 12.
The dependence of the average size (D) of dislocation cells on the square root of the scalar dislocation density (ρ) for the Hadfield steel.
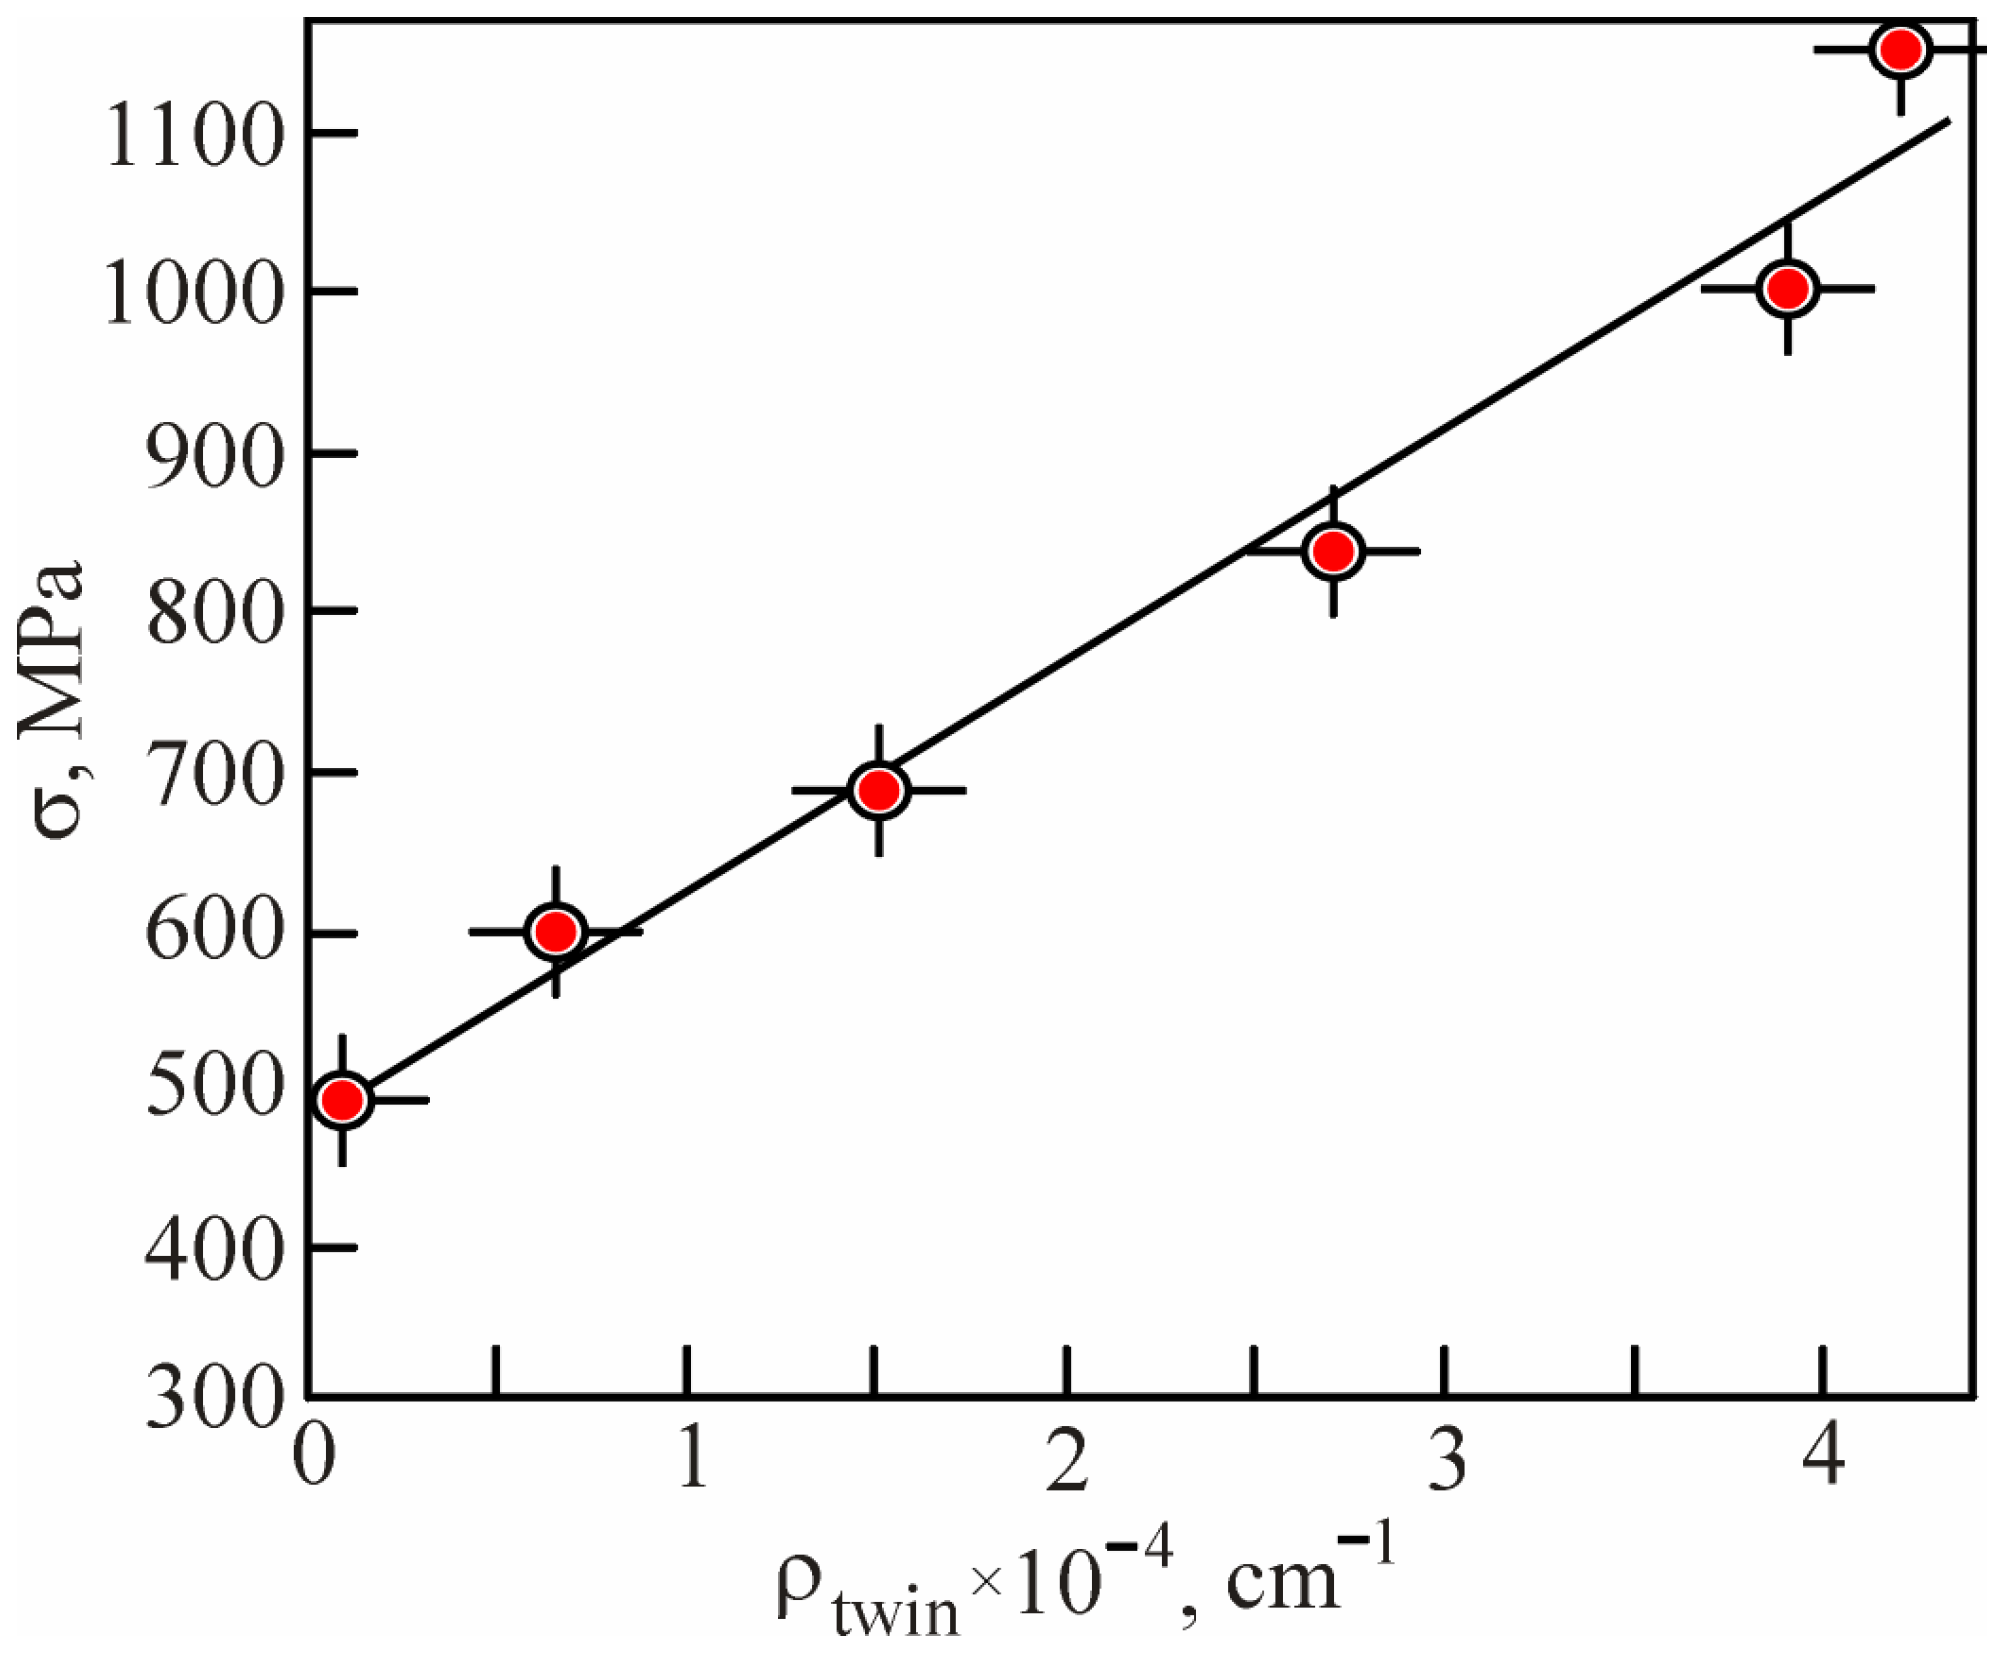
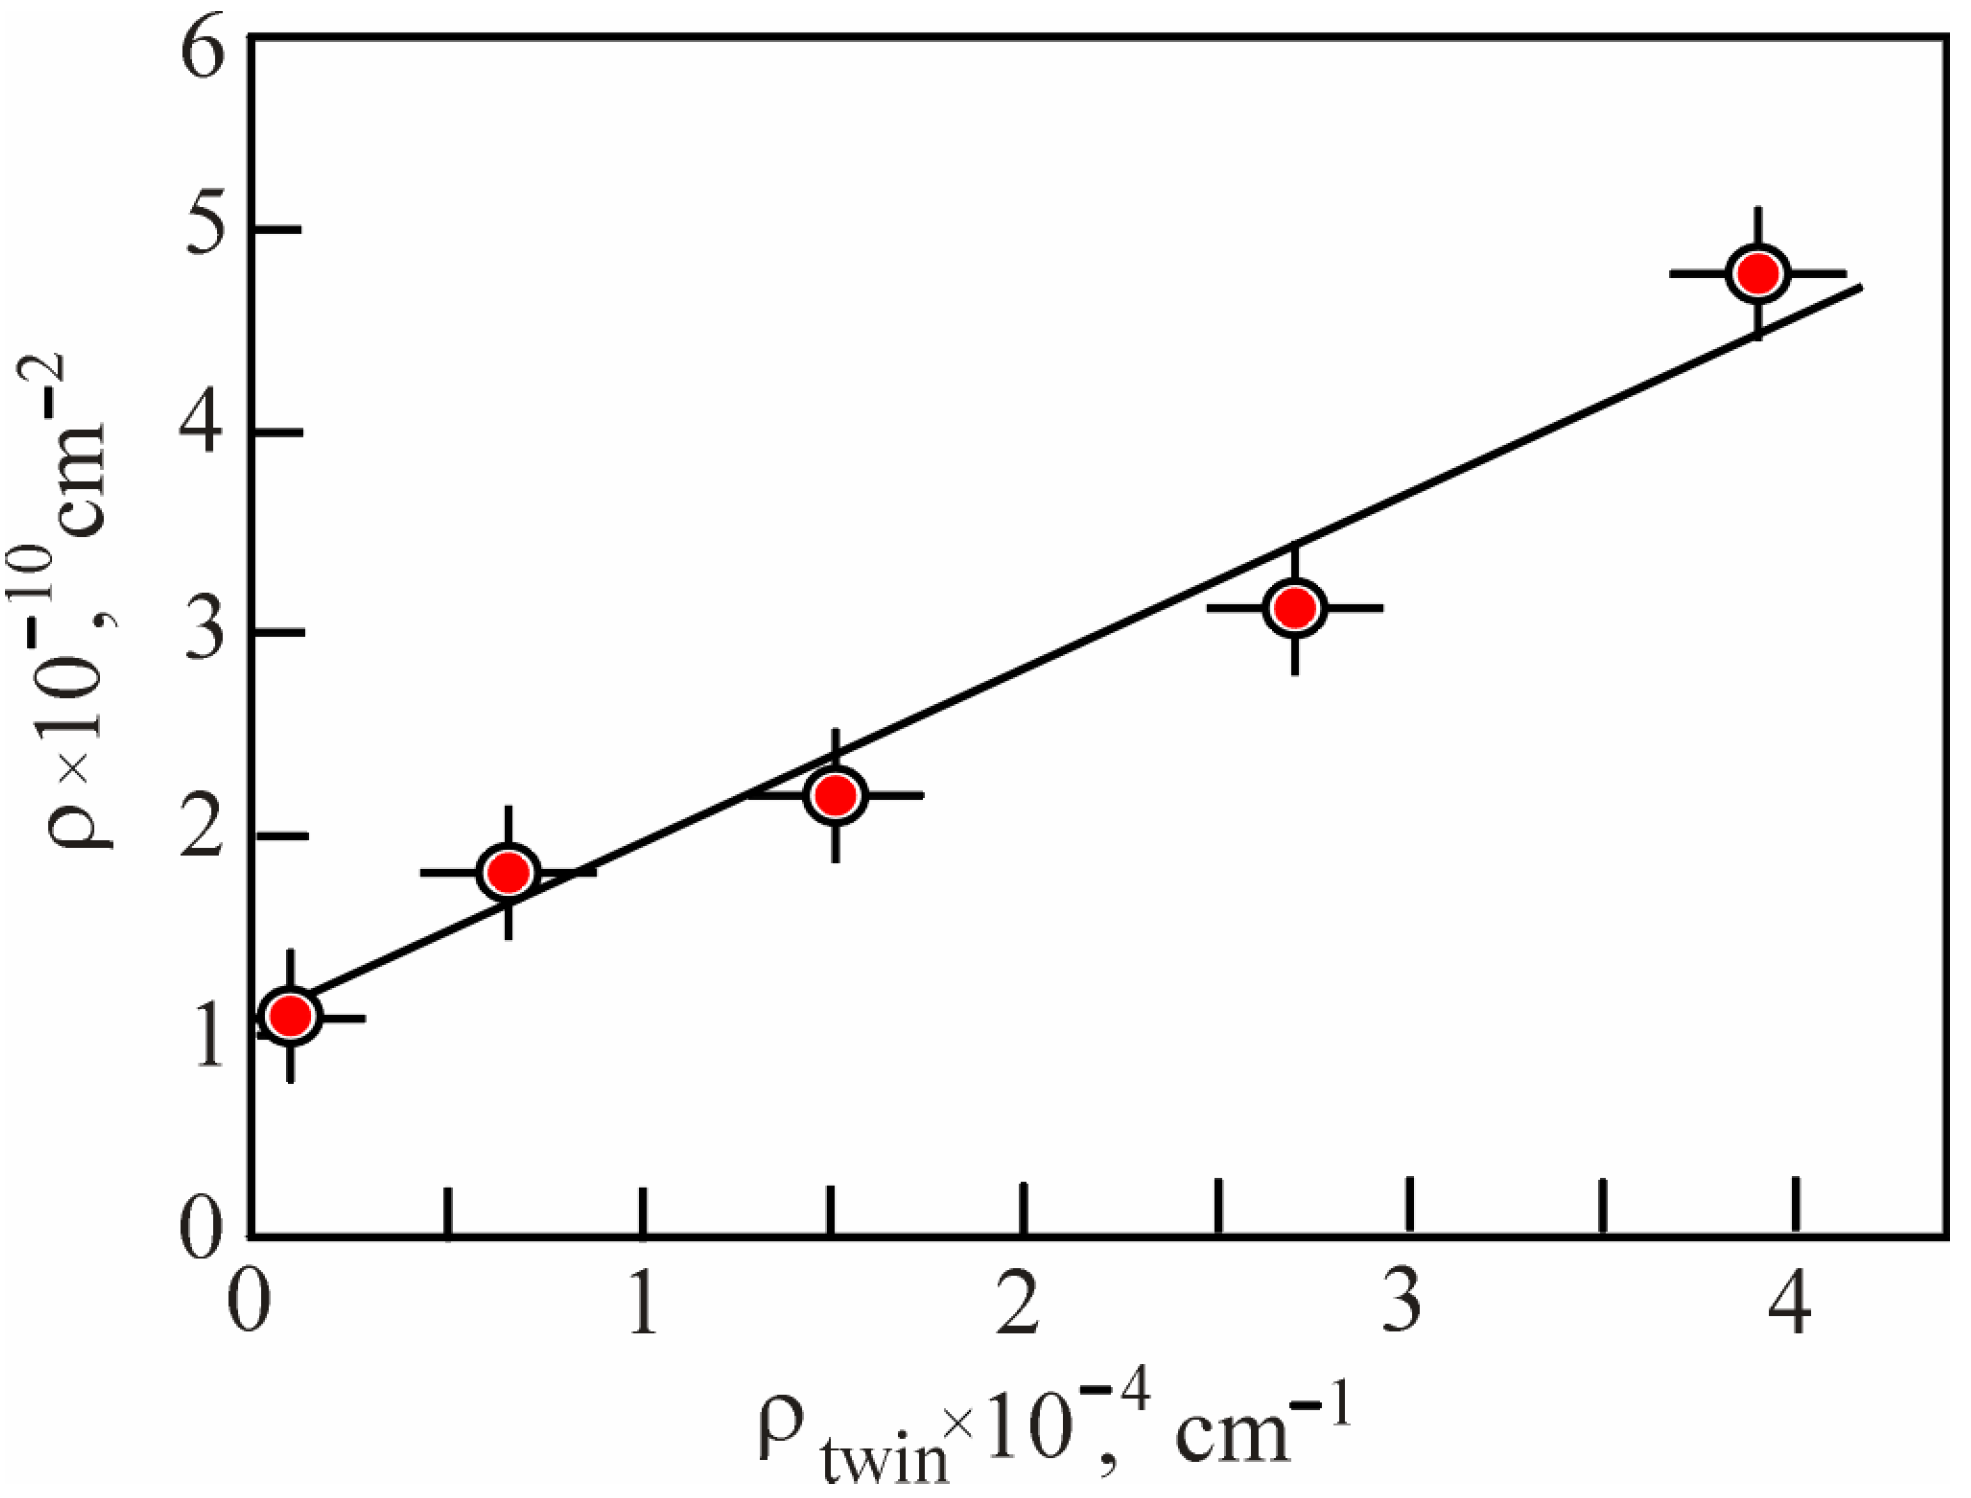
Packets of twins also affected the σ′barrier contribution. The data reported in [27] clearly describe the formation of twin packs found on the TEM images obtained in this study (Figure 1 and Figure 2). Entanglement of dislocations was observed at the twin–matrix boundary, reflecting the strong deceleration of dislocations. At the same time, dislocation-free boundaries of twins existed simultaneously, the quantity of which was much greater [27]. Thus, barrier deceleration meant that the flow stress (σ) was directly proportional to the density of twins, ρtw. This fact reflected well a dependence shown in Figure 13.
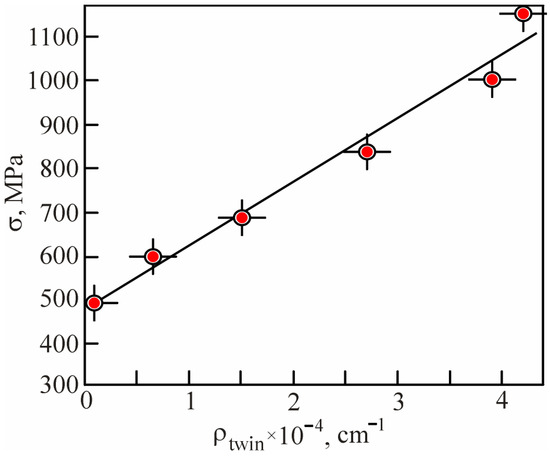
Figure 13.
The dependence of the flow stress (σ) on the density of twins (ρtwin) in the Hadfield steel.
Elastic fields could be calculated in several ways. Firstly, they could be calculated from the total scalar density of dislocations [66,76,83]:
where αdis is a parameter characterizing the elastic interaction of dislocations.
Secondly, they could be calculated from the density of excess or geometrically necessary dislocations [65,66,67,84,85]:
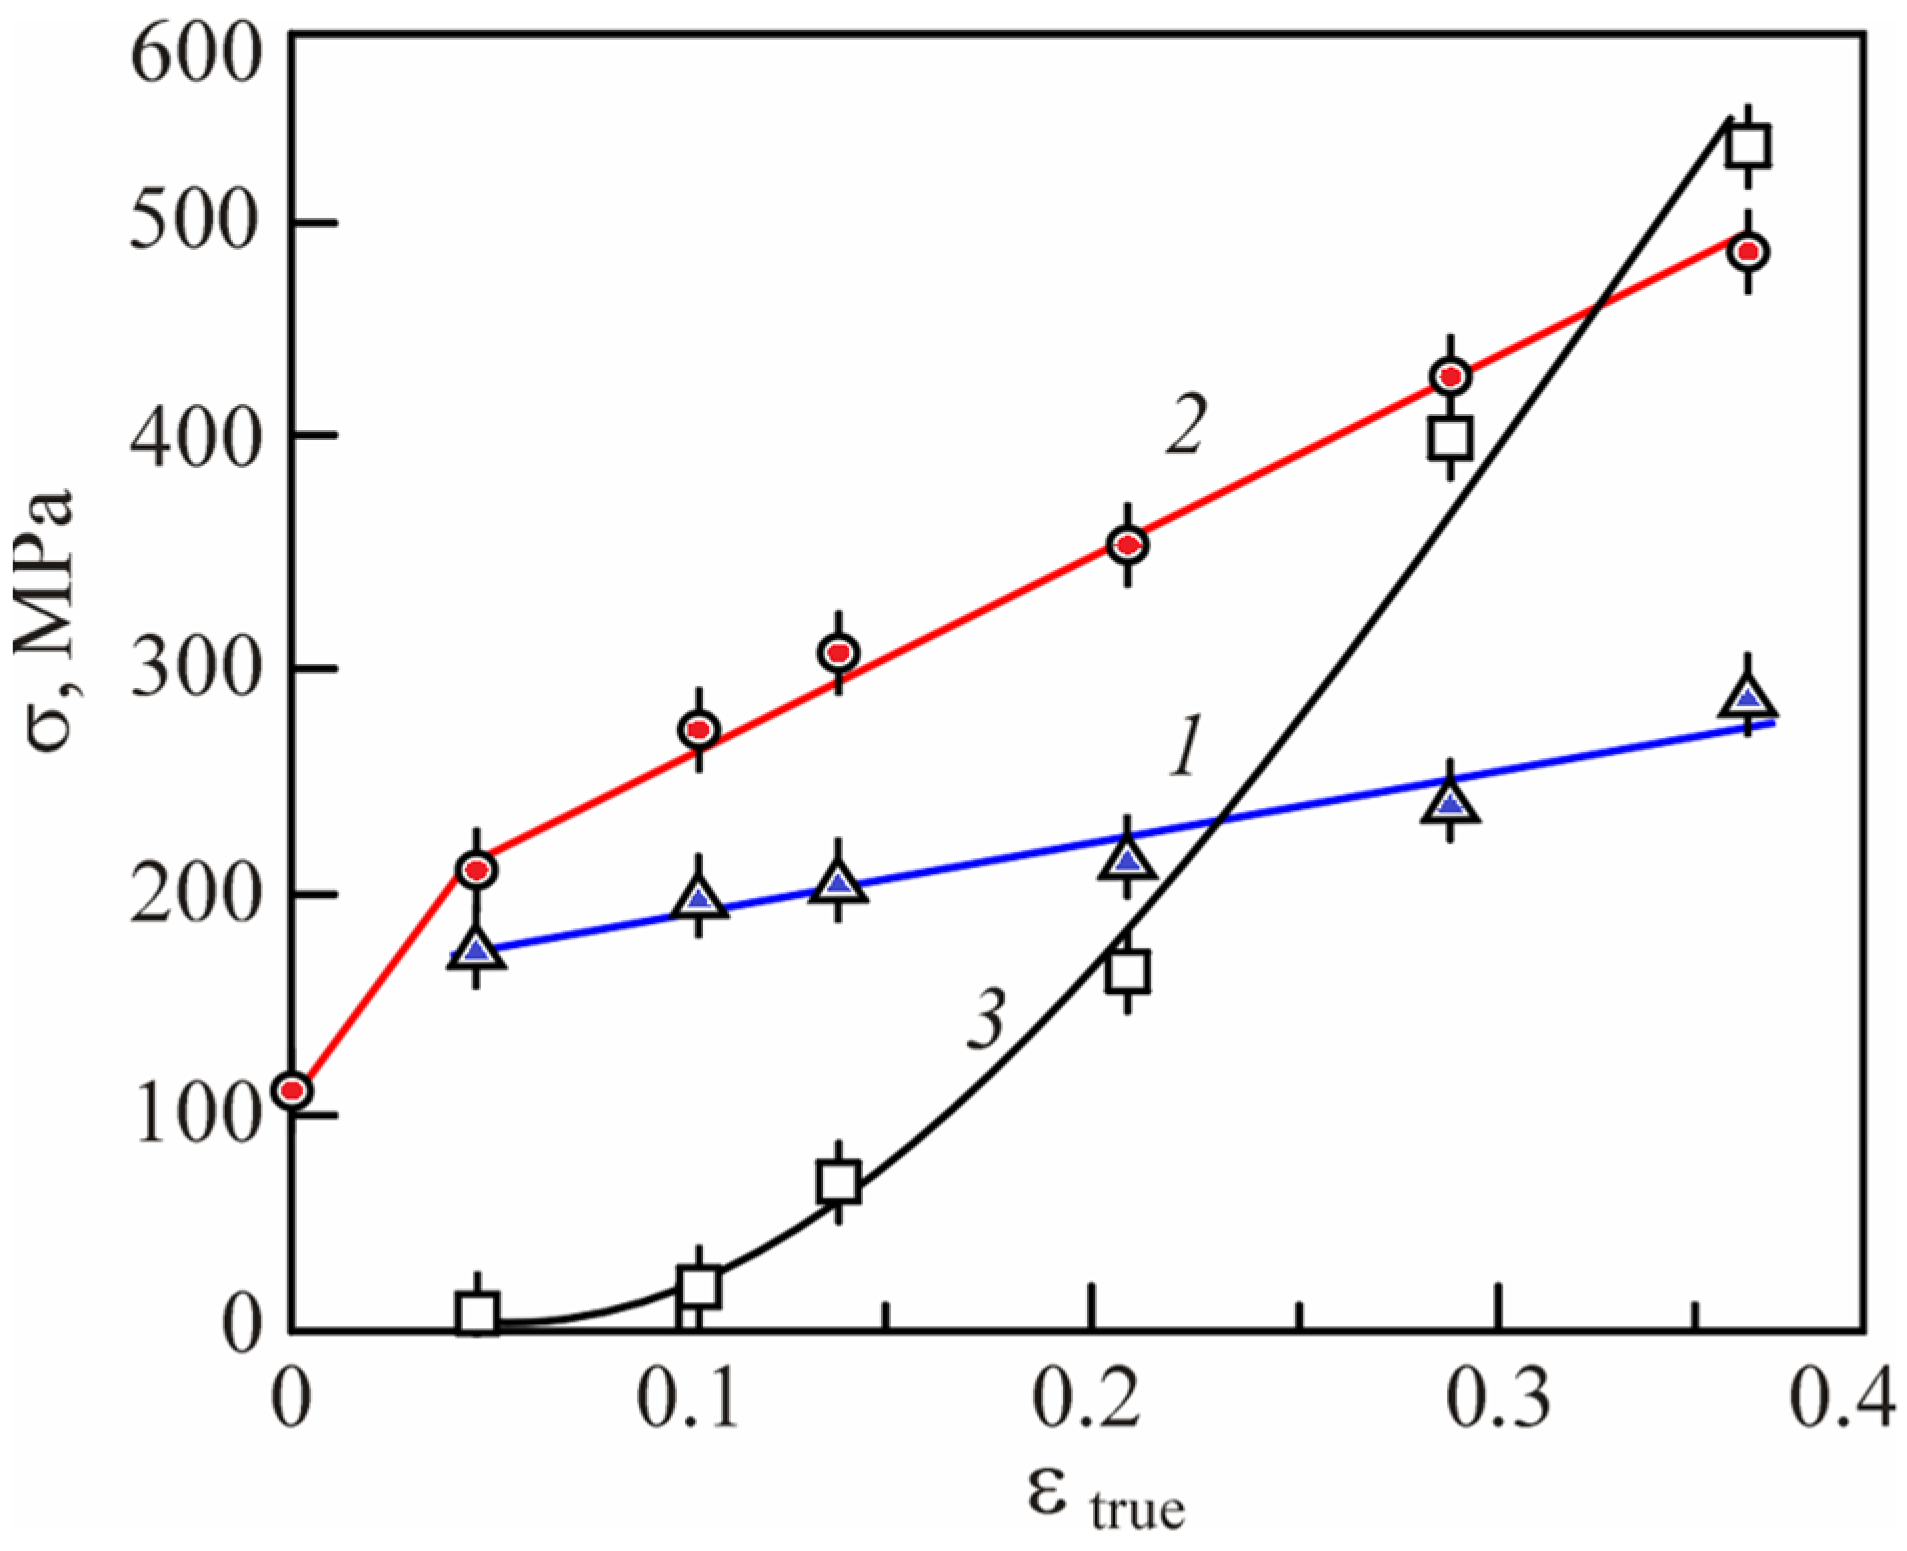
which is shown in Figure 14.
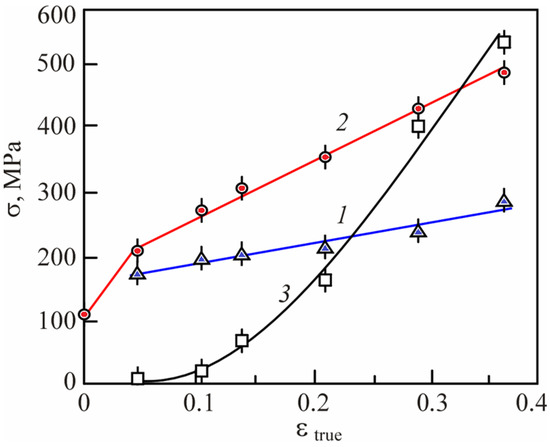
Figure 14.
Contribution of the dislocation-induced elastic stress fields (σdisl) (1), the dislocation substructure (σsubstr) (2) and twins (σtw) (3) in the strain hardening of the Hadfield steel.
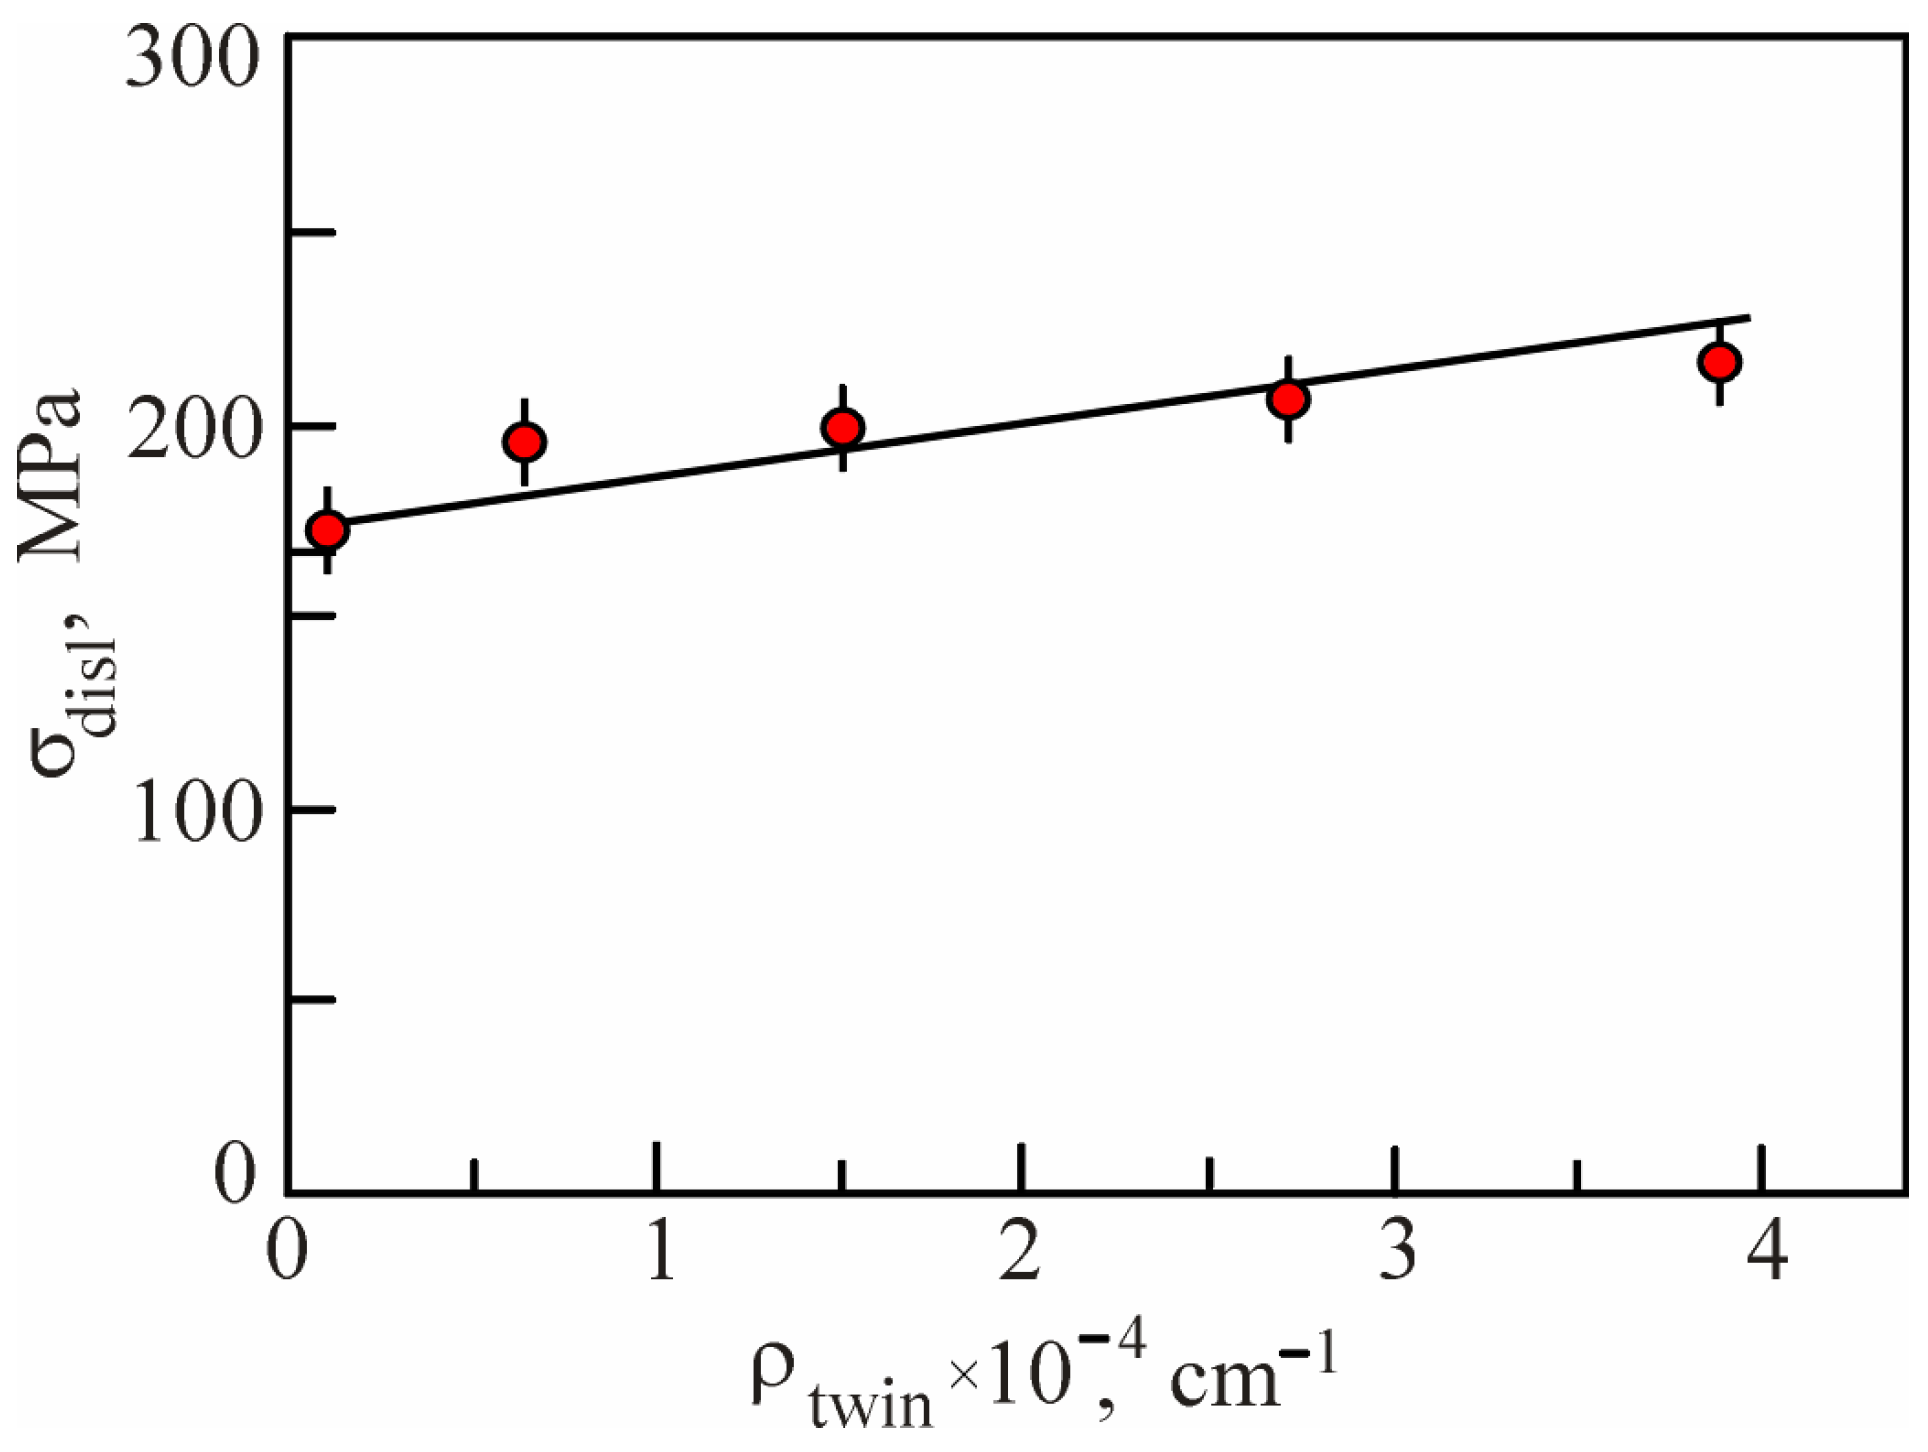
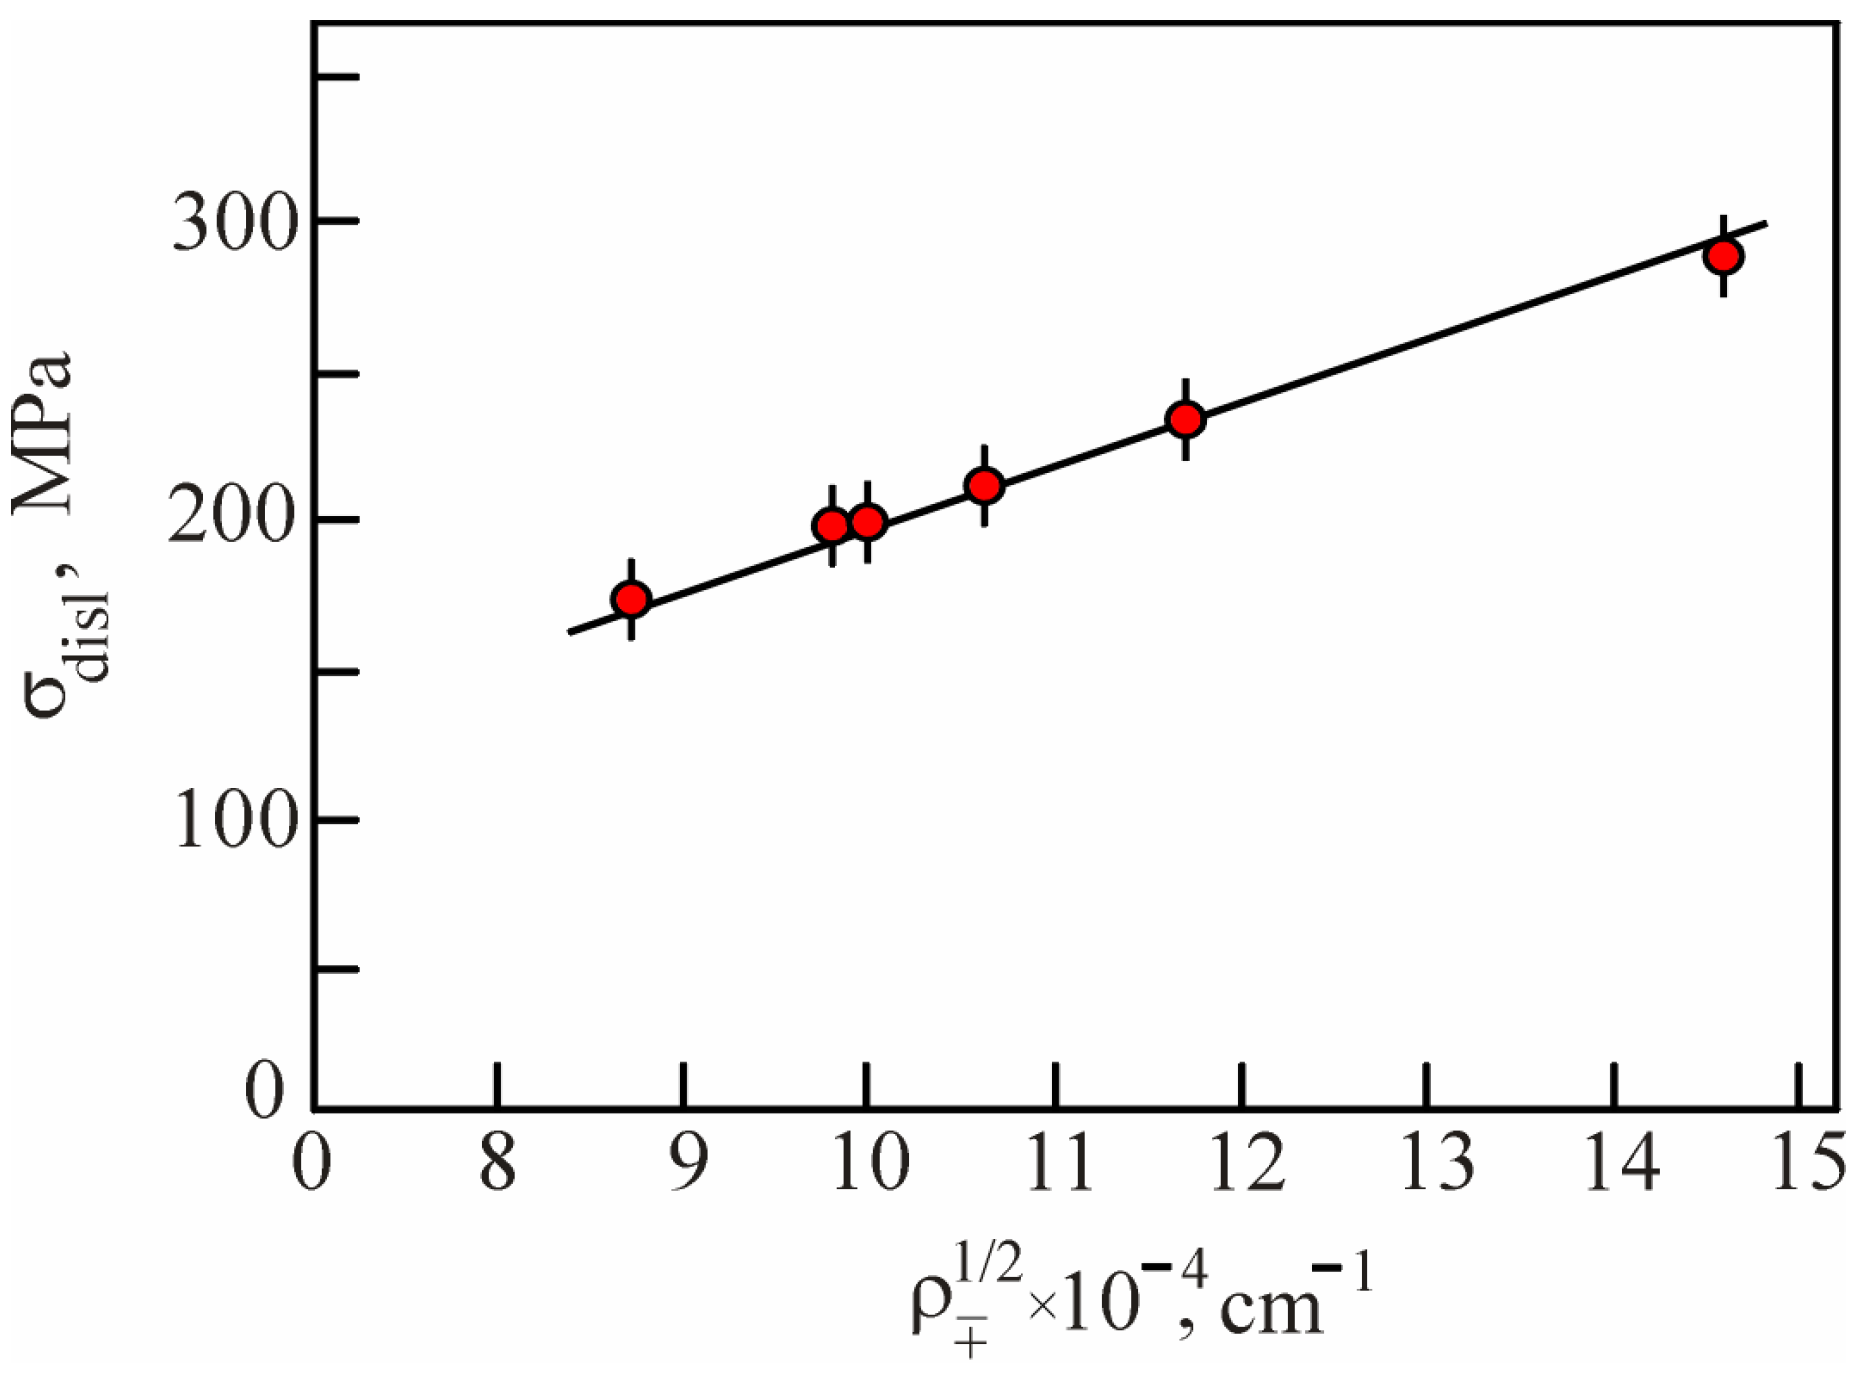
The third mechanism, linking elastic stress fields with the defect substructure, was the σdisl~ρtw proportionality. This fact is well reflected in Figure 15, demonstrating a very important feature of the Hadfield steel’s work hardening, which has not been highlighted by anyone so far. Almost all parameters of its defect substructure changed proportionally to each other. For example, both ρtw and ρ± values were affected by the elastic stress fields (Figure 16).
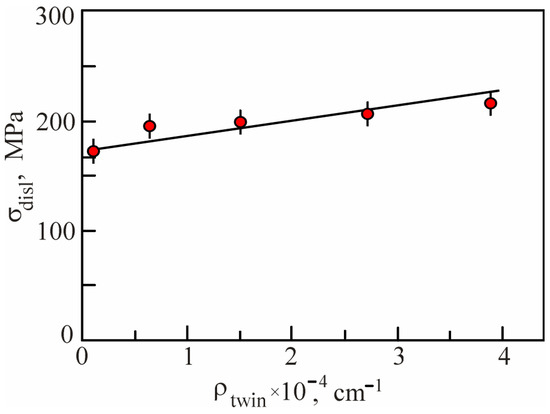
Figure 15.
The dependence of the dislocation-induced elastic stress fields (σdisl) on the density of twins (ρtw) in the Hadfield steel.
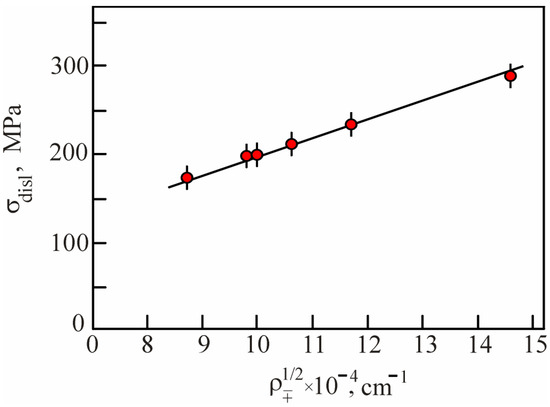
Figure 16.
The dependence of the dislocation-induced elastic stress fields (σdisl) on the excess dislocation density (ρ±) in the Hadfield steel.
The scalar density (ρ) of dislocations and the density of twins (ρtw) were also linearly related (Figure 17). The data presented in Figure 10, Figure 11, Figure 15, Figure 16 and Figure 17 warranted the conclusion that self-organization processes took place in the Hadfield steel, contributing to the hardening mechanisms. This phenomenon was confirmed by the obtained results.
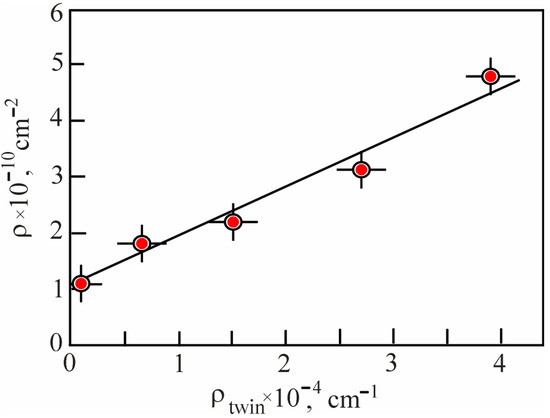
Figure 17.
The dependence of the scalar density of dislocations (ρ) and the density of twins (ρtwin) in the Hadfield steel.
Self-organization in the defect subsystem occurred for a number of reasons. First, dislocations that formed the cellular substructure and were subsequently retarded by the walls of cells. Second, twins decelerated dislocations and affected the dislocation density. The strain inhomogeneity due to twinning contributed to the excess dislocations and curvature–torsion of the crystal lattice. Third, dislocations were decelerated on twins and, vice versa, twins were decelerated on dislocations. Fourth, the entire set of defects formed elastic stress fields.
The above Figure 14 shows both σsustr and σtw dependences along with the σdis one, i.e., hardening associated with the dislocation substructure and microtwins. Due to the high initial scalar density of dislocations, substructural hardening made a stable significant contribution (Figure 14, curve 2), which was already great at the yield point. The contribution of twins to strain hardening was negligible at first, but sharply increased at strains of 15–20% (Figure 14, curve 3). Thereby, as can be seen in Figure 14, three constituents affected the work hardening (σ′):
σ′ = σsubst + σtw + σdisl.
Respectively, both twins and the dislocation substructure contributed to the σdisl value (Figure 15 and Figure 16), although the latter well shielded elastic stress fields. Finally, the strain hardening coefficient of the Hadfield steel could be written as follows:
It can be concluded that the evolution of the defect substructure, the increase in the scalar density of dislocations and the density of twins contributed to work the hardening of the Hadfield steel, which is in full accordance with the up-to-date theory of dislocations and twins. This was the first important result of the study. The second one was that the complex defect substructure of the Hadfield steel formed in a self-organized manner. The conclusion is that solid-solution hardening did not directly contribute to work hardening. However, it was the high σs-s value that ensured deceleration of dislocations and twins, preventing the relaxation of elastic stresses, and thus determining the strain hardening of the Hadfield steel.
5. Conclusions
The obtained results warrant the following conclusions.
The TEM examination of the microstructure in the deformed Hadfield steel revealed a complex defect substructure, formed in a self-organized manner due to the formation of cells, dislocations retarded by their walls, as well as the deceleration of dislocations on twins and, vice versa, the deceleration of twins on dislocations. These factors affected both the average and excess local density of dislocations. Additionally, they resulted in elastic stress fields, which manifested themselves in the curvature–torsion of the crystal lattice. A high level of stresses caused by solid-solution strengthening prevented the relaxation of elastic ones, contributing to strain hardening of the Hadfield steel.
Based on the analysis of the stress–strain curves of the Hadfield steel, their staging was determined. It was shown that the high value of the strain hardening coefficient at stage II of linear strain hardening (about 20%) was caused by the formation of the dislocation cellular substructure. The beginning of the intensive microtwinning process contributed to the change in the strain hardening coefficient. Hence, it is necessary to consider the contribution of solid-solution strengthening in the strain hardening level when analyzing the deformation behavior of Hadfield steel.
Author Contributions
Conceptualization, N.P., M.S. and A.K.; methodology, N.P. and A.P.; validation, A.P., V.B. and E.N.; formal analysis, A.P. and V.B.; investigation, N.P., E.N. and V.B.; resources, M.S. and A.P.; data curation, E.N., V.B. and M.S.; writing—original draft preparation, A.K. and N.P.; writing—review and editing, M.S.; visualization, V.B.; supervision, M.S.; project administration, N.P. and M.S.; funding acquisition, N.P., A.K. and M.S. All authors have read and agreed to the published version of the manuscript.
Funding
The study was carried out within the framework of the state task of the Ministry of Science and Higher Education of the Russian Federation (projects no. FEMN-2023-0003 and FWRF-2021-0001). The APC was paid with M.S.’s reviewer vouchers.
Institutional Review Board Statement
Not applicable.
Informed Consent Statement
Not applicable.
Data Availability Statement
Data sharing is not applicable to this article.
Conflicts of Interest
The authors declare no conflict of interest. The funders had no role in the design of the study; in the collection, analyses, or interpretation of data; in the writing of the manuscript; or in the decision to publish the results.
References
- Bogachev, I.N.; Egolaev, V.F. Structure and Properties of Ferromanganese Alloys; Metallurgy: Moscow, Russia, 1973. (In Russian) [Google Scholar]
- Sokolov, O.G.; Katsov, K.B. Ferromanganese Alloys; Naukova Dumka: Kiev, Russia, 1982. (In Russian) [Google Scholar]
- Korshunov, L.G. Structural transformations during friction and wear resistance of austenitic steels. Phys. Met. Met. Sci. 1992, 8, 3–21. (In Russian) [Google Scholar]
- Gasik, M.I. Manganese; Metallurgy: Moscow, Russia, 1992. (In Russian) [Google Scholar]
- Wang, X.G.; Wang, L.; Huang, M.X. Kinematic and thermal characteristics of Lüders and Portevin-Le Châtelier bands in a medium Mn transformation-induced plasticity steel. Acta Mater. 2017, 124, 17–29. [Google Scholar] [CrossRef]
- Wang, X.G.; Wang, L.; Huang, M.X. In-situ evaluation of Lüders band associated with martensitic transformation in a medium Mn transformation-induced plasticity steel. Mater. Sci. Eng. A 2016, 674, 59–63. [Google Scholar] [CrossRef]
- Qiu, H.; Inoue, T.; Ueji, R. Experimental measurement of the variables of Lüders deformation in hot-rolled steel via digital image correlation. Mater. Sci. Eng. A 2020, 790, 139756. [Google Scholar] [CrossRef]
- Zhang, M.; Li, L.; Ding, J.; Wu, Q.; Wang, Y.-D.; Almer, J.; Guo, F.; Ren, Y. Temperature-dependent micromechanical behavior of medium-Mn transformation-induced-plasticity steel studied by in situ synchrotron X-ray diffraction. Acta Mater. 2017, 141, 294–303. [Google Scholar] [CrossRef]
- Kwok, T.W.J.; Rahman, K.M.; Xu, X.; Bantounas, I.; Kelleher, J.F.; Dasari, S.; Alam, T.; Banerjee, R.; Dye, D. Design of a high strength, high ductility 12 wt% Mn medium manganese steel with hierarchical deformation behavior. Mater. Sci. Eng. A 2020, 782, 139258. [Google Scholar] [CrossRef]
- Wang, J.-J.; Hui, W.-J.; Xie, Z.-Q.; Zhang, Y.-J.; Zhao, X.-L. Influence of pre-strain on microstructural characteristics and tensile deformation behaviour of a cold-rolled Al-containing medium Mn steel. J. Mater. Sci. 2020, 55, 5296–5310. [Google Scholar] [CrossRef]
- Jeong, M.S.; Park, T.M.; Choi, S.; Lee, S.-J.; Han, J. Recovering the ductility of medium-Mn steel by restoring the original microstructure. Scr. Mater. 2021, 190, 16–21. [Google Scholar] [CrossRef]
- Yan, S.; Li, T.; Liang, T.; Chen, J.; Zhao, Y.; Liu, X. By controlling recrystallization degree: A plain medium Mn steel overcoming Lüders deformation and low yield-to-tensile ratio simultaneously. Mater. Sci. Eng. A 2019, 758, 79–85. [Google Scholar] [CrossRef]
- Benzing, J.T.; Liu, Y.; Zhang, X.; Luecke, W.E.; Ponge, D.; Dutta, A.; Oskay, C.; Raabe, D.; Wittig, J.E. Experimental and numerical study of mechanical properties of multi-phase medium-Mn TWIP-TRIP steel: Influences of strain rate and phase constituents. Acta Mater. 2019, 177, 250–265. [Google Scholar] [CrossRef]
- De Cooman, B.C.; Gibbs, P.; Lee, S.; Matlock, D.K. Transmission electron microscopy analysis of yielding in ultrafine-grained medium Mn transformation-induced plasticity steel. Metall. Mater. Trans. A 2013, 44, 2563–2572. [Google Scholar] [CrossRef]
- Ma, J.; Liu, H.; Lu, Q.; Zhong, Y.; Wang, L.; Shen, Y. Transformation kinetics of retained austenite in the tensile Lüders strain range in medium Mn steel. Scr. Mater. 2019, 169, 1–5. [Google Scholar] [CrossRef]
- Korshunov, L.G.; Chernenko, N.L. Effect of aluminum on structural transformations and wear resistance of Hadfield steel under friction. Phys. Met. Met. Sci. 2018, 119, 746–752. (In Russian) [Google Scholar]
- Ma, Y. Medium-manganese steels processed by austenite-reverted-transformation annealing for automotive applications. Mater. Sci. Technol. 2017, 33, 1713–1727. [Google Scholar] [CrossRef]
- Lee, Y.-K.; Han, J. Current opinion in medium manganese steel. Mater. Sci. Technol. 2015, 31, 843–856. [Google Scholar] [CrossRef]
- Gulyaev, A.P. Pure Steel; Metallurgy: Moscow, Russia, 1966. (In Russian) [Google Scholar]
- Volynova, T.F. High Manganese Steels and Alloys; Metallurgy: Moscow, Russia, 1988. (In Russian) [Google Scholar]
- Lü, Y.; Hutchinson, B.; Molodov, D.A.; Gottstein, G. Effect of deformation and annealing on the formation and reversion of ε-martensite in an Fe–Mn–C alloy. Acta Mater. 2010, 58, 3079–3090. [Google Scholar] [CrossRef]
- Tsakiris, V.; Edmonds, D.V. Martensite and deformation twinning in austenitic steels. Mater. Sci. Eng. A 1999, 273–275, 430–436. [Google Scholar] [CrossRef]
- Park, K.-T.; Jin, K.G.; Han, S.H.; Hwang, S.W.; Choi, K.; Lee, C.S. Stacking fault energy and plastic deformation of fully austenitic high manganese steels: Effect of Al addition. Mater. Sci. Eng. A 2010, 527, 3651–3661. [Google Scholar] [CrossRef]
- Karaman, I.; Sehitoglu, H.; Chumlyakov, Y.I.; Maier, H.J.; Kireeva, I.V. Extrinsic stacking faults and twinning in hadfield manganese steel single crystals. Scr. Mater. 2001, 44, 337–343. [Google Scholar] [CrossRef]
- Nikulina, A.A.; Smirnov, A.I.; Velikoselskaya, E.Y. Structural changes in Hadfield steel under cold deformation. Surface X-ray Synchrotron Neutron Res. 2013, 2, 82–88. (In Russian) [Google Scholar] [CrossRef]
- Wan, X.; Liu, G.; Yang, Z.; Chen, H. Flash annealing yields a strong and ductile medium Mn steel with heterogeneous microstructure. Scr. Mater. 2021, 198, 113819. [Google Scholar] [CrossRef]
- Popova, N.A.; Klopotov, A.A.; Nikonenko, E.L.; Trishkina, L.I.; Cherkasova, T.V.; Volokitin, G.G.; Loskutov, O.V.; Borodin, V.I.; Potekaev, A.I. Strengthening mechanisms and specifics of strain stages in high-manganese austenitic Hadfield steel. Basic Probl. Mater. Sci. 2022, 19, 423–436. (In Russian) [Google Scholar] [CrossRef]
- Panin, V.E. Physical mesomechanics of materials. Solid State Mech. 1999, 5, 88–107. (In Russian) [Google Scholar] [CrossRef]
- Golenkov, V.A.; Malinin, V.G.; Malinina, N.A. Structural-Analytical Mesomechanics and Its Applications; Mechanical Engineering: Moscow, Russia, 2009. (In Russian) [Google Scholar]
- Barannikova, S.A.; Zuev, L.B. On the features of patterns of localization of plastic deformation at the yield point in single crystals of Hadfield steel. Lett. J. Tech. Phys. 2008, 34, 24–32. (In Russian) [Google Scholar]
- Noskov, F.M.; Kveglis, L.I.; Volochaev, M.N.; Jess, A.V. Scale invariance of the structure of steel 110G13L during self-organization caused by plastic deformation. Fundam. Probl. Mod. Mater. Sci. 2016, 13, 292–303. (In Russian) [Google Scholar]
- Ivanova, V.S.; Balankin, A.S.; Bunin, I.Z.; Oksoghoev, A.A. Synergetics and Fractals in Materials Science; Science: Moscow, Russia, 1994. (In Russian) [Google Scholar]
- Haken, H. Synergetics; Springer: Berlin/Heidelberg, Germany, 1978. [Google Scholar]
- Bobbili, R.; Madhu, V. Flow and fracture characteristics of near alpha titanium alloy. J. Alloy. Compd. 2016, 684, 162–170. [Google Scholar] [CrossRef]
- Trishkina, L.I.; Cherkasova, T.V.; Popova, N.A.; Koneva, N.A.; Gromov, V.E.; Aksenova, K.V. Dislocation Ensemble: Scalar Dislocation Density and Its Components; TSUAB: Tomsk, Russia, 2019. (In Russian) [Google Scholar]
- Saltykov, S.A. Steriometric Metallography; Metallurgy: Moscow, Russia, 1970. (In Russian) [Google Scholar]
- Koneva, N.A.; Kozlov, E.V. Physical nature of stages of plastic deformation. Sov. Phys. J. 1990, 2, 89–106. (In Russian) [Google Scholar] [CrossRef]
- Trefilov, V.I. Strain Hardening and Fracture of Polycrystalline Metals, 2nd ed.; Naukova Dumka: Kiev, Russia, 1989. (In Russian) [Google Scholar]
- Koneva, N.A.; Kozlov, E.V. Modern picture of the stages of plastic deformation. Russ. Phys. J. 2004, 8, 90–98. (In Russian) [Google Scholar]
- Glezer, A.M.; Kozlov, E.V.; Koneva, N.A.; Popova, N.A.; Kurzina, I.A. Plastic Deformation of Nanostructured Materials; Taylor & Francis Group: London, UK, 2017. [Google Scholar]
- Klopotov, A.A.; Potekaev, A.I.; Ustinov, A.M.; Ivanov, Y.F.; Abzaev, Y.A.; Kulagina, V.V. Relationships between characteristics of deformation behavior and evolution of deformation fields in aluminum under uniaxial tension. Russ. Phys. J. 2021, 64, 574–580. [Google Scholar] [CrossRef]
- Narita, N.; Yamamoto, A.; Umemoto, T.; Takamura, J.I. Anelastic effect due to deformation twins in Cu-Ge alloy crystals. J. Jpn. Inst. Met. 1978, 42, 1190–1199. [Google Scholar] [CrossRef]
- Miura, S.; Takamura, J.J.; Narita, N. Orientation dependence of the flow stress for twinning in silver crystals. In Proceedings of the International Conference on Strength of Metals and Alloys, Tokyo, Japan, 4–8 September 1967; pp. 555–562. [Google Scholar]
- Jafarian, H.R.; Sabzi, M.; Mousavi Anijdan, S.H.; Eivani, A.R.; Park, N. The influence of austenitization temperature on microstructural developments, mechanical properties, fracture mode and wear mechanism of Hadfield high manganese steel. J. Mater. Res. Technol. 2021, 10, 819–831. [Google Scholar] [CrossRef]
- Adler, P.H.; Olson, G.B.; Owen, W.S. Strain hardening of Hadfield manganese steel. Metall. Mater. Trans. A 1986, 17, 1725–1737. [Google Scholar] [CrossRef]
- Zhilkashinova, A.M.; Skakov, M.K.; Popova, N.A. Relationship between the coefficient of strain hardening and plastic deformation of Hadfield austenitic steel. Bull. Sci. Sib. 2011, 1, 686–691. (In Russian) [Google Scholar]
- Zhang, L.; Guo, P.; Wang, G.; Liu, S. Serrated flow and failure behaviors of a Hadfield steel at various strain rates under extensometer-measured strain control tensile load. Journal of Materials Research and Technology. 2020, 9, 1500–1508. [Google Scholar] [CrossRef]
- Chen, C.; Lv, B.; Feng, X.; Zhang, F.; Beladi, H. Strain hardening and nanocrystallization behaviors in Hadfield steel subjected to surface severe plastic deformation. Mater. Sci. Eng. A 2018, 729, 178–184. [Google Scholar] [CrossRef]
- Zhang, F.; Chen, C.; Lv, B.; Ma, H.; Farabi, E.; Beladi, H. Effect of pre-deformation mode on the microstructures and mechanical properties of Hadfield steel. Mater. Sci. Eng. A 2019, 743, 251–258. [Google Scholar] [CrossRef]
- Hutchinson, B.; Ridley, N. On dislocation accumulation and work hardening in Hadfield steel. Scr. Mater. 2006, 55, 299–302. [Google Scholar] [CrossRef]
- Park, J.; Jo, M.C.; Song, T.; Kim, H.S.; Sohn, S.S.; Lee, S. Ultra-high strength and excellent ductility in multi-layer steel sheet of austenitic hadfield and martensitic hot-press-forming steels. Mater. Sci. Eng. A 2019, 759, 320–328. [Google Scholar] [CrossRef]
- Chen, C.; Zhang, F.C.; Wang, F.; Liu, H.; Yu, B.D. Effect of N+Cr alloying on the microstructures and tensile properties of Hadfield steel. Mater. Sci. Eng. A 2017, 679, 95–103. [Google Scholar] [CrossRef]
- Lambakahar, O.O.; Pascal, Y.I. Dislocation structure and strain hardening of high-manganese steel. Sov. Phys. J. 1973, 7, 26–30. (In Russian) [Google Scholar]
- Lambakahar, O.O.; Pascal, Y.I. On the nature of strain hardening of high-manganese austenitic steels. I. Sov. Phys. J. 1977, 1, 158. (In Russian) [Google Scholar]
- Lychagin, D.V.; Filippov, A.V.; Novitskaya, O.S.; Kolubaev, A.V.; Moskvichev, E.N.; Fortunata, S.V.; Chumlyakov, Y.I. Deformation and wear of Hadfield steel single crystals under dry sliding friction. Wear 2022, 488–489, 204126. [Google Scholar] [CrossRef]
- Shtremel, M.A.; Kovalenko, I.A. On the hardening mechanism of Hadfield steel. Phys. Met. Met. Sci. 1987, 63, 172–180. (In Russian) [Google Scholar]
- Georgieva, I.Y.; Gulyaev, A.A.; Kondratieva, E.Y. Deformation twinning and mechanical properties of austenitic manganese steels. Met. Sci. Therm. Treat. Met. 1976, 8, 56–58. (In Russian) [Google Scholar] [CrossRef]
- Gulyaev, A.A.; Tyapkin, Y.D.; Golikov, V.A.; Zharinova, V.S. The fine structure of Hadfield steel. Met. Sci. Therm. Treat. Met. 1985, 6, 14–18. (In Russian) [Google Scholar] [CrossRef]
- Chumlyakov, Y.I.; Shehitoglu, H.; Kireeva, I.V.; Litvinova, E.I.; Astafurova, E.G.; Kalashnikov, I.S. Plastic deformation of Hadfield steel single crystals. Rep. Russ. Acad. Sci. 1998, 361, 185–188. (In Russian) [Google Scholar]
- Karaman, I.; Sehitoglu, H.; Gall, K.; Chumlyakov, Y.I. On the deformation mechanisms in single crystal Hadfield manganese steels. Scr. Mater. 1998, 38, 1009–1015. [Google Scholar] [CrossRef]
- Litvinova, E.I.; Kireeva, I.V.; Zakharova, E.G.; Luzginova, N.V.; Chumlyakov, Y.I.; Sehitoglu, H.; Karaman, I. Twinning in single crystals of Hadfield steel. Phys. Mesomech. 1999, 2, 115–121. (In Russian) [Google Scholar]
- Chumlyakov, Y.I.; Kireeva, I.V.; Litvinova, E.I.; Zakharova, E.G.; Luzginova, N.V.; Efimenko, S.P.; Seyhitoglu, H.; Karaman, I. Twinning in single crystals of Hadfield steel. Rep. Russ. Acad. Sci. 2000, 371, 45–48. (In Russian) [Google Scholar]
- Koneva, N.A. Nature of plastic deformation stages. Soros Educ. J. 1998, 35, 99–105. (In Russian) [Google Scholar]
- Koneva, N.A.; Kozlov, E.V. Dislocation structure and physical mechanisms of hardening of metallic materials. In Perspective Materials; Merson, D.L., Ed.; TSU and MISiS: Tula, Russia, 2006; pp. 267–320. (In Russian) [Google Scholar]
- Koneva, N.A.; Kozlov, E.V. Patterns of substructural hardening. Sov. Phys. J. 1991, 3, 56–70. (In Russian) [Google Scholar]
- Koneva, N.A.; Kozlov, E.V. Physics of substructural hardening. Bull. TSUAB 1999, 1, 21–35. (In Russian) [Google Scholar]
- Strunin, B.N. On the distribution of internal stresses in the case of a random arrangement of dislocations. Phys. Solid State 1967, 9, 805–812. (In Russian) [Google Scholar]
- Hirsh, P.B.; Howie, A.; Nicholson, R.B.; Pashley, D.W.; Whelan, M.J. Electron Microscopy of Thin Crystals; Butterworths: London, UK, 1965. [Google Scholar]
- Kozlov, E.V.; Lychagin, D.V.; Popova, N.A.; Trishkina, L.I.; Koneva, N.A. Long-range stress fields and their role in the deformation of structurally inhomogeneous materials. In Physics of Strength of Heterogeneous Materials; Physical-Technical Institute: Leningrad, Russia, 1988; pp. 3–13. (In Russian) [Google Scholar]
- Cottrell, A.H. Dislocations and Plastic Flow in Crystals; Clarendon Press: Oxford, UK, 1953. [Google Scholar]
- Zhilkashinova, A.M.; Skakov, M.K.; Kozlov, E.V.; Popova, N.A. Investigation of the influence of C and Mn on the structural-phase state of the 110G13L hardened steel matrix. Bull. Natl. Acad. Sci. Repub. Kazakhstan. Phys.-Math. Ser. 2008, 2, 13–16. (In Russian) [Google Scholar]
- Zhilkashinova, A.M.; Skakov, M.K.; Popova, N.A. Second phases formed in Fe-Mn-C alloys. Issues Mater. Sci. 2010, 64, 48–54. (In Russian) [Google Scholar]
- Popov, L.E.; Koneva, N.A.; Tereshko, I.V. Strain Hardening of Ordered Alloys; Metallurgy: Moscow, Russia, 1979. (In Russian) [Google Scholar]
- Mitchel, T.E. Dislocations and plasticity in single crystals of face-central cubic metals and alloys. In Progress in Applied Material Research; A Heywood Book: London, UK, 1964; Volume 6, pp. 117–237. [Google Scholar]
- Nabarro, F.R.N.; Basinski, Z.S.; Holt, D.B. The plasticity of pure single crystals. Adv. Phys. 1964, 13, 193–323. [Google Scholar] [CrossRef]
- Friedel, J. Dislocations; Pergamon Press: Oxford, UK, 1964. [Google Scholar] [CrossRef]
- Staker, M.R.; Holt, D.L. The dislocation cell size and dislocation density in copper deformed at temperatures between 25 and 700 °C. Acta Metall. 1972, 20, 569–579. [Google Scholar] [CrossRef]
- Nes, E. Modelling of work hardening and stress saturation in FCC metals. Prog. Mater. Sci. 1997, 41, 129–193. [Google Scholar] [CrossRef]
- Raj, S.V.; Pharr, G.M. A compilation and analysis of data for the stress dependence of the subgrain size. Mater. Sci. Eng. 1986, 81, 217–237. [Google Scholar] [CrossRef]
- Kozlov, E.V.; Trishkina, L.I.; Daneliya, G.V.; Tsypin, M.I. Effect of the solid-solution concentration on the type and parameters of the dislocation structure formed in deformation of Cu-Mn alloys. Sov. Phys. J. 1991, 10, 60–66. (In Russian) [Google Scholar] [CrossRef]
- Koneva, N.A.; Lychagin, D.V.; Starenchenko, V.A.; Kozlov, E.V. Patterns of the formation and evolution of the cellular dislocation substructure of FCC metals and single-phase solid solutions and their quantification. Deform. Fract. Mater. 2006, 9, 24–32. (In Russian) [Google Scholar]
- Holt, D.L. Dislocation cell formation in metals. J. Appl. Phys. 1970, 41, 3197–3201. [Google Scholar] [CrossRef]
- Zeger, A. Mechanisms of sliding and hardening in cubic face-centered and hexagonal close-packed metals. In Dislocations and Mechanical Properties of Crystals; Publishing House of Foreign Literature: Moscow, Russia, 1960; pp. 179–268. (In Russian) [Google Scholar]
- Kozlov, E.V.; Popova, N.A.; Koneva, N.A. The role of geometrically necessary dislocations in the micro-range of grain and fragment sizes. Perspect. Mater. 2011, 12, 231–237. (In Russian) [Google Scholar]
- Kozlov, E.V.; Popova, N.A.; Koneva, N.A. Dislocation structure and its components in steel of martensite class. News. Ferrous Metallurgy. 2015, 58, 61–70. [Google Scholar] [CrossRef]
Disclaimer/Publisher’s Note: The statements, opinions and data contained in all publications are solely those of the individual author(s) and contributor(s) and not of MDPI and/or the editor(s). MDPI and/or the editor(s) disclaim responsibility for any injury to people or property resulting from any ideas, methods, instructions or products referred to in the content. |
© 2023 by the authors. Licensee MDPI, Basel, Switzerland. This article is an open access article distributed under the terms and conditions of the Creative Commons Attribution (CC BY) license (https://creativecommons.org/licenses/by/4.0/).

