Article

Numerical Simulation of the Mechanical Properties and Fracture of SiCp/6061Al Composite Materials Based on Microstructure

School of Materials Science and Engineering, Henan Polytechnic University, No. 2001 Century Avenue, Jiaozuo 454003, China
*
Author to whom correspondence should be addressed.
Metals 2023, 13(6), 1016; https://doi.org/10.3390/met13061016
Submission received: 2 May 2023 / Revised: 19 May 2023 / Accepted: 23 May 2023 / Published: 25 May 2023

Abstract

:
SiCp/6061Al composites with volume fractions of 5%, 10%, and 15% were prepared by the vacuum hot pressing sintering. Their microstructure and fracture morphology were observed and analyzed with an optical microscope and a scanning electron microscope. The elastic–plastic behavior of the 6061Al matrix in the composites was studied by using the load–displacement curve obtained by the nanoindentation test, and the plastic constitutive equation was established. The representative volume element (RVE) model was established based on the geometric characteristics of the SiC particles identified by using image processing technology from the metallographic structure. The deformation and fracture process of the SiCp/6061Al composites under the uniaxial tensile load was simulated microscopically, and the microscopic deformation and fracture characteristics and mechanical properties of SiCp/6061Al composites under different interface strengths and different SiCp volume fractions were revealed.

1. Introduction

Compared with traditional metal materials, particle-reinforced metal matrix composites (PRAMCs) have more prominent advantages in specific strength, specific stiffness, hardness, high temperature strength, and fatigue strength [1,2,3,4]. In addition, the performance of metal matrix composites can be adjusted according to the performance requirements of products, which is impossible for traditional metal materials [5,6,7]. At present, low-volume-fraction SiCp/6061Al composites have gradually replaced traditional materials and are widely used in the aerospace, automotive, and satellite communications industries [8,9,10]. It is of great theoretical significance and engineering value to study the fracture failure behavior of SiCp/6061Al composites with a low volume fraction.
The strength, stiffness, strengthening mechanism, deformation, and fracture behavior of particle-reinforced metal matrix composites are of great significance to meet the harsh service requirements. The finite element method (FEM) based on the RVE model has become a powerful and effective tool to study the deformation and fracture behavior of PRAMCs and to reveal the deformation mechanism and microscopic fracture characteristics [11]. Most research on PRAMCs by finite element simulations has used a simple structural model, in which the particles in the model are treated as spheres, ellipsoids, or regular polyhedrons [12,13,14]. However, in practice, the geometry of most PRAMC reinforcement particles is complex, mainly presenting as irregular polyhedrons. Chawla et al. [15] pointed out that the simplified particle shape cannot present the angular characteristics of the particles. They proposed a method for establishing a finite element model based on the 2D microstructure observed by a scanning electron microscope (SEM). In this paper, the real microstructure of SiCp/6061Al composites is integrated into the RVE model, which can further improve the prediction accuracy of the model.
At present, the constitutive model of the matrix material in the RVE model is mostly obtained directly from the PRAMC matrix raw material [16,17,18,19,20], ignoring the influence of the addition of particles on the microstructure and mechanical properties of the matrix (such as the increase in the dislocation density, the decrease in the grain size, etc.), resulting in the deviation of the prediction results of the RVE model. In order to characterize the mechanical properties of the PRAMC matrix more accurately, the nanoindentation technology was introduced to characterize the mechanical properties of the PRAMC matrix. The indenter of the nanoindentation instrument is in the order of nanometers. When the load is applied to the matrix region of the particle-reinforced composite sample, the influence of the reinforcing particles can be eliminated, so as to accurately characterize the elastoplastic mechanical behavior of the matrix material. Ma et al. [21] tested the mechanical properties of Ti-Al3Ti core-shell particle-reinforced A356 composites Ti-Al2Ti/A356 by the nanoindentation technique and carried out an FEM simulation based on the microstructure. Tran et al. used the nanoindentation technique to determine the elastic–plastic properties of the matrix and demonstrated the effect of the particles on the nanoindentation response [22]. Dao et al. [23]. proposed forward and reverse analysis algorithms for nanoindentation technology and obtained the elastoplastic constitutive model of the tested material. In this paper, the elastoplastic properties of the matrix region of SiCp/6061Al composites were characterized by the method proposed by Dao.
In this paper, the elastic–plastic mechanical properties of SiCp/6061Al composites prepared by powder metallurgy were evaluated by nanoindentation experiments. Based on this, combined with the actual microstructure obtained by microstructure observation (SEM and OM), the finite element model was established to analyze the deformation and fracture process of the SiCp/6061Al composites. The effects of the SiCp volume fractions (5%, 10%, and 15%) and the reinforcement–matrix interfaces’ strength on the tensile deformation and fracture behavior of SiCp/6061Al composites prepared by powder metallurgy process are discussed.

2. Materials and Methods

SiCp/6061Al composites with SiCp volume fractions of 5%, 10%, and 15% were prepared by the vacuum hot pressing sintering method using micron-sized 6061Al powder and SiC particles as the raw materials. The chemical composition of the matrix 6061Al alloy was (wt%) Mg 0.8–1.2, Si 0.4–0.8, Cu 0.15–0.4, Fe 0.7, and Al. The 6061Al powder was microscopically spherical, the average particle size was 30 μm, the yield strength was 199 MPa, and the elastic modulus was 69 GPa. The particle size of the SiC ceramic particles (SiCp) was about 14 μm. For uniform mixing of the powders, the mechanical milling process was employed by a high-energy ball mill (QM-3SP2, Nanjing Chishun Technology Development Co., Ltd., Nanjing, China). Powder mixtures with different reinforcement contents (5, 10, and 15 vol%) were milled at 300 rpm for 2 h. For all experiments, a stainless steel ball with a diameter of 10 mm was used as the ball-milling medium, and the ball-to-powder weight ratio of 10:1 was utilized. Argon gas (99.99% pure, Wuhan Newred Trading Co., Ltd., Wuhan, China) was used as the milling atmosphere. The hot pressing sintering process had a sintering temperature of 490 °C, a sintering pressure of 25 MPa, and a holding time of 1 h. The vacuum degree in the furnace was 10−1 Pa. The green body obtained by hot pressing sintering was a small cylinder with a diameter of 30 mm and a height of about 10 mm.
The microstructure and fracture morphology of the samples were observed by an OLYMPUS GX-51 optical microscope (Olympus Corporation, Tokyo, Japan) and a Merlin Compact scanning electron microscope (Carl Zeiss NTS GmbH, Oberkochen, Germany). The quasi-static tensile test was carried out on the CMT5105 electronic universal testing machine (New Sansi (Shanghai) Enterprise Development Co., Ltd., Shanghai, China). The tensile specimen was cut from the center of the billet, with a cross section of 1.4 mm × 1 mm and a gauge length of 2.5 mm. The center of the billet was used to make the samples. The specimen surface was wet ground and polished with diamond sandpaper. The etchant was Kaller reagent (composition: 1% HF + 1.5% HCl + 2.5% HNO3 + 95% water). The indentation depth–load curve of the SiCp/6061Al composite matrix was obtained by a TP-Premier nanoindentation system with a Berkovich diamond indenter (Bruker Corporation, Billerica, MA, USA). The maximum indentation depth of the nanoindentation test was 2 μm, and the loading/unloading rate was 0.02 μm/s. A metallographic specimen can also be used in a nanoindentation test. However, in order to avoid the influence of the oxide layer on the surface of the aluminum alloy in a nanoindentation test, the metallographic specimen should be immediately put into a volume fraction of 10% NaOH solution to prevent the formation of the oxide layer after grinding and polishing, and the nanoindentation experiment should be carried out as soon as possible. Each test was repeated 4 times to avoid the contingency of the test data.
The finite element software used in this work is Abaqus2012 (Dassault Systèmes, Aachen, Germany).

3. The Plastic Constitutive Equation of 6061Al

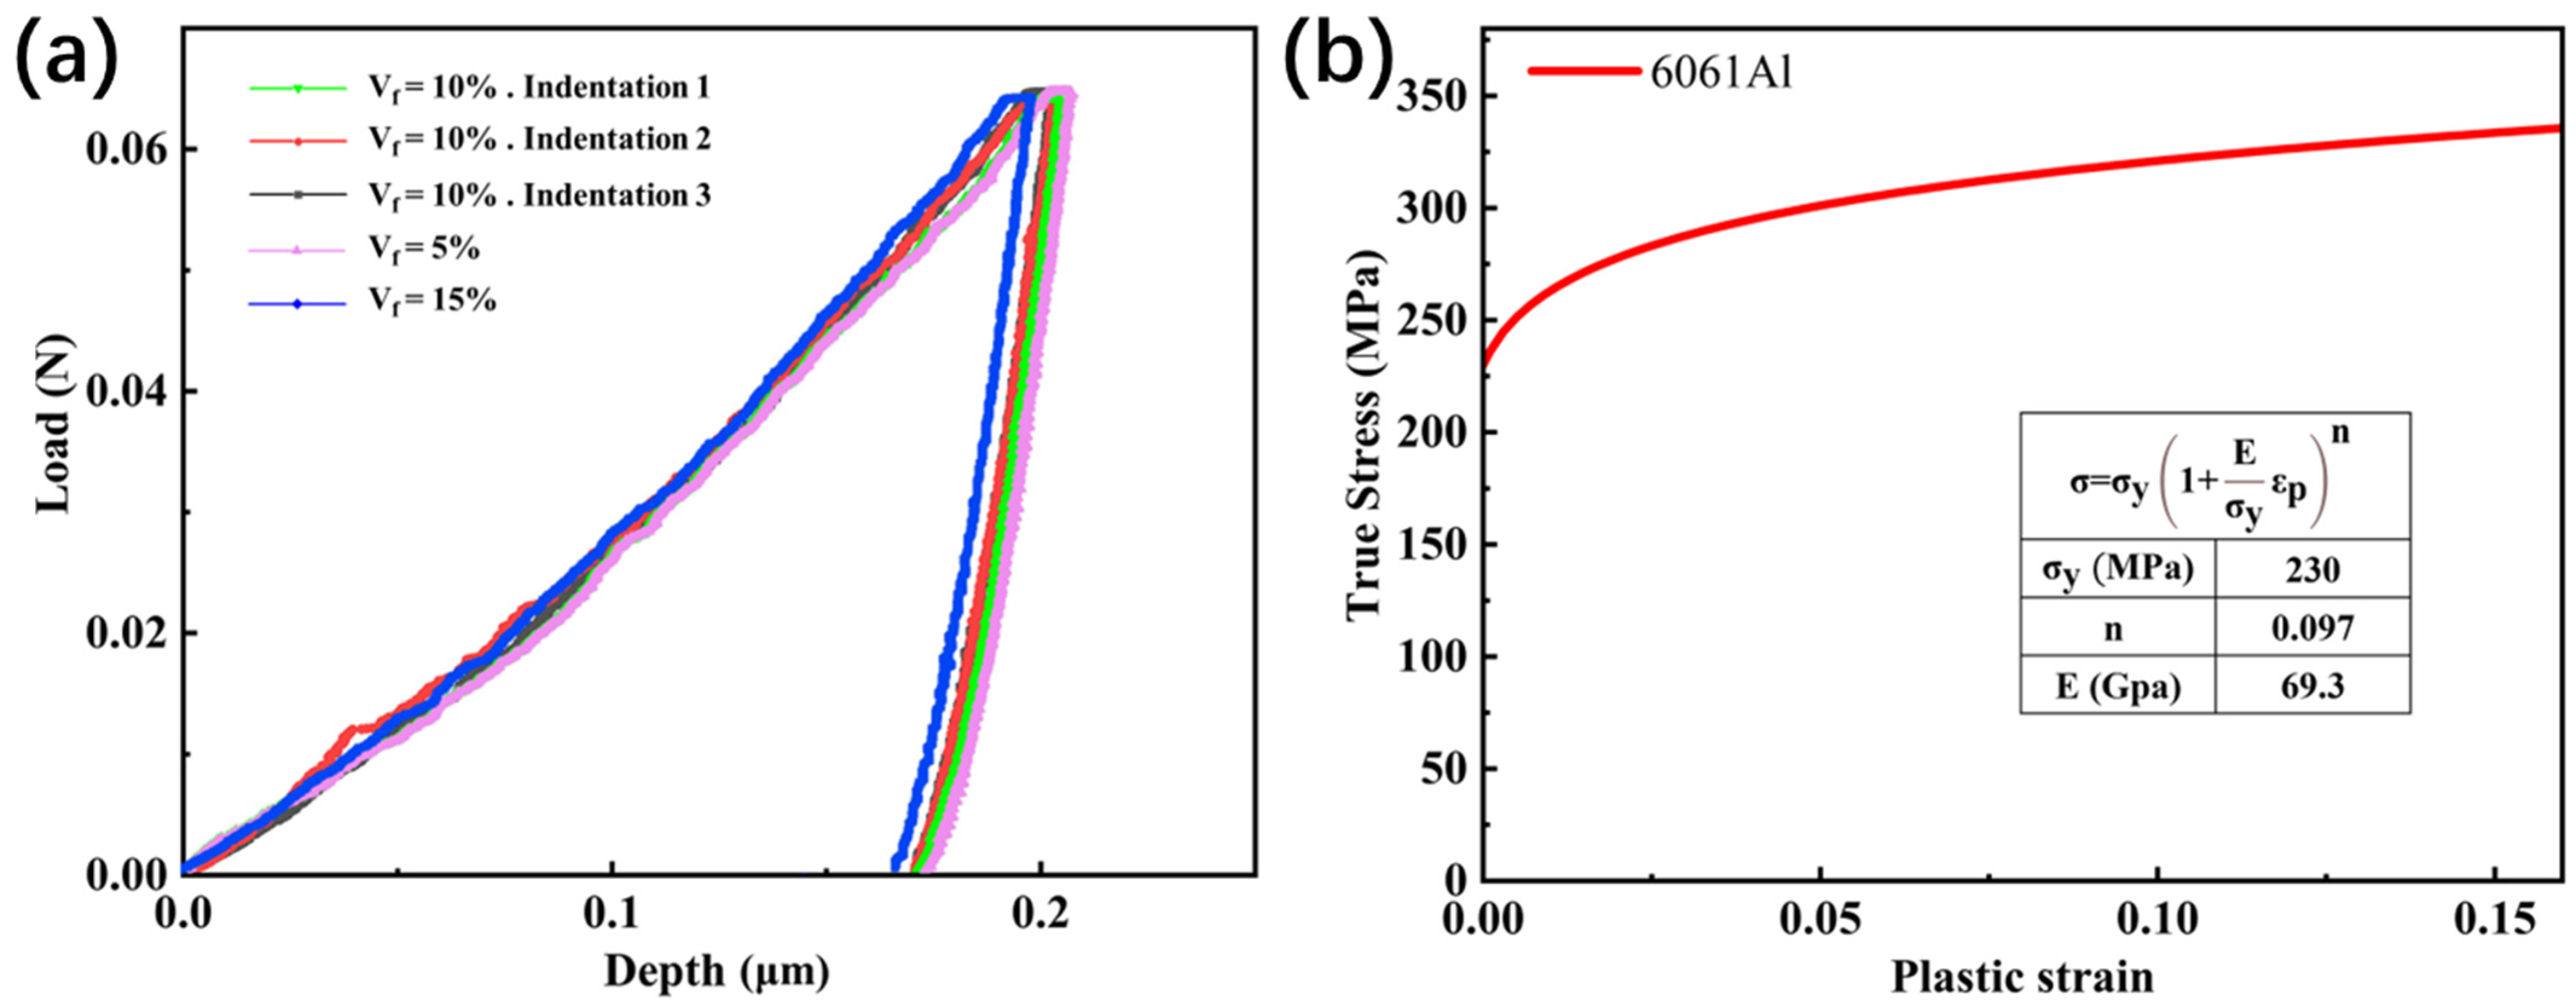
3.1. Constitutive Model of 6061Al Matrix

Particle reinforced SiCp/6061Al composites are not homogeneous materials from a microscopic point of view. Due to the introduction of the particle-reinforced phase, the microstructure and mechanical properties of the 6061Al matrix material change greatly. The strengthening mechanism mainly includes fine grain strengthening, dislocation strengthening, and dispersion strengthening. Therefore, it is of great significance to study the deformation and fracture process of the SiC/6061Al composites by the finite element method.
Dao et al. [23] proposed a reverse analysis algorithm for obtaining the elasticity and plasticity from the load–displacement curve obtained from the nanoindentation experiments. The inverse analysis algorithm assumes that the plastic behavior of the metal can be described by Equation (1):
σ = σ y ( 1 + E σ y ε p ) n ,
where σ y is the yield stress, ε p is the plastic strain, and n is the strain hardening exponent. E is the Young’s modulus.
The load–depth (P-h) response of elastoplastic materials to sharp indentations follows Kick’s law:
P ave = P m A m ,
where A m is the indentation projection area corresponding to the maximum load, and P m is the maximum pressure applied by the indenter.
The hardness is defined as the average contact pressure:
P = C h 2
where C is the loading curvature, that is, the slope of the depth load curve in the loading stage in Figure 1a. h is the indentation depth, and P is the pressure.
The characteristic Young’s modulus E * used in the calculation of the mechanical properties of the tested sample is defined as:
E * = [ 1 v 2 E + 1 v i 2 E i ] 1 ,
where E i is the Young’s modulus of the indenter, and v i is the Poisson’s ratio of the indenter. For the diamond indenter, E i = 1000 GPa, and v i = 0.07 [23]. E and v are the Young’s modulus and Poisson’s ratio of the measured material, respectively.
Figure 1a shows the loading versus displacement curves of the matrix 6061 aluminium alloy with volume fractions of 5%, 10%, and 15%, and they were basically coincident with each other (the difference of the feature points was within 0.02 μm). In order to reduce the difficulty of calculation, the loading versus displacement curve with a volume fraction of 10% was used to establish the plasticity constitutive model of the matrix 6061 aluminium alloy. At the same time, in order to further improve the accuracy of the measurement results, the values of C (loading curvature), hr/hm (ratio of residual indentation depth to maximum indentation depth), Pave (hardness), hm (Maximum depth of indentation), and other parameters were obtained from the loading–displacement curves of different indentation points of the SiCp/6061Al composite matrix with a volume fraction of 10%, and the average value was obtained. The final values of each parameter are shown in Table 1.
The dimensionless function (π function) in this paper is listed in Equations (5)–(8):
C = σ 0.033 Π 1 ( E * σ 0.033 ) ,
1 d p E * h m d h h m = Π 2 ( E * σ 0.033 , n ) ,
P ave E * = Π 4 ( h r h m ) ,
Π 6 = 1 d p E * A m d h h m = C * ,
σ 0.033 = σ y ( 1 + E σ y 0.033 ) n .
The detailed expression of each π function is given in the appendix of Dao [23]. For the Berkovich indenter, C * is 1.2370 [21].
According to the parameters in Table 1, the parameters in Table 2 were solved by Equations (5)–(9). E * and A m were calculated by Equations (7) and (8), respectively. σ 0.033 and n were solved by Equations (5) and (7), respectively. After obtaining E * , the Young’s modulus E of the composite matrix was solved by Equation (4). Then, σ y was calculated, according to Equation (9).
Table 2 shows the parameters solved by the inverse analysis algorithm. The plastic constitutive equation of the SiCp/6061Al composite matrix was obtained according to the parameters, as shown in Figure 1b. Therefore, σ = 230 ( 1 + 301.3 ε p ) 0.097 .
In the subsequent simulation, the plasticity constitutive model obtained above was input as the material properties of the matrix 6061 aluminium alloy. Compared with the mechanical properties of the 6061Al aluminum powder, the yield strength of the SiCp/6061 matrix with 10% SiCp volume fraction increased by about 31 MPa. Other material properties of the 6061 matrix included the density (2.7 g/cm3) and Poisson’s ratio (0.33) [24].

3.2. Finite Element Experimental Verification

The axisymmetric finite element model was further used to simulate the nanoindentation process to verify the accuracy of the plastic constitutive equation obtained.
The finite element mesh of the nanoindentation is shown in Figure 2a. Local mesh refinement was performed near the indenter to improve the calculation accuracy. The minimum mesh size of the model was 0.1 μm, which consisted of about 12,000 CPE4R units. The sample size was 20 × 15 μm, and the symmetry boundary condition was adopted on the axis of the indenter. The bottom edge was constrained by displacement, and the other edges were free. In order to create the axisymmetric model, the standard triangular pyramid Berkovich diamond indenter tip was equivalent to a conical shape with a cone angle of 115° (the equivalent criterion was that the projection area of the indenter at the same indentation depth was the same). The indenter only retained the downward degree of freedom. The loading process of the indenter was divided into two processes: loading and unloading (the maximum indentation depth of the nanoindentation test was 0.2 μm, and the loading/unloading rate was 0.001 μm/s), and its amplitude changed with time as shown in Figure 2b.
The material properties of the 6061Al obtained by the nanoindentation experiment were used as the sample material properties of the model. The material properties of the diamond indenter only considered the elastic modulus and Poisson’s ratio (1000 GPa, 0.07 [23]), which was approximated as a rigid body. The indentation load–depth curve was directly obtained by outputting the rigid body reaction force (RF) and the rigid body control point displacement (U).
The comparison between the nanoindentation load–depth curve of the SiCp/6061Al composite matrix and that obtained by the finite element calculation is shown in Figure 2c. The good consistency with each other further proves the accuracy of the constitutive model of the SiCp/6061Al matrix obtained by Dao’s inverse analysis algorithm. Figure 2d shows the distribution of the equivalent stress (S) and equivalent plastic strain (PE) of the SiCp/6061Al matrix near the tip of the conical indenter. When the indenter was removed, the indentation depth in the tip region of the indenter was 0.18 μm, which was in good agreement with the experiment.

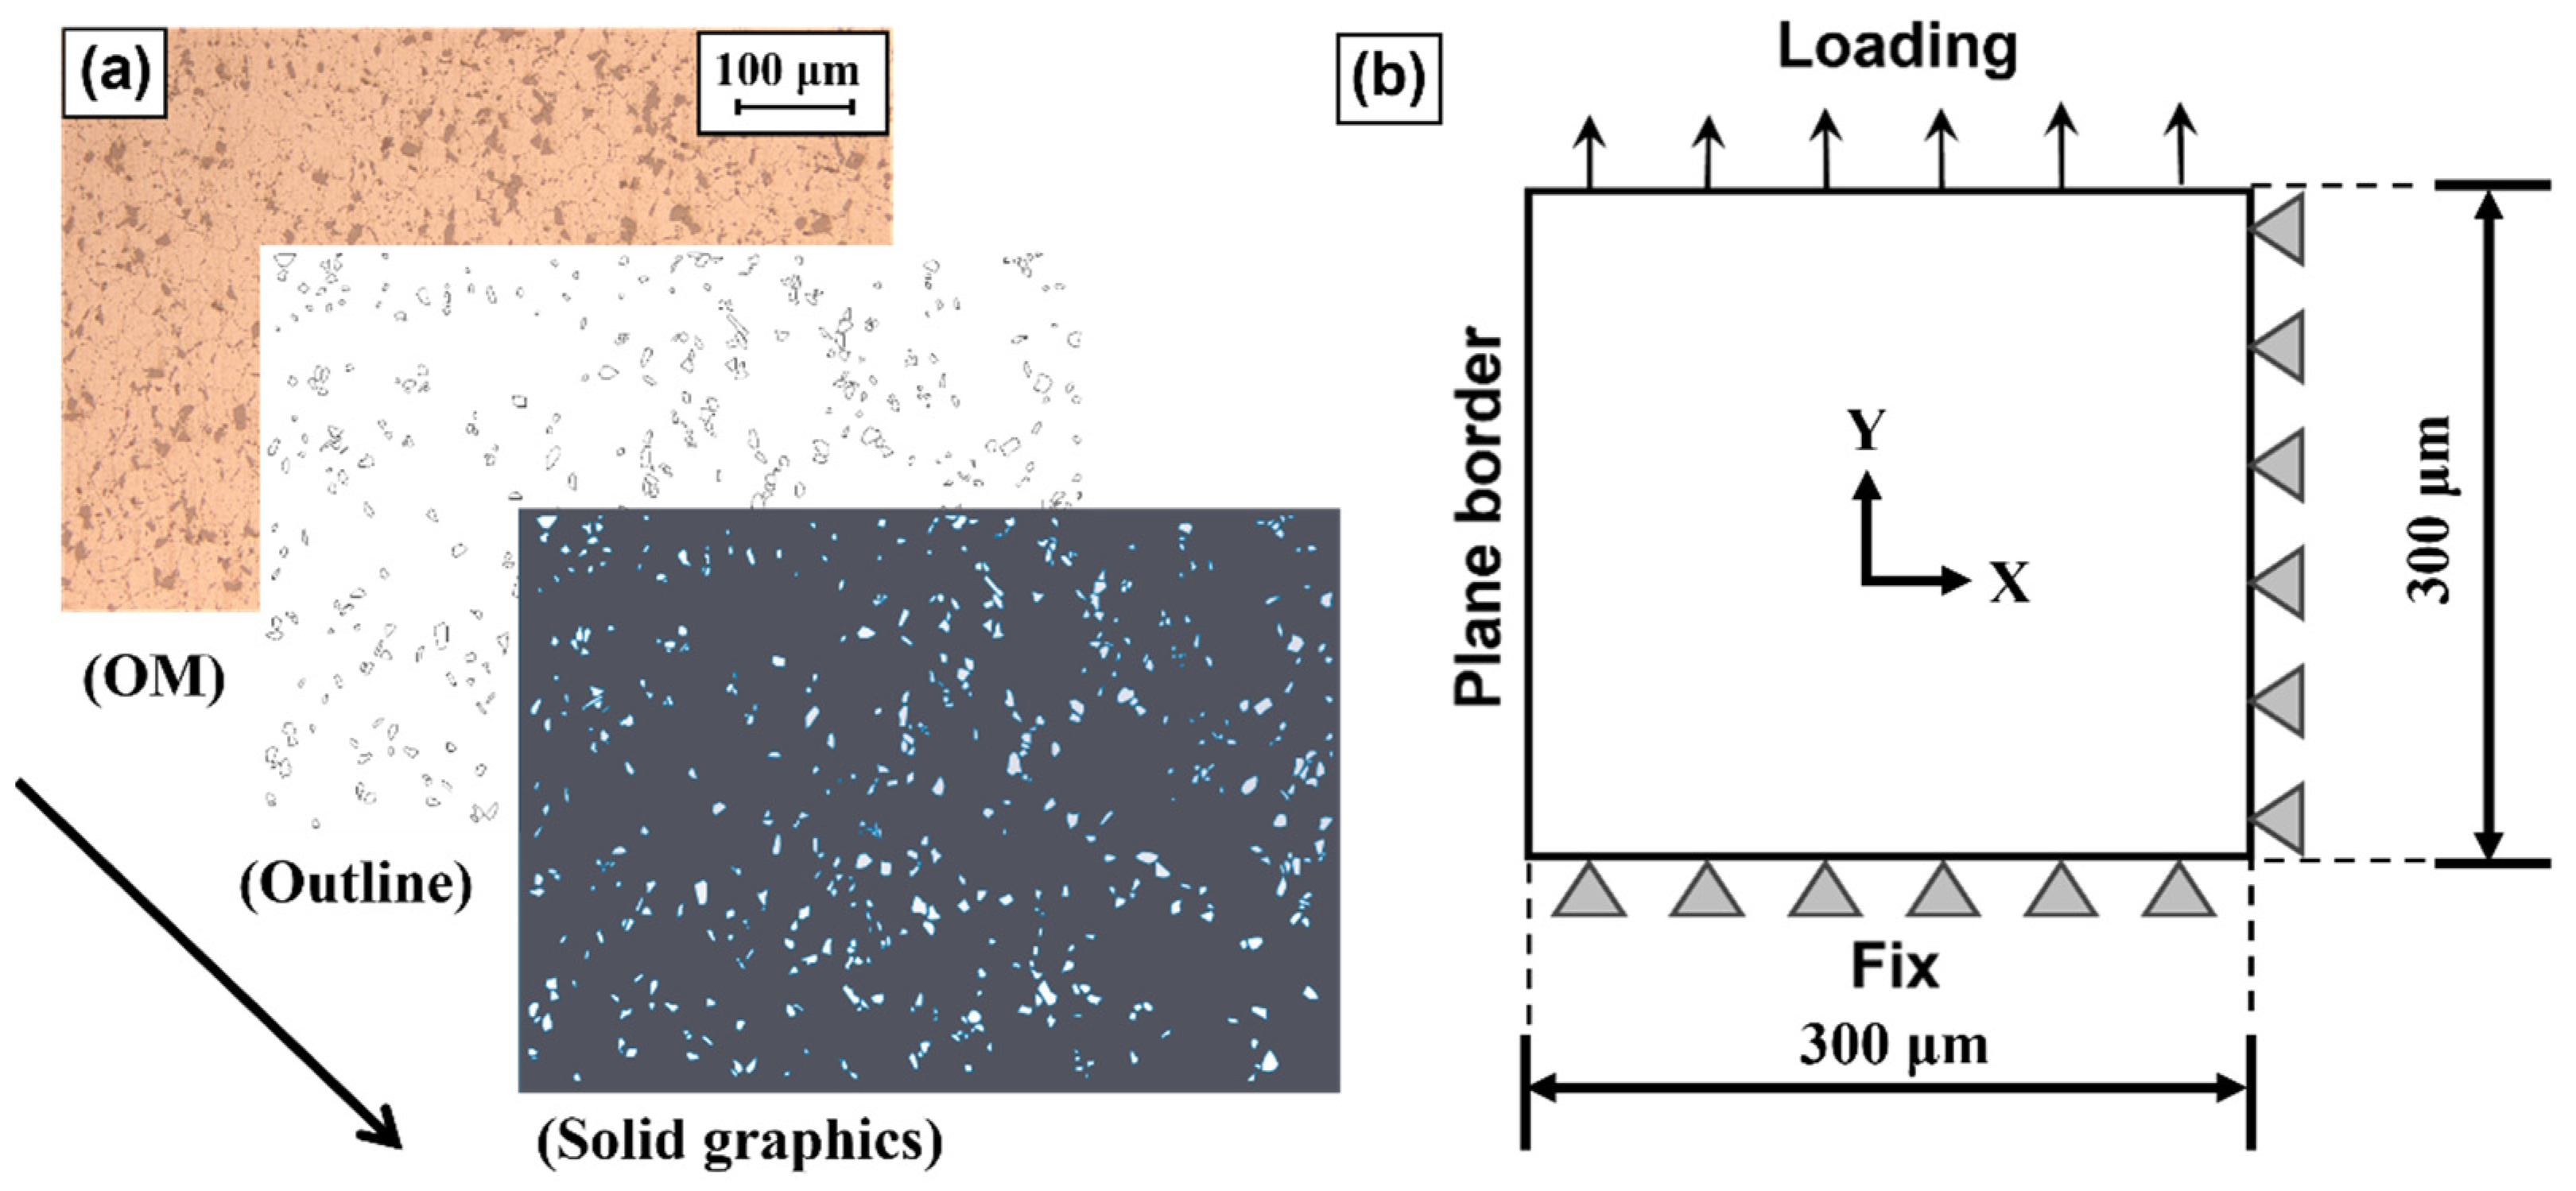
4. RVE Finite Element Model Based on the Microstructure

4.1. RVE Geometric Model and Boundary Conditions

The fracture process of the SiCp/6061Al composites under the tensile load was simulated by the finite element method. A real and reasonable particle geometry model is an important part to improve the accuracy of the calculation results. In this work, the image processing technology was used to identify the shape of the reinforced phase SiCp particles, and it was further introduced into the finite element model. The interface between the SiCp reinforcement and the matrix was modeled as a zero-thickness interface.
The metallographic image of the SiCp/6061Al with a magnification of 100 times was selected as the reference prototype. The geometric features of SiCp/6061Al composites were obtained by using the image recognition tool in the image toolbox of the COMSOL Multiphysics®5.0 (COMSOL, Stockholm, Sweden). The modeling process is shown in Figure 3a. Some research results have shown that when the size of the RVE exceeds 200 μm, the simulation results begin to converge [21]. Considering the computational cost, the size L0 of the RVE model in this simulation was 300 μm.
The RVE model was set to the symmetric boundary condition (SBC). Figure 3b shows the model constraints with the symmetric boundary conditions. The right boundary node of the symmetrical boundary model limited the displacement freedom in the X direction. The left boundary set the displacement difference of the left boundary node in the X direction to be zero with a constraint equation. The lower boundary node only retained the displacement freedom in the X direction. In order to facilitate the postprocessing of the upper boundary of the model, the upper boundary was coupled in the form of RP points, and the displacement load was applied to the RP points with an amplitude of 60 μm. The mesh seed size of the RVE model was 0.8 μm, and the two-dimensional finite element model consisted of about 100,000 CPE4R elements and 2000 COH2D4 elements.

4.2. 6061Al Matrix Material Model

The Johnson–Cook damage model [25] is widely used to simulate the damage behavior of metal materials. It is usually defined by the linear cumulative damage ductile fracture process of metal materials:
D = Δ ε p ε f ,
where Δ ε p is the equivalent plastic strain increment, and D is the damage degree (0 ≤ D ≤ 1). When D = 1, the material completely fails. ε f is the failure strain in the process of material deformation, and its expression is:
ε f = [ D 1 + D 2 exp ( D 3 σ * ) ] ( 1 + D 4 ln ε ˙ 0 ) ( 1 + D 5 T * ) .
In the formula, D1 to D5 are the material-related fracture constants (the respective values are: −0.77, 1.45, −0.47, 0, and 1.6) [24].

4.3. SiC Reinforcement Material Model

SiC particles are brittle materials. Compared with the 6061Al, their elastic modulus and fracture strength are extremely high, and the strain is small during the deformation of the SiCp/6061Al composites. The fracture morphology of Figure 4d did not find the fractured SiC particles to prove this. Therefore, the SiC can be set as an ideal elastic material when simulating the deformation and fracture of SiCp/6061Al composites. The Young’s modulus was 427 GPa, and the Poisson’s ratio was 0.17 [26].

4.4. Tensile-Cracking Constitutive Model of the Interface

The interfacial debonding between the SiCp and 6061Al is the main failure mode of SiCp/6061Al composites. The cohesive zone model proposed by Dugdale (1962) et al. [27]. to describe the debonding and separation behavior of the material interface is widely used to analyze the failure process of known crack propagation paths at the interface of the dissimilar materials and the bonding joints.
The cohesive zone model defines the stress on the crack surface as a function of the crack tip displacement [28], as shown in Equation (12):
T n = { σ max δ n 0 δ                       ( δ δ n 0 ) σ max δ n f δ δ n f δ n 0         ( δ > δ n 0 ) ,
where σ max , δ n ( s , t ) 0 , and δ n ( s , t ) f represent the maximum traction force, ultimate traction force, and failure traction force in the normal and two shear directions, respectively.
The energy released by the crack propagation is called the fracture energy φ. The critical fracture energy φc is the fracture energy exhausted when the bonding interface has completely failed, which is numerically equal to the area enclosed by the traction displacement curve and the X-axis during the traction force drop stage.
The interface strength and fracture energy are very important parameters in the finite element simulation of deformation and fracture for composites; however, it is very difficult to measure. Verification of the experiential values of the interface strength and fracture energy by the finite element simulation is an effective method to determine them in the SiCp/6061Al composites.
In this work, three interfaces with different properties of strong, medium, and weak bonding were set up with reference to the existing literature [29,30,31,32,33]. The interface strength and fracture energy were set, as shown in Table 3:

5. Results and Discussion

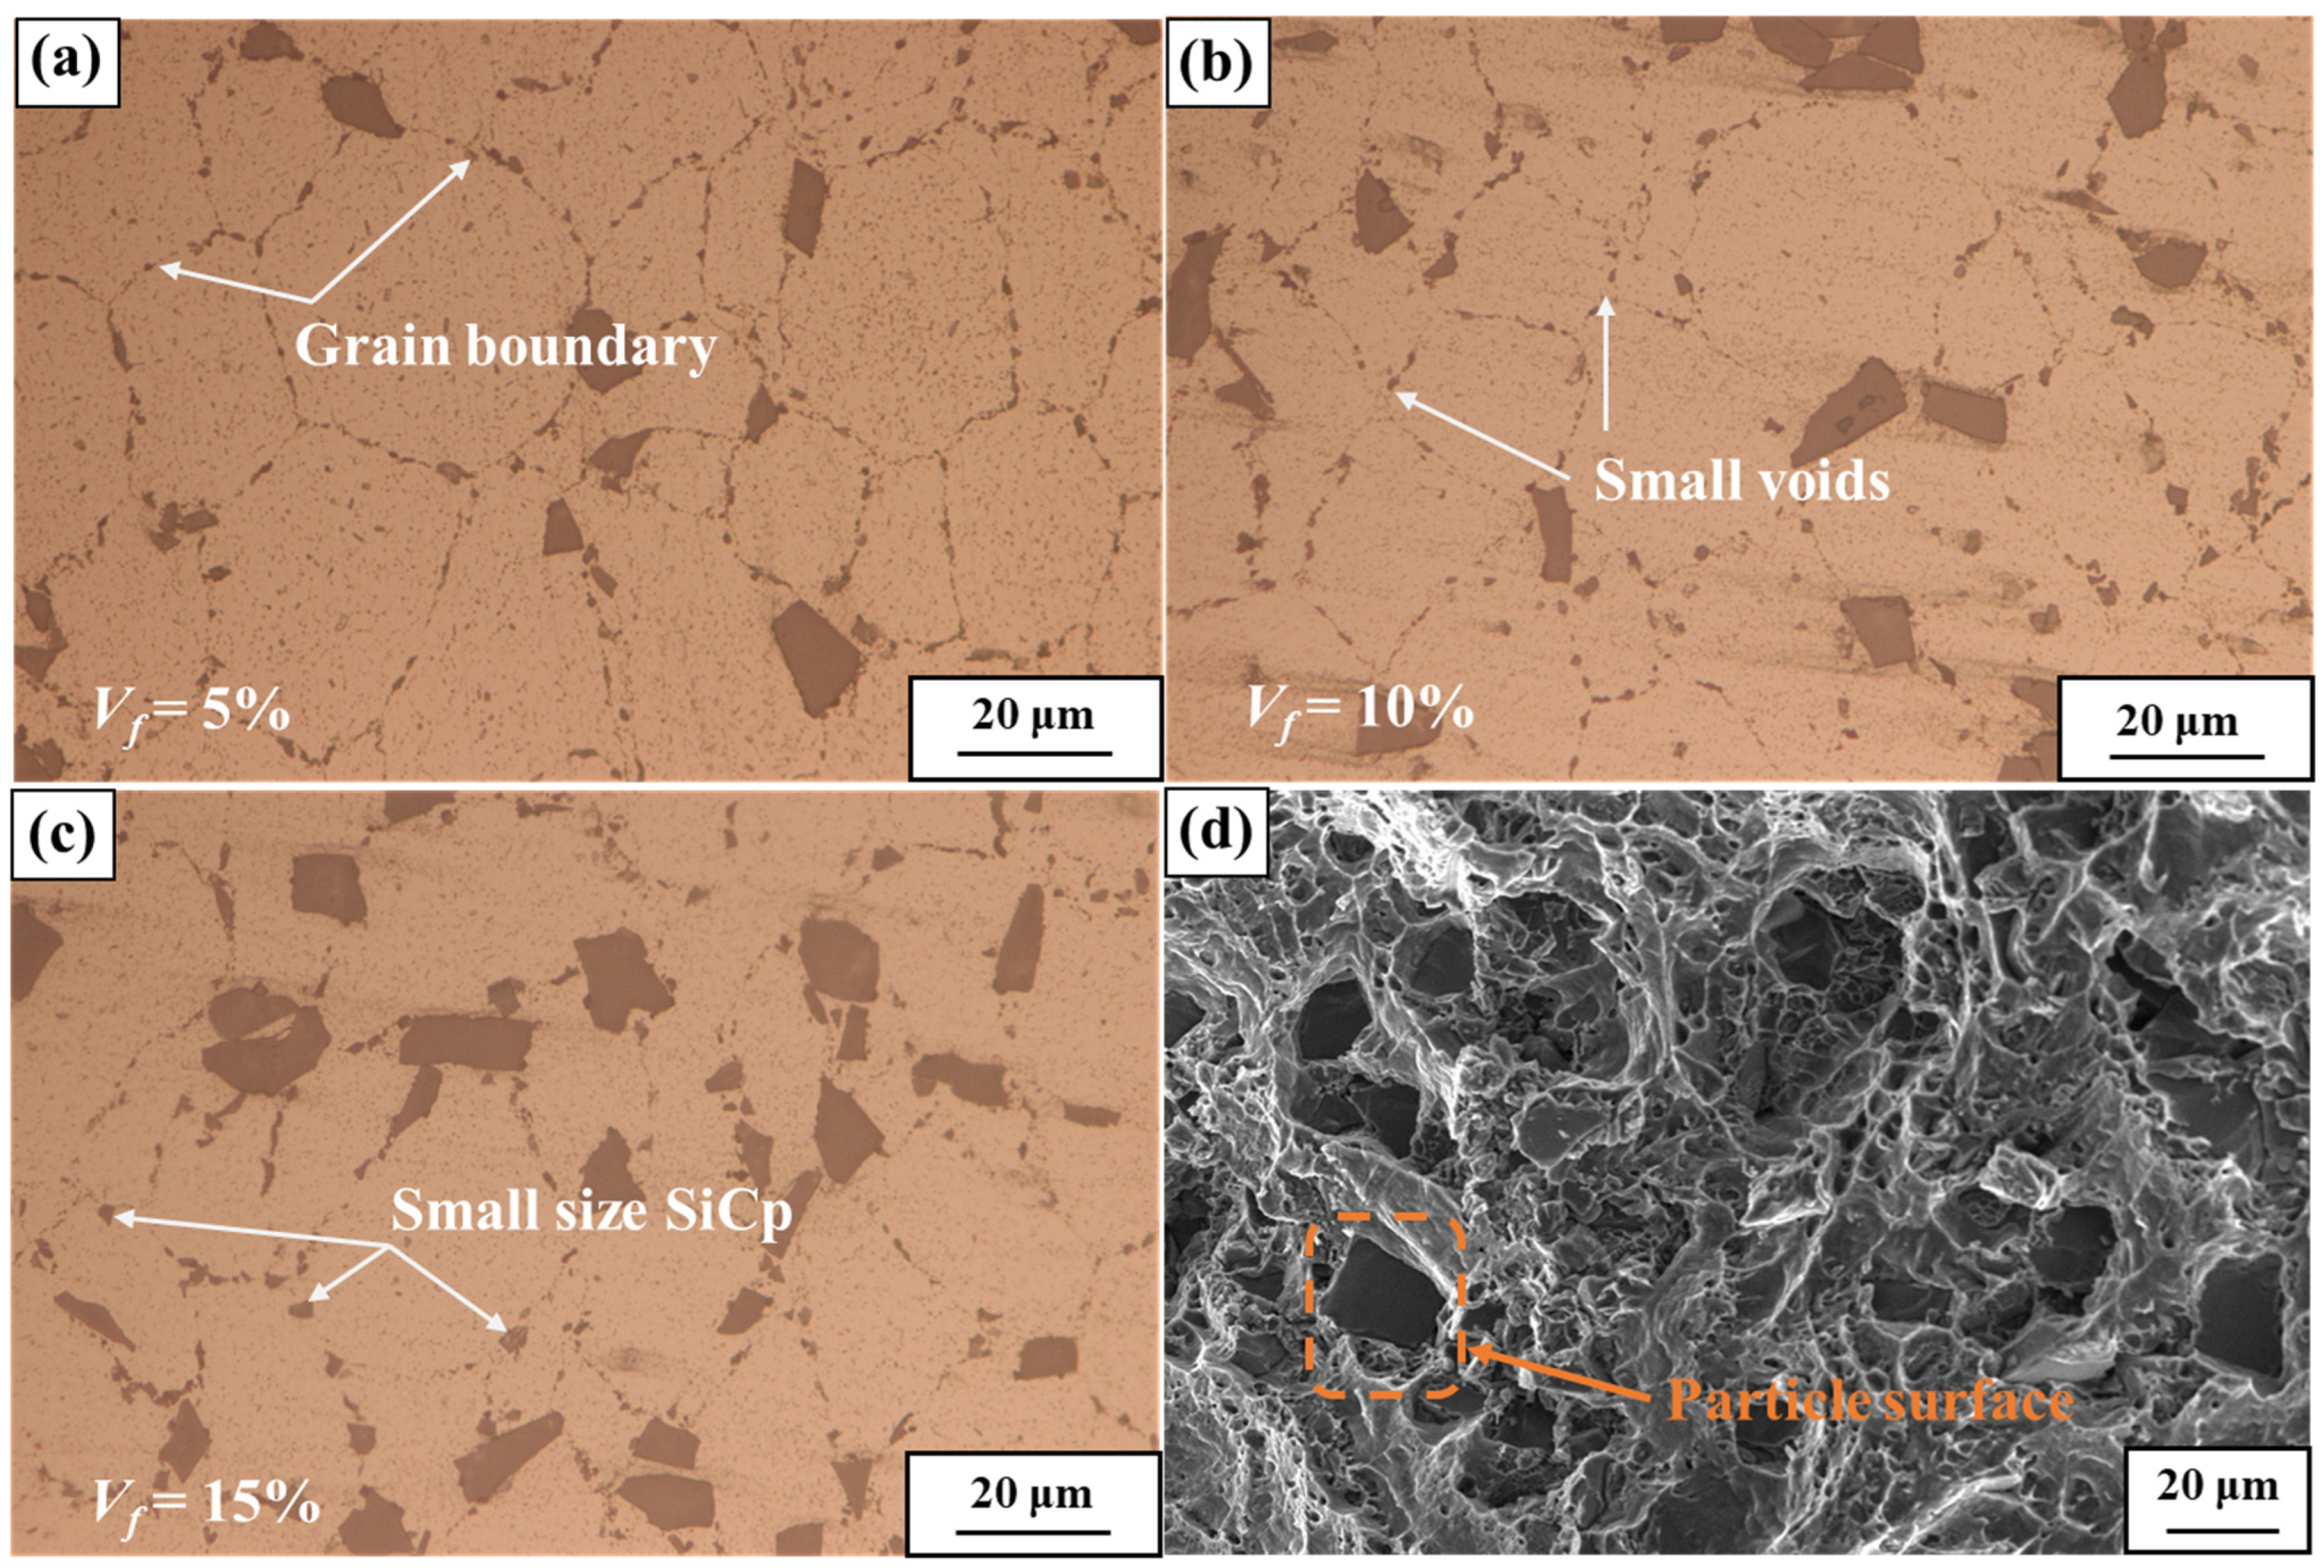
5.1. Microstructure Analysis of the SiCp/6061Al Composites

The typical microstructures of the SiCp/6061Al composites with SiC volume fractions of 5%, 10%, and 15% are shown in Figure 4a–c. The distribution of the SiCp was relatively uniform, and there was no large-scale agglomeration. The contact between individual particles occurred only for the SiCp volume fractions of 10% and 15%. It is worth noting that in addition to the distribution of more broken SiC particles, there were also many micropores on the grain boundaries of the SiCp/6061Al composites with different SiCp contents, and their diameters were mostly about 0.5 μm. This was because during the forming stage of the SiCp/6061Al composites, the gas could not be discharged between the solid aluminum powder particles, and finally the pores uniformly distributed in the grain boundaries were formed. The porosity of the SiCp/6061Al composites was measured by an ED-300C professional digital density meter (Shanghai Qunlong Electronic Technology Co., Ltd., Shanghai, China), and they were 0.84%, 1.18%, and 2.00% with the SiCp volume fractions of 5%, 10% and 15%, respectively. The size of the SiCp particles and the grain size of the 6061Al matrix were collected and analyzed by Image-pro plus 6.0 analysis software (Media Cybernetics Image Technology Company, Rockville, MD, USA). The particle size of the SiCp was mainly concentrated in the vicinity of 2 μm and 12 μm (particle size is equivalent diameter). The grain size of the 6061Al matrix with different SiCp volume fractions was about 30 μm (calculated by the linear intercept method), which is similar to the particle size of the 6061Al powder.
Figure 4d shows the tensile fracture morphology of the composite. As far as the matrix is concerned, there were a large number of dimples in the SiCp-free region of the 6061Al matrix, which belonged to the typical ductile fracture characteristics. As far as the SiCp is concerned, the surface of the bare SiCp was very clean, and there was no impurity and aluminum matrix, which indicates that the bonding strength between the matrix and SiCp was lower than that of the 6061Al and SiCp. The interface failure between the SiCp and 6061Al was the main failure mode of the SiCp/6061Al composites. On the other hand, the SiCp on the fracture surface was basically intact, and no cracks parallel to the tensile axis appeared. This was consistent with the experimental results of Lloyd [34] and others. In summary, the main failure modes of the SiCp/6061Al composites can be divided into two types: the interfacial tearing between the SiCp and the matrix and the ductile fracture of the matrix.

5.2. Effect of the Interfacial Strength on the Stress–Strain Law of the Composites

In order to obtain the influence of the reinforcement–matrix interface properties on the mechanical properties of the SiCp/6061Al composites, the real particle geometry model with a volume fraction of 10% was used, as shown in Figure 5a. The uniaxial tensile nominal stress–strain curves of the SiCp and 6061Al composites are shown in Figure 5b. It can be seen that the mechanical properties of the strong interface model were better than the test results. Increasing the interface strength helped to improve the mechanical properties of the SiCp/6061Al composites.
Figure 6a shows the Mises stress (S, Mises) and plastic strain (PE, Max) cloud map with the medium interface strength under the tensile load at each stage. The black part in the cloud map is the cavity left after the element failure was deleted. For the SiCp-reinforced metal matrix composites, the elastic modulus of the hard particles in the matrix and the reinforcement was different, which led to the strain of the hard particles being much smaller than that of the matrix [4]. Therefore, in the plastic strain cloud map, the particles showed a white state without plastic strain.
The deformation of the model was divided into three stages: a uniform deformation stage, an interface failure stage, and a matrix damage stage [35]. The nominal stress–strain curves of each stage are shown in Figure 6c. Figure 6b is the crack formation process around the failure particles of the medium strength interface model at moments 1, 2, and 3. In the first stage, the model deformed uniformly during the stretching process. At this stage, the stress–strain curve was relatively smooth, and the Mises stress and plastic strain distribution of the matrix part in the model were more uniform. In the second stage, the interface between the SiCp reinforcement and the 6061Al matrix began to be damaged. The interface failure led to a decrease in the bearing capacity of the SiCp particles. The 6061Al matrix near the failure interface also bore most of the load, resulting in a significant increase in the plastic strain. The stress–strain curve began to show obvious jitter. When the uncoordinated deformation of some of the matrix exceeded the deformation ability of the matrix material, the matrix began to be damaged. At this time, in the third stage, the 6061Al matrix was first damaged near the failure interface, and the damage increased and further developed into a crack. This process continued until the model failed completely, as shown in Figure 6a. During the whole deformation process of the model, the 6061Al matrix near the SiCp particles experienced three stages: elastic deformation, plastic deformation, and failure fracture, as shown in moments 1, 2, and 3 of Figure 6b, and this was also verified by the fracture morphology shown in Figure 4d.
As the interface strength increased, the occurrence of the interface failure was delayed during the tensile deformation process, and the corresponding fracture strain also increased. The strain values at the beginning of the three stages under different interface strengths are shown in Table 4. In the strong interface strength RVE model, the interface fracture phenomenon appeared less than the other two boundary condition models, as shown in Figure 7. The fracture strain (14%) of the strong interface strength RVE model was much larger than the test result (7.2%). The fracture strain (5.8%) of the weak interface strength RVE model was 1.4% lower than that of the test result (7.2%). This is because the early failure of the interface led to the early occurrence of the crack source, which reduced the deformation ability of the SiCp/6061Al. The fracture strain (7.5%) of the medium interface strength RVE model was in good agreement with the experimental results, and the difference was only 0.3%. Therefore, the subsequent interface strength modeling used the medium interface strength.
The interface formed through the mechanical bonding, wettability, and chemical reaction between the reinforcement and the matrix in the composite was a bridge for the stress transfer, which played an important role in the mechanical properties of the composite. The interfacial strength depends on the chemical composition, microstructure, and preparation process of the matrix and the reinforcing phase. The previous analysis shows that improving the interfacial strength of the composite material significantly improved the overall mechanical properties of the SiCp/6061Al composite material.

5.3. Effect of the Particle Volume Fraction on the Tensile Properties of the Composites

Figure 8a shows the equivalent stress cloud map of the SiCp/6061Al composites with a SiCp volume fraction of 5%, 10%, and 15% at a nominal strain of 0.2%. Figure 8b shows the average equivalent stress of the SiCp/6061Al composites with different SiCp volume fractions. It was found that the average equivalent stress of the 6061Al matrix was lower than that of the SiC-reinforced phase, and the bearing effect of the SiC-reinforced phase was more obvious. In this state, the average equivalent stress of the 6061Al matrix with different SiCp volume fractions was higher than the yield stress (220 MPa) obtained by the nanoindentation experiment and increased with the increase in the SiC volume fraction.
Figure 9 is the equivalent plastic strain cloud diagram and logarithmic strain cloud diagram of the RVE model of the SiCp/6061Al composites with different volume fractions at the nominal strain of 0.2%. It can be seen that the equivalent plastic strain was mostly concentrated in the matrix near the particle boundary. This is because the particles bear a load much higher than the matrix, resulting in an increase in the deformation of the matrix near the matrix–particle interface [4]. Combined with the logarithmic strain cloud diagram, it can be found that the strain of the 6061Al matrix part in the RVE model was higher than that of the SiC reinforcement part.
Figure 10a–c show the 5%, 10%, and 15% volume fractions of the SiCp/6061Al composite RVE model, respectively. Figure 10d is the nominal stress–strain curve of the corresponding volume fraction. Figure 10e–g are the plastic strain cloud map of the SiCp/6061Al composites with volume fractions of 5%, 10%, and 15% after RVE model fracture, respectively. It can be seen that the yield strength of the SiCp/6061Al composites increased, and the fracture strain decreased, with the increase in the SiCp volume fraction. The simulation results of the nominal stress–strain curves of SiCp/6061Al composites with volume fractions of 5%, 10%, and 15% were in good agreement with the experimental results in the nearly whole tensile stage. The tensile strength of the SiCp/6061Al composites with different volume fractions was not significantly different from the yield strength. This is due to the failure mode of the RVE model. The mesh unit in the fractured region was directly deleted, resulting in a sharp increase in the force amplitude, and the adjacent unit continued to fail rapidly, resulting in the rapid propagation of cracks. This phenomenon has been observed many times in related studies [36]. Although the tensile strength of the material cannot be obtained according to the simulation results, the yield strength results obtained by simulation are still valuable in engineering applications.

6. Summary

In this paper, SiCp/6061Al composites with volume fractions of 5%, 10%, and 15% were prepared by vacuum hot pressing sintering. The microstructure and fracture morphology were observed and analyzed. The elastic–plastic behavior of the 6061Al matrix in composites was studied by using the load–displacement curve measured by the nanoindentation mechanical test, and the plastic constitutive equation was established. The image processing technology was used to identify the geometric characteristics of the SiCp from the metallographic structure, and the RVE finite element model was established to simulate the deformation and fracture process of the SiC/6061Al composites under uniaxial tension. The effects of the interface strength and SiCp volume fraction on the microscopic deformation and fracture characteristics of SiC/6061Al composites were revealed. The main conclusions are as follows:
(1)
The results of the nanoindentation test show that the yield strength of the 6061Al matrix with a 10% volume fraction of SiCp increased about 31 MPa. Based on Dao’s inverse analysis algorithm, the plastic constitutive equation of 6061Al matrix was established as follows:
σ = 230 ( 1 + 301.3 ε p ) 0.097 .
(2)
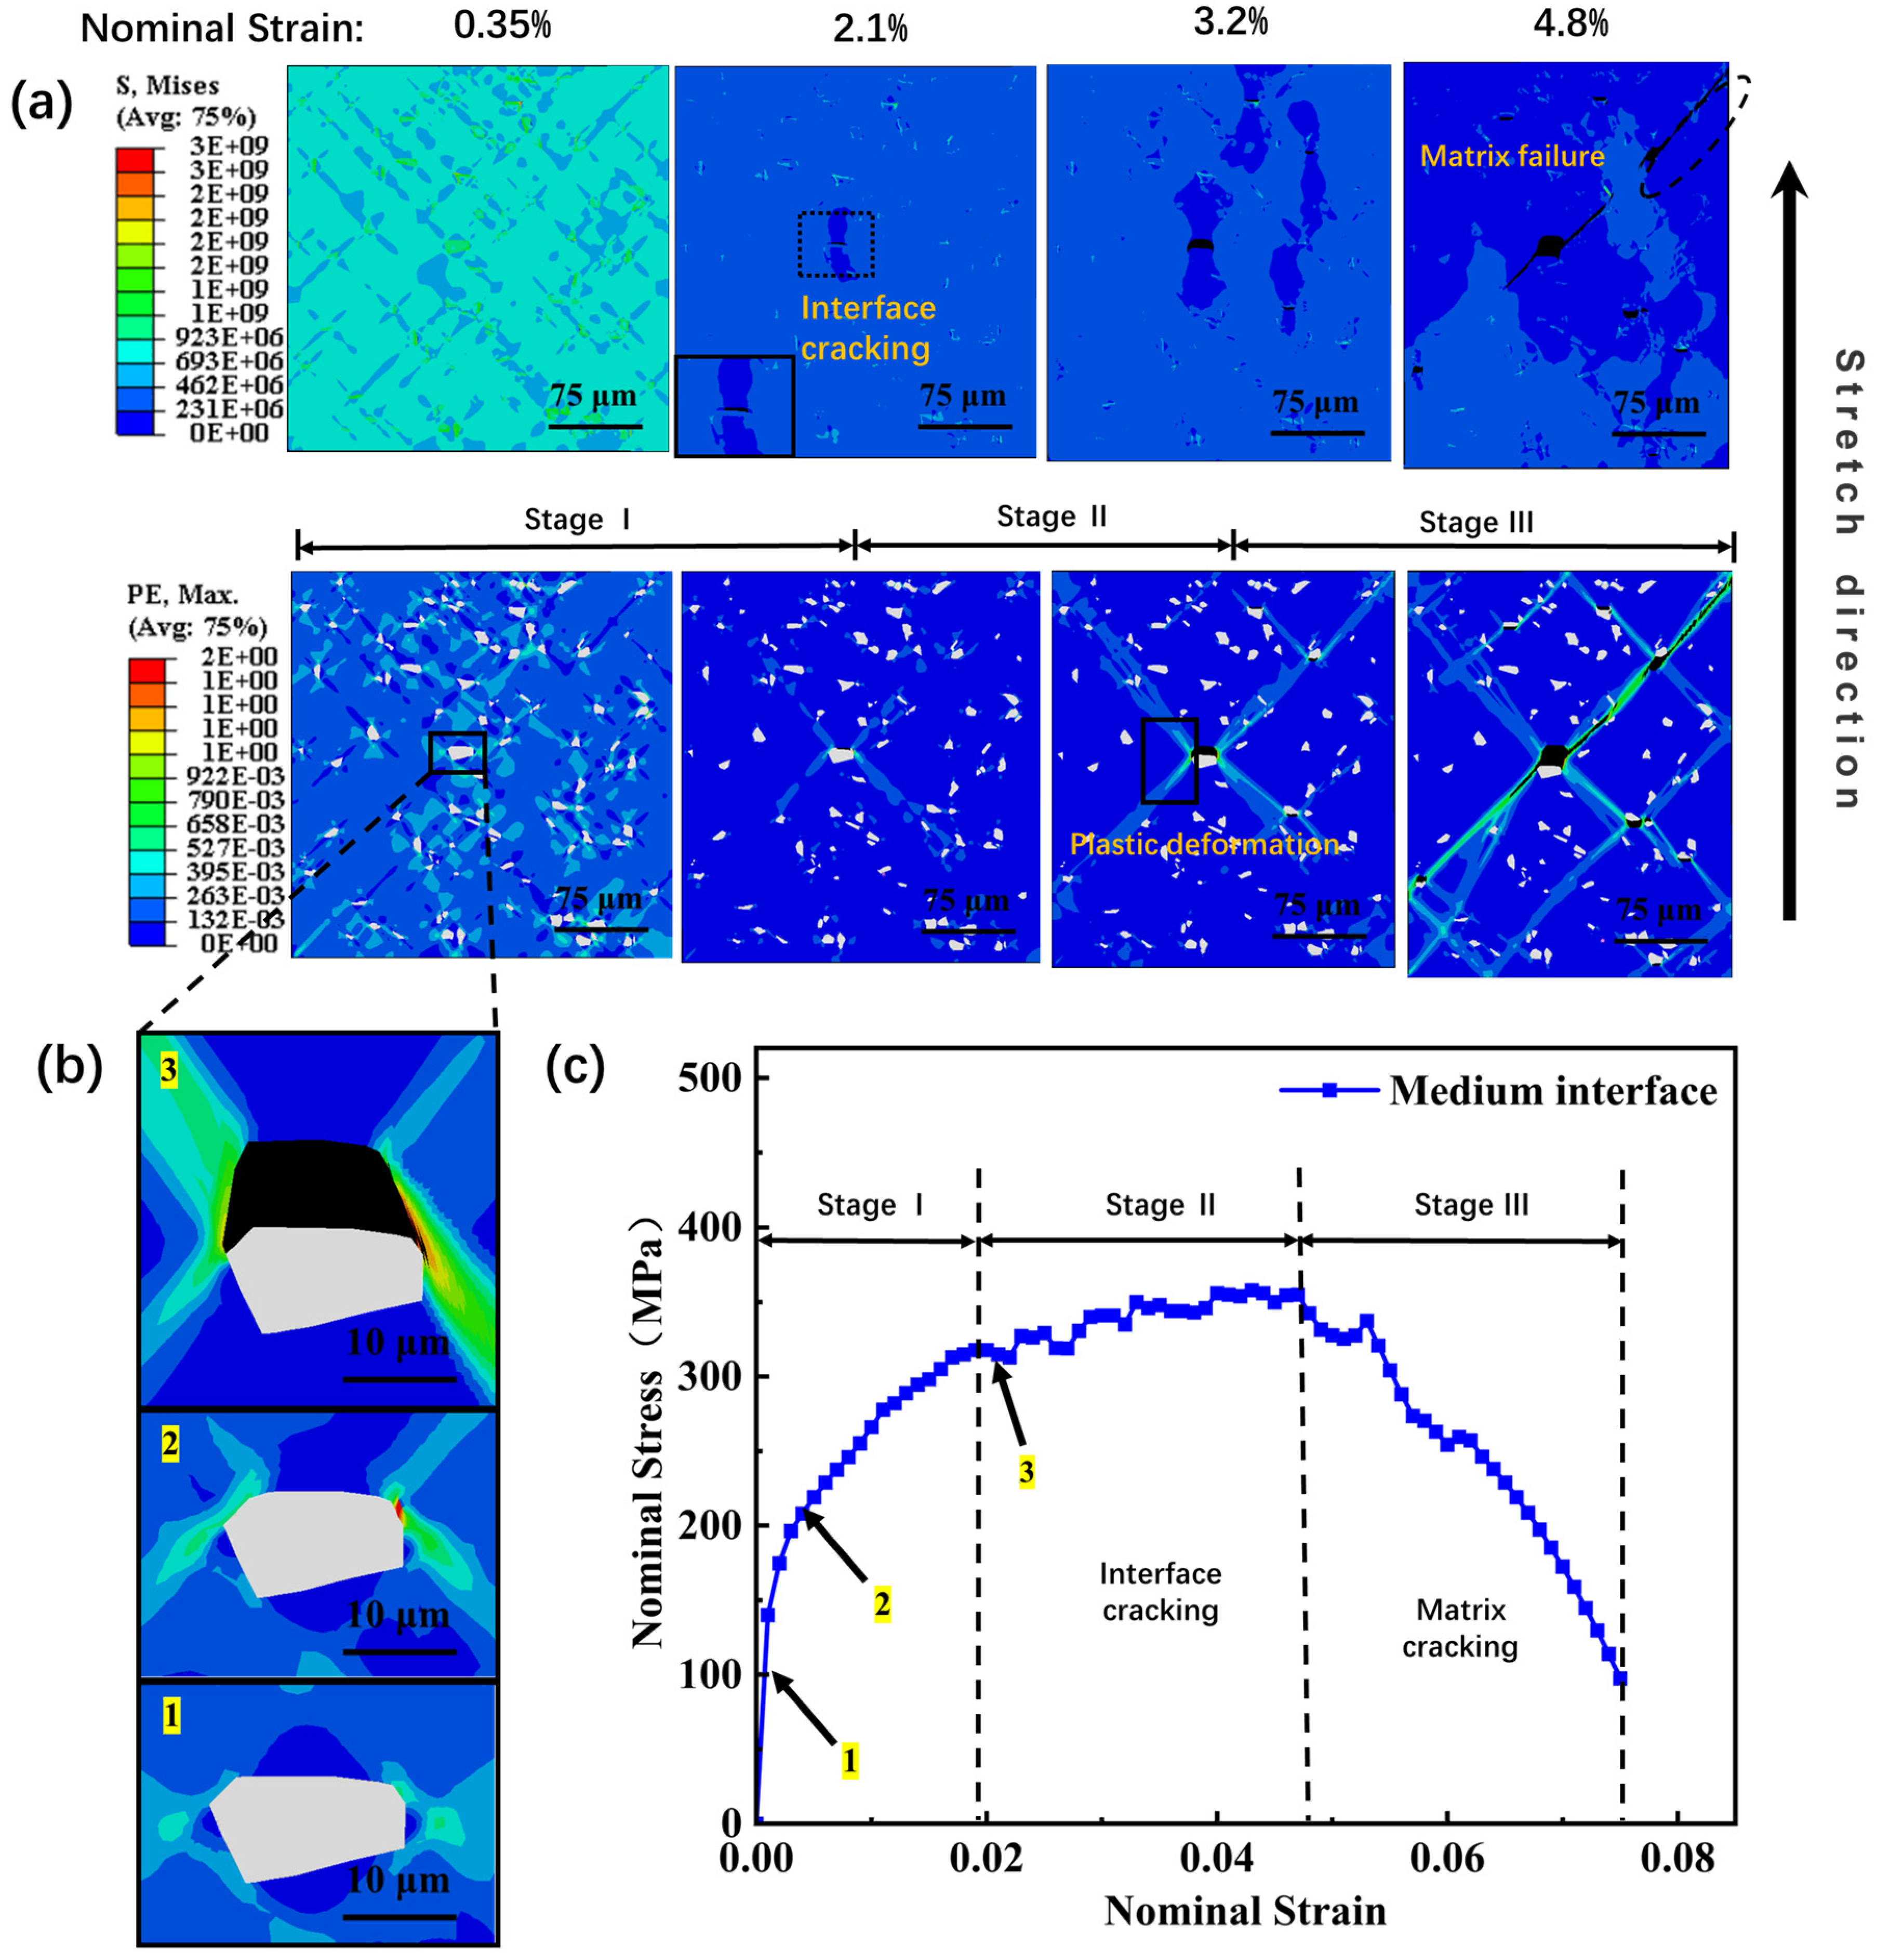
The deformation and fracture mechanism of the SiCp/6061Al composites under tensile load was revealed. The first stage was uniform deformation. The Mises stress and plastic strain distribution of the matrix part in the model were relatively uniform. In the second stage, damage failure began to appear in the interface between the SiCp-reinforced phase and the 6061Al matrix. In the third stage, the 6061Al matrix bore most of the load near the failure interface, resulting in a significant increase in the plastic strain value, the first damage occurred, and the damage increased further and developed into a crack.
(3)
With the increase in the interface strength, the occurrence of the interface failure was delayed during the tensile deformation, and the corresponding fracture strain also increased. The overall mechanical properties of the SiCp/6061Al composites were significantly improved by increasing the interfacial strength of the composites.
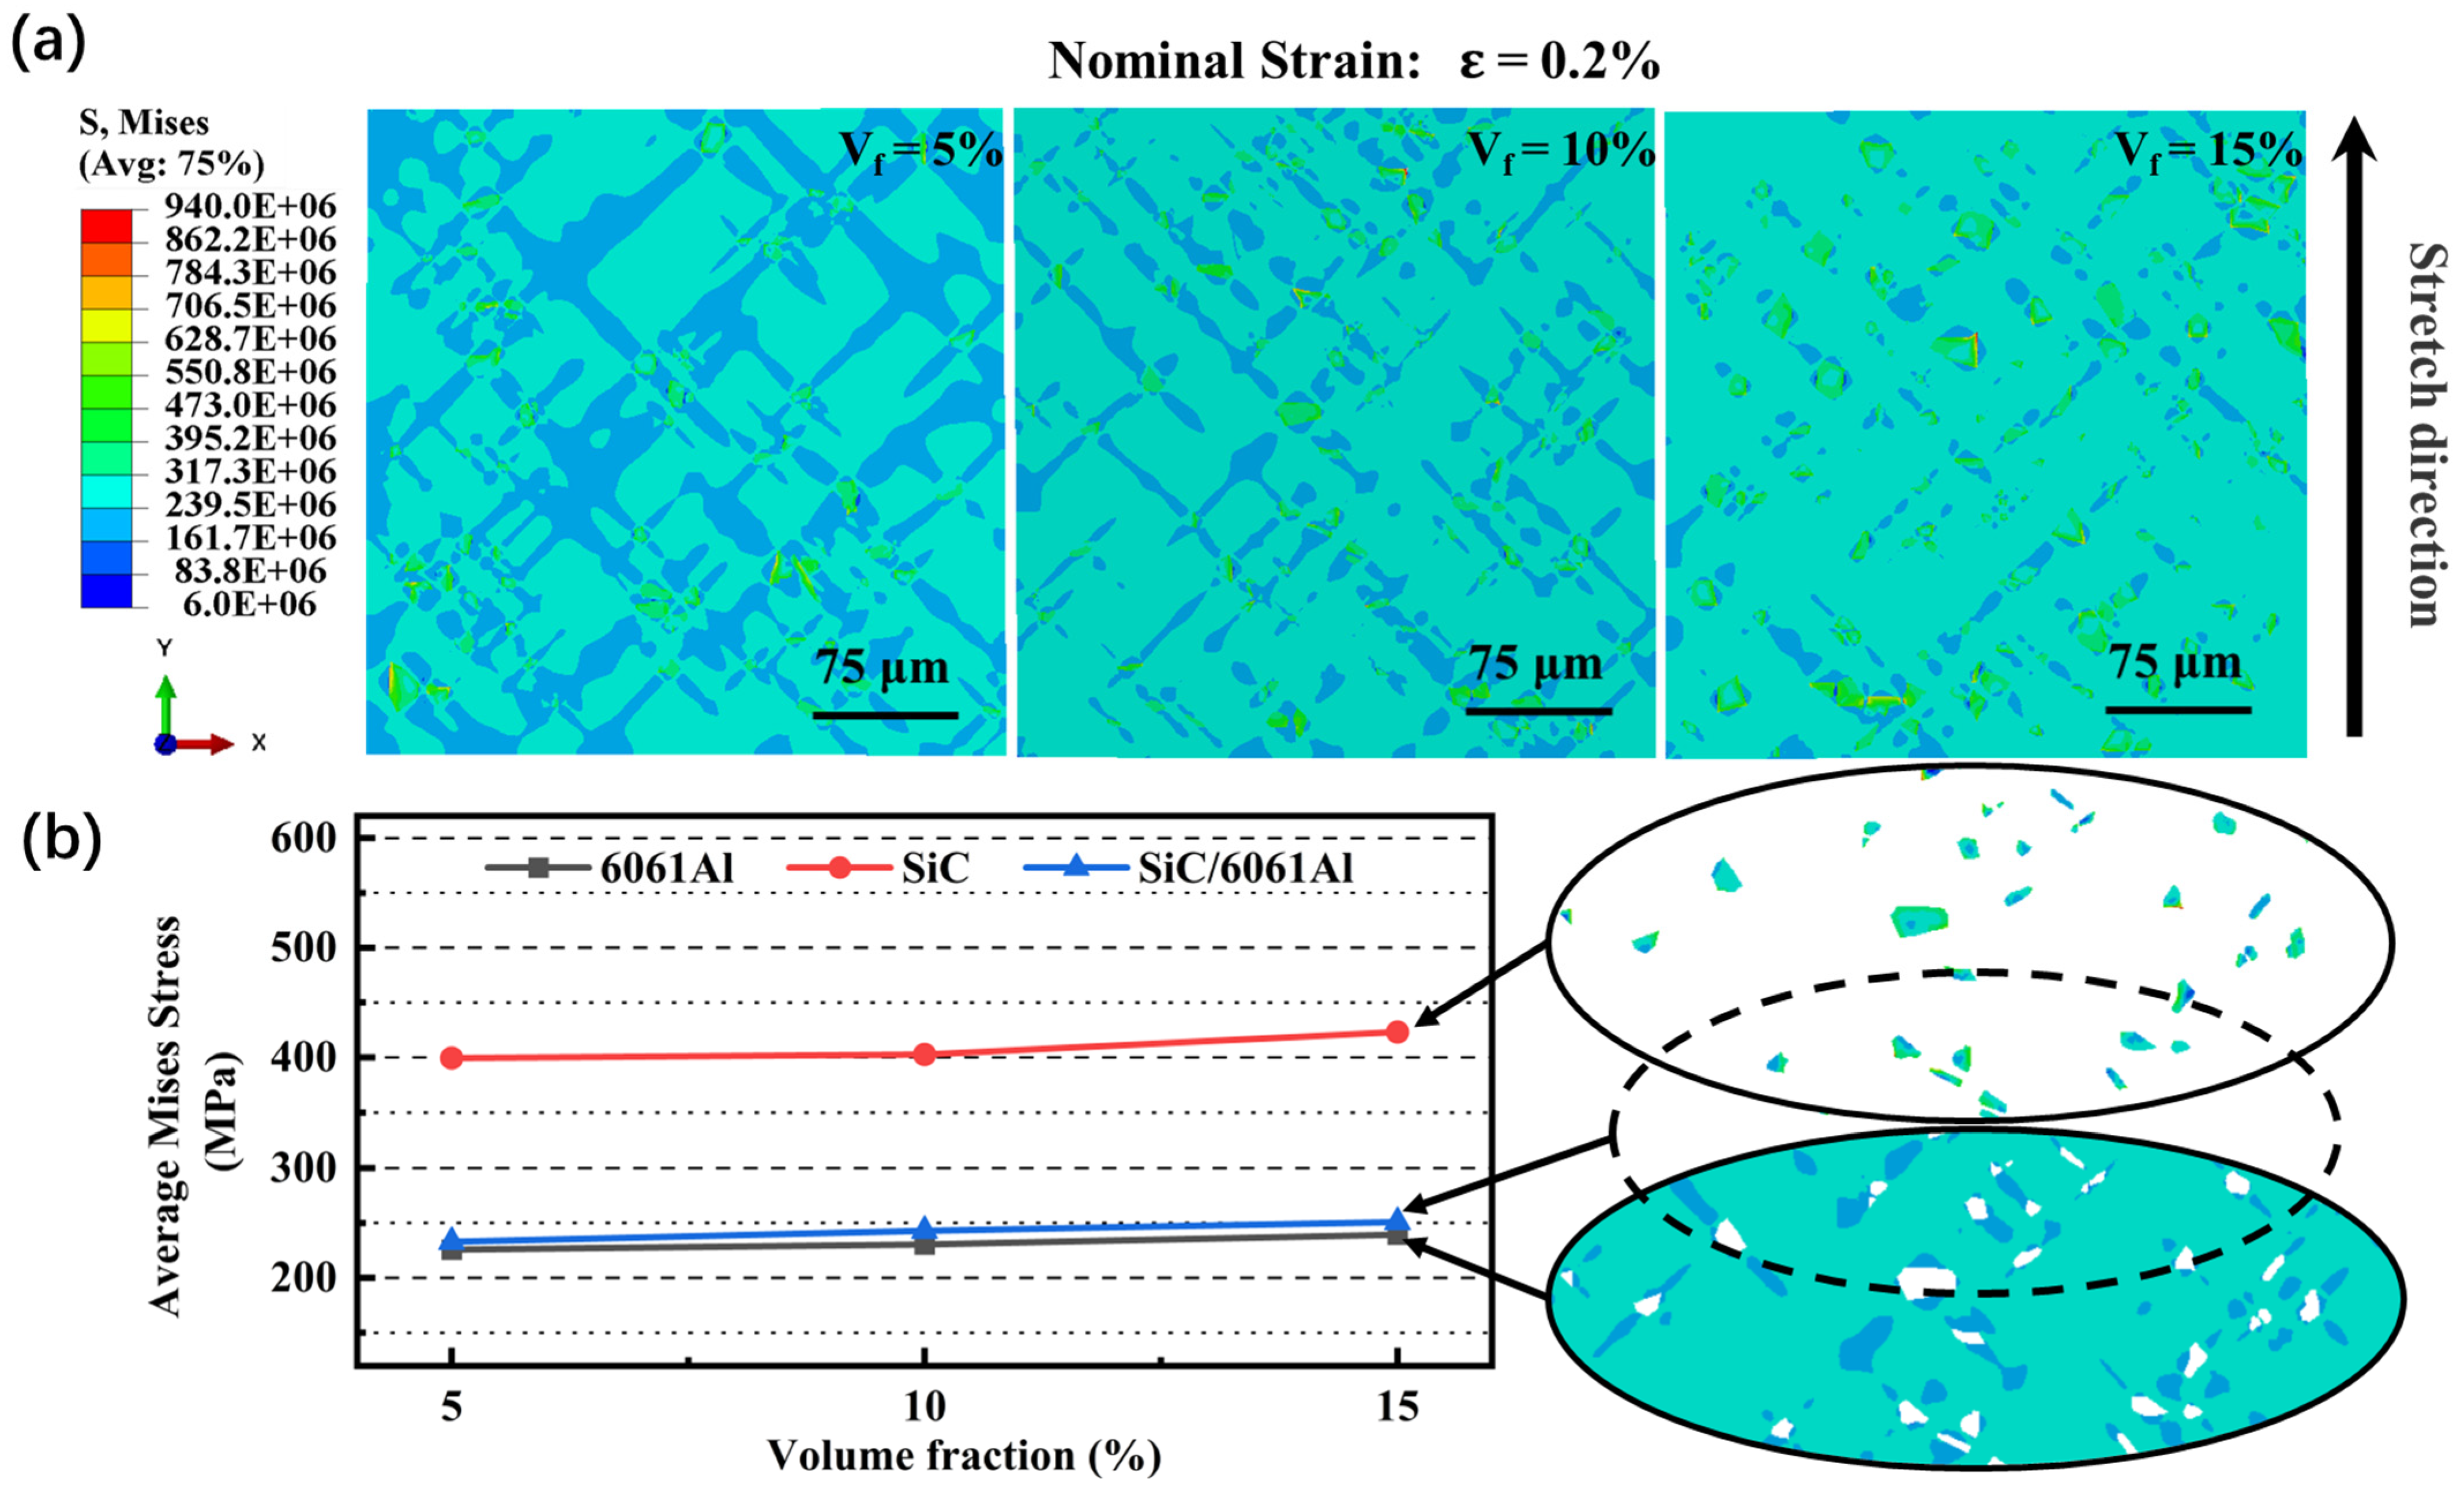
(4)
The yield strength of the SiCp/6061Al composites increased with the increase in the SiCp volume fraction, and the fracture strain rate decreased. The average equivalent stress of the SiC component in the SiCp/6061Al composites under a yield state reached about 400 MPa. The average equivalent stress of the 6061AL component was about 230 MPa. The average equivalent stress of the composite material as a whole was around 250 MPa, and the bearing effect of the particle-reinforced phase was obvious.

Author Contributions

Conceptualization, H.W. and G.J.; methodology, H.W. and G.J.; Experimental Design, H.W. and G.J.; Calculation and analysis, H.W.; Consulting information, Y.X. and Y.L.; Collecting data, Y.X. and Y.L.; Experiments, Y.X. and Y.L.; Paper writing, H.W.; Paper modification, G.J. All authors have read and agreed to the published version of the manuscript.

Funding

This study was funded by the key scientific research project of Henan Province, China (16A430037).

Institutional Review Board Statement

Not applicable.

Informed Consent Statement

Not applicable.

Data Availability Statement

Not applicable.

Conflicts of Interest

The authors declare no conflict of interest.

References

  1. Pazhouhanfar, Y.; Eghbali, B. Microstructural characterization and mechanical properties of TiB2 reinforced Al6061 matrix composites produced using stir casting process. Mater. Sci. Eng. A 2018, 710, 172–180. [Google Scholar] [CrossRef]
  2. Kaczmar, J.W.; Pietrzak, K.; Włosiński, W. The production and application of metal matrix composite materials. J. Mater. Process. Technol. 2000, 106, 58–67. [Google Scholar] [CrossRef]
  3. Hruby, P.; Singh, S.S.; Williams, J.J.; Xiao, X.; De Carlo, F.; Chawla, N. Fatigue crack growth in SiC particle reinforced Al alloy matrix composites at high and low R-ratios by in situ X-ray synchrotron tomography. Int. J. Fatigue 2014, 68, 136–143. [Google Scholar] [CrossRef]
  4. Peng, P.; Gao, M.; Guo, E.; Kang, H.; Xie, H.; Chen, Z.; Wang, T. Deformation behavior and damage in B4Cp/6061Al composites: An actual 3D microstructure-based modeling. Mater. Sci. Eng. A 2020, 781, 139169. [Google Scholar] [CrossRef]
  5. Sharifi, H.; Ostovan, K.; Tayebi, M.; Rajaee, A. Dry sliding wear behavior of open-cell Al-Mg/Al2O3 and Al-Mg/SiC-Al2O3 composite preforms produced by a pressureless infiltration technique. Tribol. Int. 2017, 116, 244–255. [Google Scholar] [CrossRef]
  6. Hong, Y.; Liu, J.Q.; Wu, Y.C. The interface reaction of SiC/Al composites by spark plasma sintering. J. Alloys Compd. 2023, 949, 169895. [Google Scholar] [CrossRef]
  7. Gao, L.; Liu, C.; Liu, J.J.; Yang, T. Effect of subsurface damage on tensile behavior and fracture mechanism of SiCp/Al composites: Experimental analysis and RVE modeling. Eng. Fail. Anal. 2023, 147, 107162. [Google Scholar] [CrossRef]
  8. Zhang, J.F.; Zhang, X.X.; Wang, Q.Z.; Xiao, B.L.; Ma, Z.Y. Simulations of deformation and damage processes of SiCp/Al composites during tension. J. Mater. Sci. Technol. 2018, 34, 627–634. [Google Scholar] [CrossRef]
  9. Li, K.J.; Liao, Y.L.; Zhou, Y.M.; Zhang, F.L.; Liu, J.W.; Wu, S.X.; Tang, H.Q.; Pan, X.Y. Study on grinding of SiCp/Al composites by micro-textured monolayer brazed diamond wheel. Int. J. Adv. Manuf. Technol. 2023, 126, 4607–4615. [Google Scholar] [CrossRef]
  10. Zhou, D.; Cheng, D.F.; Hu, X.Y.; Niu, J.T.; Qiu, D.C. Process and Mechanism of Sealing 65 vol.% SiCp/ZL102 Composite and DM305 Electronic Glass with Borosilicate Glass. Metals 2023, 13, 817. [Google Scholar] [CrossRef]
  11. Chawla, N.; Chawla, K.K. Microstructure-based modeling of the deformation behavior of particle reinforced metal matrix composites. J. Mater. Sci. 2006, 41, 913–925. [Google Scholar] [CrossRef]
  12. Suh, Y.S.; Joshi, S.P.; Ramesh, K.T. An enhanced continuum model for size-dependent strengthening and failure of particle-reinforced composites. Acta Mater. 2009, 57, 5848–5861. [Google Scholar] [CrossRef]
  13. Suh, Y.S.; Song, S.; Park, M.S. Length-scale-dependent strengthening of particle-reinforced metal matrix composites with strain gradient plasticity. J. Mech. Sci. Technol. 2013, 27, 1071–1079. [Google Scholar] [CrossRef]
  14. Su, Y.; Ouyang, Q.; Zhang, W.; Li, Z.; Guo, Q.; Fan, G.; Zhang, D. Composite structure modeling and mechanical behavior of particle reinforced metal matrix composites. Mater. Sci. Eng. A 2014, 597, 359–369. [Google Scholar] [CrossRef]
  15. Ganesh, V.V.; Chawla, N. Effect of particle orientation anisotropy on the tensile behavior of metal matrix composites: Experiments and microstructure-based simulation. Mater. Sci. Eng. A 2005, 391, 342–353. [Google Scholar] [CrossRef]
  16. Chawla, N.; Jones, J.W.; Andres, C.; Allison, J.E. Effect of SiC volume fraction and particle size on the fatigue resistance of a 2080 Al/SiCpcomposite. Metall. Mater. Trans. A 1998, 29, 2843–2854. [Google Scholar] [CrossRef]
  17. Chawla, N.; Andres, C.; Jones, J.W.; Allison, J.E. Cyclic Stress-Strain Behavior of Particle Reinforced Metal Matrix Composites. Scr. Mater. 1998, 38, 1595–1600. [Google Scholar] [CrossRef]
  18. Tjong, S.C. Novel Nanoparticle-Reinforced Metal Matrix Composites with Enhanced Mechanical Properties. Adv. Eng. Mater. 2007, 9, 639–652. [Google Scholar] [CrossRef]
  19. Sahoo, B.P.; Das, D.; Chaubey, A.K. Strengthening mechanisms and modelling of mechanical properties of submicron-TiB2 particulate reinforced Al 7075 metal matrix composites. Mater. Sci. Eng. A 2021, 825, 141873. [Google Scholar] [CrossRef]
  20. Mirza, F.A.; Chen, D.L. A Unified Model for the Prediction of Yield Strength in Particulate-Reinforced Metal Matrix Nanocomposites. Materials 2015, 8, 5138–5153. [Google Scholar] [CrossRef]
  21. Ma, S.; Zhang, X.; Chen, T.; Wang, X. Microstructure-based numerical simulation of the mechanical properties and fracture of a Ti-Al3Ti core-shell structured particulate reinforced A356 composite. Mater. Des. 2020, 191, 107723. [Google Scholar] [CrossRef]
  22. Tran, H.S.; Bouffioux, C.; Dedry, O.; Rojas-Ulloa, C.; Duchêne, L.; Mertens, A.; Habraken, A.M. Identification of a soft matrix-hard inclusion material by indentation. Int. J. Mech. Sci. 2022, 235, 107723. [Google Scholar] [CrossRef]
  23. Dao, M.; Chollacoop, N.; Van Vliet, K.J.; Venkatesh, T.A.; Suresh, S. Computational modeling of the forward and reverse problems in instrumented sharp indentation. Acta Mater. 2001, 49, 3899–3918. [Google Scholar] [CrossRef]
  24. Holmquist, T.J.; Templeton, D.W.; Bishnoi, K.D. Constitutive modeling of aluminum nitride for large strain, high-strain rate, and high-pressure applications. Int. J. Impact Eng. 2001, 25, 211–231. [Google Scholar] [CrossRef]
  25. Johnson, G.R.; Cook, W.H. A Constitutive Model and Data for Metals Subjected to Large Strains, High Strain Rates and High Temperatures. In Proceedings of the Seventh International Symposium on Ballistics, The Hague, The Netherlands, 19–21 April 1983; pp. 541–547. [Google Scholar]
  26. Munro, R.G. Material Properties of a Sintered α-SiC. J. Phys. Chem. Ref. Data 1997, 26, 1195–1203. [Google Scholar] [CrossRef]
  27. Camanho, P.P.; Turon, A.; Costa, J. 17-Delamination propagation under cyclic loading. In Delamination Behaviour of Composites; Sridharan, S., Ed.; Woodhead Publishing: Sawston, UK, 2008; pp. 485–513. [Google Scholar] [CrossRef]
  28. Chandra, N.; Li, H.; Shet, C.; Ghonem, H. Some issues in the application of cohesive zone models for metal–ceramic interfaces. Int. J. Solids Struct. 2002, 39, 2827–2855. [Google Scholar] [CrossRef]
  29. Gao, M.; Guo, E.; Chen, Z.; Kang, H.; Wang, T. Revealing the role of micropore defects in tensile deformation of a B4Cp/Al composite using an actual three-dimensional model. J. Mater. Res. Technol. 2023, 22, 3146–3155. [Google Scholar] [CrossRef]
  30. Xu, Q.; Lu, Z.X. An elastic-plastic cohesive zone model for metal-ceramic interfaces at finite deformations. Int. J. Plast. 2013, 41, 147–164. [Google Scholar] [CrossRef]
  31. Xu, Q.; Qu, S.X. Irreversible deformation of metal matrix composites: A study via the mechanism-based cohesive zone model. Mech. Mater. 2015, 89, 72–84. [Google Scholar] [CrossRef]
  32. Wang, Z.J.; Wang, Z.Y.; Liu, Y.; Cai, C.C.; Xiong, B.W.; Wang, Z.T.; Xu, Z.F.; Yu, H. Simulation and experimental study of mechanical and fracture behavior of 2.5D woven C-fiber/aluminum composites under warp directional tension loading. Fatigue Fract. Eng. Mater. Struct. 2021, 44, 383–396. [Google Scholar] [CrossRef]
  33. Wang, Z.J.; Wang, Z.Y.; Xiong, B.W.; Cai, C.C.; Xu, Z.F.; Yu, H. Micromechanics analysis on the microscopic damage mechanism and mechanical behavior of graphite fiber-reinforced aluminum composites under transverse tension loading. J. Alloys Compd. 2020, 815, 152459. [Google Scholar] [CrossRef]
  34. Lloyd, D.J. Aspects of fracture in particulate reinforced metal matrix composites. Acta Metall. Mater. 1991, 39, 59–71. [Google Scholar] [CrossRef]
  35. Wang, Q.G. Microstructural effects on the tensile and fracture behavior of aluminum casting alloys A356/357. Metall. Mater. Trans. A 2003, 34, 2887–2899. [Google Scholar] [CrossRef]
  36. Tursun, G.; Weber, U.; Soppa, E.; Schmauder, S. The influence of transition phases on the damage behaviour of an Al/10vol.%SiC composite. Comput. Mater. Sci. 2006, 37, 119–133. [Google Scholar] [CrossRef]
Figure 1. (a) Nanoindentation loading displacement curve of the SiCp/6061Al composite matrix; (b) the stress–strain curve of the SiCp/6061Al matrix obtained by the inverse analysis algorithm.
Metals 13 01016 g001
Figure 2. (a) The grid division diagram of the nanoindentation finite element model; (b) indenter displacement–time curve of the finite element model; (c) experiment and FEM calculation of the indentation response of the SiCp/6061Al matrix; (d) equivalent stress nephogram (S) and equivalent plastic strain (PE) nephogram of the SiCp/6061Al matrix near the tip of the conical indenter.
Metals 13 01016 g002
Figure 3. (a) Modeling process of the quasi-real model; (b) symmetric boundary condition constraint diagram.
Metals 13 01016 g003
Figure 4. (ac) are the metallographic diagrams of the SiCp/6061Al composites with volume fractions of 5%, 10%, and 15%, respectively. (d) The fracture morphology of the SiCp/6061Al composites with a SiCp volume fraction of 10%.
Metals 13 01016 g004
Figure 5. (a) Quasi-real RVE model; (b) nominal stress–strain curves of the RVE models with different interface strengths.
Metals 13 01016 g005
Figure 6. Cloud diagram of the equivalent stress (S) and plastic strain (PE) for tensile deformation of the pseudo real RVE model under the moderate strength interface (a) and its local amplification (b); (c) the nominal stress–strain curves of the three stages of the medium-strength interface model.
Metals 13 01016 g006
Figure 7. Equivalent plastic strain nephogram of the RVE model with matrix failure.
Metals 13 01016 g007
Figure 8. (a) The equivalent stress (S) cloud diagram of the RVE model of the SiCp/6061Al composites with different volume fractions when the nominal strain was 0.2%; (b) the average equivalent stress of each component in the RVE model of the SiCp/6061Al composites with different volume fractions.
Metals 13 01016 g008
Figure 9. Equivalent plastic strain (PE) nephogram and logarithmic strain (LE) nephogram for the RVE models of the SiCp/6061Al composites with different volume fractions when the nominal strain was 0.2%.
Metals 13 01016 g009
Figure 10. (ac) are the RVE models of the SiCp/6061Al composites with volume fractions of 5%, 10%, and 15%, respectively. (d) The nominal stress–strain curves of the SiCp/6061Al composites with volume fractions of 5%, 10%, and 15% were compared with the simulation results. The plastic strain nephogram of the SiCp/6061Al composites with (eg) volume fractions of 5%, 10%, and 15% after RVE model fracture, respectively.
Metals 13 01016 g010
Table 1. Parameters obtained from the nanoindentation curve.
PhaseC (GPa)hr/hmPave (GPa)hm (μm)
10% SiCp/6061 matrix16.030.9391.020.19
Table 2. Parameters solved by the reverse solution algorithm.
Phase E * (GPa) σ 0.033 (MPa)E (GPa)n σ y (MPa)
10% SiCp/6061 matrix72.1829069.30.097230
Table 3. Parameter settings of the different SiCp-6061Al interfaces.
InterfaceNormal Strength (MPa)Tangential Strength (MPa)Critical Fracture Energy (J/m2)
Weak30030060
Medium40040080
Strong500500100
Table 4. Model strain value and fracture strain value at the beginning of the strong, medium, and weak interface failure stages and matrix damage stages.
InterfaceInterface Failure Stage (Initial Strain Value/%)Matrix Damage Stage (Initial Strain Value/%)Breaking Strain (%)
Weak1.9%3.9%6.8%
Medium2.1%4.8%7.5%
Strong2.5%8.9%14%
Disclaimer/Publisher’s Note: The statements, opinions and data contained in all publications are solely those of the individual author(s) and contributor(s) and not of MDPI and/or the editor(s). MDPI and/or the editor(s) disclaim responsibility for any injury to people or property resulting from any ideas, methods, instructions or products referred to in the content.

