Abstract
To tackle the problem of various types of rail damage, such as rolling contact fatigue (RCF) or wear, a profound knowledge of the occurring mechanisms is necessary. This paper presents a newly developed full-scale test rig experiment that involves inserting softer pins into the rail head. These tests help deepen our understanding of shear deformation in rail steels. Furthermore, a finite element (FE) simulation approach is introduced that can be related to the test rig experiments. With these experiments, in combination with the FE simulation, valuable information regarding the plastic deformation can be obtained. This methodology allows predictions regarding a rail’s material behaviour during cyclic wheel loading. Moreover, it enables an effective and rapid qualitative material assessment, reducing the costs of expensive and time-consuming experiments.
1. Introduction
Railway components, such as rails, are subjected to a multitude of external influences. The repeating rolling–sliding condition of the wheel–rail contact leads to a change in the residual stresses in the rail head, further resulting in plastic deformation as well as wear and rolling contact fatigue (RCF) defects, such as head checks and squats [1]. This challenges railway operators, as maintenance intervals may be unforeseeable or decrease; simultaneously, the overall lifetime of rails is decreasing, and costs are rising [2]. To counteract these challenges, it is crucial to fully understand the mechanisms by which these issues occur by employing finite element (FE) simulations in combination with full-scale wheel–rail experiments.
To set up a detailed simulation, a profound knowledge of the wheel–rail interactions that are present, as well as of the prevailing failure mechanisms, is key. In addition, a plausibility check of the used input parameters, such as the material and loading parameters, should be performed by comparing the input parameters with the test rig results. Within this paper, a new deformation analysis on a full-scale test rig is presented by implementing softer pins in the rail head. Experiments were conducted for three different rail materials, which were compared with existing cyclic FE rollover simulations. The new test rig concept was developed to obtain more accurate information regarding the deformation state of rail steels compared with a simple metallographic examination. This gain in knowledge can facilitate future overall assessments of rails, including a viable lifetime prediction and improved maintenance schedules. This paper discusses the following topics:
- Common damage mechanisms, such as plastic deformation, wear, and RCF defects in rails;
- Full-scale test rig experiments including the evaluation of plastic shear deformation for three different rail materials;
- Set-up of a cyclic rollover simulation and comparison of the simulated results with test rig results.
An overview of the most relevant damage mechanisms due to wheel–rail interactions can be found in Figure 1.
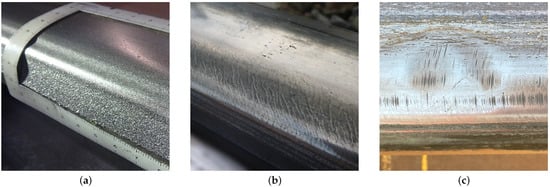
Figure 1.
Some of the most relevant failure mechanisms of rails: (a) Wear and plastic deformation on a rail head. The rail profile is significantly worn, which also includes plastic deformation to some extent. (b) Rail head with head checks. (c) Squat-like defect with the typical v-shaped crack on the rail surface. ((a,b) © voestalpine Rail Technology GmbH; (c) © Materials Center Leoben Forschung GmbH).
In a rail, the accumulation of plastic deformation can be caused by repetitive wheel–rail contact and can considerably decrease a rail’s lifetime. Furthermore, plastic deformation is particularly important, as it is often considered a starting point for further damage, such as wear and fatigue of the track. Obviously, the deformation of rails is more severe on heavy haul lines due to the extreme loads. However, even on high-speed tracks with lower loadings, a thin layer of the rail surface is sheared relative to the bulk material [3]. The thickness of the deformed layer in the rail depends on the material and can develop 1–2 millimetres deep into the head [1]. In rails, the shear deformation is typically caused by the high normal and tangential stresses between the wheel and the rail. Thereby, the stresses regularly exceed the elastic limit of the rail material. Shear deformation can be associated with incremental plastic flow or ‘ratchetting’. For ratchetting, every single passage of a wheel on the track induces an increase in plastic strain, which continuously accumulates over several thousands of rollover cycles. Suh [4] suggested that near-surface plastic deformation contributes to sliding wear as well as to the initiation of RCF cracks. Nucleation of the voids and microcracks beneath the rail surface can be observed due to plastic flow. With increasing deformation, microcracks start to expand and merge until an RCF crack commences [5,6].
Therefore, plastic deformation, as a result of the rolling–sliding contact of the wheel–rail interaction is essential for predicting the RCF and wear behaviour in rails. Several researchers have put considerable effort to this area of research in order to determine the amount of repetitive loading before plastic deformation occurs and to determine the magnitude of strain when plastic flow occurs [7,8,9,10].
Until now, only a few methods have been used to investigate the plastic deformation of rails. Three-dimensional surface measurement can be used to determine the plastic deformation of a rail surface that has been in contact with different wheel profiles [11]. Using an optical microscope, shear deformation can be observed. First the angle of the shear lines relative to the surface normal is measured, and then the measure of shear is calculated. Hardness measurement can also be used to estimate plastic deformation [12]. As early as the 1980s, laboratory tests were carried out using a two-roller test rig to simulate wheel–rail contact on tangent and curved tracks [13]. A quantification of plastic deformation by numerical simulation was carried out by Bower and Johnson [5]. Currently, finite element analysis is considered the standard approach for studying plasticity, both in general and in railway applications [14,15].
Often caused by shear deformation in rails, wear is a common damage mechanism due to the high and varying contact loads—predominantly high compressive loads—caused by multiple wheels running over the surface. Wear can be defined as the loss of material and can be either adhesive or abrasive. The resulting problems are, for example, a widening of the track gauge or a change in the rail profile, which can increase the forces and affect the wheel–rail dynamics. In addition, sometimes a reasonable amount of wear is desired to remove damaged material or initiating cracks from the rail surface. Wear can also improve the conformity of wheel–rail contact on newly installed rails. However, only a certain amount of wear can be tolerated; otherwise, the life of the rail will be greatly reduced, and maintenance and replacement costs will excessively increase [16].
Another major contributor to rail head damage is rolling contact fatigue (RCF). There are several types of RCF, the most common being head checks (see Figure 1b) and squats (see Figure 1c). Head checks are also known as gauge corner cracking. Starting as small and fine cracks at the gauge corner of the rail surface, head checks can grow into the rail head. At some point, the cracks may begin to grow deeper into the rail, causing a rail break, or they may grow back to the surface, causing surface spalling. Head checks are most commonly found on sharply canted curves. Typically, head checks appear as a series of evenly spaced cracks on the rail head. However, head checks are considered a minor threat to reliability as the combination of wear and proper maintenance grinding removes the thin layer containing the crack [16].
In contrast, squats are rather complex and severe RCF defects, and the mechanisms of their initiation and growth are still not fully understood [17]. However, several researchers have developed theories regarding the initiation of squats and their propagation [18,19,20,21]. The crack formation of squats on the running band has a distinctive appearance. The shape was described ‘as if a heavy gnome had sat or squatted on the rail, leaving two similarly sized lobes behind’ [22]. The two-lobed appearance suggests a planar crack network growing beneath the surface, which would lead to internal wear within the crack. Characteristically, squats are likely to initiate at a small crack or defect and then propagate a few millimetres below the running surface. In its early stages, a squat appears as a dark depression on the rail head. As the severity of the squat increases, the surface indentation becomes larger, and the running band widens until the material breaks out and the rail completely fails [23].
2. Materials and Methods
This section provides a brief introduction to the materials investigated and the structure and operating principle of the full-scale test rig. A detailed description of the newly developed methodology of the test rig experiments to investigate the rail deformation is also given. Finally, the FE simulation with the used material model is presented.
2.1. Materials
In order to compare the shear deformation experiments, three common pearlitic rail steels were tested and analysed, namely, R260, R350HT, and R400HT. The rail grade is selected according to the requirements of the track. The optimum material is used depending on the track loads caused by heavy haul or passenger trains and the existing curve radius. As a result, each rail grade has different properties in terms of wear, head check resistance, and hardness. By performing the shear deformation tests for three pearlitic rail steels, it was possible to easily compare their specifications under realistic conditions. Table 1 shows the chemical composition and general properties of the materials tested, the rails being characterised by the tightest tolerances according to EN 13674-1, with tolerance classes A and X [24].

Table 1.
Chemical composition and general properties of the three tested rail grades.
2.2. Test Rig
The shear deformation experiments were carried out on a full-scale wheel–rail test rig at voestalpine Rail Technology GmbH; see Figure 2. A similar test rig has already been used for several investigations, including the RCF and wear behaviour of pearlitic and bainitic rail steels [25] or the influence of friction modifiers on performance [26]. It allows fast and repeatable testing of different wheel–rail combinations for wear and RCF. A novel approach to rail preparation was developed to evaluate shear deformation in rails.
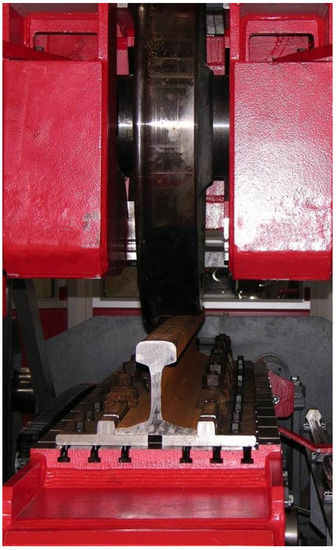
Figure 2.
Test rig at voestalpine Rail Technology GmbH. The rail is fixed at the bottom and positioned on a moving carriage to replicate wheel–rail contact.
On this test rig, a 0.5–2.0 m long rail section is positioned on a moving carriage. The rail is then loaded by a full-size wheel for several cycles. The forward and backward movement of the carriage and the tangential force applied via the wheel up to 250 kN are controlled by an electric drive. This allows for a precise adjustment of the slip 20% during the experiments and thus, for example, the reproduction of the white etching layers along the entire rail length. Vertical and lateral forces of up to 400 kN and 100 kN, respectively, are hydraulically applied to the rail via the wheel. For realistic conditions, the rail cant could be adjusted using a wedge under the rail or by adjusting the base plate. It is even possible to simulate cornering either by forcing lateral wheel–rail contact or by adjusting the angle of attack between the wheel and rail. The test rig can be used to simulate unidirectional and bidirectional traffic. For the experiments performed within this study, only the unidirectional running mode was used. After each rolling cycle, the wheel is lifted and disengaged from the rail. The carriage is then moved back, and the wheel is placed on the surface for the next cycle. The rail carriage itself moves at a maximum speed of 2.2 m/s in this operation mode, allowing approximately 50,000 cycles in 24 h. In order to cover a wide range of tests with this test rig, several parameters, such as the friction conditions, are adjustable. Of course, dry contact conditions with a coefficient of friction can be set, but the use of friction modifiers with is also possible. A rain simulator is also available for the test rig, which applies a water-air spray to the wheel–rail contact and simulates a coefficient of friction of . It is even possible to further reduce the friction coefficient to less than by lubricating the wheel flange with a standardised wheel flange spray nozzle. All forces can be logged during the experiments. In addition, environmental conditions such as temperature and humidity can be adjusted and are measured for each test. Finally, all acquired data are recorded in a database for postprocessing and evaluation [25].
2.3. Experimental Set-Up
The investigation of shear deformation called for the special preparation of the rail. Pins were inserted into the rail head in a defined sequence, as shown in Figure 3, to make it easier to follow the deformation caused by cyclic wheel passes. First, the holes were drilled in the rail, then the pins were inserted. A welding wire with a diameter d of 0.8 mm and a length l of 5 mm was used for these pins. The welding wire—see the detailed chemical composition in Table 2—was a reasonable choice as it is soft compared with the rail material. The soft material ensured quick and easy tracking of the shear deformation in a metallographic section.
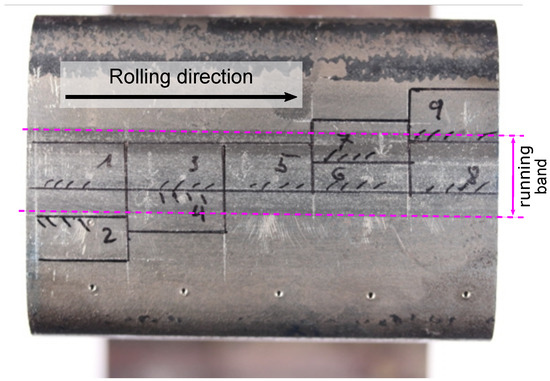
Figure 3.
Top view of the tested rail head showing the nine areas where the pins are positioned. Five pins are in the middle of the rail (sections 1, 3, 5, 6, and 8), and four are offset from the centre of the rail (sections 2, 4, 7, are 9). The rolling direction of the wheel and the developing running band are also marked in the picture.
Table 2.
Chemical composition by mass in % for the used welding wire.
The experimental set-up of the shear deformation experiments is similar for all three pearlitic rail steels. Figure 3 depicts the positions of the inserted pins in the investigated rail parts and Figure 4 illustrates the dimensions in between. Thereby, the rail is divided into several areas depending on the targeted number of rollover cycles. Hence, for an experiment with 700 and 1400 cycles, two areas are defined. In the first rollover block, the wheel passes the entire rail for 700 cycles and for the second block, the rolling length is reduced and another 700 cycles are reproduced.
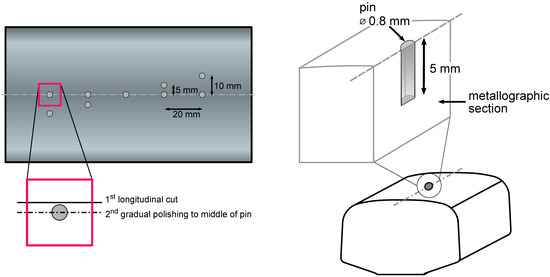
Figure 4.
The nine pin positions used for deformation analysis, and the distances between them are marked. The pink box shows a close-up of a pin to illustrate the metallographic sectioning procedure. First, the rail is longitudinally cut next to the pin being analysed. Second, the material is gradually polished to the middle of the pin until the desired metallographic section is obtained.
This approach creates a rail with two or three areas with different amounts of wheel passes. Nine pins are used for each area: five pins in the middle of the rail and four pins laterally offset from the centre of the rail. This allows the study of the plastic deformation along a wide area of the railhead. It also allows the study of the influence of the passing wheel on and next to the running band.
For all materials, the wheel was positioned in the centre of the rail head. For this experimental set-up, a standard S1002 railway wheel made from R7 was machined to a cylindrical shape without a flange. A quasi-cylindrical wheel thus rolled over the prepared rail with the pins.
A vertical load of 15 t was applied with a constant slip of 1.5% and a speed of 0.5 m/s. The rail profile used was 60E1, and the nominal wheel diameter was 860 mm. A coefficient of friction of = 0.5 was obtained for all the experiments carried out. The rollover procedure was displacement-controlled, i.e., the displacement of the wheel in relation to the rail is controlled until the target force is reached.
Once the target number of cycles is completed on the test rig, the metallographic examination is carried out. The rail is sectioned according to the pin positions. Each pin is separately examined and needs to be prepared for the shear deformation investigation. A schematic is shown in Figure 4, where the box shows a magnified view of a pin and the required sections. First, a longitudinal section is made next to the analysed pin. From this point, the material is gradually polished until the middle of the pin is reached. In this manner, each pin is dissected, and the metallographic examination can be carried out. During metallography, the longitudinal displacement of the pin, the plastically deformed area, and the shear deformation of the pin are examined and measured. The analysis for exemplary pins of each material is given in Section 3.
2.4. Finite Element Analysis (FEA)
For a detailed investigation and a possible future prediction of shear deformation in rails without the need for a full-scale test rig experiment, an FE simulation methodology was developed. The open source plugin ’Abaqus Rollover Simulation’ for the commercial FE software Abaqus (2020, Dassault Systèmes, France), developed and published by [27], serves as the basis for the rollover model. This tool allows the user to quickly set up cyclic wheel–rail simulations by first specifying the required rail and wheel geometry. The applied model uses the standard 60E1 rail geometry according to the European standard EN 13674-1 [24] and a cylindrical wheel reduced to wheel super elements. In addition, the implementation of periodic boundary conditions and shadow elements in the contact area drastically reduces the computation time for multiple repetitive rollover cycles. This approach allows continuous rollover simulations without lifting the wheel from the rail, as the wheel rolls over the entire length of the rail and is then mapped back to the starting position [27]. A schematic of the simulation model is shown in Figure 5 (adapted from Gschwandl et al. [28]).
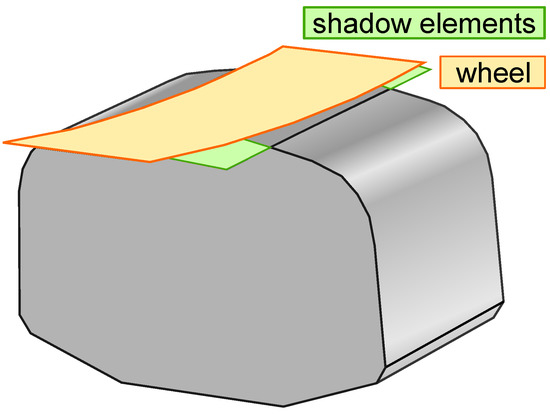
Figure 5.
Schematic of the ’Abaqus Rollover Simulation’ model with the rail head used, the reduced wheel, and the added shadow elements; adapted from Gschwandl et al. [29].
Using the introduced cyclic rollover simulation methodology, the shear deformation of pearlitic rail steels was analysed after 1400 rollover cycles. The rail head was modelled using a Chaboche-type elasto-plastic cyclic material model to match the mechanics of the material during the test rig experiments. The material behaviour of the model is influenced by the initial yield stress , the plastic strain tensor , and the scalar value p describing the accumulated equivalent plastic strain. The model incorporates isotropic and kinematic hardening, where the isotropic term is described by and causes scaling of the initial yield surface. The kinematic term causes the translation of the yield surface. For the material model, the parameters and characterising the kinematic back stresses and and b for the isotropic hardening are required. The calibration of the material models was conducted with cyclic material tests on tubular pearlitic rail steel specimens. Table 3 shows the parameters used for the three tested materials R260, R350HT, and R400HT, taken and modified from [30,31]. A more detailed explanation of the material model can be found in [32].
Table 3.
Parameters for the elasto-plastic model of the three materials used R260, R350HT, and R400HT, adapted from [30,31].
The computation time for the simulated 1400 cycles for each material was approximately 10 days using 12 CPUs on a high-performance computer (HPC) (2x AMD EPYC 7352 24-Core, 256 GB RAM). For simplicity, a linear elastic material model was used for the wheel, which may produce different results than the full-scale test rig. The load, friction, and contact parameters for the simulation were exactly chosen based on the conducted test rig experiments. Similar to the applied vertical load of 15 t on the test rig, a force of 148 kN was used in the simulation. A constant slip of 1.5 % was also used in accordance with the test schedule. The contact between the wheel and the rail in the rollover simulation was specified with a coefficient of friction of , which is consistent with the experiments on the test rig.
3. Results
This section briefly introduces a small representative excerpt of the results of the experiments and simulations carried out, followed by a detailed discussion in Section 4. In total, the three presented rail steels were tested with different numbers of rollover cycles on the full-scale test rig. The shear deformation in the rail head and the evolution of the running band were analysed. In addition, the conducted simulations were evaluated with respect to the deformation of the investigated material and compared with the results from the test rig.
3.1. Full-Scale Test Rig
The evaluation of the pin deformation from the metallographic sections is of particular interest. This is because a simple visual assessment of the microstructure does not provide a reasonable estimation of the plastic deformation in the rail head. By evaluating the deformation angle of the pin, a sound assessment of the materials being investigated can be made.
Figure 6a–f display the pin deformation in the metallographic sections for the three materials after a defined number of rollover cycles. Each material showed an increased degree of deformation after doubling the number of cycles, with R260 showing this behaviour earlier and more pronounced than the other two materials.
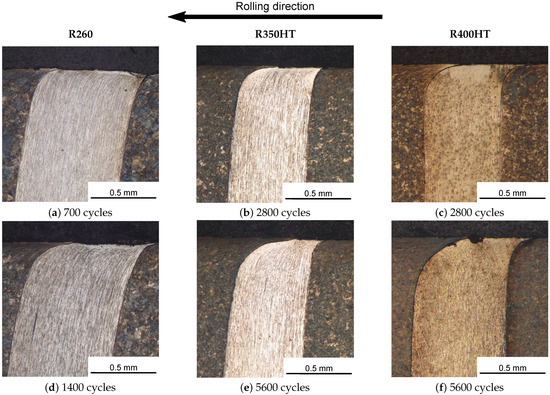
Figure 6.
Comparison of the deformation of a pin in the middle of the running band (see pins 1, 3, 5, 6, or 8 in Figure 3) for the three materials tested. (a,d) R260 after 700 and 1400 cycles, respectively. (b,c) and (e,f) R350HT and R400HT after 2800 and 5600 cycles, respectively.
For a more detailed investigation, the deformation curves for the three materials are displayed in Figure 7a–c. Starting with the R400HT rail steel, which showed only a small area of deformed material close to the rail surface, only a selected area was examined in detail. Note that the pins in R400HT remained mostly vertical without deformation. Therefore, to equally compare the three materials, the deformation curves are shown for a depth of 1.7 mm from the rail head. The deformation angle was then evaluated at a depth of 0.7 mm. The angle was measured between the vertical line at this point and the tangent to the curve; see Figure 6a. The evaluation depth was specified as the deformation varied too much at the surface. In general, the deformation curves were obtained from manual image analysis, which could have led to some irregularities in the curves.
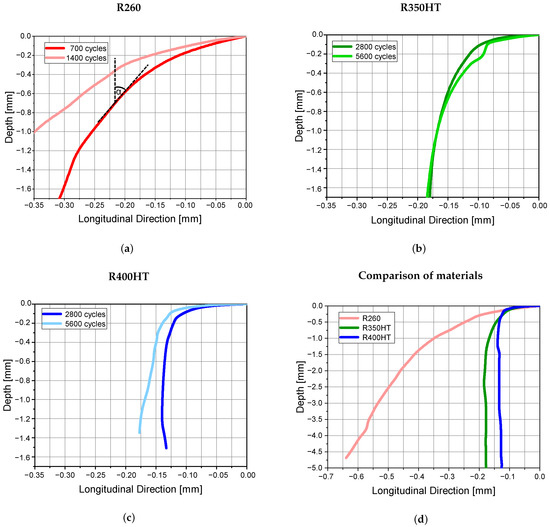
Figure 7.
Evaluated pin deformation curves for the three rail materials: (a) R260, (b) R350HT, and (c) R400HT. For all materials, the deformation angle at a depth of 0.7 mm was evaluated by measuring the angle between the vertical line at the point and the tangent to the curve; see schematic in (a). Overall, R260 showed the highest deformation in the rail surface area after 1400 cycles, followed by R350HT and R400HT after 2800 cycles each, which are compared and visualised for a depth of 5 mm in (d).
As already shown in Figure 6, R260 (Figure 7a) exhibited the highest deformation at much lower rollover cycles compared with the other two steels. After 700 cycles, the deformation angle was = 39°; after 1400 cycles, = 51°. The rail material continued to deform as the number of cycles increased.
In Figure 7b, R350HT also shows an expected trend when evaluating the deformation curves. After 2800 rollover cycles, the deformation angle was = 17°; after 5600 cycles, = 28°. However, as R350HT steel is heat-treated, the deformation in the surface area up to a depth of 1.7 mm was much less pronounced than that for the R260.
R400HT also exhibited a larger deformation angle as the number of rollover cycles increased, as shown in Figure 7c. The angle was = 6° after 2800 cycles; = 11° after 5600 cycles. This material showed the lowest deformation in the surface area and up to the total pin length of 5 mm. Already at 1.5 mm, the tendency of the pin deformation curve was straight; therefore, no deformation was visible deeper in the rail head.
Figure 7d displays a comparison of the deformation curves for the three materials for the entire pin length of 5 mm. The large difference between R260 and the two heat-treated steels R350HT and R400HT is clearly visible. Only a small area at the surface deformed after 2800 rollover cycles for R350HT and R400HT, whereas the R260 showed deformation of the material over the entire depth.
Finally, Figure 8, Figure 9 and Figure 10 depict the change in the running band for a varying number of rollover cycles for R260, R350HT, and R400HT, respectively. In all three figures, the number of cycles increases from left to right. Even this simple comparison of the three pearlitic steels shows a significant difference in the material properties and behaviour.
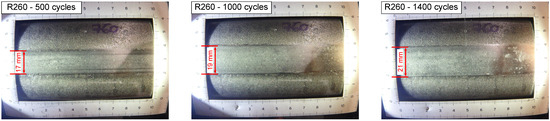
Figure 8.
Evolution of the running band for the R260 rail steel. The width of the running band is marked for 500, 1000, and 1400 cycles. The width of the running band steadily increased.
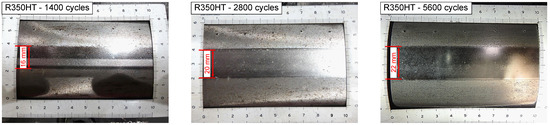
Figure 9.
Evolution of the running band for R350HT rail steel. The width of the running band is marked for 1400, 2800, and 5600 cycles. Again, the running band became continuously wider.
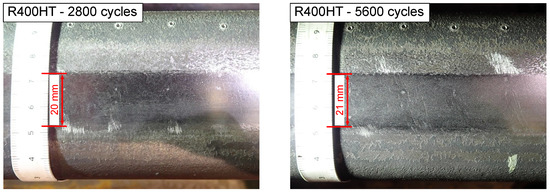
Figure 10.
Evolution of the running band for R400HT rail material. The width of the running band is marked for 2800 and 5600 cycles,. An earlier measurement is not provided. However, it appears that the running band had almost entirely developed by this number of cycles.
Therefore, for a thorough analysis of the deformation state, the following quantities are of interest:
- In the metallographic sections of the pins, the deformation of the rail material near the surface is visible and measurable.
- The angle of the pin gives additional information on the degree of deformation.
- The evolution of the running band also gives an indication of the deformation behaviour of the material.
3.2. Simulation
The simulation for the rollover model is based on the actual settings during the test rig experiments. The model set-up was as described in Section 2.4. For an initial assessment, 1400 rollover cycles were evaluated. For this purpose, the deformation of the rail material in the rolling direction was analysed by evaluating the displacement in the z direction of the surface nodes located in the middle of the rail head. Figure 11 shows the deformation of the FE model in the longitudinal direction (U3) after 1000 rollover cycles for the R260 rail material. A hexahedral mesh of C3D8R elements was used, with the wheel–rail contact area being finer-meshed with an element size of approximately 1.1 mm × 0.7 mm × 1.1 mm (x × y × z). In total, the mesh within the FE model contained approximately 23,000 elements and was identical for all three materials. For evaluation purposes, a representative node or a node set on the surface in the middle of the rail head was used.
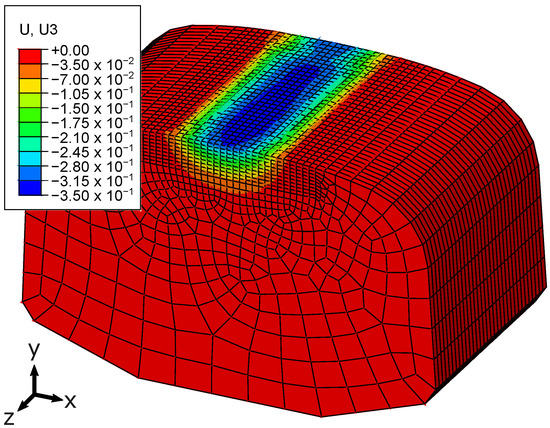
Figure 11.
Longitudinal deformation in the FE model for R260 after 1000 rollover cycles. The deformation of the mesh in z direction due to the rolling wheel is shown in the figure.
Figure 12 shows a comparison of the accumulated displacement up to 1400 cycles for the three different rail steels. The deformation was first evaluated for the surface node in the middle of the longitudinal rolling direction of the rail head. Similar to the tests carried out, R260 showed the largest longitudinal deformation, followed by R350HT and R400HT. The computed accumulated deformation (filled symbols with solid line) steadily increased for all materials until approximately the 300th rollover cycle. From then on the deformation gradually decreased. This led to the assumption that the applied boundary conditions in the FE model influence the deformation after a certain number of cycles. The influence of the boundary conditions and possibly the contact conditions in the surface area can also be seen in Figure 11, where the deformation is slightly unevenly distributed along the 40 mm long rail head. The irregularity of the longitudinal deformation at the beginning of the rollover cycle could be attributed to the continuous reapplication and mapping of the wheel on the rail. Note that the reduction in the deformation was only observed in the surface region, whereas in the subsurface region, approximately 2–3 mm below the surface, the deformation continuously increased with increasing rollover cycles; see the deformation evolution of subsurface nodes in Figure 12 (half-filled symbols and dashed line). It is clear that the maximum longitudinal deformation occurred at the surface of the rail head and decreased with increasing depth.
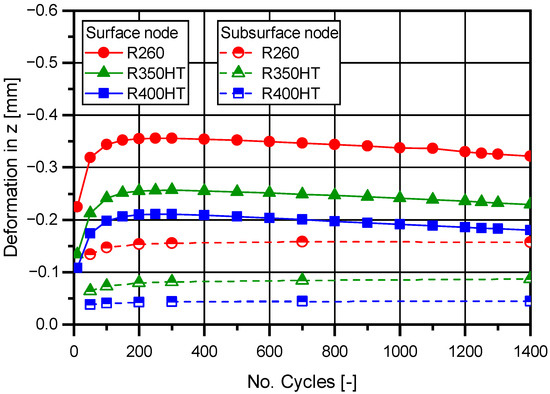
Figure 12.
Computed accumulated deformation in rolling direction (z direction) evaluated for a surface and a subsurface node, located in the middle of the rail head, for three rail steels. Thereby, the standard rail steel R260 showed the biggest deformation, followed, as expected, by R350HT and R400HT. The deformation evolution at the surface is marked with filled symbols and a solid line, whereas for the subsurface region the symbols are half-filled with a dashed line.
In addition, the computed deformation curves for the three materials after 1400 rollover cycles are shown in Figure 13 for depths of 1.7 mm and 5 mm. The familiar trend can be seen, with R260 showing the greatest overall deformation, followed by R350HT and R400HT.
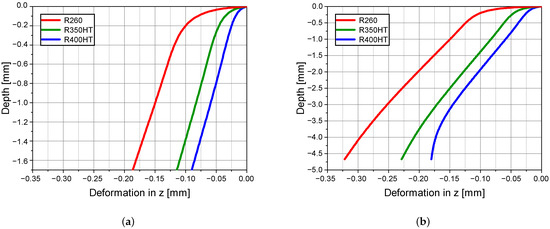
Figure 13.
Computed deformation curves for the three materials after 1400 rollover cycles. (a) shows the deformation for a depth of 1.7 mm, while (b) shows the deformation for the entire depth of 5 mm. Due to the almost parallel curves, the deformation angle at a depth of 0.7 mm is similar for all three rail steels. Overall, R260 showed the highest deformation, followed by R350HT and R400HT.
Similar to the evaluation of the pin deformation angle for the conducted tests, the deformation angle in the simulation was also analysed. However, the deformation angle at a depth of 0.7 mm was similar for all three materials as the curves were almost parallel. The main differences substantiated by the simulation were the maximum deformations obtained for each material, in good agreement with the pin deformation tests carried out.
Finally, in order to analyse the influence of the evaluation position, the displacement along the width of the running band at half the rolling length was assessed. The distribution along the rail head width after 1400 cycles is depicted in Figure 14 for all materials.
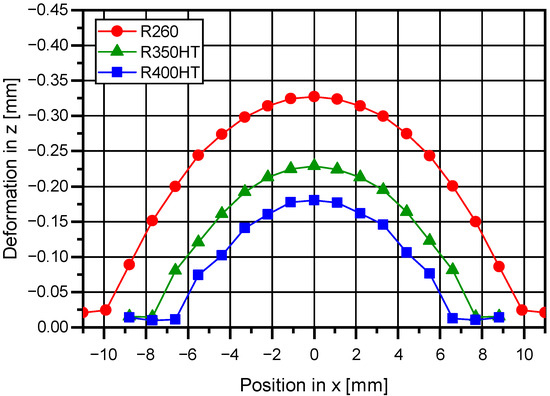
Figure 14.
The distribution of the computed deformation along the rail width is shown for all three materials. The middle and symmetry line of the running band is at position 0 in the x direction.
The maximum longitudinal deformation for each steel was located in the middle of the running band. However, the width of the developed running band was different for the different rail materials. R260 showed the widest band of approximately 20 mm, followed by R350HT at 16 mm and R400HT at 14 mm after 1400 rollover cycles. These results are in good agreement with the evaluated running band widths of the test rig experiments.
4. Discussion
4.1. Full-Scale Test Rig
As this paper presents a novel methodology to evaluate the plastic deformation including pins in a rail head, only a limited number of samples are discussed here. The metallographic sections of the pins for each material, the associated pin deformation curve including the pin deformation angle, and the evolution of each running band are shown in Section 3.
The pin deformation angle was analysed and evaluated (Figure 7a–c) for each material at a depth of 0.7 mm. It can be seen that R350HT and R400HT showed significantly less deformation than R260 over the entire rail head. This is highlighted by the pin deformation angles of 6° and 11° obtained for R400HT after 2800 and 5600 cycles, respectively. R350HT showed deformation angles of 17° and 28° for the same number of rollover cycles, respectively. The difference between the pin deformation angles for the two heat-treated rail steels could be seen without measuring the angle. The evaluation of the pin deformation angle led to the conclusion that R400HT deforms less and slower in the entire rail head than R350HT. Finally, as expected, R260 had the highest measured pin deformation angles of 39° and 51° for only one-quarter of the rollover cycles, respectively. An overview of all measured values is listed in Table 4.
Table 4.
Evaluated pin deformation angles for all three rail materials at a depth of 0.7 mm. The angle between the vertical line at the evaluation point and the tangent to the curve was measured; see Figure 7a.
The different evolutions of the running band for each material is also consistent with the results of the previous investigations within this study. While R260 rather quickly developed its running band within the first 1400 cycles, the other two steels showed a similar running band after 2800 and 5600 cycles. A slightly smaller band was found for R400HT. The measured widths of the running bands are listed in Table 5.
Table 5.
Measured running band widths for the three materials tested.
It should be noted that all full-scale test rig experiments were carried out with an adjusted wheel with a cylindrical running surface. In the rail industry, the wheel–rail profile pairing is of paramount importance to achieve long-lasting and optimum performance. Particularly with heat-treated high-performance steels such as R350HT and R400HT, which require more time to deform and therefore adapt their profile, careful selection of the two components is crucial. Otherwise, with an unfavourable wheel–rail profile combination, the wear and RCF behaviour could be worse than with a standard rail material that more quickly adapts to new geometries.
4.2. Simulation
The simulations of the 1400 rollover cycles for the three rail steels gave interesting results. Figure 12 compares the computed accumulated deformation for the three materials. The deformation decreases with higher rail grades (R260 > R350HT > R400HT). In this analysis, a surface node and a subsurface node in the middle of the rail head were used to evaluate the accumulated deformation. The evolution of the deformation on the rail surface shows an increase until the 300th cycle, followed by a slight decrease. However, this deformation evolution is only observed at the surface and not below the surface. This suggests a possible influence of the applied boundary and contact conditions on the deformation. It appears that not all effects are properly captured by the boundary conditions, leading to a deformation decrease in the surface area. However, there is no evidence as to whether the differences that occur in the deformation evolution in the surface and subsurface regions are a real existing phenomenon or artificially created. Nevertheless, the results obtained proved to be qualitatively and quantitatively valuable for these investigations.
Additionally, the deformation curves for a depth of 1.7 mm and 5 mm were computed and evaluated; see Figure 13. The materials show the same ranking in terms of deformation. However, the evaluated deformation angles of the three materials at 0.7 mm depth do not show the expected differences between them, as the deformation curves are almost parallel but with divergent maximum values.
Figure 14 examines the surface deformation for the full width of the running band. This plot allows the width of the running band to be assessed, as the deformation at the edge of the band is comparatively small. In addition, only one-third of the deformation is found at the edge of the evaluated area compared to the middle.
With this simulation set-up, the deformation at the rail surface could be evaluated reasonably well. A finer mesh would be useful for a higher depth resolution. However, this would lead to a multiplication of the computation time, which is currently uneconomical. Nevertheless, a plausible estimation of the rail deformation can be made using this new simulation method. Furthermore, an improvement in the predicted results was achieved compared with that in the published work of [33], where a quasi-static 2D and 3D model was presented for the evaluation of plastic deformation.
4.3. Comparison of Experiments and Simulations
When comparing the results of the test rig experiments with those of the simulation, some differences could be seen. Firstly, due to limited computer resources, the simulation was only carried out for up to 1400 rollover cycles for each material. This number of cycles was sufficient for R260, as the test rig experiments were also carried out for 700 cycles and more. For the heat-treated rail materials R350HT and R400HT, only 2800 cycles of experimental data are available. However, the 1400 simulated rollover cycles for all materials gave a good first estimation of the simulation quality and provided results comparable to the experiments.
Secondly, the material model has a large influence on the resulting deformation due to the rollover procedure. In a previous work by Daves et al. [34], a similar investigation into rail deformation was carried out, where they evaluated the displacement increase up to 50 cycles and extrapolated the displacement curve for 200 cycles. The present simulation improves the predictive quality of rail deformation. A direct comparison of the simulation results with the deformations obtained from the test rig experiments showed only a minor deviation. With the applied material models of the three rail steels, a slightly smaller deformation was predicted. These results therefore provide a basis for a first qualitative prediction of material behaviour. However, there is still room for improvement in the material models used, as small changes in the material parameters and numerical calibration can lead to large deviations in the deformation results. Currently, the calibration of material models is based on cyclic material tests, which are complex and costly tasks. Often, the experiments do not fully reproduce the actual conditions in the track or on the test rig. Therefore, the goal of future work is clearly to further develop and improve the available material models.
In general, the presented FE approach allows a reasonable estimation of the occurring deformation and material behaviour. There are some limitations regarding the accurate prediction of the deformation angle, but the maximum deformation can be qualitatively estimated. This methodology improves the prediction of the material behaviour of a rail and will reduce the cost of expensive and time-consuming experiments. However, the FE model is limited by the computational resources. For a sufficiently fast simulation, several simplifications are required. Thus, there is a need for additional full-scale test rig experiments to identify phenomena that only appear after a large number of cycles.
5. Conclusions
A new methodology for analysing rail deformation by inserting soft pins into the rail head was presented. These investigations provided a detailed insight into the mechanisms of plastic deformation at depths where the microstructures are not visibly affected by the deformations. In addition, a simulation set-up was presented, which produced good results for the computed plastic deformation after a large number of cycles. The simulations allowed the total deformation of the rail to be described in the lateral and longitudinal directions. Thus, the residual stresses in the rail after plastic deformation due to a high number of rollover cycles could be calculated. In addition, the simulation results were validated with full-scale wheel–rail test rig experiments.
The performance of the different rail steels in terms of deformation according to the evaluated test rig experiments can be summarised as follows:
- The pearlitic R260 rather quickly deforms and adapts due to wheel–rail contact.
- The two heat-treated pearlitic steels R350HT and R400HT show similar deformation behaviour. However, the total deformation of R400HT is expected to be slightly less than that of R350HT due to its lower maximum deformation and smaller deformation angle.
This work is a further step toward a better understanding of the prevailing failure mechanisms (e.g., plastic deformation, wear, and RCF) of rails. By correlating the test rig experiments with the simulation carried out, important knowledge about the rail behaviour in wheel–rail contact was gained. In the future, this information can be used to further improve simulations and reduce the need for expensive and time-consuming full-scale tests. This approach paves the way for the better prediction of various failure mechanisms through the use of finite element analysis.
Author Contributions
Conceptualization, T.J.G. and W.D.; Data curation, T.M.W.; Funding acquisition, W.D.; Investigation, T.J.G.; Methodology, T.J.G., D.K., S.S. and W.D.; Project administration, W.D.; Validation, W.D.; Visualization, T.J.G. and T.M.W.; Writing—original draft, T.J.G.; Writing—review & editing, T.A., D.K., S.S. and W.D. All authors have read and agreed to the published version of the manuscript.
Funding
The authors gratefully acknowledge the financial support under the scope of the COMET program within the K2 Center “Integrated Computational Material, Process and Product Engineering (IC-MPPE)” (Project No. 886385). This program is supported by the Austrian Federal Ministries for Climate Action, Environment, Energy, Mobility, Innovation and Technology (BMK) and for Labour and Economy (BMAW), represented by the Austrian Research Promotion Agency (FFG), and the federal states of Styria, Upper Austria and Tyrol.
Data Availability Statement
Not applicable.
Conflicts of Interest
The authors declare no conflict of interest.
References
- Bower, A.F.; Johnson, K.L. Shakedown, Residual Stress and Plastic Flow in Repeated Wheel-Rail Contact. In Rail Quality and Maintenance for Modern Railway Operation; Kalker, J.J., Cannon, D.F., Orringer, O., Eds.; Springer: Dordrecht, The Netherlands, 1993; pp. 239–249. [Google Scholar] [CrossRef]
- Stock, R.; Kubin, W.; Daves, W.; Six, K. Advanced maintenance strategies for improved squat mitigation. Wear 2019, 436–437, 203034. [Google Scholar] [CrossRef]
- Clayton, P.; Allery, M.B.; Bolton, P.J. Surface damage phenomena in rails. In Proceedings of the Conference on Contact Mechanics and Wear of Rail/wheel Systems, Vancouver, BC, Canada, 6–9 July 1982; pp. 419–443. [Google Scholar]
- Suh, N.P. The delamination theory of wear. Wear 1973, 25, 111–124. [Google Scholar] [CrossRef]
- Bower, A.F.; Johnson, K.L. Plastic flow and shakedown of the rail surface in repeated wheel-rail contact. Wear 1991, 144, 1–18. [Google Scholar] [CrossRef]
- Hawksbee, S.J.; Tucker, G.J.; Burstow, M. Use of shakedown maps to assess plastic flow in railway curves. Proc. Inst. Mech. Eng. Part F J. Rail Rapid Transit 2020, 234, 417–425. [Google Scholar] [CrossRef]
- Merwin, J.E.; Johnson, K.L. An Analysis of Plastic Deformation in Rolling Contact. Proc. Inst. Mech. Eng. 1963, 177, 676–690. [Google Scholar] [CrossRef]
- Hearle, A.D.; Johnson, K.L. Cumulative Plastic Flow in Rolling and Sliding Line Contact. J. Appl. Mech. 1987, 54, 1–7. [Google Scholar] [CrossRef]
- Bhargava, V.; Hahn, G.T.; Rubin, C.A. An Elastic-Plastic Finite Element Model of Rolling Contact, Part 1: Analysis of Single Contacts. J. Appl. Mech. 1985, 52, 67–74. [Google Scholar] [CrossRef]
- Bhargava, V.; Hahn, G.T.; Rubin, C.A. An Elastic-Plastic Finite Element Model of Rolling Contact, Part 2: Analysis of Repeated Contacts. J. Appl. Mech. 1985, 52, 75–82. [Google Scholar] [CrossRef]
- Olofsson, U.; Telliskivi, T. Wear, plastic deformation and friction of two rail steels—A full-scale test and a laboratory study. Wear 2003, 254, 80–93. [Google Scholar] [CrossRef]
- Nikas, D.; Meyer, K.A.; Ahlström, J. Characterization of deformed pearlitic rail steel. IOP Conf. Ser. Mater. Sci. Eng. 2017, 219, 012035. [Google Scholar] [CrossRef]
- Kumar, S.; Aronov, V.; Rajkumar, B.R.; Margasahayam, R. Experimental Investigation of Plastic Flow in Rails for a Laboratory Wheel Rail Simulation. Can. Metall. Q. 1982, 21, 59–66. [Google Scholar] [CrossRef]
- Skrypnyk, R.; Ekh, M.; Nielsen, J.C.; Pålsson, B.A. Prediction of plastic deformation and wear in railway crossings – Comparing the performance of two rail steel grades. Wear 2019, 428-429, 302–314. [Google Scholar] [CrossRef]
- Meyer, K.A.; Nikas, D.; Ahlström, J. Microstructure and mechanical properties of the running band in a pearlitic rail steel: Comparison between biaxially deformed steel and field samples. Wear 2018, 396-397, 12–21. [Google Scholar] [CrossRef]
- Fletcher, D.I.; Franklin, F.J.; Kapoor, A. Rail surface fatigue and wear. In Wheel-Rail Interface Handbook; Lewis, R., Olofsson, U., Eds.; Elsevier: Amsterdam, The Netherlands, 2009; pp. 280–310. [Google Scholar] [CrossRef]
- Gschwandl, T.; Daves, W.; Antretter, T.; Bucher, C.; Künstner, D. On the road towards understanding squats: The residual stress state of rails. In Procedia Structural Integrity; Elsevier: Amsterdam, The Netherlands, in production.
- Deng, X.; Qian, Z.; Li, Z.; Dollevoet, R. Investigation of the formation of corrugation-induced rail squats based on extensive field monitoring. Int. J. Fatigue 2018, 112, 94–105. [Google Scholar] [CrossRef]
- Naeimi, M. An Investigation into the Formation of Squats in Rails: Modelling, Characterization and Testing. Ph.D. Thesis, Delft University of Technology, Delft, The Netherlands, 2020. [Google Scholar] [CrossRef]
- Pal, S.; Daniel, W.J.; Farjoo, M. Early stages of rail squat formation and the role of a white etching layer. Int. J. Fatigue 2013, 52, 144–156. [Google Scholar] [CrossRef]
- Baltic, S.; Daves, W. Squat initiation mechanism model in a rail-wheel contact. Eng. Fract. Mech. 2022, 269, 108525. [Google Scholar] [CrossRef]
- Grassie, S.L. Squats and squat-type defects in rails: The understanding to date. Proc. Inst. Mech. Eng. Part F J. Rail Rapid Transit 2012, 226, 235–242. [Google Scholar] [CrossRef]
- Li, Z. Squats on railway rails. In Wheel-Rail Interface Handbook; Lewis, R., Olofsson, U., Eds.; Elsevier: Amsterdam, The Netherlands, 2009; pp. 409–435. [Google Scholar] [CrossRef]
- DIN EN 13674-1:2017-07; Bahnanwendungen—Oberbau—Schienen—Teil 1: Vignolschienen ab 46 kg/m; Deutsche Fassung EN 13674-1:2011+A1:2017. Beuth Verlag GmbH: Berlin, Germany, 2017.
- Stock, R.; Pippan, R. RCF and wear in theory and practice—The influence of rail grade on wear and RCF. Wear 2011, 271, 125–133. [Google Scholar] [CrossRef]
- Stock, R.; Eadie, D.T.; Elvidge, D.; Oldknow, K. Influencing rolling contact fatigue through top of rail friction modifier application—A full scale wheel–rail test rig study. Wear 2011, 271, 134–142. [Google Scholar] [CrossRef]
- Meyer, K.A.; Skrypnyk, R.; Pletz, M. Efficient 3d finite element modeling of cyclic elasto-plastic rolling contact. Tribol. Int. 2021, 161, 107053. [Google Scholar] [CrossRef]
- Gschwandl, T.J.; Antretter, T.; Künstner, D.; Scheriau, S.; Daves, W. Investigation of probable squat growth from initial surface cracks in rails using a three-dimensional rollover simulation. Proc. Inst. Mech. Eng. Part F J. Rail Rapid Transit 2023, 095440972311717. [Google Scholar] [CrossRef]
- Gschwandl, T.; Antretter, T.; Künstner, D.; Scheriau, S.; Daves, W. On the road towards understanding squats: 3D crack modelling and cyclic rollover simulations. In Proceedings of the 12th International Conference on Contact Mechanics and Wear of Rail/Wheel Systems (CM2022), Melbourne, VIC, Australia, 4–7 September 2022; pp. 560–567. [Google Scholar]
- Schnalzger, G. Material Assessment Tool for Railway Crossing Components. Ph.D. Dissertation, Montanuniversität Leoben, Leoben, Austria, 2022. [Google Scholar]
- Schnalzger, G.; Maierhofer, J.; Daves, W.; Pippan, R.; Hohenwarter, A. Fatigue crack growth of deformed pearlitic rail steels under multiaxial loading. Procedia Struct. Integr. 2022, 39, 313–326. [Google Scholar] [CrossRef]
- Velic, D.; Krobath, M.; Stocker, E.; Ossberger, U.; Gsodam, J.; Daves, W. A finite element modelling approach for the numerical analysis of switch rail contact loading and cyclic profile degradation. Proc. Inst. Mech. Eng. Part F J. Rail Rapid Transit 2022, p. 095440972210956. [Google Scholar] [CrossRef]
- Pletz, M.; Meyer, K.A.; Künstner, D.; Scheriau, S.; Daves, W. Cyclic plastic deformation of rails in rolling/sliding contact FE calculations using different plasticity models. Wear 2019, 436–437, 202992. [Google Scholar] [CrossRef]
- Daves, W.; Kubin, W.; Scheriau, S.; Pletz, M. A finite element model to simulate the physical mechanisms of wear and crack initiation in wheel/rail contact. Wear 2016, 366-367, 78–83. [Google Scholar] [CrossRef]


Disclaimer/Publisher’s Note: The statements, opinions and data contained in all publications are solely those of the individual author(s) and contributor(s) and not of MDPI and/or the editor(s). MDPI and/or the editor(s) disclaim responsibility for any injury to people or property resulting from any ideas, methods, instructions or products referred to in the content. |
© 2023 by the authors. Licensee MDPI, Basel, Switzerland. This article is an open access article distributed under the terms and conditions of the Creative Commons Attribution (CC BY) license (https://creativecommons.org/licenses/by/4.0/).