Article

Study of Structure and Phase Transformations in Rejuvenated Rapidly Quenched TiNiCu Alloys

by
Alexander Shelyakov
1,*,
Nikolay Sitnikov
1,2,
Irina Zaletova
2,
Kirill Borodako
1 and
Natalia Tabachkova
3
1
Department of Solid State Physics and Nanosystems, National Research Nuclear University MEPhI (Moscow Engineering Physics Institute), Kashirskoe Shosse 31, Moscow 115409, Russia
2
JSC SSC “Keldysh Research Center”, Onezhskaya St. 8, Moscow 125438, Russia
3
Department of Material Science of Semiconductors and Dielectrics, National University of Science and Technology “MISiS”, Leninskiy Pr. 4, Moscow 119049, Russia
*
Author to whom correspondence should be addressed.
Metals 2023, 13(7), 1175; https://doi.org/10.3390/met13071175
Submission received: 29 May 2023 / Revised: 14 June 2023 / Accepted: 19 June 2023 / Published: 24 June 2023
(This article belongs to the Special Issue Thermal and Structural Properties of Shape Memory Alloys)

Abstract

:
Alloys of the quasibinary TiNi-TiCu system manufactured by melt quenching in the form of thin 20–50 μm ribbons have proven to show good potential as materials for the fabrication of micromechanical devices. At high cooling rates (about 106 K/s), this method allows producing high-copper (more than 20 at.%) amorphous alloys which exhibit an excellent shape-memory effect after crystallization. Their properties are known to largely depend on the crystallization conditions and the structure of the initial amorphous material acting as a precursor for the formation of crystal phases. It has been shown recently that the rejuvenation procedure (cryogenic thermocycling) of metallic glasses is one of the most promising methods of improving their properties. In this study, we investigated for the first time the effect of cryogenic thermocycling of rapidly quenched amorphous TiNiCu on the initial state, as well as on structure formation and the phase transformation patterns of subsequent crystallization conducted using various methods. The effect was analyzed utilizing the methods of scanning and transmission electron microscopy, X-ray diffraction analysis, and differential scanning calorimetry. The results show that rejuvenation treatment slightly reduces the glass transition and crystallization onset temperatures and moderately changes the sizes of structural features (grains, martensite plates), the quantity of the martensite phase, and the characteristic temperatures and enthalpy of the martensitic transformation.

1. Introduction

The ability of alloys with the shape-memory effect (SME) to exhibit their unique properties on a micrometer scale permanently broadens the range of their MEMS applications [1,2,3,4,5]. The development of miniaturized fast-acting devices based on SME alloys requires fine materials exhibiting a narrow temperature hysteresis of the martensitic transformation and the SME. Promising materials that meet the above requirements are quasibinary intermetallic TiNi-TiCu system alloys rapidly quenched from the liquid state in the form of thin 20–50 μm ribbons [6,7]. At high cooling rates (about 106 °C/s), this method allows for the production of high-copper (more than 20 at.%) amorphous alloys which exhibit excellent performance and a narrow temperature hysteresis of the SME after crystallization [8,9,10,11,12,13,14]. Their properties largely depend on the structure of the initial amorphous material. We have recently shown [15] that the thermal and deformation treatment of rapidly quenched high-copper TiNi-TiCu system alloys in the amorphous state has a major effect on the structure formation and phase transformations in the alloys, e.g., on the shape and size of grains, the number of defects in the subgrain structure, and the critical temperatures of the martensitic transformation. In this study, the amorphous alloys were subjected to additional heat treatment using the so-called rejuvenation procedure, which involves the structural excitation of amorphous materials and leads to an increase in the enthalpy and free volume, i.e., triggering a reverse aging process [16,17,18]. Rejuvenation treatment is one of the most promising approaches to the improvement of the deformability of amorphous metals that typically undergo macroscopic-scale brittle fracture [19]. It was shown [20] that cryogenic thermocycling, which includes short-term heating and subsequent cooling to low temperatures, allows more “relaxed” states (with a lower level of internal stress, i.e., relaxation) with a higher energy to be obtained. An X-ray diffraction study using synchrotron radiation has recently shown that cryogenic thermocycling produces short-range disordering [21]. The activation threshold of rejuvenation strongly depends on the initial structural state, e.g., the free volume, the inner stress, and the structural inhomogeneity. The structural rejuvenation of metallic glasses increases the potential energy, reduces the density, changes the local structure, and causes mechanical softening [22]. Furthermore, ongoing preliminary experiments revealed a significant (up to 10%) increase in the reversible SME in the melt-spun TiNiCu alloys after the rejuvenation procedure. It is well known that the SME originates from the martensitic transformation, which is a structural phase transformation. Therefore, we studied for the first time the effect of the cryogenic thermocycling of rapidly quenched amorphous high-copper TiNi-TiCu system alloys on both the initial state and the structure formation upon subsequent crystallization conducted via various methods, as well as on the phase transformation patterns.

2. Materials and Methods

The TiNiCu alloys with a constant titanium content of 50 at.% and copper contents of 25 and 30 at.% (hereinafter denoted as 25Cu and 30Cu, respectively) were obtained by melt quenching (melt-spinning technique) at a cooling rate of about 106 °C/s, resulting in the manufacture of thin ribbons with a width of 1.5–2.5 mm [7]. Since the 30Cu alloy has a greater tendency to amorphize than the 25Cu alloy, higher cooling rates are required to obtain the latter in a completely amorphous state, which leads to a decrease in the thickness of the ribbon. In this study, the average thickness of the ribbons from 25Cu and 30Cu alloys was 21 µm and 40 µm, respectively.
The rapidly quenched TiNiCu ribbons were rejuvenated using two methods. For the first, the following cryogenic thermocycling was used: the amorphous ribbons were subjected to 10 isothermal cycles, each of which included a 120 s specimen exposure at −196 °C in liquid nitrogen, followed by a 60 s exposure at 100 °C in boiling water (this treatment is henceforth abbreviated as RJ1, Figure 1a). For the other method (RJ2, Figure 1b) the ribbons underwent a one-time exposure to liquid nitrogen for 1800 s and then to boiling water for 60 s. Two series of 25Cu and 30Cu alloy test specimens with a cryothermally activated amorphous state were obtained for further tests using the above two methods.
The ribbon specimens were crystallized through isothermal annealing (I) at 500 °C in the air for 300 s (the respective specimens are denoted, e.g., specimen 25A + RJ1 + I). Furthermore, the alloys were subjected to high-rate crystallization by electropulse treatment (E) with a 10 ms exposure time (respectively denoted 25A + RJ1 + E). This method consists in passing a short electric current pulse with preset duration and amplitude through the specimen to heat it to the crystallization temperature due to Joule heat release. The annealing parameters were preliminarily calculated using the current density in relationship to the electric pulse duration [23]. The pulse duration was set using a generator (in the range from 1 μs to 100 ms), the signal from which was supplied to Channel 2 of the oscilloscope (blue line in Figure 2). To control the crystallization process, a resistance of 0.1 Ω was connected in series with the ribbon specimen, and the response signal from this was fed to Channel 1 of the oscilloscope (yellow line in Figure 2). Because a significant decrease in its electrical resistivity occurs during the transition of the specimen from the amorphous state to the crystalline one, a jump in the signal amplitude is observed on the waveform of Channel 1, indicating that the crystallization temperature has been reached. If the current density is too high, crystallization occurs long before the end of the heating pulse (Figure 2a). By decreasing the pulse amplitude, it is possible to reach the crystallization temperature by the end of the pulse action, the duration of which was 10 ms in the present investigation (Figure 2b).
The structure of the alloys was studied by metallography, electron microscopy and X-ray diffraction (XRD). Transverse polished sections of ribbon specimens were prepared with Buehler equipment (Buehler, An ITW Company, Lake Bluff, IL, USA) for metallographic investigations. The polished surface was etched with an HF (5%) + H2SO4 (5%) + H2NO3 (25%) + H2O (70%) solution. The cross-section microstructure of the specimens was studied utilizing a FEI Quanta 600 FEG (Thermo Fisher Scientific Inc., Hillsboro, OR, USA) scanning electron microscope (SEM). Investigations of the fine structure of the alloy were carried out on a JEOL JEM 2100 (JEOL Ltd., Tokyo, Japan) transmission electron microscope (TEM). The specimens for the TEM study were prepared with the focused ion beam (FIB) technique by means of an FEI Strata 201 FIB setup (Thermo Fisher Scientific Inc., Hillsboro, OR, USA) equipped with an Omniprobe® (Oxford Instruments plc, High Wycombe, UK) nanomanipulator [15]. The XRD analysis was performed using a PANalytical Empyrean diffractometer (Malvern Panalytical plc, Malvern, UK) in Cu-Kα radiation at an angle range of 20–90° at a step of 0.1° with exposure time 5 s both at room temperature and at 90 °C.
To determine the effect of rejuvenation treatment on the temperature intervals and the pattern of crystallization of the alloys from the amorphous state, alloy specimens were subjected to crystallization annealing in an STA 449 F1 Jupiter (Erich NETZSCH GmbH & Co. Holding KG, Selb, Germany) differential scanning calorimeter (DSC) by heating them up to 600 °C at a heating rate of 10 °C/min. The characteristic temperatures and enthalpy of the martensitic transformations were obtained from DSC curves by heating and cooling cycles at a 20 to 100 °C range with 5 °C/min rate.

3. Results and Discussion

3.1. Crystallization Temperature Range and Pattern

Crystallization annealing in the calorimeter demonstrated that the DSC curves of all the specimens did not show any heat release or absorption peaks at below 410 °C (Figure 3). Further annealing initially led to devitrification and then triggered a single-stage polymorphic crystallization accompanied by the growth of one crystal phase B2 with the same composition as the amorphous matrix [23,24,25]. To describe the crystallization peaks, we employed the crystallization onset temperature Tonset and the crystallization end temperature Tend for the peak Tp. The crystallization onset and end temperatures corresponded to the intersection of the baseline extrapolated to the peak region with the tangential lines drawn through the curve inflexion point (Figure 4). The crystallization enthalpy ΔH was calculated as the area of the peak under the DSC curve. The calculated crystallization characteristic temperature, the glass transition temperature Tg (corresponding to the devitrification heat-absorption peak), and the enthalpy ΔH are summarized in Table 1. An increase in the copper concentration led to a noticeable decrease in the glass transition temperature (from 435.9 °C to 425.1 °C) and in the crystallization-onset temperature (from 449.5 °C to 442.1 °C) of the as-received alloys but caused a greater heat release during crystallization (from 28.4 to 30.1 J/g), indicating an increase in the amorphization degree of the alloys. This can be explained from a thermodynamic point of view as follows: since at constant pressure, enthalpy is related to entropy by the relation ΔH = T·ΔS, an increase in enthalpy with a simultaneous decrease in the crystallization temperature can occur only with an increase in entropy. Cryothermal treatment using both methods slightly reduces Tg for 30 at.% Cu alloy and Tonset for 25 at.% Cu alloy, probably due to a reconstruction of the local atomic structure as described earlier [21]. No definitive effect of cryogenic thermocycling on the other critical temperatures and enthalpy of crystallization was observed.

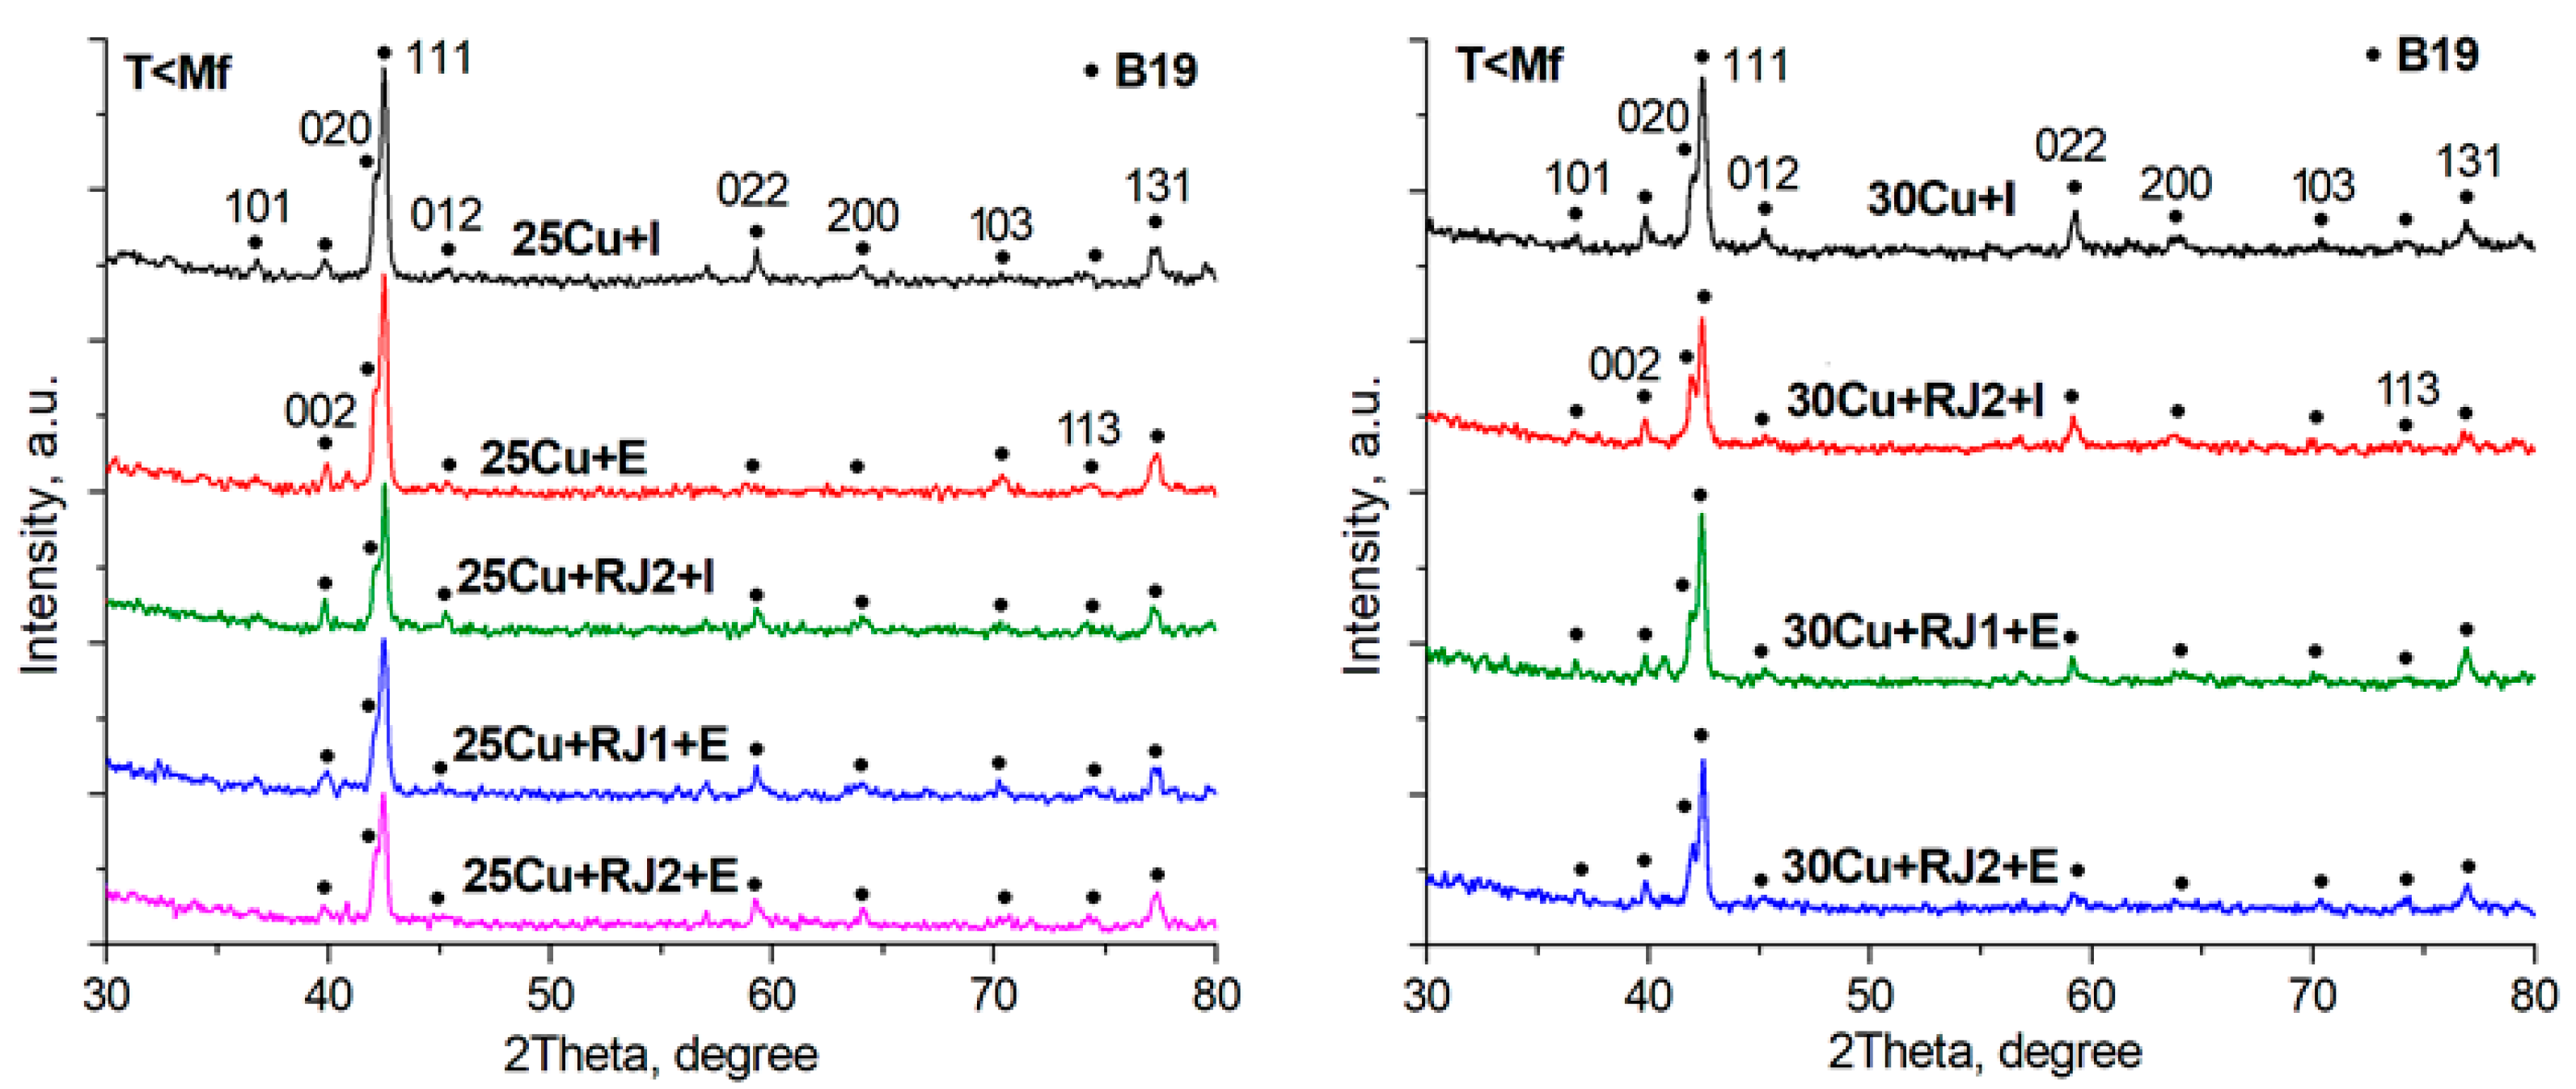
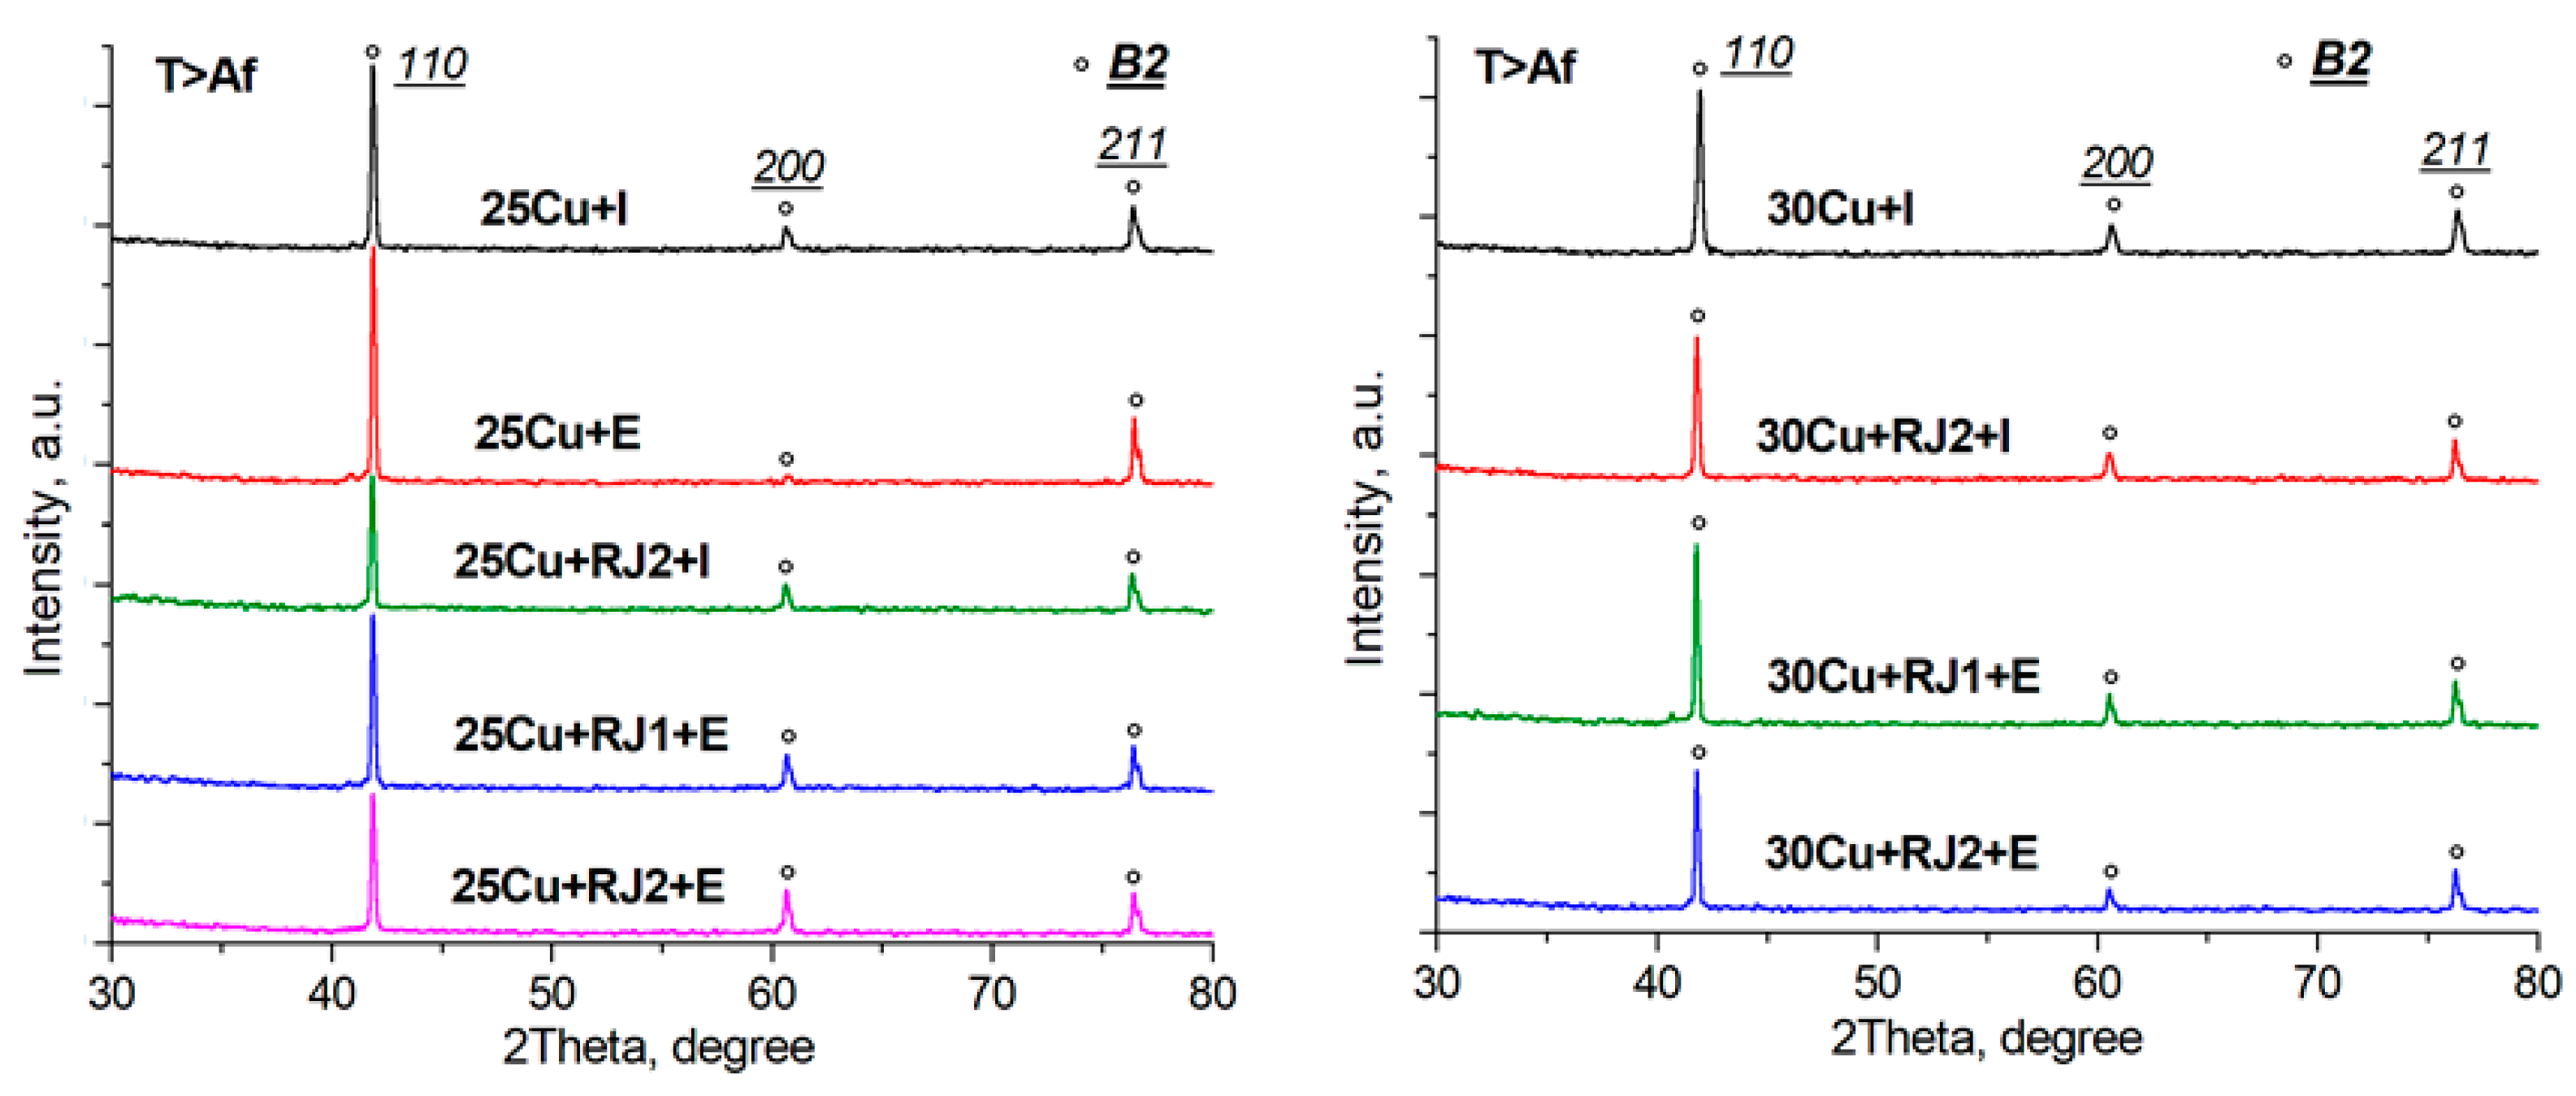
3.2. X-ray Diffraction Analysis

Next, we studied the effect of the rejuvenation-activated amorphous state on the crystal structure of the alloys formed by electropulse and isothermal treatment. As known [25], the crystallization generates the formation of an austenite cubic B2 phase that undergoes the martensitic transformation to the orthorhombic B19 phase during fast cooling after heat treatment (due to the thinness of the specimens).
XRD phase analysis showed that all the isothermally and electropulse crystallized specimens demonstrated a B19 martensite structure at room temperature (below the Mf finish temperature of direct martensitic transition) (Figure 5). Judging from the intensity of the B19 phase peaks, the electropulse crystallization of the specimens moderately increases the quantity of the martensite phase as compared with isothermal annealing. Comparison among diffraction patterns for alloys of various compositions crystallized in the initial and the as-treated amorphous state suggests that an increase in the copper content from 25 to 30 at.% (to the copper solubility limit in TiNi) slightly reduces the intensity of the martensite B19 phase reflections. In the meantime, alloy rejuvenation treatment also leads to the B19 peak reduction, the effect of RJ2 treatment being somewhat greater than that of RJ1. As shown earlier [26,27], the structure forming after crystallization is largely controlled by the local atomic structure of the alloys (local neighborhood and atomic bond lengths). One can therefore assume that the experimental data can be accounted for by changes in the local structure of the amorphous state due to cryogenic thermocycling, but additional extended X-ray absorption fine structure spectroscopy (EXAFS) studies are required to confirm this.
Heating to 90 °C (above the Af finish temperature of reverse martensitic transition) converts all the specimens to a completely austenitic state with a B2 structure due to the B19B2 martensitic phase transformation, as confirmed by the absence of the B19 phase peaks and the presence of only the B2 phase reflections in the X-ray diffraction patterns (Figure 6). X-ray structural studies of the austenitic state in the alloy specimens fully confirm the structural evolution trends, depending on the copper content, cryogenic treatment in the amorphous state, and the crystallization method established for the martensitic state.

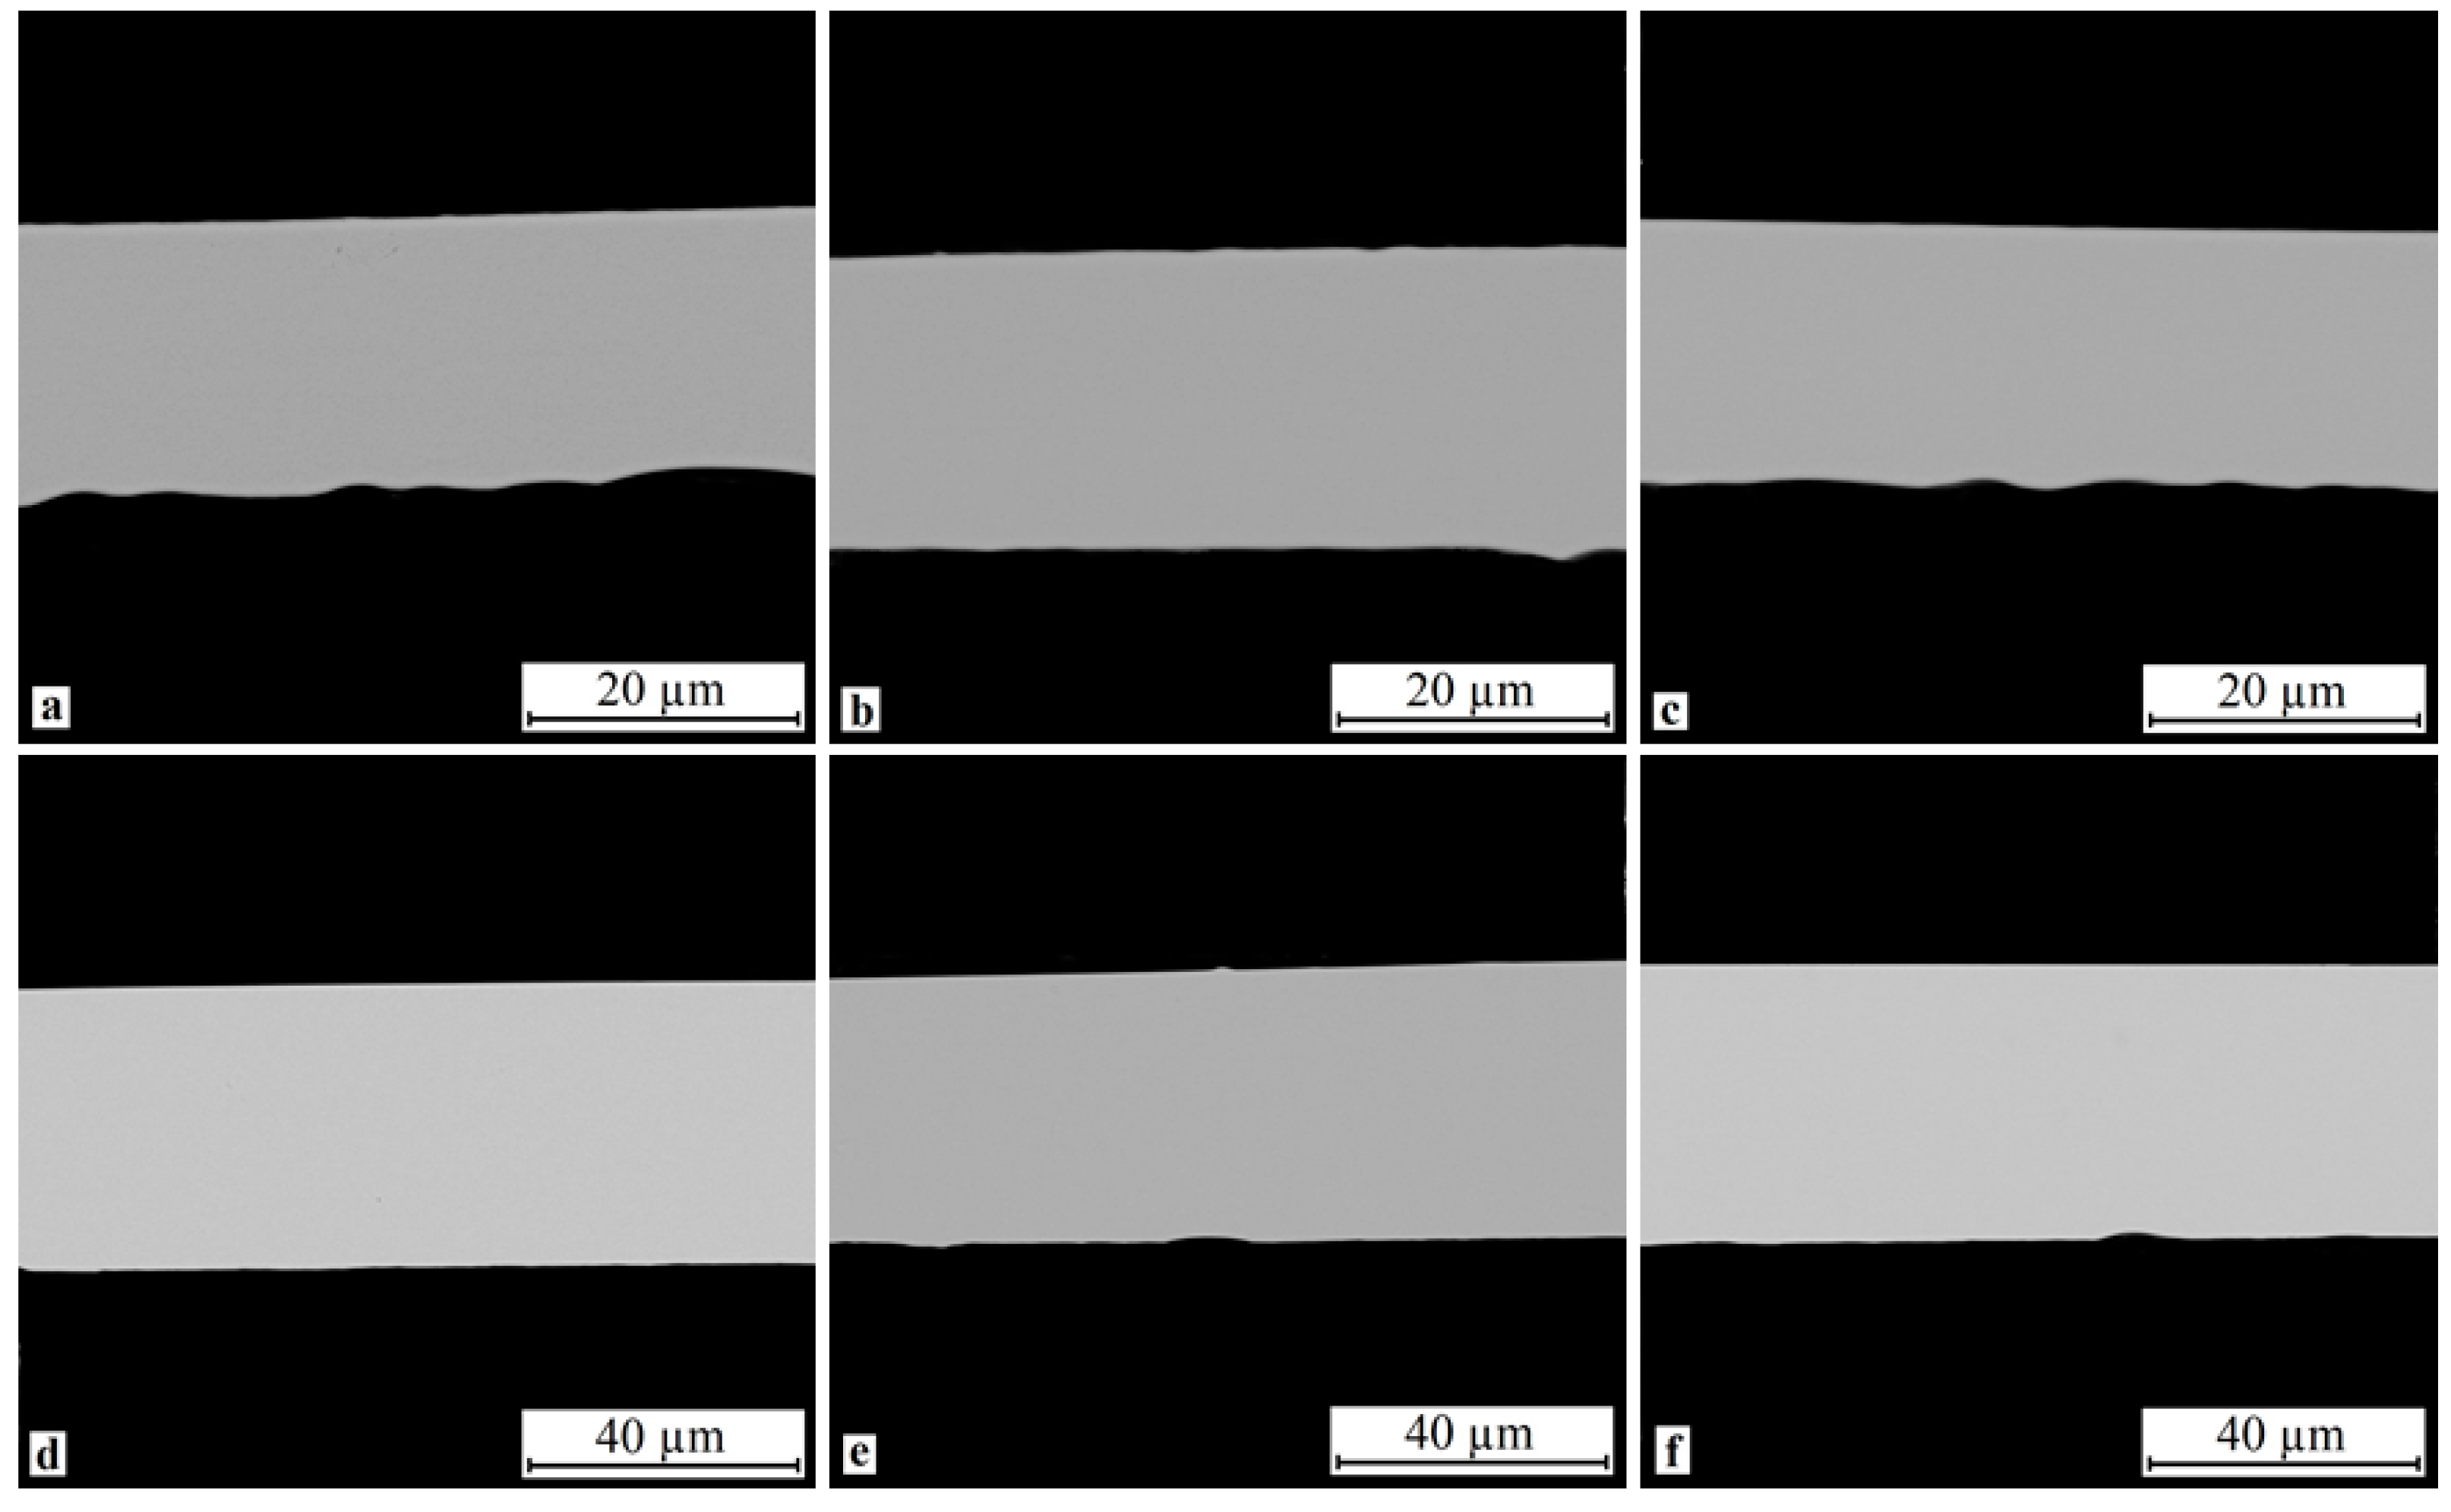
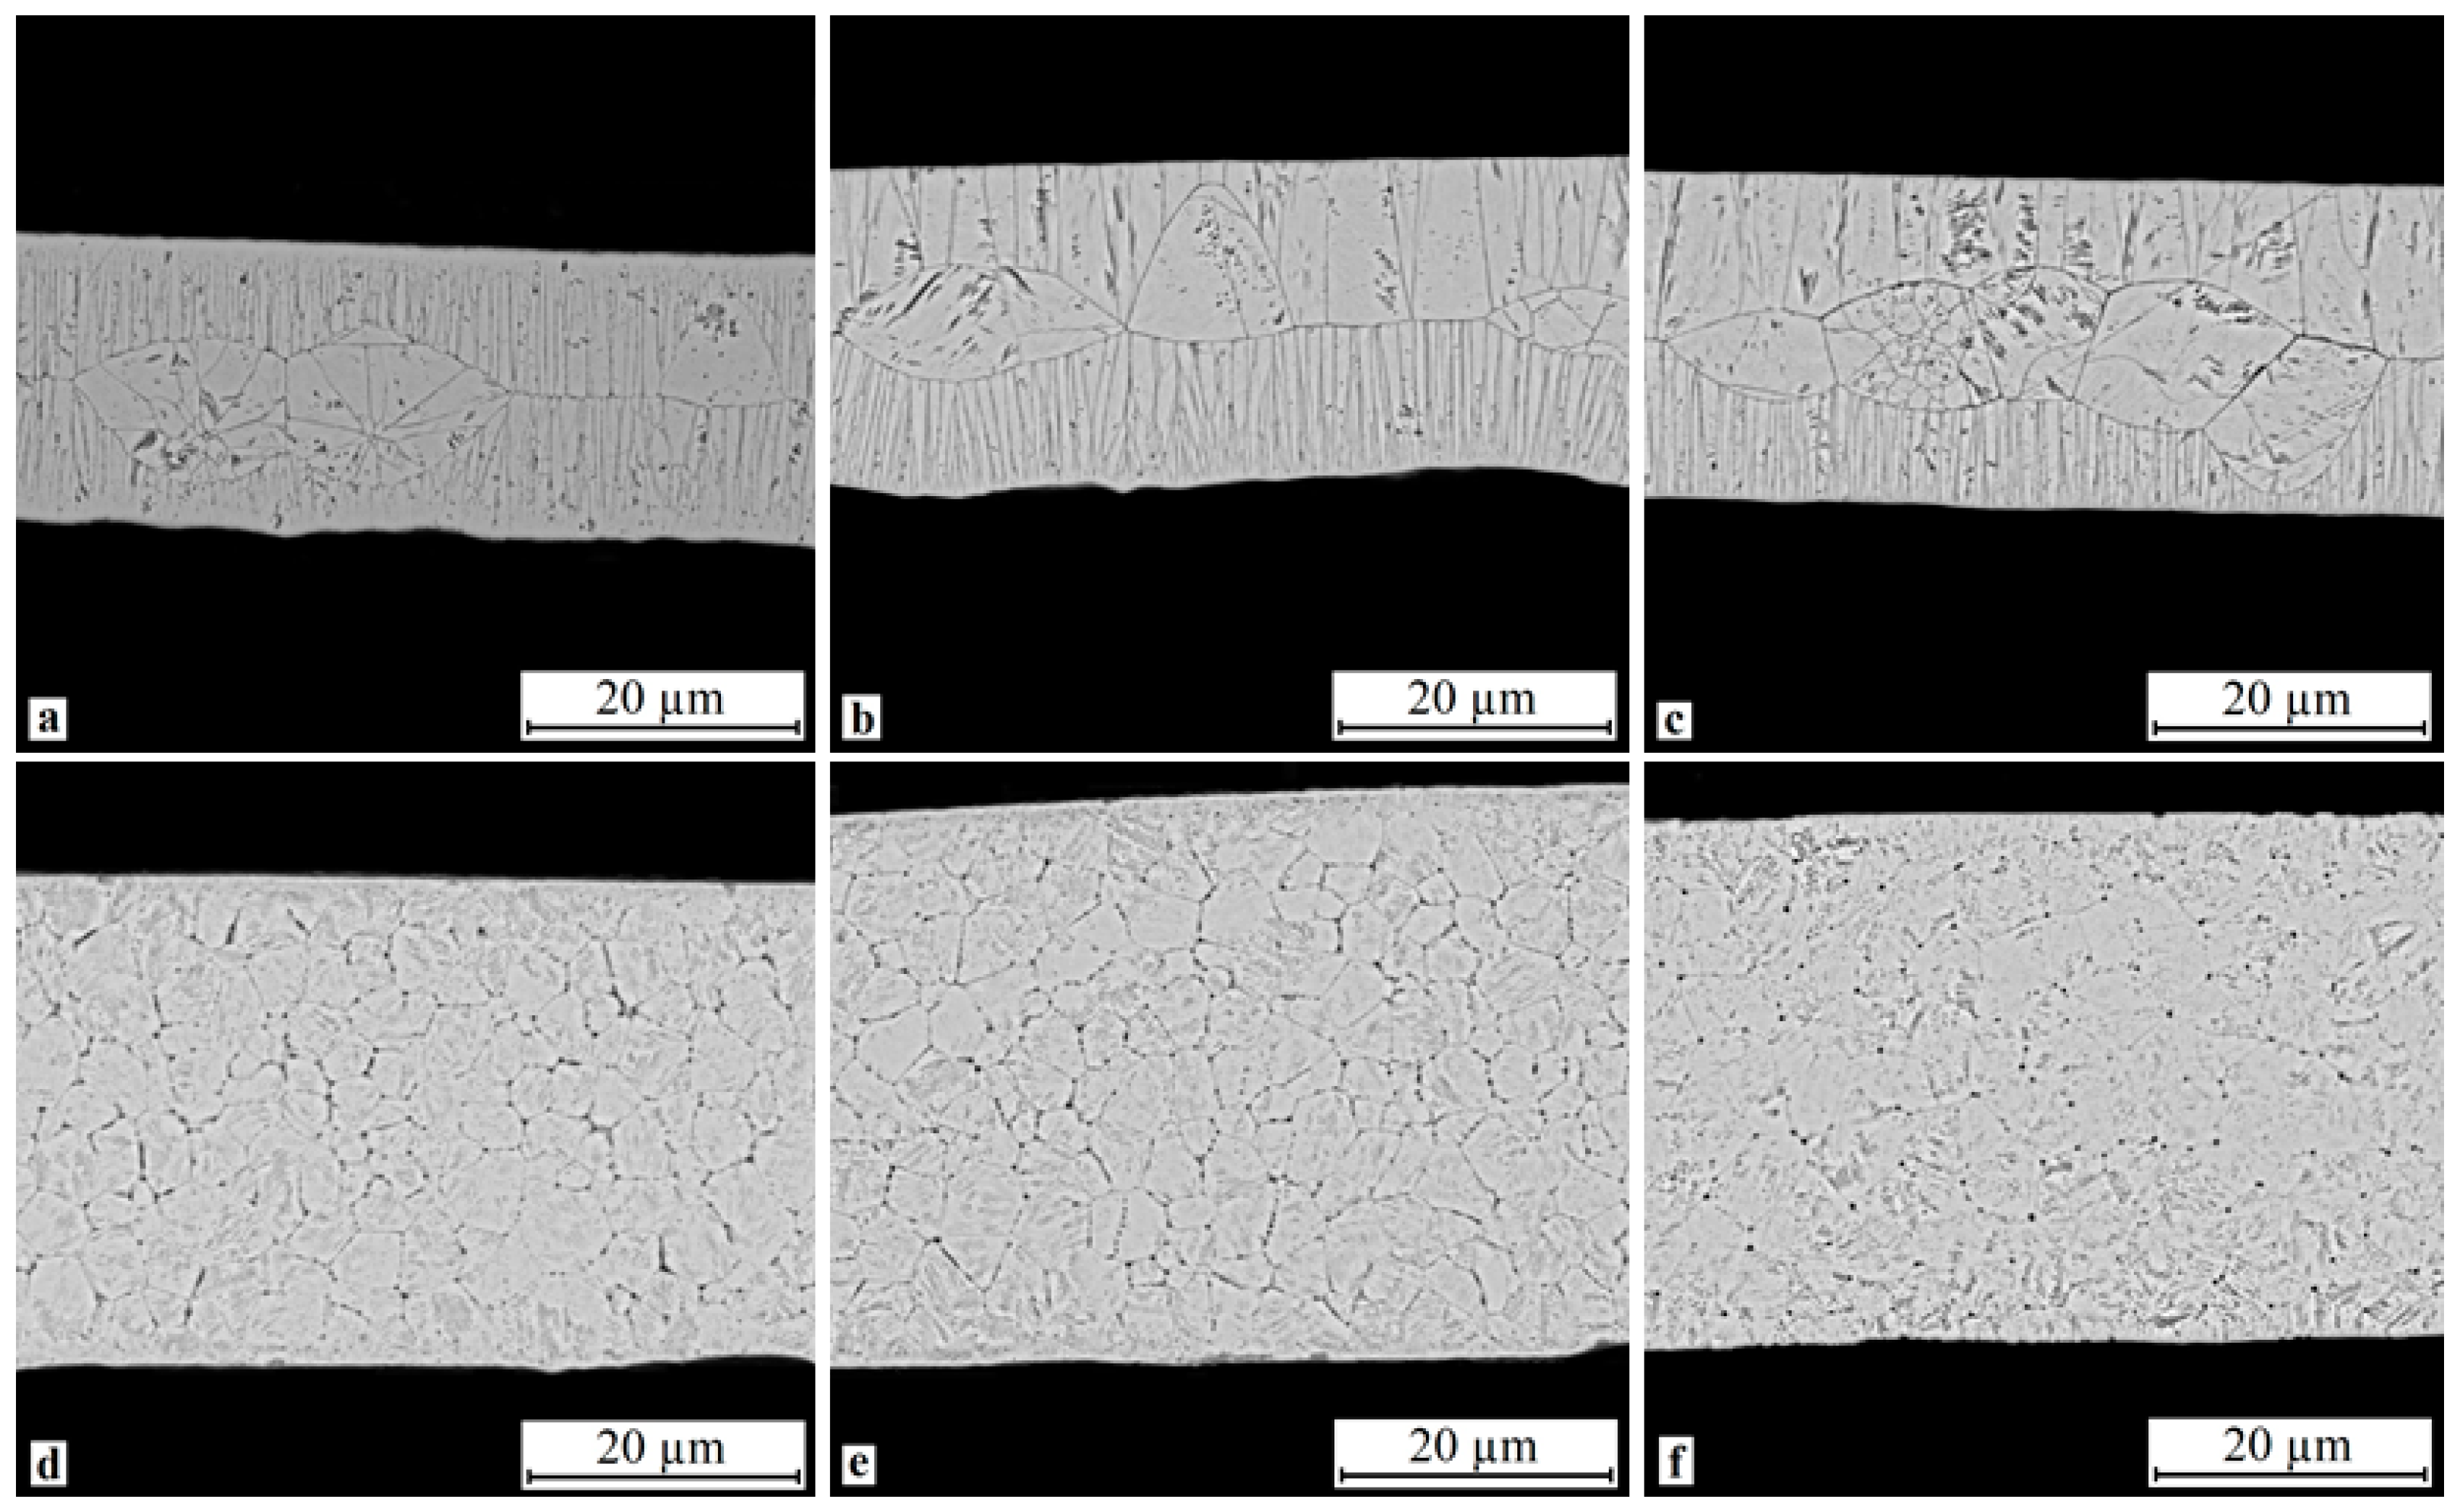
3.3. Cross-Sectional Microstructure of Rapidly Quenched Ribbons

The cross-sectional SEM studies of rapidly quenched ribbons did not reveal any structural features, e.g., crystallites, on the surface or in the bulk of the ribbons, either in the initial as-quenched state (Figure 7a,d) or after rejuvenation treatment (Figure 7b,c,e,f), i.e., the SEM images show a completely amorphous structure. Isothermal crystallization of the 25 and 30 at.% Cu specimens forms a submicron-size crystal structure with an average grain size of 0.4–1.0 μm and a subgrain structure (Figure 8). An increase in the copper content moderately changes the type of the structure, e.g., the 30Cu alloy has a more homogeneous structure (Figure 8d–f), whereas the 25Cu alloy contains a small fraction of columnar crystallites near the surface (Figure 8a–c). Treatment in the amorphous state does not change the structure of the specimens to a visible extent within the resolution of SEM.
As shown earlier [15,28], the electropulse treatment of amorphous ribbons dramatically changes the crystallization pattern in comparison with isothermal annealing (Figure 9). Cross-sectional SEM images of electropulse-crystallized 25 at.% Cu alloy ribbons show a bimorphic structure: columnar crystals form near the ribbon surface, whereas discrete or clustered large grains with a typical size of 3 to 12 μm and a subgrain structure form in the ribbon bulk (Figure 9a–c). The inhomogeneity of the grains during electropulse treatment primarily occurs due to radiation losses at the ribbon surface. Most of the columnar crystals contact the bulk ones, yet there are regions in which columnar crystals growing from opposite surfaces contact one another in the middle of the ribbon bulk. The morphology of the alloys changes noticeably with an increase in the copper content. For the 30 at.% Cu alloys, the bimorphic structure of the columnar crystals near the surface and the large crystals in the ribbon bulk is retained, but the height of the columnar crystals becomes as small as several microns, the sizes of the large crystals decreasing to 4–6 μm (Figure 9d–f). This is most likely caused because an increase in the copper content favors a higher degree of amorphization in the alloys, including in the surface regions of the ribbon. Thus, the amorphous structure of the 30 at.% Cu alloys becomes more homogeneous in comparison with that for 25 at.% Cu. One can therefore accept that the crystal nucleation rate and the crystal phase growth rate are almost equal near the ribbon surface and in the bulk of the ribbon. The experimental data did not reveal any effect of the cryogenic treatment of the alloys in the amorphous state on the cross-sectional microstructure, within the resolution of SEM.

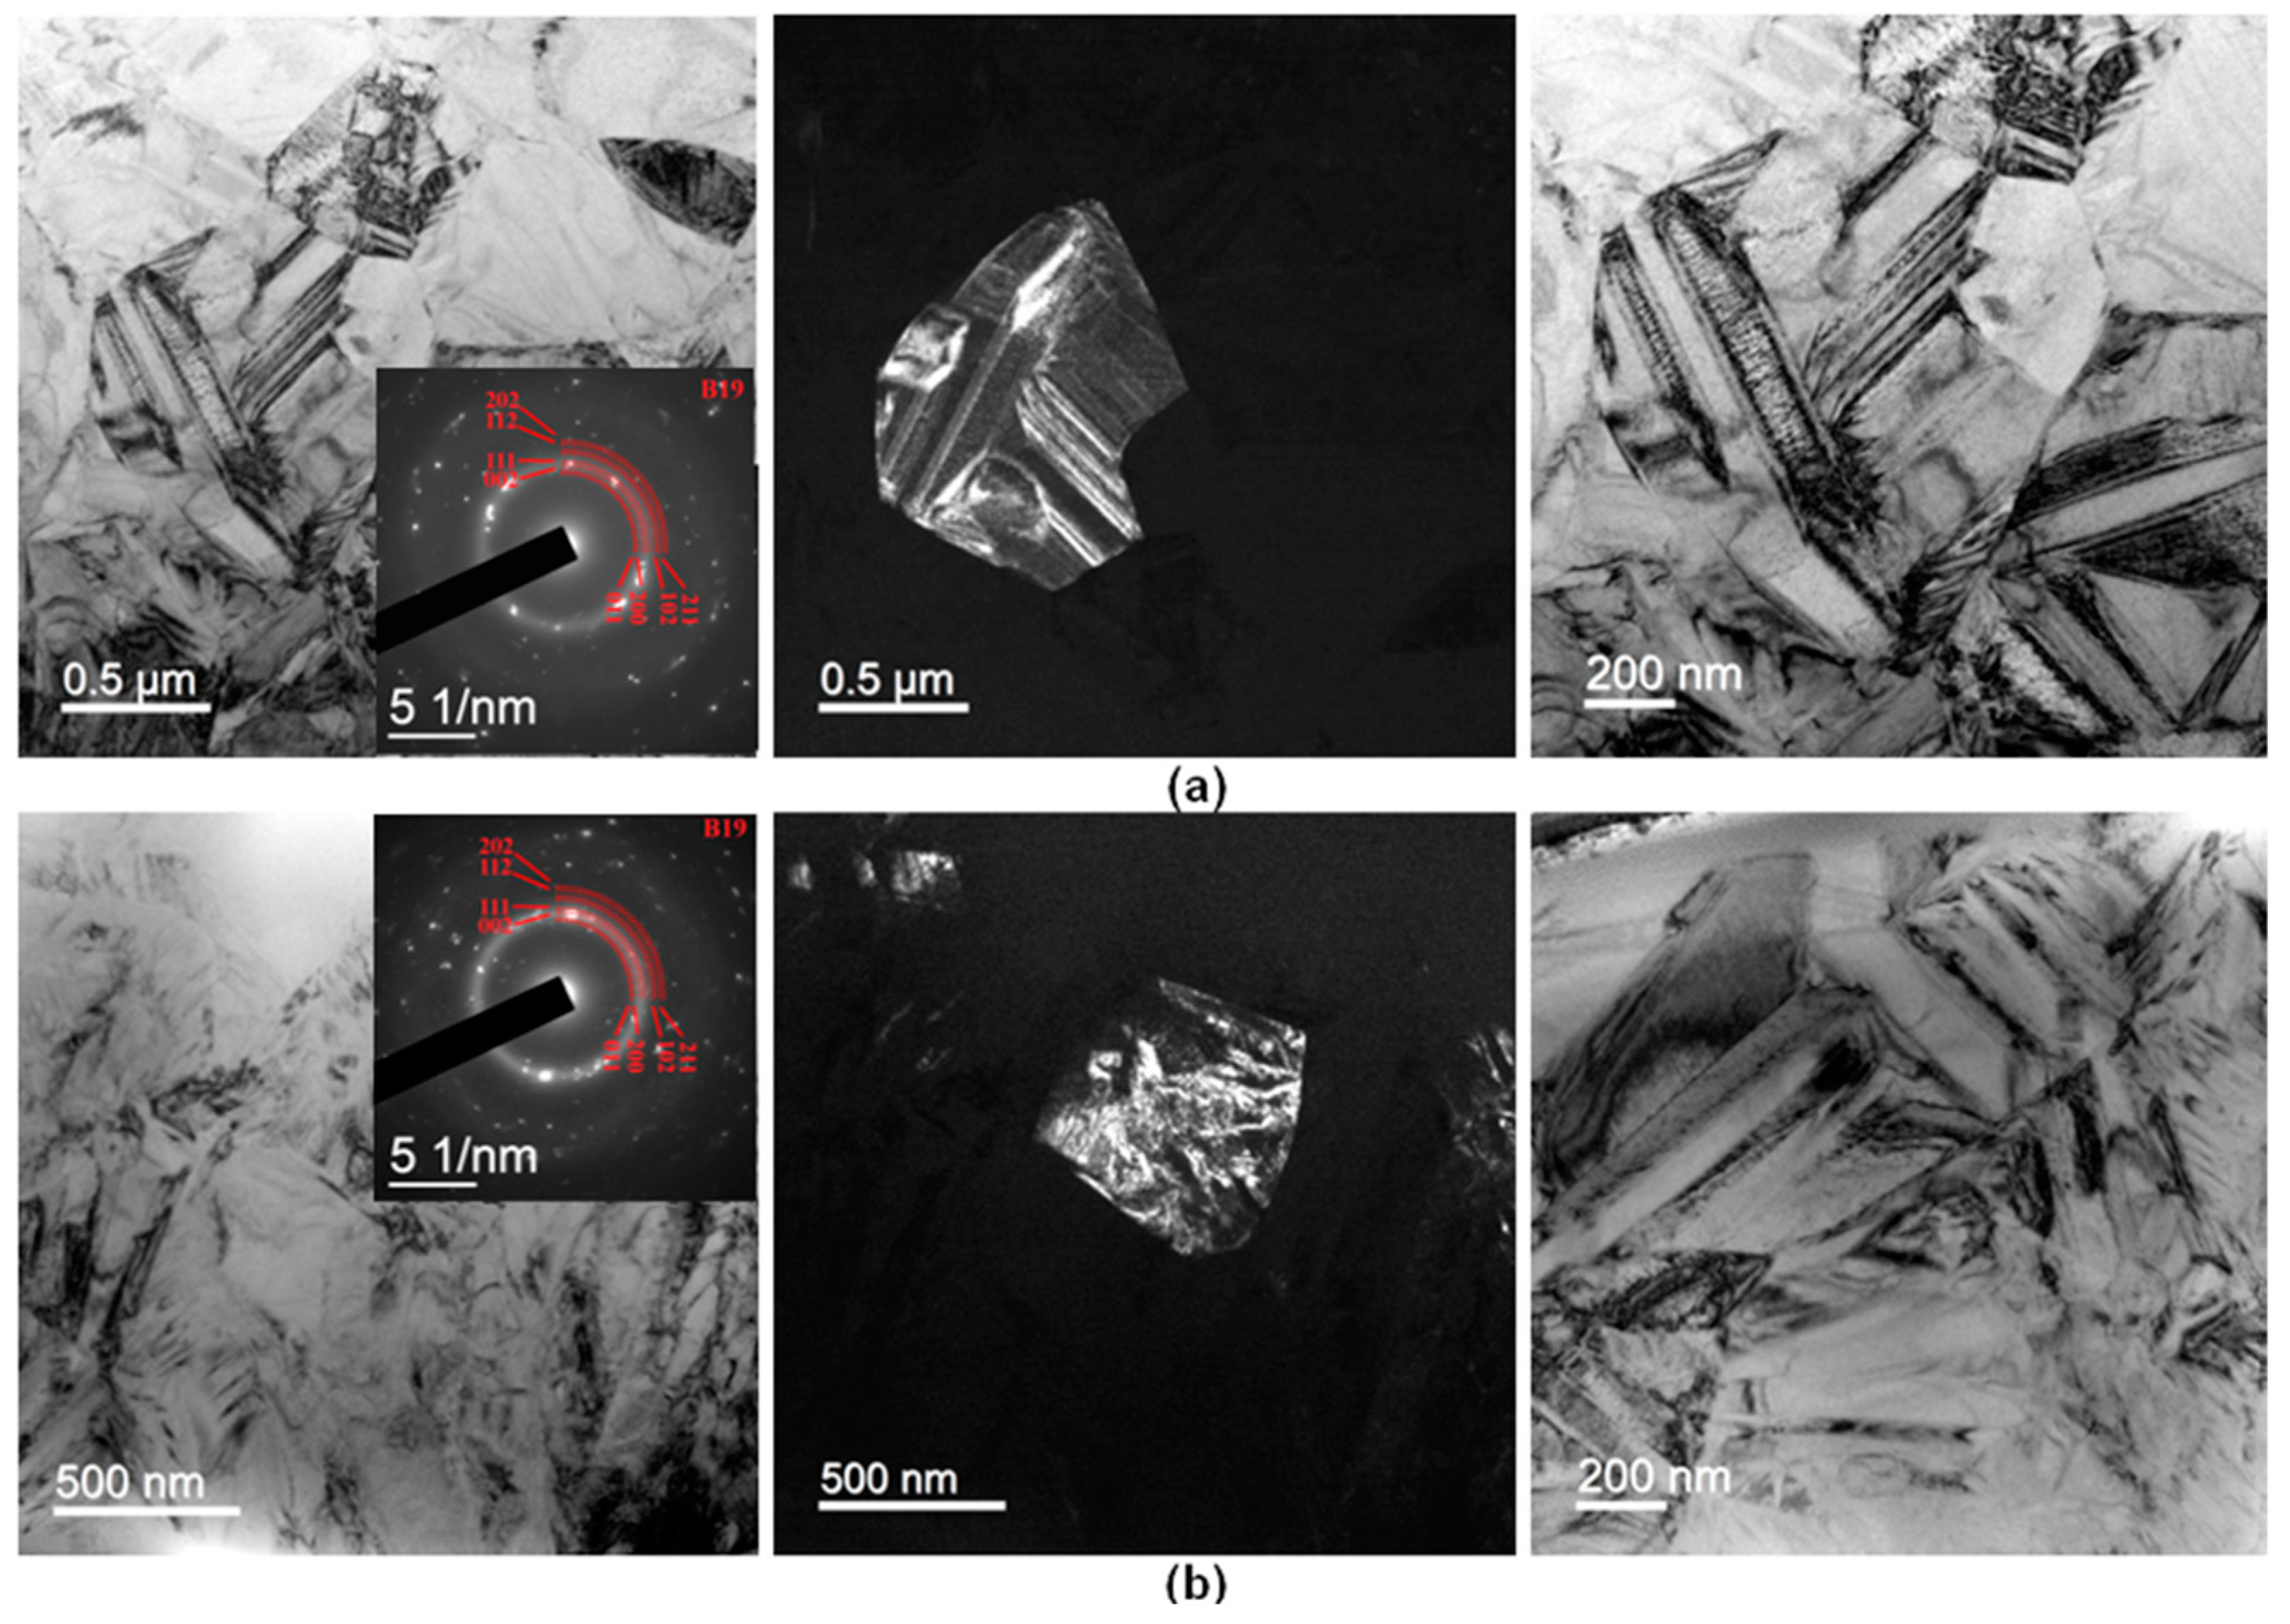
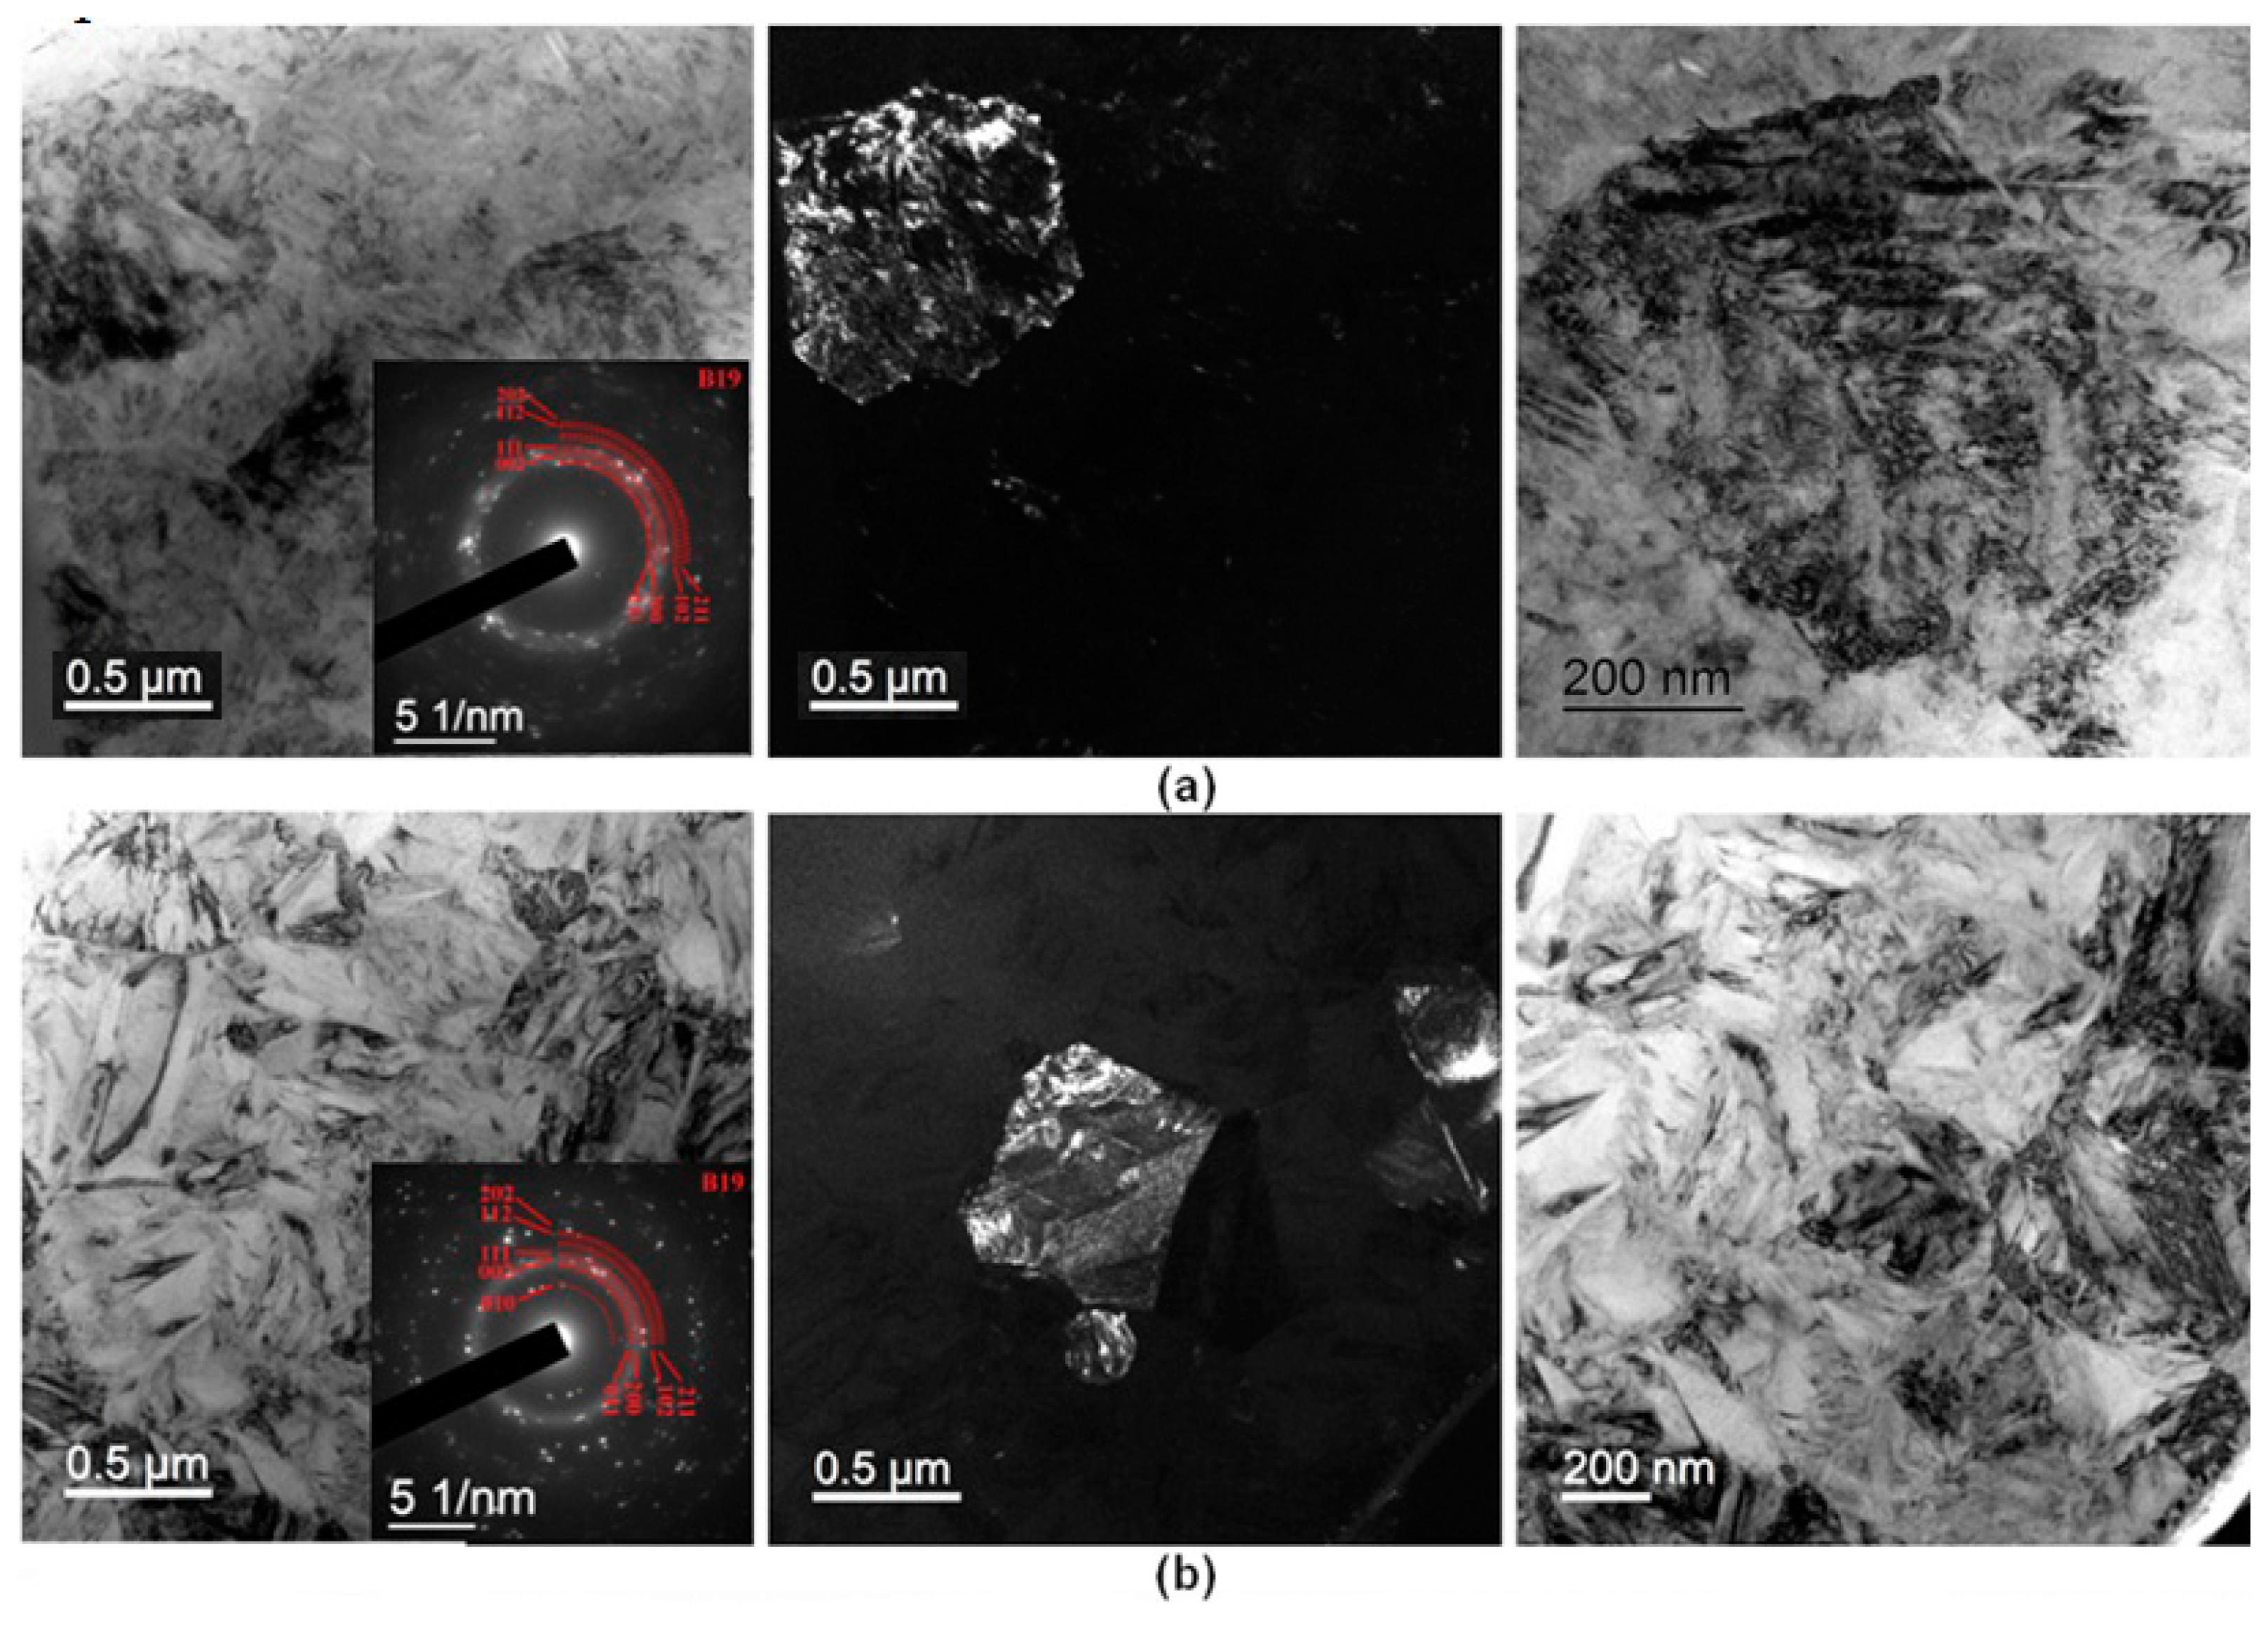
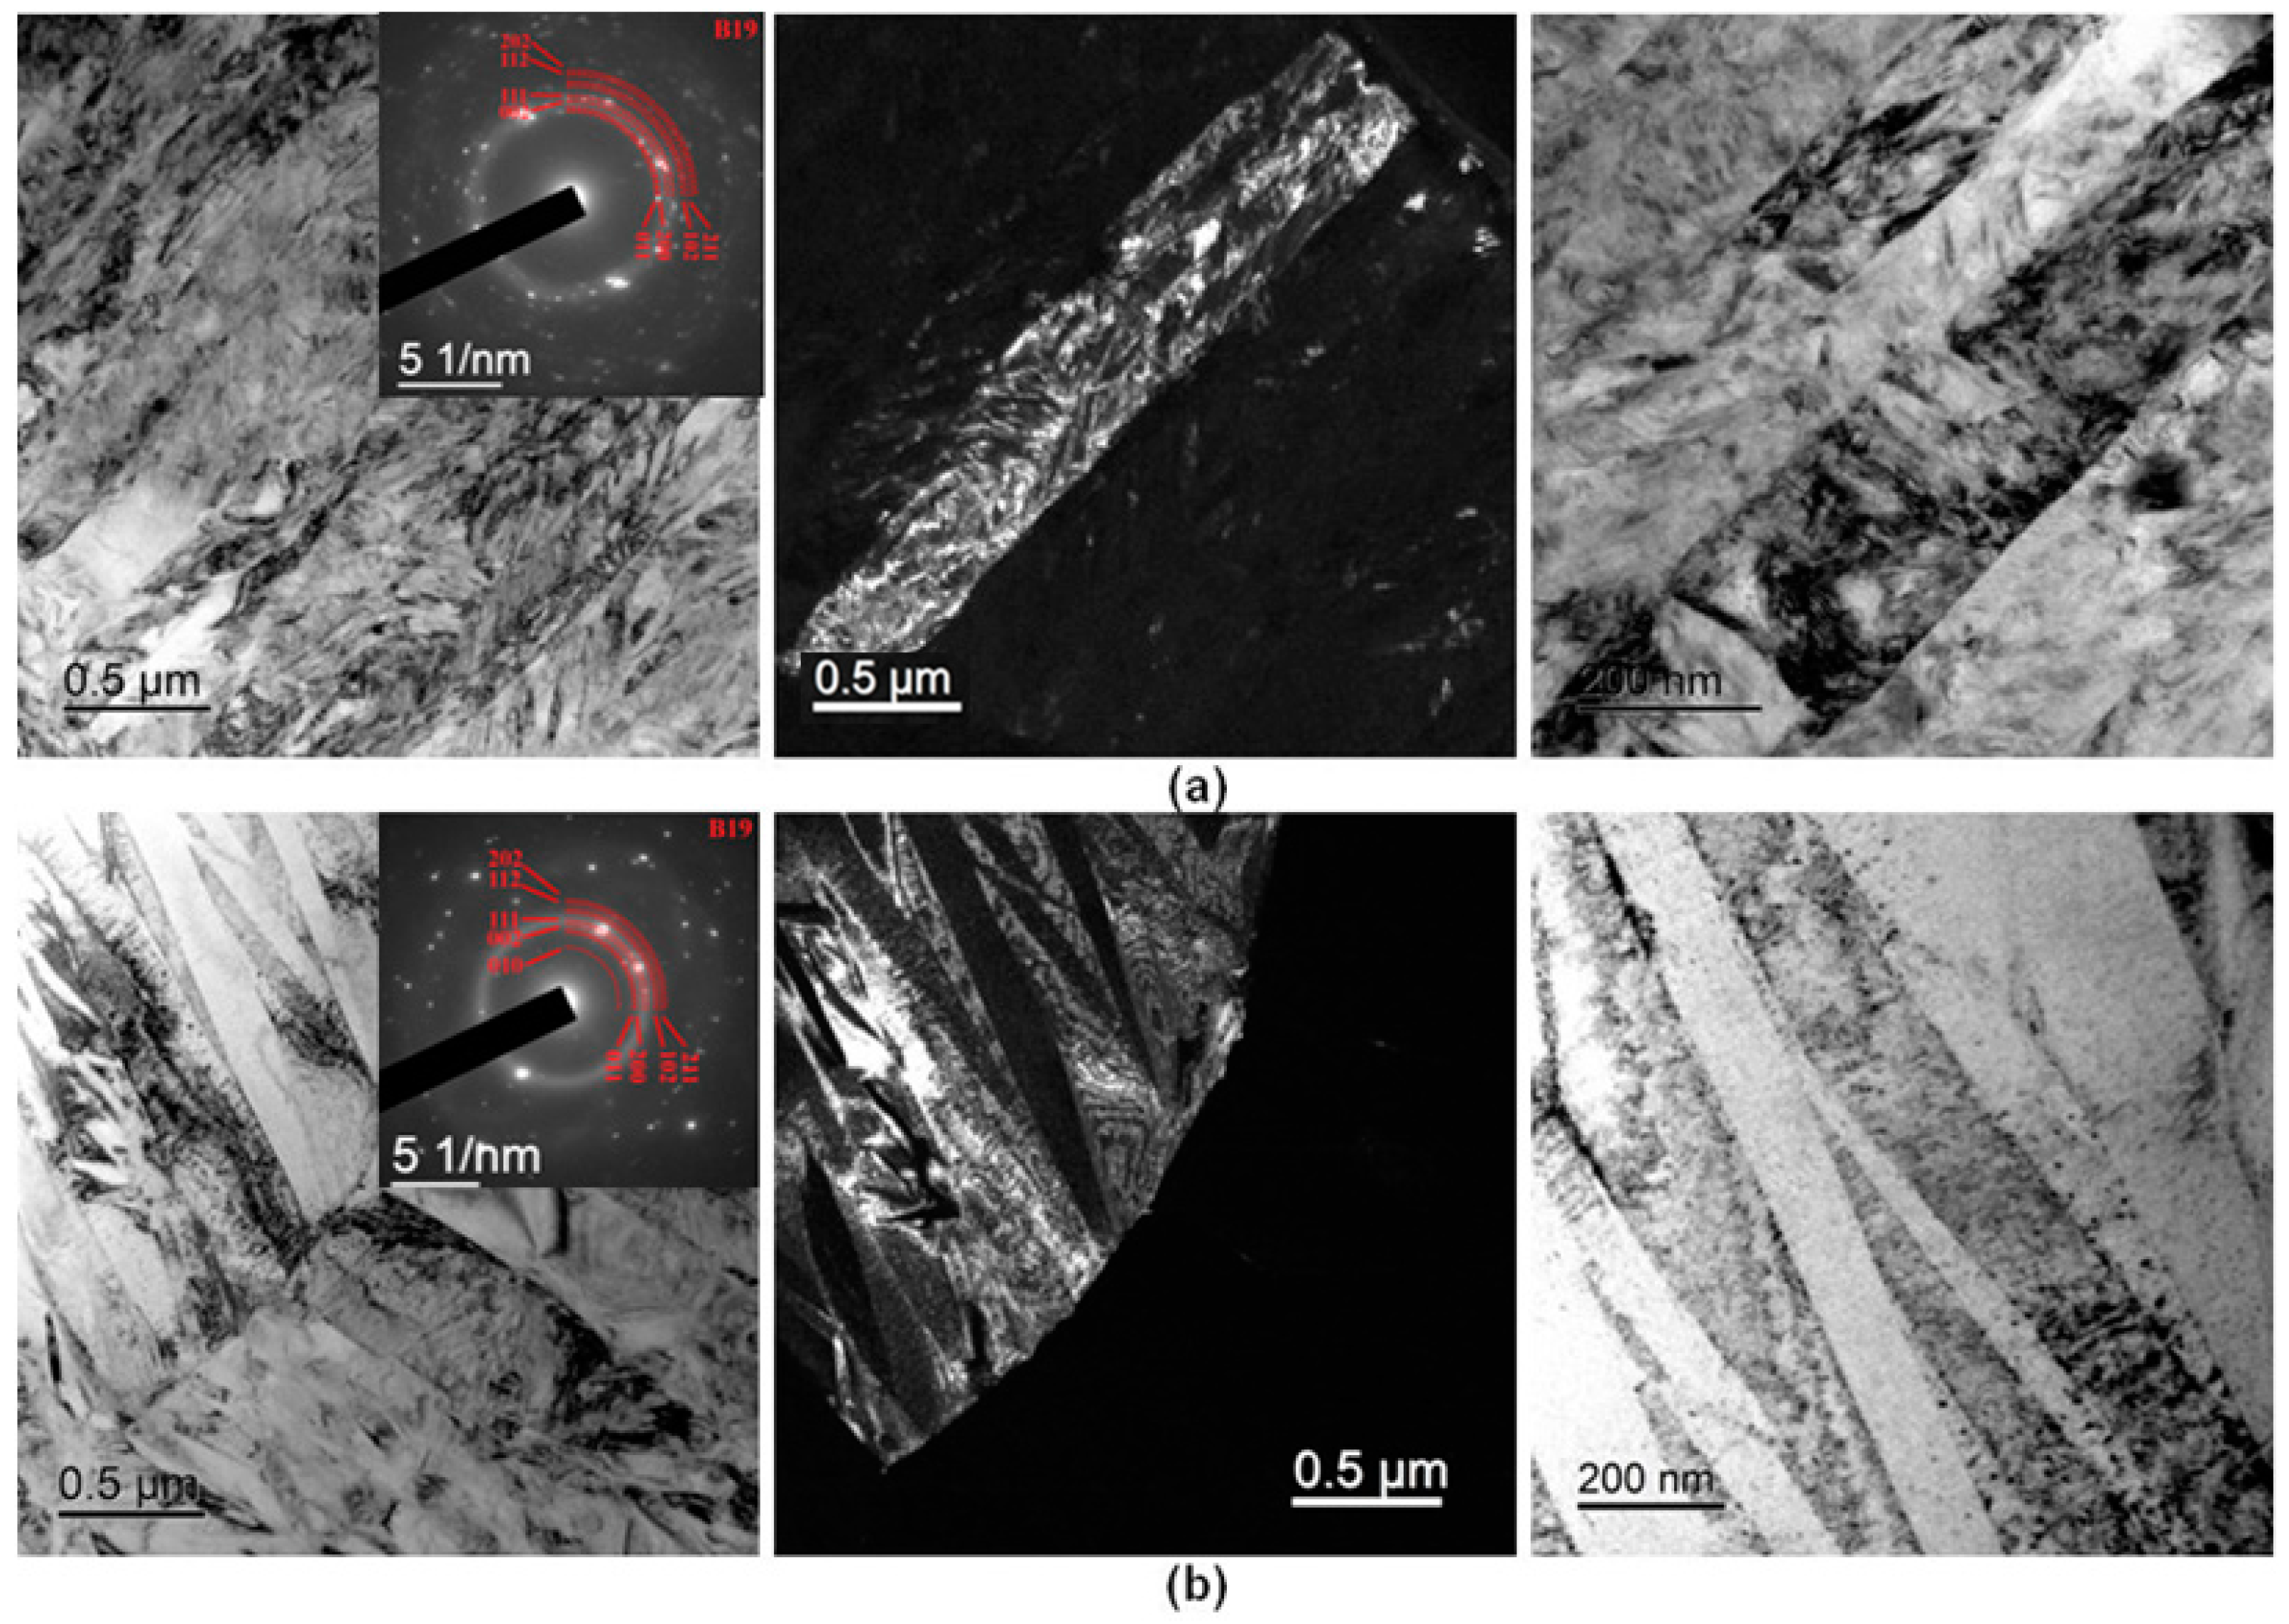
3.4. Fine Structure of Rapidly Quenched Ribbons

More detailed structural studies were conducted under a transmission electron microscope (TEM). The bright-field and dark-field TEM images showed that the 25 and 30 at.% Cu specimens after isothermal crystallization have a submicron-sized crystal structure with an average grain size of 0.5–1.0 μm (Figure 10 and Figure 11), confirming the SEM data on the alloy microstructure. The bulk of the grains exhibits a plate-like structure typical of martensite with a plate size of 10 to 100 nm and a subgrain internal structure, the selected area electron diffraction (SAED) patterns for these structural features suggesting a B19 rhombic martensite phase. The grain boundaries and the martensite plate boundaries are clearly resolved. No other phase nuclei at the grain boundaries and in the grain bulks were found. The grain shapes are exactly or nearly equiaxied, without a texture. The sizes of the grains and structural features in the 25 and 30 at.% Cu alloy specimens reveal only small differences, but the structures of the 25Cu + I and 25Cu + RJ1 + I specimens contain fewer defects. Due to the presence of defects, the imperfections in the structure of the 30Cu + I and 30Cu + RJ1 + I specimens make discrete structural features and boundaries blurred, while the difference in the structural imperfection of discrete grains can be clearly seen. No tangible difference exists between the structures of the 25Cu + I and 25Cu + RJ1 + I specimens (Figure 10). There is either no difference between the structures of the 30Cu + I and 30Cu + RJ1 + I specimens, or at greater magnifications, the sizes of the structural features are seen less clearly in the 30Cu + RJ1 + I specimen, possibly testifying to a greater number of structural defects (Figure 11).
The electropulse crystallization of the specimens stimulates the formation of far larger grains than with isothermal treatment (Figure 12 and Figure 13). The grains in the 25Cu + E and 25Cu + RJ1 + E specimens are elongated transversely to the specimen surface, reaching several microns in length and about 200 nm in width (Figure 12). The martensite plates in these specimens are finer than in the 25Cu + I and 25Cu + RJ1 + I ones, and therefore the electron diffraction patterns of the electropulse-crystallized specimens suggest a finer-grained structure than that for isothermal annealing (Figure 10). Similar structural differences can be observed for the 30 at.% Cu specimens (Figure 13). The sizes of the grains and structural features increase with an increase in the copper content from 25 to 30 at.%. The martensite plates in the 30 at.% Cu specimens are the largest and seen more clearly than those in the 25 at.% Cu specimens. This is also confirmed by the electron diffraction patterns, suggesting that the 25 at.% Cu specimen has the finest-grained structure. Furthermore, by analogy with the isothermally crystallized specimens, the electron diffraction patterns of all the specimens suggest a polycrystalline B19 structure with a well-developed subgrain structure.

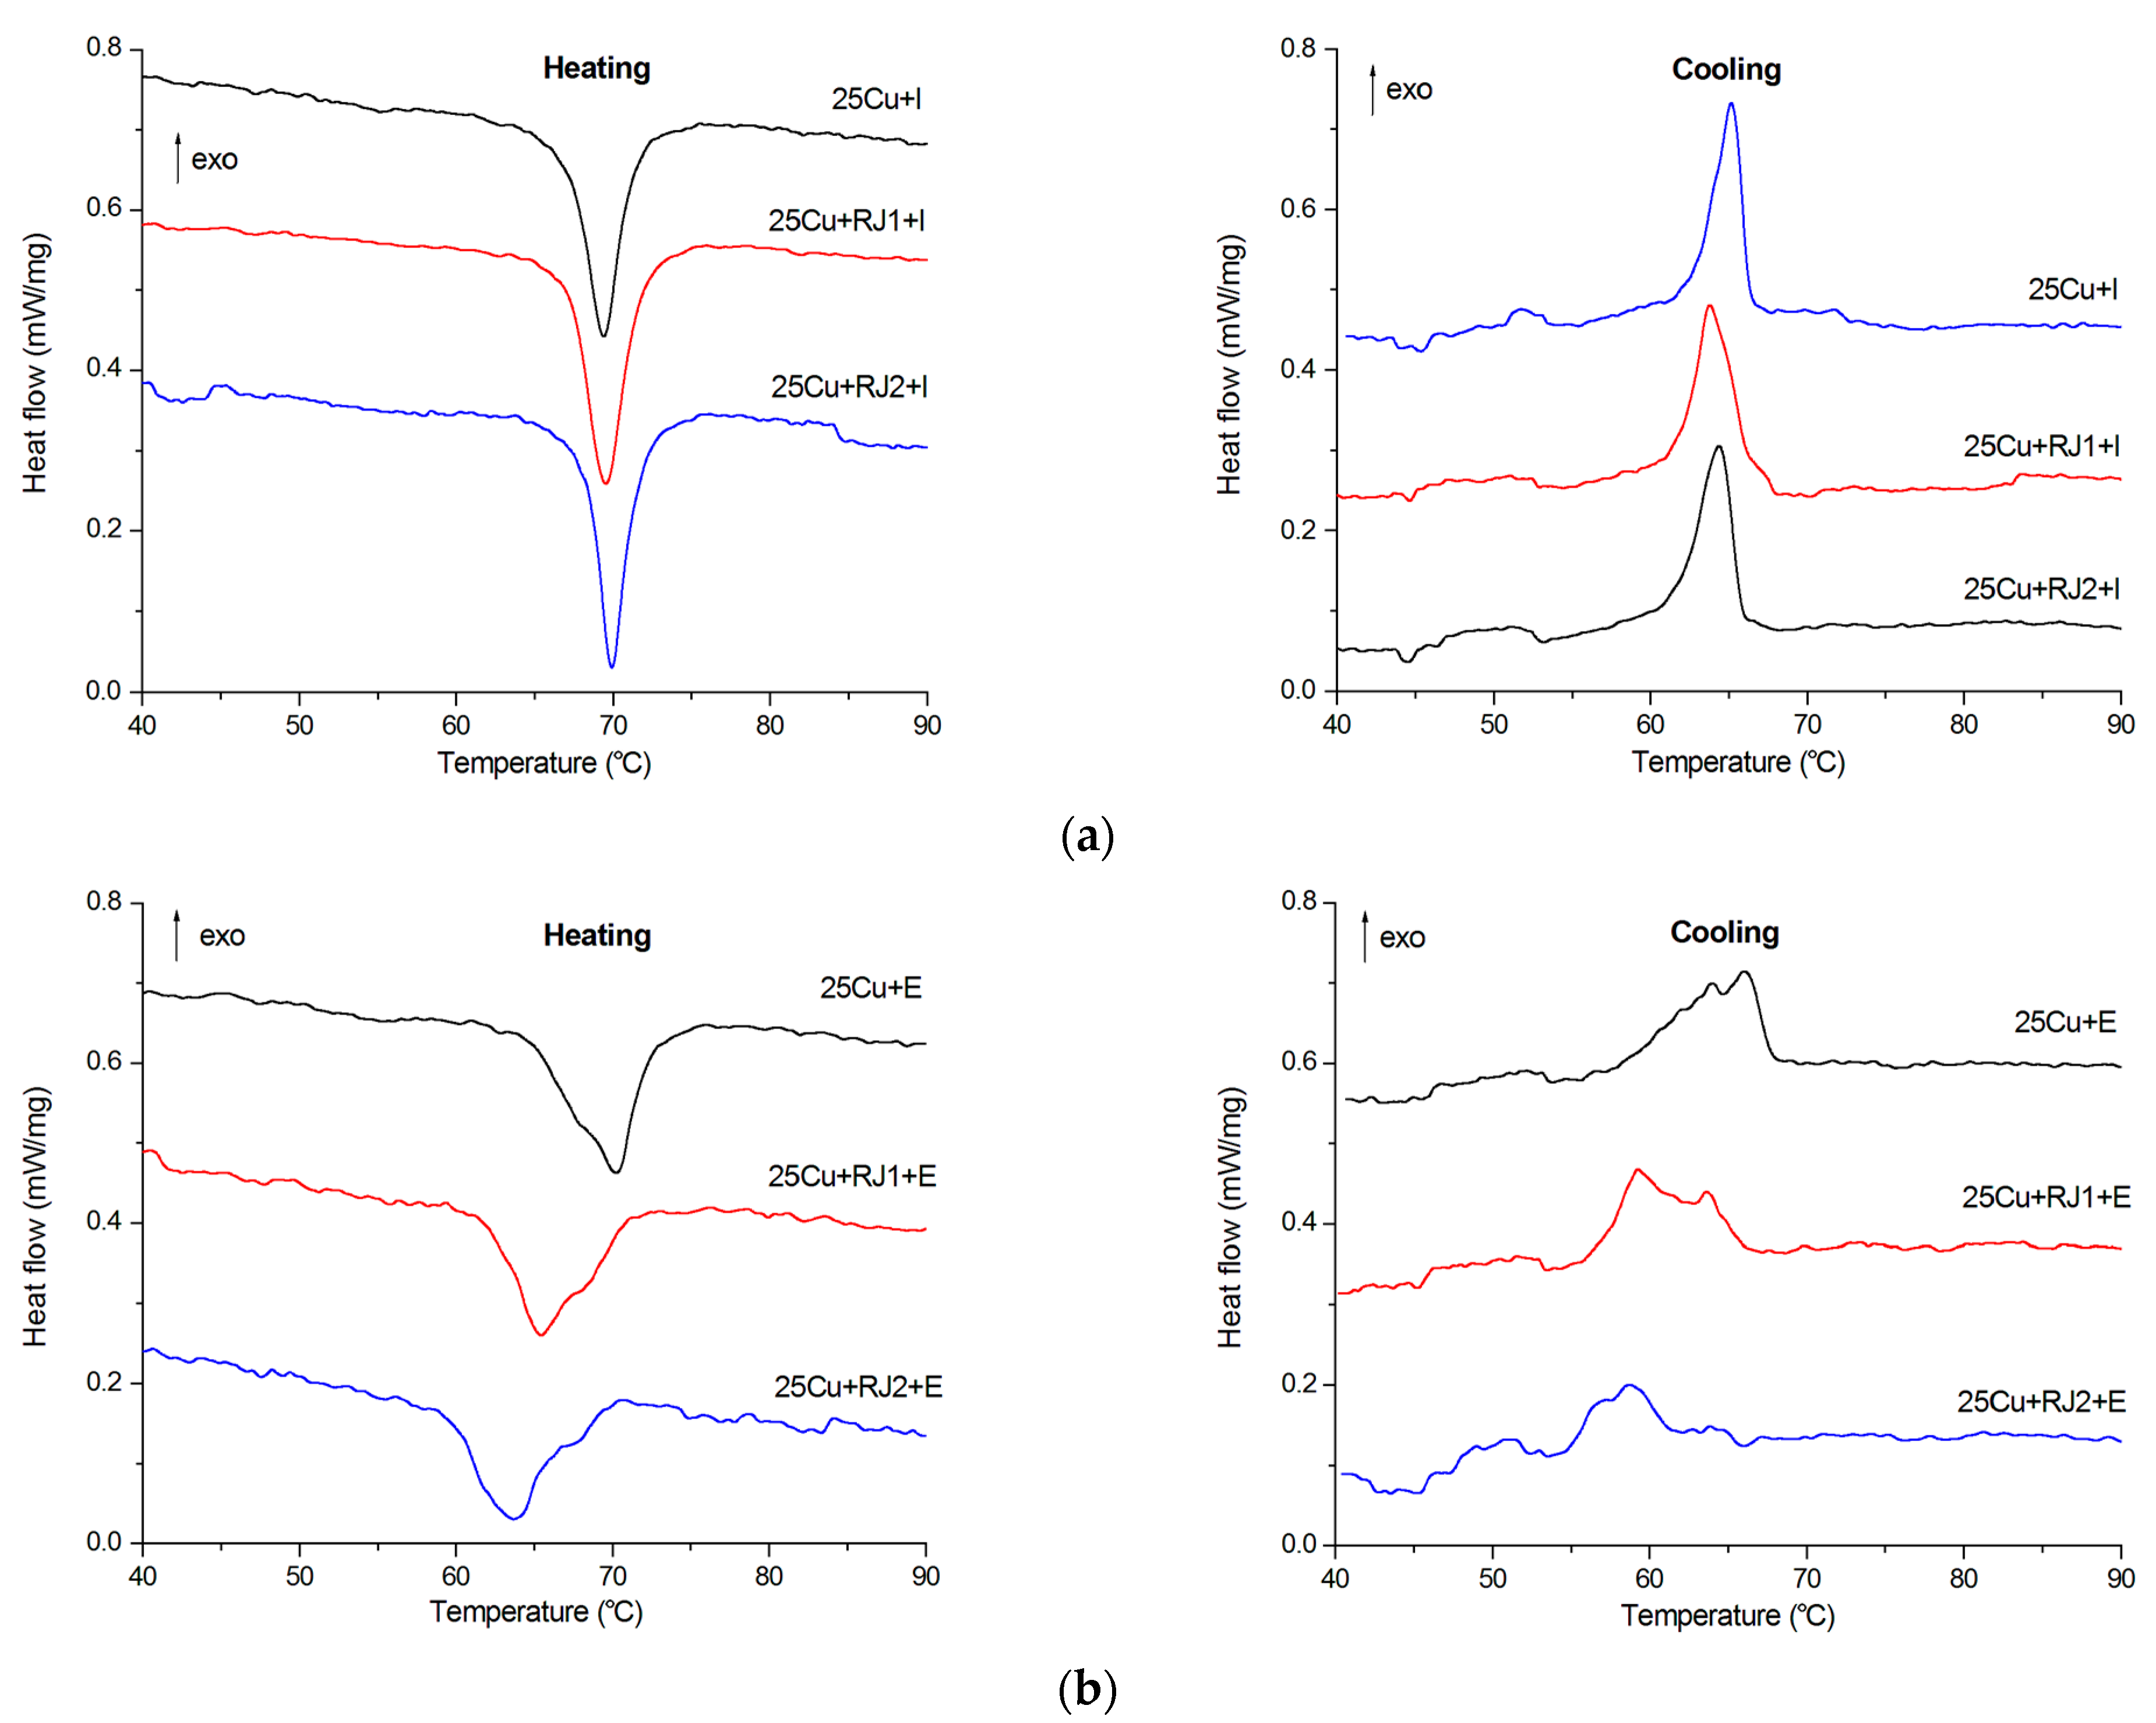
3.5. Martensitic Transformation Temperature Ranges and Pattern

The relationship between the structural features of the specimens and the parameters of martensitic transformations (MTs) were studied using the DSC method by cycled heating and cooling in the 20 to 100 °C range. The experimental DSC curves are shown in Figure 14 and Figure 15, and the start and finish temperatures of the direct and reverse MT determined from these curves (Ms, Mf, As u Af, respectively) and the transformation enthalpy ΔH are summarized in Table 2. The isothermally crystallized 25 and 30 at.% Cu specimens exhibit typical heat absorption (upon heating) and release (upon cooling) peaks in the 55 to 75 °C range testifying to a single-stage polymorphic B2B19 MT. This suggests the formation of a homogeneous single-phase structure during crystallization which is confirmed by X-ray structural analysis data (Figure 5 and Figure 6). The MT enthalpy of the 30 at.% Cu specimens is noticeably lower, which is in agreement with the lower intensity of the B19 phase reflections in the X-ray diffraction patterns of this alloy. Furthermore, the critical MT temperatures for the 30 at.% Cu specimens are almost 10 deg lower. RJ1 and RJ2 treatment of the 25 at.% Cu alloy in the amorphous state slightly increases the MT characteristic temperatures and enthalpy, whereas for the 30 at.% Cu alloy, these MT parameters remain almost unchanged.
All the electropulse-treated specimens have split heat release/absorption peaks, suggesting a two-stage MT. This MT pattern seems to originate from the existence of crystals with different morphologies in the structure of the specimens (Figure 8, Figure 9, Figure 10, Figure 11, Figure 12 and Figure 13). The clearest bimodal peak splitting is observed for the 25 at.% Cu specimens, which contain a large number of columnar crystals and large grains in the ribbon bulk. Also noteworthy is the associated decrease in the intensity and broadening of the DSC peaks. The MT temperature range of the electropulse-treated specimens is shifted toward higher temperatures as compared with the isothermally annealed specimens, probably due to the larger grain sizes. The effect of cryogenic treatment on the characteristic MT temperatures is not definitive: these temperatures decrease for the 25 at.% Cu alloy but increase moderately for the 30 at.% Cu one. Of interest is also the increase in the MT enthalpy after RJ1 treatment and its decrease after RJ2 treatment. The observed phenomena can be associated with the grain size or imperfections in the internal structure of the grains.

4. Conclusions

Amorphous quasibinary TiNi-TiCu system alloys containing 25 and 30 at.% Cu were obtained by melt-spinning in the form of 20–40 μm- thick ribbons. The alloy specimens in the initial amorphous state were subjected to a rejuvenation procedure (cryogenic thermocycling) via two methods, i.e., RJ1: 120 s in liquid nitrogen at −196 °C and 60 s in boiling water at 100 °C (10 cycles); RJ2: 1800 sec in liquid nitrogen and 60 sec in boiling water (1 cycle). The alloys were crystallized in the initial and as-treated amorphous state utilizing isothermal annealing and high-rate electropulse treatment.
The cryothermal treatment of the amorphous alloys changes their structural properties and phase transformation patterns after crystallization, including:
-
a slight decrease in glass transition of 30 at.% Cu alloy and crystallization onset temperatures of 25 at.% Cu alloy;
-
a moderate decrease in the quantity of the B19 martensite phase, the decrease being somewhat greater after RJ2 treatment than after RJ1 treatment;
-
an increase in grain sizes, decrease in thickness of martensite plates, and higher degree of structural imperfection;
-
an increase in characteristic martensitic transformation temperatures of isothermally annealed 25 at.% Cu alloy and of electropulse-crystallized 30 at.% Cu alloy by 3–7 °C, and vice versa, i.e., their decrease for electropulse-treated 25 at.% Cu alloy by 3–4 °C;
-
an increase in martensitic transformation enthalpy for RJ1-treated alloys and its decrease for RJ2-treated alloys.
At the same time, the experimental data did not reveal any effect of cryogenic treatment of the alloys on some of their parameters, in particular, on the critical temperatures and enthalpy of crystallization, the cross-sectional microstructure of the ribbons, MT characteristic temperatures and enthalpy of isothermally crystalized 30 at.% Cu alloy.
As shown earlier [26,27], the structure forming after crystallization is largely controlled by the local atomic structure of the alloys (local neighborhood and atomic bond lengths). One can therefore assume that the experimental data can be accounted for by changes in the local structure of the amorphous state due to cryogenic thermocycling.
The method of crystallization in the amorphous state has a significant effect on the structure of the alloys. Electropulse treatment favors the formation of larger grains with a nanosized subgrain structure as compared with isothermal annealing. However, isothermal treatment leads to the formation of equiaxed grains with a lower imperfection of the inner subgrain structure. Selected area electron-diffraction patterns for all the specimens suggest the presence of B19 rhombic martensite. Furthermore, the martensitic transformation temperature range of the electropulse-treated crystallized specimens is shifted toward higher temperatures as compared with those for isothermally annealed specimens.
An increase in the copper content from 25 to 30 at.% noticeably reduces the glass transition and crystallization onset temperatures, changes the alloy morphology, increases the sizes of the grains and structural features, and slightly reduces the intensity of the B19 martensite phase reflections. Furthermore, the martensitic transformation enthalpy of the 30 at.% Cu specimens is significantly lower and the critical temperatures of the martensitic transformation are almost 10 deg lower.
Importantly, the main distinctive feature of the TiNiCu alloys is their pronounced shape-memory effect (SME). It should therefore be clarified how cryogenic thermocycling in the amorphous state affects the properties of the alloy as a functional SME material. To this end, we will study the relationship of the structure and martensitic transformations with the SME parameters for alloy specimens obtained under different amorphous state formation and crystallization conditions.

Author Contributions

Conceptualization, A.S. and N.S.; methodology, N.S., N.T., I.Z. and K.B.; investigation, N.S., I.Z., N.T. and K.B.; resources, A.S.; writing—original draft preparation, A.S., N.T. and I.Z.; writing—review and editing, A.S. and N.S.; supervision, A.S. All authors have read and agreed to the published version of the manuscript.

Funding

This research was funded by the Russian Science Foundation, project no. 23-29-00779.

Data Availability Statement

Not applicable.

Conflicts of Interest

The authors declare no conflict of interest.

References

  1. Stachiv, I.; Alarcon, E.; Lamac, M. Shape Memory Alloys and Polymers for MEMS/NEMS Applications: Review on Recent Findings and Challenges in Design, Preparation, and Characterization. Metals 2021, 11, 415. [Google Scholar] [CrossRef]
  2. Rao, A.; Srinivasa, A.R.; Reddy, J.N. Design of Shape Memory Alloy (SMA) Actuators; Springer: Cham, Switzerland, 2015. [Google Scholar]
  3. Kohl, M.; Ossmer, H.; Gueltig, M.; Megnin, C. SMA Foils for MEMS: From Material Properties to the Engineering of Microdevices. Shape Mem. Superelasticity 2018, 4, 127–142. [Google Scholar] [CrossRef]
  4. Nespoli, A.; Besseghini, S.; Pittaccio, S.; Villa, E.; Viscuso, S. The high potential of shape memory alloys in developing miniature mechanical devices: A review on shape memory alloy mini-actuators. Sens. Actuators A Phys. 2010, 158, 149–160. [Google Scholar] [CrossRef]
  5. Mohd Jani, J.; Leary, M.; Subic, A.; Gibson, M.A. A review of Shape Memory Alloy research, applications and opportunities. Mater. Des. 2013, 56, 1078–1113. [Google Scholar] [CrossRef]
  6. Ishida, A.; Sato, M. Microstructure and shape memory behaviour of annealed Ti51.5Ni(48.5-x)Cux (x = 6.5–20.9) thin films. Philos. Mag. 2007, 87, 5523–5538. [Google Scholar] [CrossRef]
  7. Shelyakov, A.V.; Sitnikov, N.N.; Borodako, K.A.; Sevryukov, O.N. Two-Way Shape Memory Effect in Rapidly-Quenched High-Copper TiNiCu Alloys Deformed in the Martensitic State. Russ. Metall. 2020, 2020, 345–350. [Google Scholar] [CrossRef]
  8. Kang, S.W.; Lim, Y.M.; Lee, Y.H.; Moon, H.J.; Kim, Y.W.; Nam, T.H. Microstructures and shape memory characteristics of a Ti–20Ni–30Cu (at.%) alloy strip fabricated by the melt overflow process. Scr. Mater. 2010, 62, 71–74. [Google Scholar] [CrossRef]
  9. Shelyakov, A.V.; Sitnikov, N.N.; Borodako, K.A.; Khabibullina, I.A.; Dyadechko, A.A. Structure and functional properties of rapidly quenched TiNiCu alloys with high copper contents. J. Phys. Conf. Ser. 2021, 1758, 012036. [Google Scholar] [CrossRef]
  10. Sitnikov, N.; Shelyakov, A.; Rizakhanov, R.; Mitina, N.; Khabibullina, I. The effect of copper on structure of TiNiCu melt-spun ribbons. Mater. Today Proc. 2017, 4, 4680–4684. [Google Scholar] [CrossRef]
  11. Liu, Y. Mechanical and thermomechanical properties of a Ti50Ni25Cu25 melt spun ribbon. Mater. Sci. Eng. A. 2003, 354, 286–291. [Google Scholar] [CrossRef]
  12. Borodako, K.A.; Shelyakov, A.V.; Sitnikov, N.N.; Zaletova, I.A.; Sevryukov, O.N. Influence of copper content and thermal treatment on shape memory effect in rapidly quenched TiNiCu alloys. J. Phys. Conf. Ser. 2021, 2036, 012013. [Google Scholar] [CrossRef]
  13. Chang, S.H.; Wu, S.K.; Kimura, H. Annealing effects on the crystallization and shape memory effect of Ti50Ni25Cu25 melt-spun ribbons. Intermetallics 2007, 15, 233–240. [Google Scholar] [CrossRef]
  14. Shelyakov, A.; Sitnikov, N.; Khabibullina, I.; Borodako, K.; Sevryukov, O. Shape Memory Behavior of Rapidly Quenched High-copper TiNiCu Alloys. U. Porto J. Eng. 2021, 7, 2–10. [Google Scholar] [CrossRef]
  15. Shelyakov, A.; Sitnikov, N.; Zaletova, I.; Tabachkova, N.; Andreev, N. Effect of External Impacts on the Structure and Martensitic Transformation of Rapidly Quenched TiNiCu Alloys. Metals 2021, 11, 1528. [Google Scholar] [CrossRef]
  16. Gong, P.; Yin, G.; Jamili-Shirvan, Z.; Ding, H.; Wang, X. Influence of deep cryogenic cycling on the rejuvenation and plasticization of TiZrHfBeCu high-entropy bulk metallic glass. Mater. Sci. Eng. A 2020, 797, 140078. [Google Scholar] [CrossRef]
  17. Abrosimova, G.; Volkov, N.; Pershina, E.; Tuan, T.V.; Aronin, A. Amorphous structure rejuvenation under cryogenic treatment of Al-based amorphous-nanocrystalline alloys. J. Non-Cryst. Solids 2020, 528, 119751. [Google Scholar] [CrossRef]
  18. Jiang, J.; Ko, W.-S.; Joo, S.-H.; Wei, D.X.; Wada, T.; Kato, H.; Louzguine-Luzgin, D.V. Experimental and molecular dynamics studies of phase transfor ations during cryogenic thermal cycling in complex TiNi based crystalline/amorphous alloys. J. Alloys Compd. 2021, 854, 155379. [Google Scholar] [CrossRef]
  19. Priezjev, N.V. The effect of thermal history on the atomic structure and mechanical properties of amorphous alloys. Comput. Mater. Sci. 2020, 174, 109477. [Google Scholar] [CrossRef] [Green Version]
  20. Ketov, S.V.; Sun, Y.H.; Nachum, S.; Lu, Z.; Checchi, A.; Beraldin, A.R.; Bai, H.Y.; Wang, W.H.; Louzguine-Luzgin, D.V.; Carpenter, M.A.; et al. Rejuvenation of metallic glasses by non-affine thermal strain. Nature 2015, 524, 200–203. [Google Scholar] [CrossRef] [Green Version]
  21. Kang, S.J.; Cao, Q.P.; Liu, J.; Tang, Y.; Wang, X.D.; Zhang, D.X.; Ahn, I.S.; Caron, A.; Jiang, J.Z. Intermediate structural state for maximizing the rejuvenation effect in metallic glass via thermo-cycling treatment. J. Alloys Comp. 2019, 795, 493–500. [Google Scholar] [CrossRef]
  22. Saida, J.; Yamada, R.; Wakeda, M.; Ogata, S. Thermal rejuvenation in metallic glasses. Sci. Technol. Adv. Mater. 2017, 18, 152–162. [Google Scholar] [CrossRef] [Green Version]
  23. Sheng, Y.; Hua, Y.; Wang, X.; Zhao, X.; Chen, L.; Zhou, H.; Wang, J.; Berndt, C.C.; Li, W. Application of High-Density Electropulsing to Improve the Performance of Metallic Materials: Mechanisms, Microstructure and Properties. Materials 2018, 11, 185. [Google Scholar] [CrossRef] [Green Version]
  24. Ishida, A.; Sato, M. Microstructures of crystallized Ti51.5Ni48.5−xCux (x = 23.4–37.3) thin films. Intermetallics 2011, 19, 900–907. [Google Scholar] [CrossRef]
  25. Shelyakov, A.V.; Sitnikov, N.N.; Khabibullina, I.A.; Sundeev, R.V.; Sevryukov, O.N. Specifics of Crystallization of Amorphous TiNiCu Alloys with High Concentrations of Copper. Phys. Solid State 2020, 62, 937–941. [Google Scholar] [CrossRef]
  26. Zarinejad, M.; Liu, Y.; Liu, T.; White, T.; Yang, P.; Chen, Q. Evolution of local atomic structure in a melt-spun Ti50Ni25Cu25 shape memory alloy during crystallization. Philos. Mag. 2011, 91, 404–420. [Google Scholar] [CrossRef]
  27. Chernysheva, O.; Shelyakov, A.; Sitnikov, N.; Veligzhanin, A.; Borodako, K.; Sundeev, R. Local atomic and crystal structure of rapidly quenched TiNiCu shape memory alloys with high copper content. Mater. Lett. 2021, 285, 129104. [Google Scholar] [CrossRef]
  28. Shelyakov, A.; Sitnikov, N.; Khabibullina, I.; Tabachkova, N.; Fominski, V.; Andreev, N. Effect of high-rate annealing on microstructure, martensitic transformation and shape memory behavior of TiNiCu melt-spun ribbons. Mater. Lett. 2019, 248, 48–51. [Google Scholar] [CrossRef]
Figure 1. Schematic of cryogenic thermocycling methods. (a) RJ1; (b) RJ2.
Metals 13 01175 g001aMetals 13 01175 g001b
Figure 2. Waveforms of the control signal (blue) and response signal (yellow) during electropulse treatment with crystallization occurred (a) long before and (b) at the end of the heating pulse.
Metals 13 01175 g002
Figure 3. DSC crystallization curves for rapidly quenched TiNiCu alloy specimens.
Metals 13 01175 g003
Figure 4. Fragments of DSC crystallization curves for rapidly quenched TiNiCu alloy specimens for determination of crystallization characteristic temperatures and enthalpy. (a) 25Cu + RJ1; (b) 30Cu + RJ1.
Metals 13 01175 g004
Figure 5. X-ray diffraction patterns of 25 and 30 at.% Cu TiNi-TiCu system alloy specimens in a martensite state after isothermal (I) and electropulse (E) crystallization from the initial and as-treated amorphous states.
Metals 13 01175 g005
Figure 6. X-ray diffraction patterns of 25 and 30 at.% Cu TiNi-TiCu system alloy specimens in an austenite state after isothermal (I) and electropulse (E) crystallization from the initial and as-treated amorphous states.
Metals 13 01175 g006
Figure 7. Cross-sectional SEM images of rapidly quenched (ac) 25 at.% Cu and (df) 30 at.% Cu ribbons (a,d) in the initial as-quenched state and after (b,e) RJ1 and (c,f) RJ2 treatment.
Metals 13 01175 g007
Figure 8. Cross-sectional SEM images of rapidly quenched (ac) 25 at.% Cu and (df) 30 at.% Cu ribbons after isothermal crystallization (a,d) in the initial state and (b,e) RJ1 and (c,f) RJ2 treatment.
Metals 13 01175 g008
Figure 9. Cross-sectional SEM images of rapidly quenched (ac) 25 at.% Cu and (df) 30 at.% Cu ribbons crystallized by a 10 ms electropulse (a,d) in the initial as-quenched state and after (b,e) RJ1 and (c,f) RJ2 treatment.
Metals 13 01175 g009
Figure 10. TEM images and respective SAED patterns of (a) 25Cu + I and (b) 25Cu + RJ1 + I specimens.
Metals 13 01175 g010
Figure 11. TEM images and respective SAED patterns of (a) 30Cu + I and (b) 30Cu + RJ1 + I specimens.
Metals 13 01175 g011
Figure 12. TEM images and respective SAED patterns of (a) 25Cu + E and (b) 25Cu + RJ1 + E specimens.
Metals 13 01175 g012
Figure 13. TEM images and respective SAED patterns of (a) 30Cu + E and (b) 30Cu + RJ1 + E specimens.
Metals 13 01175 g013
Figure 14. Heating and cooling DSC curves for 25 at.% Cu alloy specimens, after (a) isothermal (I) and (b) electropulse (E) crystallization in the initial and rejuvenation-treated (RJ1, RJ2) amorphous states.
Metals 13 01175 g014
Figure 15. Heating and cooling DSC curves for 30 at.% Cu alloy specimens, after isothermal (I) and electropulse (E) crystallization in the initial and rejuvenation-treated (RJ1, RJ2) amorphous states.
Metals 13 01175 g015
Table 1. Crystallization characteristic temperatures and enthalpy of rapidly quenched TiNiCu alloy specimens.
SpecimenTg, °CToneset, °CTp, °CTend, °CΔH, J/g
25Cu435.9449.5453.4457.728.4
25Cu + RJ1435.0449.4453.4457.728.3
25Cu + RJ2435.8448.0453.4457.328.7
30Cu425.1442.1445.2449.530.1
30Cu + RJ1423.0441.3445.2449.229.7
30Cu + RJ2422.2442.0445.2450.029.4
Table 2. Characteristic temperatures and enthalpy of martensitic transformation in rapidly quenched TiNiCu alloy specimens after isothermal (I) and electropulse (E) crystallization in the initial and rejuvenation-treated (RJ1, RJ2) amorphous states.
SpecimenMs, °CMf, °CAs, °CAf, °CHM, J/gHA, J/g
25Cu + I65.961.466.871.810.1−10.7
25Cu + RJ1 + I67.461.467.172.311.5−11.4
25Cu + RJ2 + I66.462.468.072.310.0−10.7
25Cu + E67.858.264.273.510.8−10.9
25Cu + RJ1 + E66.155.261.671.511.4−10.6
25Cu + RJ2 + E65.254.560.070.58.7−10.6
30Cu + I53.649.154.363.79.5−8.1
30Cu + RJ1 + I53.549.254.263.89.4−8.0
30Cu + RJ2 + I53.548.455.663.110.8−8.7
30Cu + E62.354.356.965.49.8−9.2
30Cu + RJ1 + E63.656.561.867.510.5−9.5
30Cu + RJ2 + E66.957.760.972.39.3−8.7
Disclaimer/Publisher’s Note: The statements, opinions and data contained in all publications are solely those of the individual author(s) and contributor(s) and not of MDPI and/or the editor(s). MDPI and/or the editor(s) disclaim responsibility for any injury to people or property resulting from any ideas, methods, instructions or products referred to in the content.

