Article

Study on the Microstructure and Properties of Flash-Butt Welding Joints of High Nitrogen Steel

1
School of Materials Engineering, Shanghai University of Engineering Science, Shanghai 201620, China
2
Shanghai Collaborative Innovation Center of Laser Advanced Manufacturing Technology, Shanghai 201620, China
3
State Key Laboratory of Advanced Welding and Joining, Harbin Institute of Technology, Harbin 150001, China
4
Shandong Provincial Key Laboratory of Special Welding Technology, Harbin Institute of Technology at Weihai, Weihai 264209, China
5
School of Materials Science and Engineering, Changchun University of Technology, Changchun 130012, China
*
Authors to whom correspondence should be addressed.
Metals 2023, 13(7), 1200; https://doi.org/10.3390/met13071200
Submission received: 9 April 2023 / Revised: 12 June 2023 / Accepted: 23 June 2023 / Published: 28 June 2023
(This article belongs to the Section Welding and Joining)

Abstract

:
A thermomechanical coupling model for the solid-state flashing process of high nitrogen steel was established, based on finite element simulations and experiments. The effect of flash current on the microstructure and mechanical properties of the welded joint was investigated, and the temperature field of the flash-butt welding (FBW) process was simulated. The phase composition of the joint was determined according to the phase diagram and cooling curve. In addition, the joint with optimal parameters was subjected to full immersion corrosion tests. The results demonstrated that the interface structure was composed of austenite and δ-ferrite with a thyristor angle (flash current) of 45°. The microstructure of the overheated zone (OZ) was composed of austenite, ferrite and a small amount of the M2 phase, in which the heat-affected zone exhibited a single-phase austenite microstructure. The joint hardness displayed a “V” shaped distribution with the lowest interface hardness. As the flash current increased, the hardness and tensile strength of the interface area of the joint first increased and then decreased, with a maximum tensile strength of 902 MPa at 45°. During the full immersion corrosion tests, the joint exhibited the most serious corrosion in the interface center and gradually reduced corrosion on both sides.

1. Introduction

The limited nickel reserves largely hinder the development and application of traditional austenitic stainless steel. The replacement of nickel with nitrogen to stabilize austenite greatly reduced the cost, and resulted in a new type of high nitrogen nickel-free austenitic stainless steel [1]. In general, high nitrogen steel refers to steels with more than 0.4% nitrogen in austenite or more than 0.08% nitrogen in ferrite. Nitrogen, as a powerful austenite-stabilizing element, can not only improve the strength and fracture toughness of high nitrogen steel significantly, but also increase the pitting corrosion resistance of steels. Compared with traditional stainless steel, nitrogen instead of nickel has been employed to austenitize the structure in high nitrogen steel, which can reduce the precipitation of carbides and improve the mechanical properties as well as the corrosion resistance of steel [2]. Various kinds of high nitrogen steel have been utilized in many fields, such as power-generating industry, ship building, railways, chemical equipment, petroleum and nuclear industries.
The connection of material widely exists in the use of high nitrogen steel, and thus the loss of nitrogen should be prevented during the welding process of high nitrogen austenitic stainless steel [2]. Nitrogen exists in the form of a saturated solid solution in the steel. Under the action of the welding thermal cycle, the nitrogen in high nitrogen austenitic stainless steel easily gathers and precipitates, resulting in a significant decline in the performance of the welded joints. In general, nitrogen-rich protective gas or filler materials have been applied to add nitrogen to the weld. At present, the welding methods of high nitrogen stainless steel mainly include molten inert gas welding (MIG), tungsten inert gas welding (TIG), friction stir welding and laser welding. In a study by R Mohammed et al. [3], TIG welding was conducted on high nitrogen steel with 0.54% nitrogen content, in which an austenitic matrix and a small amount of δ-ferrite were found in both the weld and heat-affected zones. The tensile strength was reduced to only 53% of the base metal (BM). Kiellerup et al. [4] observed that, in welding high nitrogen austenitic stainless steel, the addition of nitrogen gas can lead to the shrinkage of the arc plasma and result in an increased fusion area and nitrogen content in the weld zone. There is also an increase of primary and secondary dendrite arm spacing in the welded joints. This leads to the formation of high quality welds while simultaneously suppressing nitrogen loss during the welding process. Friction stir welding (FSW) has been applied to a 2.4 mm thick high nitrogen austenitic stainless steel plate [5]. The nitrogen content of the weld was almost identical to that of the base metal (BM). The results of this study revealed a small amount of precipitates of Cr23C6 in the stir zone SZ. The precipitation and increase in δ-ferrite in the SZ led to small decrease in both pitting and intergranular corrosion resistance. Zhao et al. [6] studied the influence of the shielding gas composition on the nitrogen content and porosity of the weld metal by CO2 laser welding. The experimental results indicate that increasing the nitrogen content in the shielding gas is beneficial for slightly increasing the weld nitrogen content and reducing porosity. In the study of Dong et al. [7], CO2 laser welding and TIG welding were performed on high nitrogen austenitic stainless steel to examine the relationship between nitrogen partial pressure and nitrogen content mixed protection gas. Liu et al. [8] used Ar-N2-O2 ternary shielding gas for welding high nitrogen stainless steel with a nitrogen content of 0.75%. The effect of the ternary shielding gas on the retention and improvement of nitrogen content in the weld was identified. As N2 continued to increase, the ferrite decreased from the top to the bottom. When the proportion of N2 reached 20%, a full austenitic weld was obtained and the tensile strength was improved by 8.7%. Liu et al. [9] developed high nitrogen stainless steel welding wires with nitrogen contents of 0.15%, 0.6% and 0.9%. They found that the wire with a nitrogen content of 0.6% had the highest mechanical properties, with a tensile strength of 912.5 MPa and a weld impact energy of 138.17 J. When the nitrogen content was 0.15%, a fully austenitic weld was obtained, but the joint had the lowest tensile strength due to the low nitrogen content in the weld. The wire with a nitrogen content of 0.9% suffered the most severe nitrogen loss, resulting in some porosity in the weld. Additionally, the weld with the wire of 0.9% nitrogen content also had a high ferrite content, which led to a decreased weld impact energy. There is also a method of determining both strength and crack resistance [10]. Li et al. [11] investigated the welding effects of different ratios of MnN/CrN mixed powders on high nitrogen steel. By controlling the MnN ratio to <20 wt%, weld joints with high tensile strength and toughness and no defects were obtained. When the MnN content was >30 wt%, porosity was formed, leading to a deterioration of the mechanical properties of the joint.
The abovementioned studies showed that nitrogen protection or nitrides have mainly been adopted in the welding of high nitrogen steel to reduce nitrogen loss and improve the joint performance [12]. However, nitrogen precipitation in the welding has rarely been researched. In addition, the flash-butt welding method has been widely used in mechanical and electrical, construction, railway, oil drilling and metallurgical industries due to its high thermal efficiency and welding quality. However, there are few studies on the application of flash-butt welding to high nitrogen steel. Nevertheless, flash-butt welding belongs to the category of resistance welding. Hafez [13] performed resistance spot welding of austenitic stainless steel AISI 304L in different atmospheres and found that, under moderate heat input, the corrosion potential of nuggets welded under argon atmosphere exhibited more significant improvement than those welded under nitrogen or air atmospheres. Fukumoto et al. [14] investigated the feasibility and microstructural development of high nitrogen-containing nickel-free austenitic stainless steel by resistance spot welding. A small amount of δ ferrite was formed only at the grain boundary in the weld, and chromium nitride precipitation was observed at the grain boundary. The joint quality was good and its strength was almost equal to the base alloy. Somervuori et al. [15] studied the corrosion resistance of spot-welded and induction-heated austenitic stainless steels EN 1.4301 and EN 1.4318 in 3.5% sodium chloride solution. In potentiostatic measurements, pitting corrosion on spot-welded and induction-heated samples initiated at lower potentials compared to the base materials. Corrosion pits started on the heat-affected areas. In immersion tests, the surface of spot welds was not attacked, but crevice corrosion was detected between the sheets around the spot welds. Flash-butt welding generally including the flash stage and the upsetting stage [16]. In the flash stage, the end face of the weldment is contacted by the motion of the electrode. Resistive heat is generated at the contact site to rapidly melt the contact point. The molten liquid metal produces explosive splashing under the action of steam pressure and electromagnetic pressure. While the forging force is applied quickly, the temperature of the weld reaches its highest level, leading to the precipitated nitrides and metal oxides being extruded to ensure the quality of the weld. Therefore, the flash-butt welding of high nitrogen steel was conducted in this study, and the phase composition of the joint was determined by the temperature field simulation, phase diagram, and cooling curve. The effect of flash current on the microstructure and mechanical properties of the joint was also investigated, and the corrosion performance under the optimal parameters was evaluated.

2. Materials and Methods

2.1. Materials

High nitrogen steel with a size of 90 × 27 × 4.5 mm was selected, and its composition is shown in Table 1. As shown in Figure 1, the metal displays a single austenite with a flat grain boundary of the austenite and fine grain size. In addition, the high nitrogen steel has an average hardness of 383 HV, and a tensile strength of 1040 MPa.
Flash-butt welding was conducted with ZUN-100-012-0008A equipment, which was manufactured by Quancheng Machinery Equipment Co., Ltd. in Jining City, Shandong Province, China. A set of suitable electrodes was designed according to the sample size. Figure 2 shows a digital photograph and three-dimensional design of the electrode, where grooves are processed on the electrode surface to avoid rotation and dislocation of the weldment during the welding process.

2.2. Experimental Procedure

The effects of flash current on the microstructure and mechanical properties of high nitrogen steel flash welded joints and their alloys were investigated. In order to ensure the accuracy of the data, the flash current of the equipment in the test is represented by the thyristor angle, and the flash margin is represented by the rotation angle of the CAM. Multiple tests were averaged to ensure the accuracy of test data. Table 2 lists the main parameters used in producing welded joints.
The cross-section of the joint and the microstructure were observed by an Olympus metallography microscope. The hardness of the joint was measured by an HV-1000DT Vickers microhardness tester. The load of the test was 1.98 N, the loading time was 10 s, and the test was measured every 0.5 mm. The hardness test points were arranged along the vertical weld direction, as shown in Figure 3. The tensile test was conducted using an Instron-1186 electronic universal testing machine manufactured by Instron, a US-based company. The size of the tensile sample is shown in Figure 4. The temperature measurements were carried out at positions 5 mm, 10 mm, 15 mm, and 20 mm away from the weld using a RE-Y2101B-CD thermocouple thermometer to obtain the extreme point of the welding thermal cycle curve. The full immersion corrosion test was conducted on the flash-butt welding joints of high nitrogen steel with a sample size of 25 mm × 10 mm × 4.5 mm through etching in 10% H2SO4 solution at room temperature. The weld is arranged along the direction of 25 mm.

2.3. Basic Equation of the Finite Element Calculation

The flash-butt welding process contains transient heat transfer, and a three-dimensional transient heat conduction model was established to describe the actual welding situation, as shown in Equation (1).
ρ c T t = x λ x T x + x λ y T y + x λ z T z + Q V
where ρ represents the material density and c represents the heat capacity of the material. λx = λy = λz represents the thermal conductivity of the material; T is the temperature. Qv is the heat source intensity and can be obtained from the finite element of the electric potential field in Equation (2).
Q V = U r 2 + U z 2 / ρ e
where ρe is the resistivity. The heat source in the flash stage is the sum of the resistance heat of the material itself and the contact resistance heat. The total instantaneous heat production of the flash end face is calculated according to Equation (3).
Q = Δ U 2 R c + Q V
In the flash stage, the heat source is the sum of the resistance heat of the material itself and the contact resistance heat. The total instantaneous heat production of the flash end face is calculated according to Equation (4).
R c = 9500 K S 2 / 3 V f 1 / 2 J × 10 6
where K is the material characteristic coefficient and is set as 1 for high nitrogen steel; S is the area of the welding end face of high nitrogen steel; Vf is the sintering speed and J is the current density. The Johnson–Cook constitutive equation was used to describe the stress and strain of the material during flash-butt welding. The Johnson–Cook constitutive equation is shown as Equation (5).
σ = A + B ε n 1 + C ln ε ˙ ε ˙ 0 1 T T r T m T r m
where σ, ε, ε ˙ and ε ˙ 0 are the stress, plastic strain, strain rate, and reference strain rate, respectively. A is the initial yield strength of the material; B is the strain hardening index; C is the strain rate sensitive index; m represents the temperature softening index, and n represents the work hardening index.

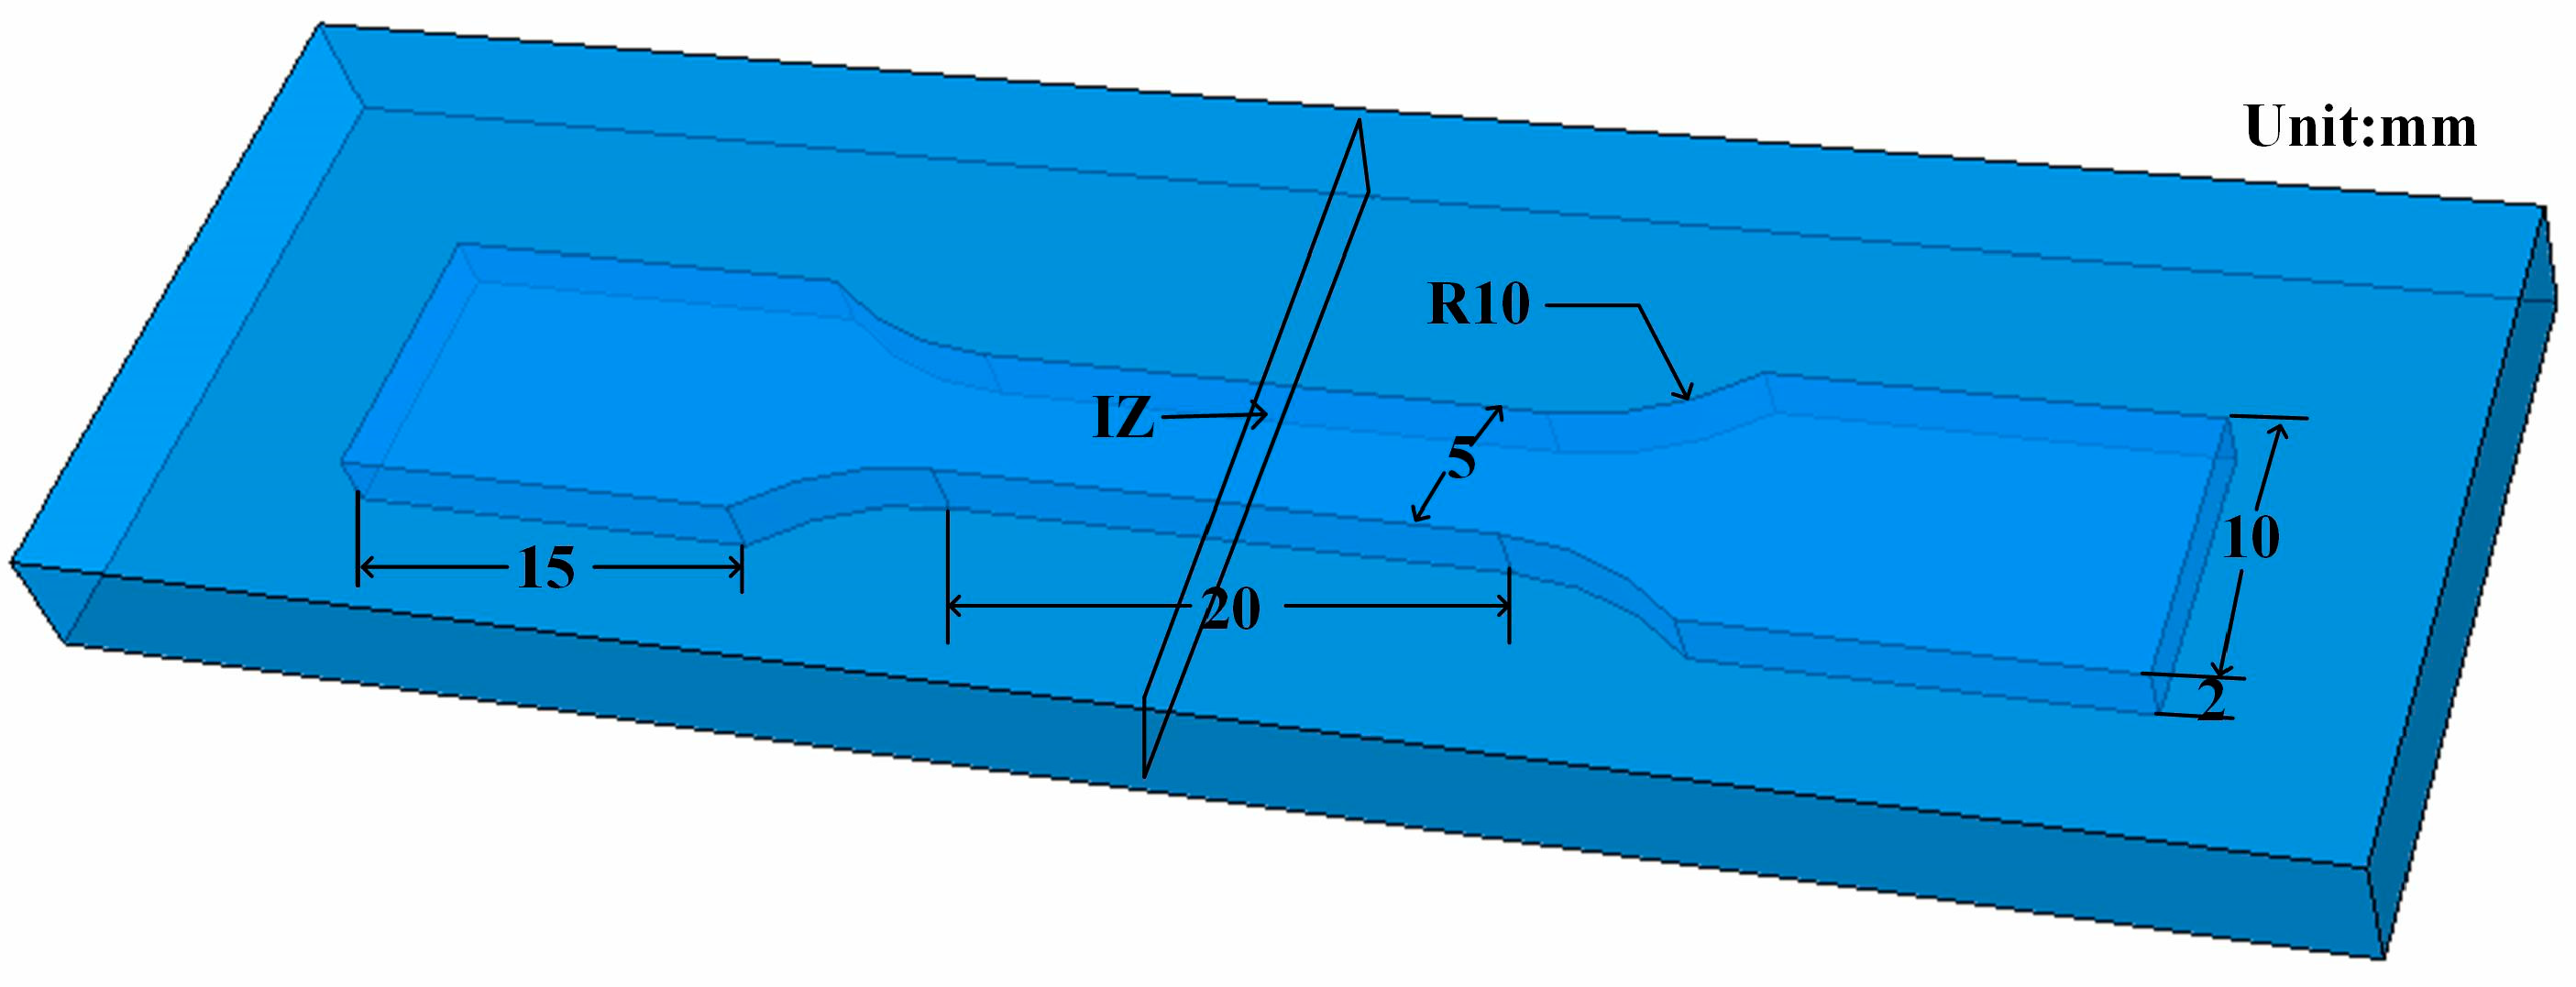
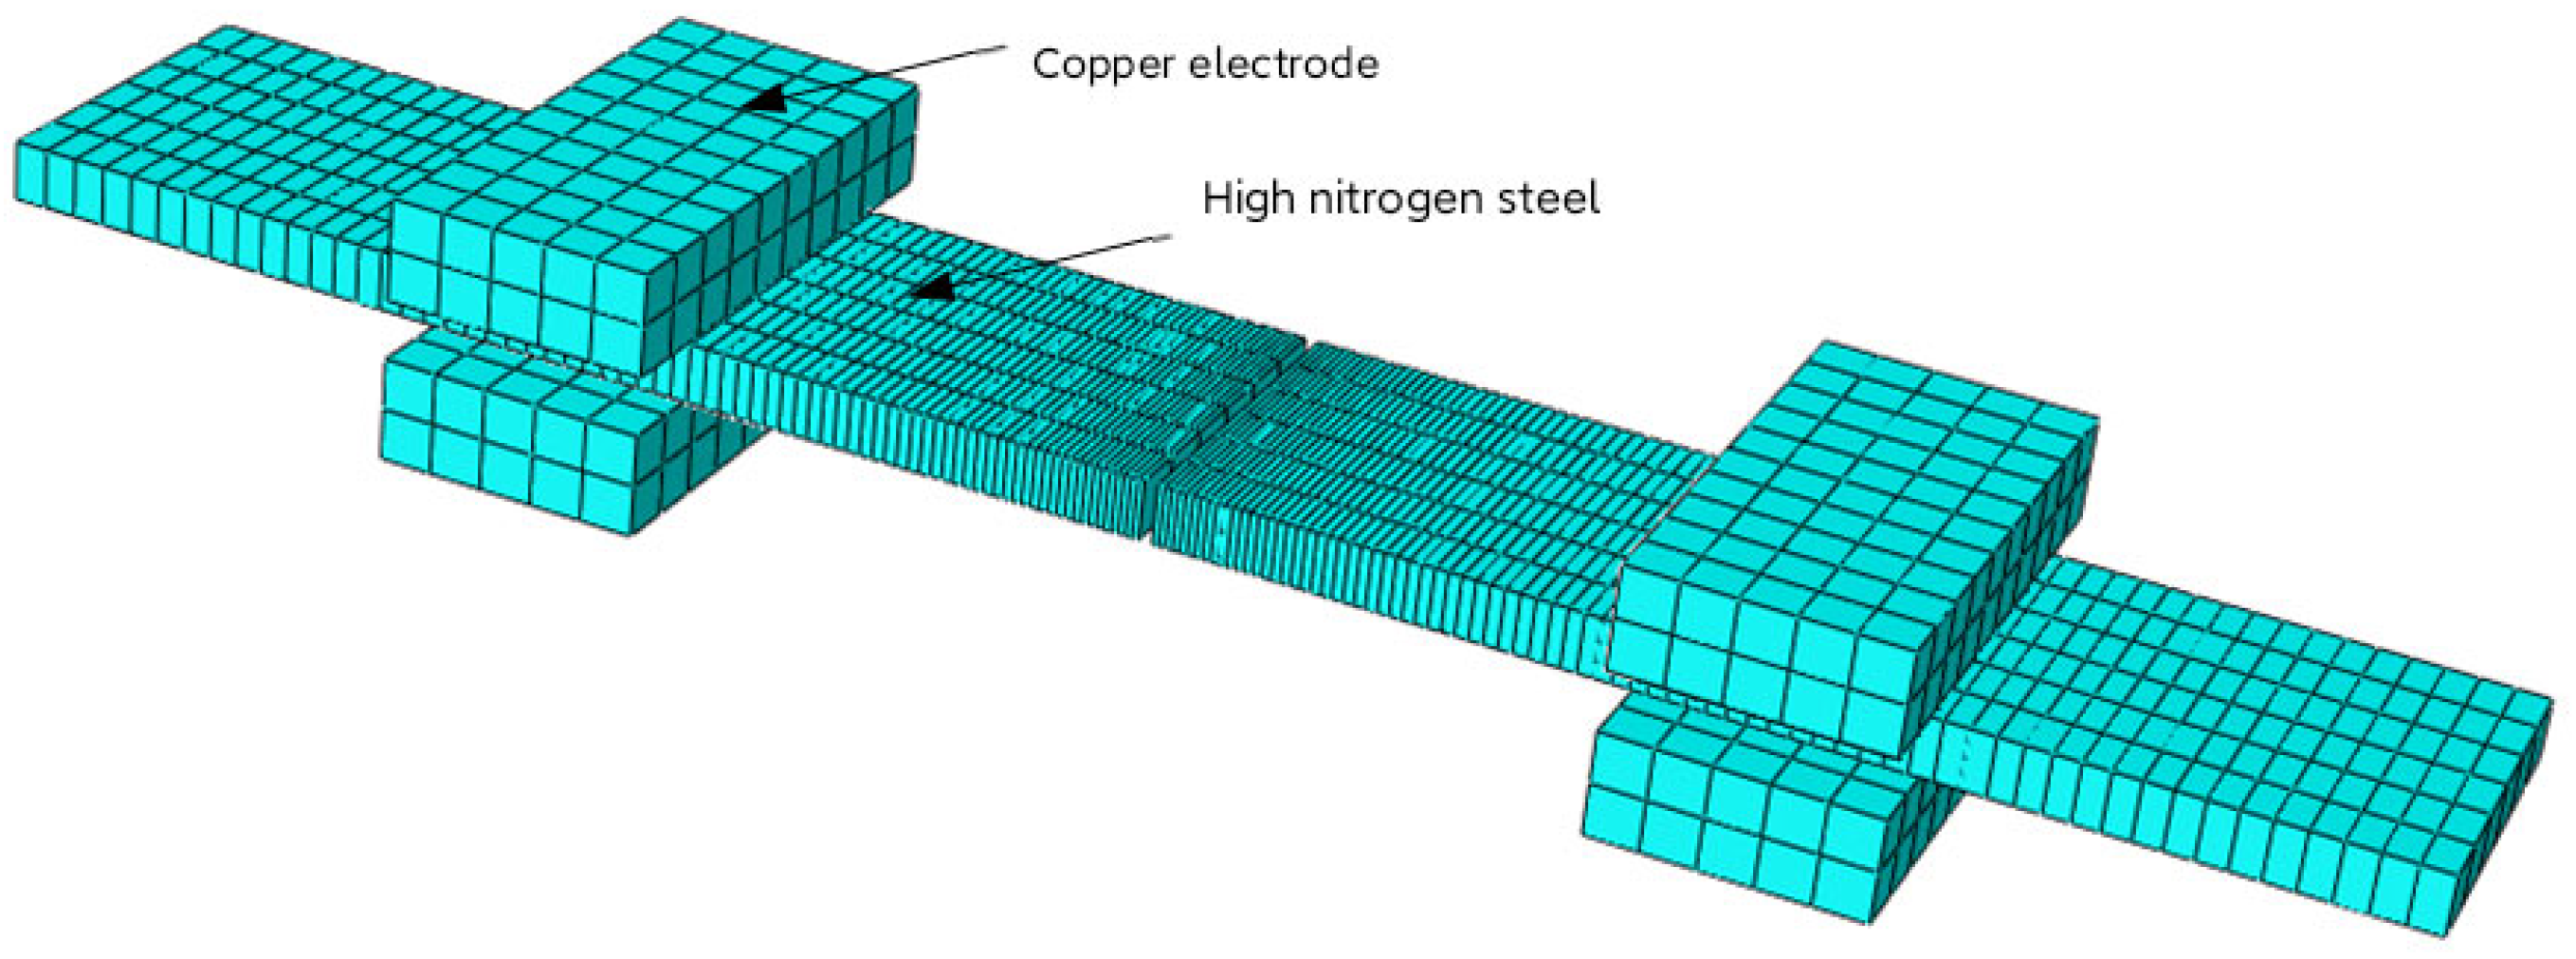
2.4. Three-Dimensional Model

The flash-butt welding of high nitrogen steel involves a complicated interaction process of heat, electricity and force [17,18]. The calculation and analysis conducted were based on abaqus 2016 software of the American company 3DEXPERIENCE. Before establishing the model, reasonable assumptions and simplified treatment were made as follows. First, the electrode size was simplified and the direct contact resistance between the copper electrode and the high nitrogen steel was ignored. Second, the heat generation of current and resistance was transformed into heat source substitution. Third, the plate end contact had a smooth surface with an unchanged contact area between the plate and the electrode.
The copper electrode was simplified to improve the calculation accuracy and reach convergence of the model. The characteristics of the upper part of the electrode were ignored, and only the lower part of the electrode was retained. Finally, the geometric model consisted of a high nitrogen steel plate and a copper electrode. Since the copper electrode does not deform in the welding process, the electrode parts were established as a Lagrangian three-dimensional rigid body, and the plate parts were established as a Lagrangian three-dimensional variable body. The electrode exhibits material properties of copper. Considering that the physical parameters of high nitrogen steel vary under the welding thermal cycle, Jmat Pro Software developed by Sente Software company in the UK is used to calculate. Through the input of temperature related parameters, the physical property parameters of high nitrogen steel are calculated. The density is 7966 kg/m3, the elastic modulus is 202 GPa, and the Poisson ratio is 0.33. Table 3 lists the thermal physical property parameters of high nitrogen steel.
The sample had a size of 90 mm × 27 mm × 4.5 mm. The components were divided by different mesh densities. An eight-node linear heat transfer hexahedral element (DC3D8) was selected as the grid type of the welded plate and the copper electrode. The zone close to the seam area showed a relatively dense mesh, while those far from the seam area exhibited a sparse mesh. A transition mesh was distributed in the middle part, with mesh sizes ranging transferring from 0.5 mm × 4.5 mm to 2.5 mm × 4.5 mm. The whole welded material was divided into 864 mesh elements.
The mesh division of the copper electrode was comparatively coarse. Each copper electrode showed a uniform mesh distribution with a total of 400 mesh cells. The final mesh division is shown in Figure 5.

2.5. Boundary Conditions and Contact Conditions

The heat transfer modes of the flash-butt welding of high nitrogen steel include heat conduction, convection and heat radiation. Equations (1) and (3) show the heat generated by the end face of the material after electrification and the three-dimensional heat conduction inside the welding process [19]. Equation (6) shows the convective heat transfer between the electrode plate and the electrode fixture.
Q = ɑ ( T 1 T )
where ɑ is the convective heat transfer coefficient; T1 is the surface temperature, and T is the temperature at infinity. During the welding process of high nitrogen steel, radiation heat transfer to the surrounding environment occurs in the plate surface with ɑ of 1000 W/(m2·°C). The heat transfer coefficient α of the plate to the surrounding air environment is 30 W/(m2·°C). Since the welding room temperature was 25 °C, the initial temperature of the whole work was set to 25 °C.
To establish the contact type between components based on the actual flash welding process, five contact pairs needed to be established, two contact pairs between the end faces of the welded plates and four contact pairs between the side of the plate and the copper electrode. The properties of each contact pair also needed to be defined. The contact definition between the end faces of the two welded plates were as follows: the normal behavior was defined as a pressure interference fit relationship; the tangential behavior was defined using the classical Coulomb friction equation, with a friction coefficient set to 0.3; the thermal conductivity between the two plates was determined by defining the contact gap value; and the heat generation behavior was set to default. In addition, the thermal conductivity and limited sliding motion contact between the plate and the copper electrode was defined, where the thermal conductivity between the copper electrode and the plate was defined using contact gap data, and the heat generation behavior was set to default. To ensure that the two end plates had the same motion status as the copper electrode in contact with them, the normal behavior was also defined as a pressure interference fit relationship, and the tangential behavior was defined as rough.

2.6. Temperature Measurement Verification

Temperature measurement analysis was carried out in the flash-butt welding process of high nitrogen steel to verify the accuracy of the finite element model. Figure 6 shows the comparison between the simulated and measured temperature results. The actual welding temperatures are distributed on both sides of the simulated temperature curve with a high coincidence degree, indicating that the finite element model established exhibits a high accuracy with the actual welding situation.

3. Results and Discussion

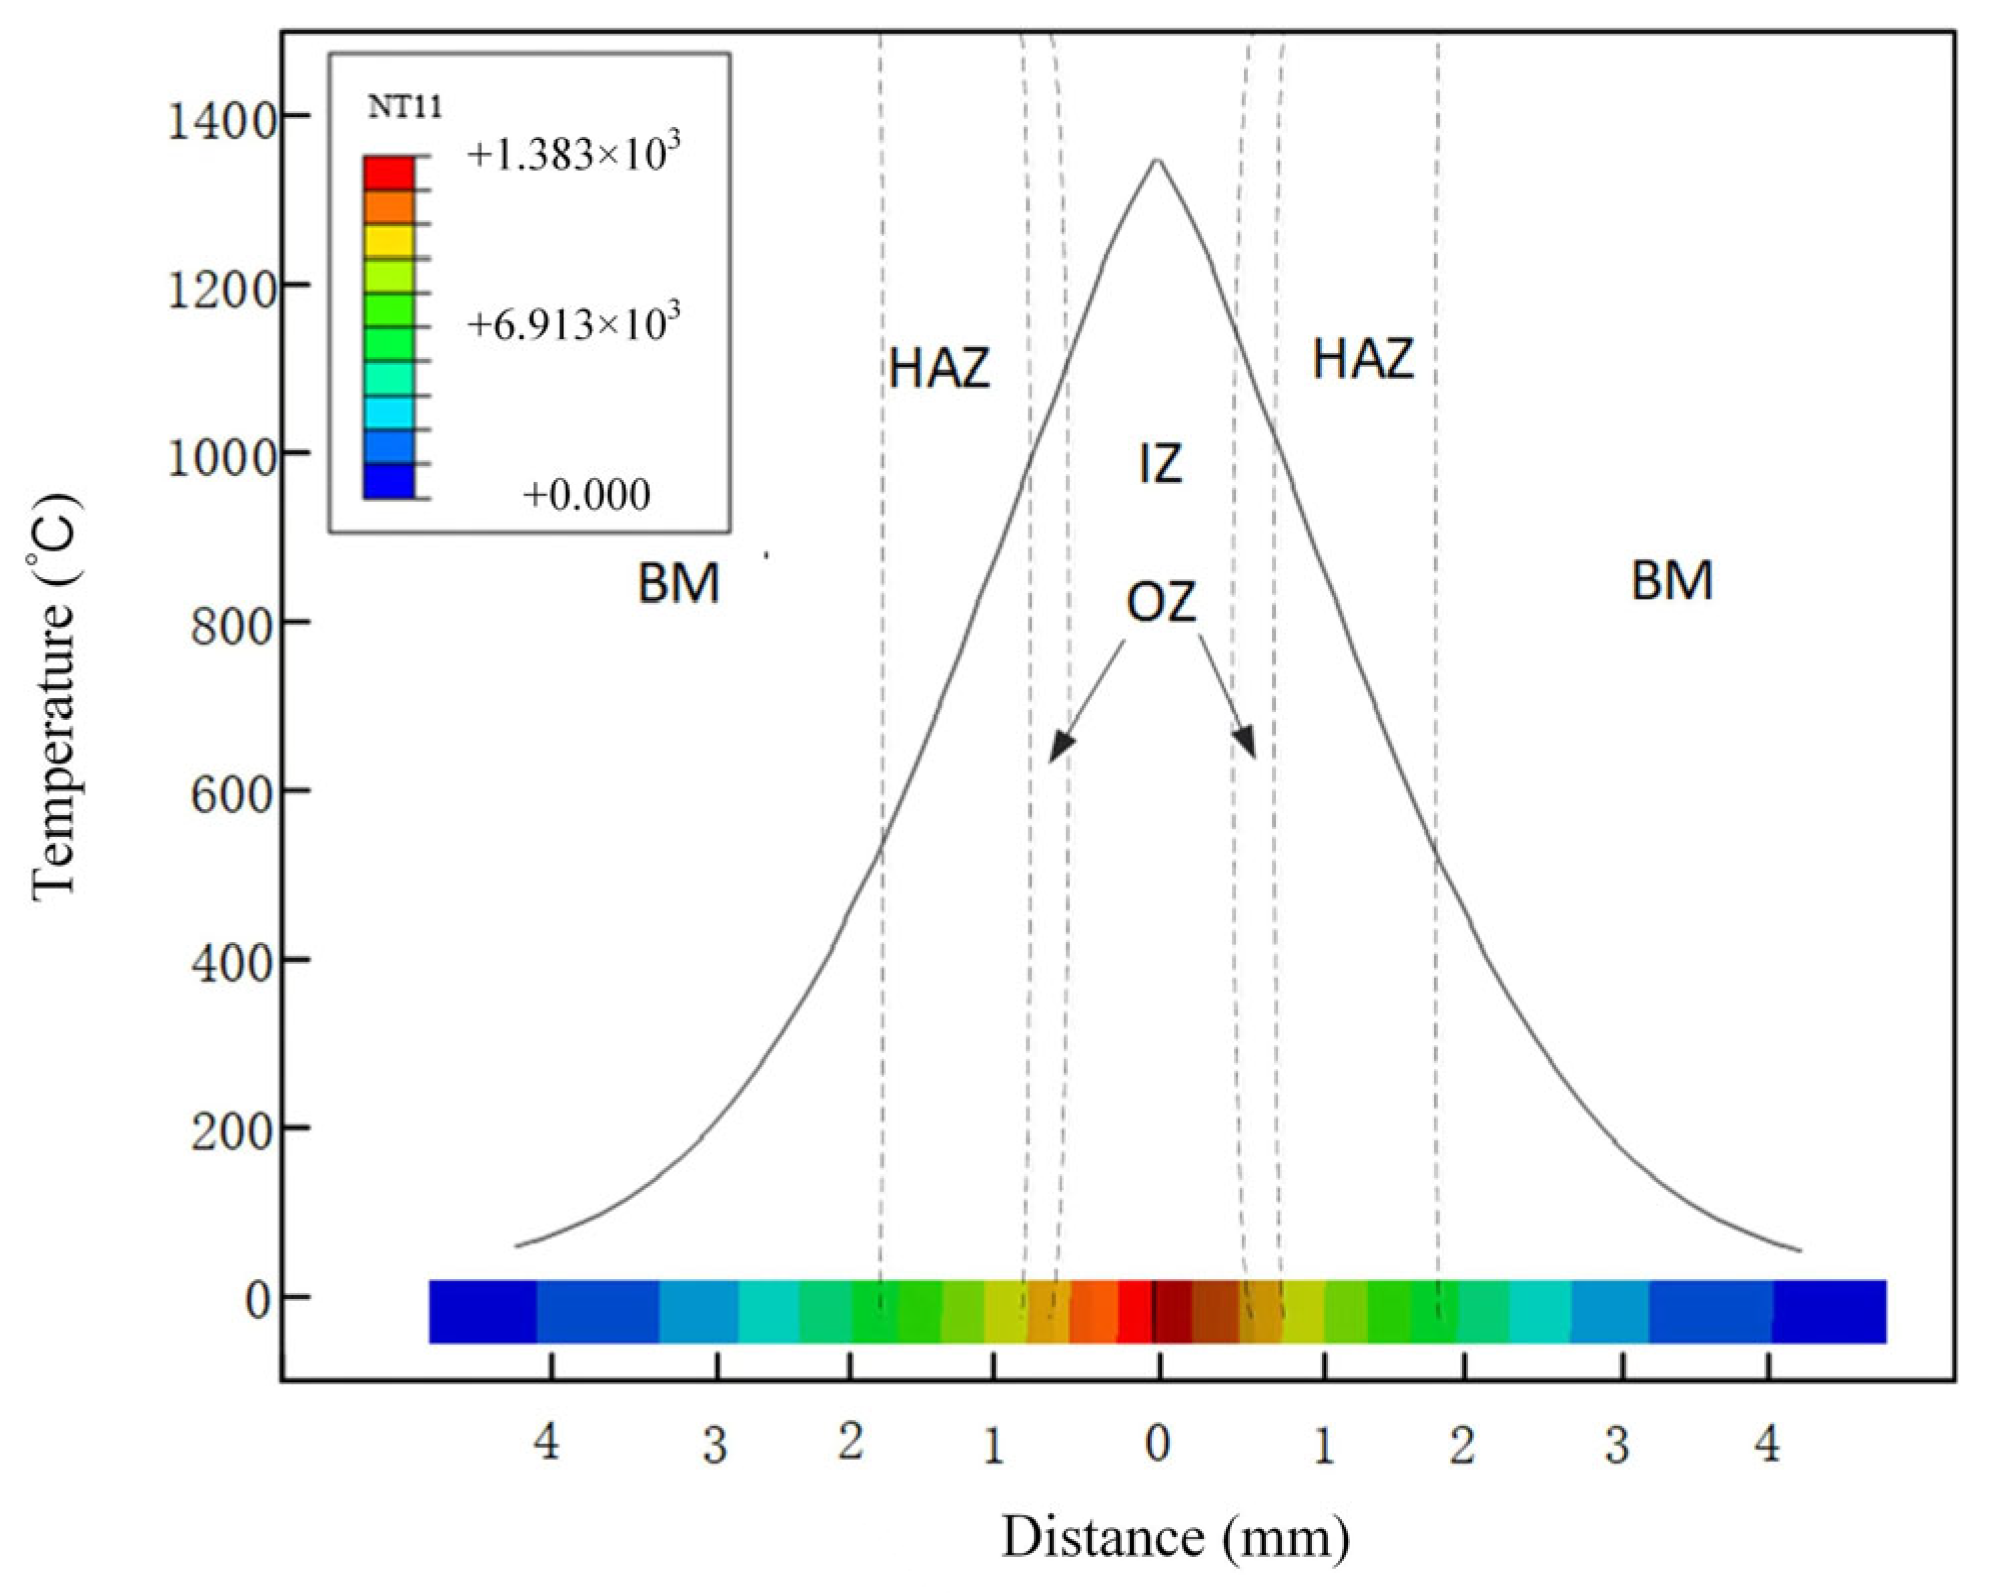
3.1. Thermodynamic Analysis

The flash-butt welding process of high nitrogen steel includes heating, melting, cooling, and solidification, accompanied by mechanical forces. In this process, the supersaturated nitrogen dissolved in the metal is precipitated as N2 or nitride. The second phase precipitation or nitrogen pores lead to a decrease in mechanical properties. Thus, JMat Pro software was applied to predict the equilibrium phase diagram of the precipitated phase in high nitrogen steel. At a temperature of 960 °C, almost all the microstructure was transformed into austenite, with only a small amount of the MNS phase. High-temperature ferrite (δ-F) was produced at approximately 1010 °C, and maintained until 1390 °C for complete melting. The highest precipitation temperature of the M2 (C, N) phase was approximately 960 °C, which mainly belongs to the Cr2 (C, N) phase, as shown in Figure 7b. The highest precipitation temperature of the σ phase was approximately 870 °C. As can be seen from the element composition diagram in Figure 7c, when the σ phase was near 870 °C, the Fe element became the most abundant element and accounted for approximately 50%, with other elements of Cr, Mn, and Mo. The maximum precipitation temperature of the Laves phase was approximately 870 °C, similar to that of the σ phase. The leaf phase was mainly composed of Mo, Fe, Cr, and other elements, as shown in Figure 7d.

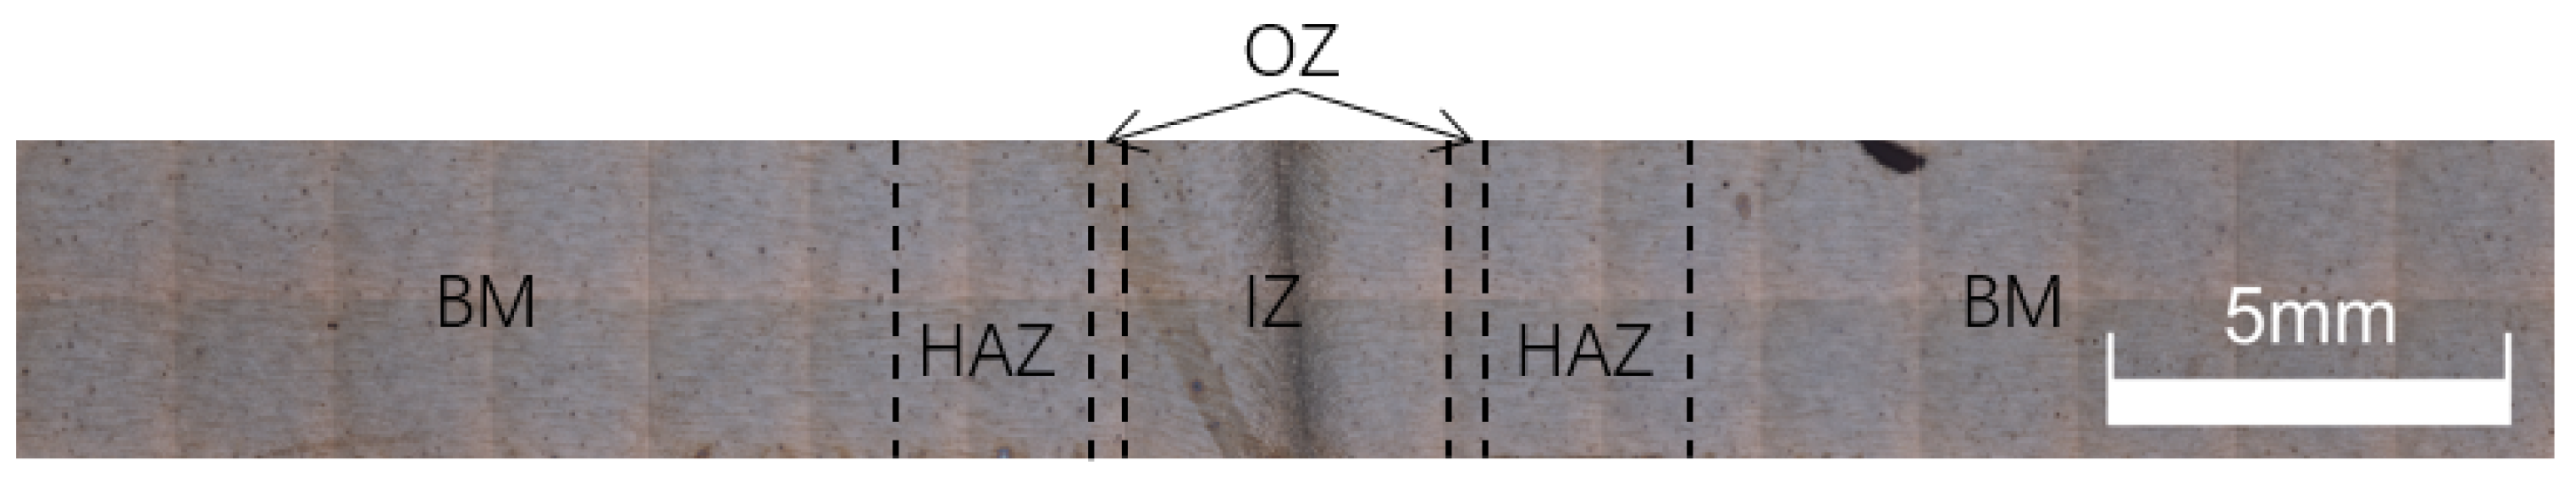
3.2. Joint Organization

The welded joint consisted of three typical zones, the interface zone (IZ), the overheated zone (OZ), and the heat-affected zone (HAZ). Figure 8 shows the overall regional distribution of the weld.
Figure 9 shows the microstructure of the joint interface area obtained at a cam angle (flash retention) of 100°, top forging pressure of 0.4 MPa, and thyristor angle (flash current) of 45°. Figure 9a presents a macro metallographic diagram of the joint, and Figure 9b–d is an enlarged microstructure of a local area of Figure 9a. Figure 9b shows the interface area and the metallographic structure of the interface zone (IZ), consisting of austenite and ferrite. Ferrite is distributed at austenite grain boundaries and appears as a dark black color. The end face metal in the interface area is completely heated with a large plastic zone. During the top forging process, all the molten metal is extruded, and the plastic metal in the interface zone is dynamically recrystallized under the action of the top forging force and high temperature. The overheating area shown in Figure 9c occupied the smallest area in the entire joint area, and its bearing performance here tended to be the worst. The austenite grains in the superheated region were weakened by external forces, compared to those in the IZ. Thus, the dynamic recrystallization failed to occur, and the original grains absorbed energy rapidly under the influence of welding thermal cycling. As shown in Figure 9d, the heat-affected zone outside the superheated zone was affected by the welding thermal cycle. As a result, some dislocations inside the grain and at the grain boundary disappeared, and the grain boundary migrated, with small grains engulfed by large grains, resulting in slightly larger austenite grains in the heat-affected zone.
As shown in Figure 10, the microstructures of the interface zone at 25°, 35°, 45°, and 55° were composed of austenite and ferrite. The ferrite was distributed at the austenite grain boundary. Due to the low heat input at the joint interface, there is less molten material on the end face, resulting in flash flow. The molten liquid metal remained at the interface and was finally welded together through the action of the forging force. The welding heat input increased and the grain grew with an increasing thyristor angle. The terminal metal was heated sufficiently, and the plastic zone became larger at 45° and 55°, as shown in Figure 10c,d. In the process of upsetting, all the melted metals were extruded, and the plastic metals underwent dynamic recrystallization under the forging force and high temperature. When the thyristor angle was 55°, the interface area heat input increased. The dynamic recrystallization part became the extruded part due to the upsetting force, and the interface area displayed insufficient dynamic recrystallization and uneven grain size.

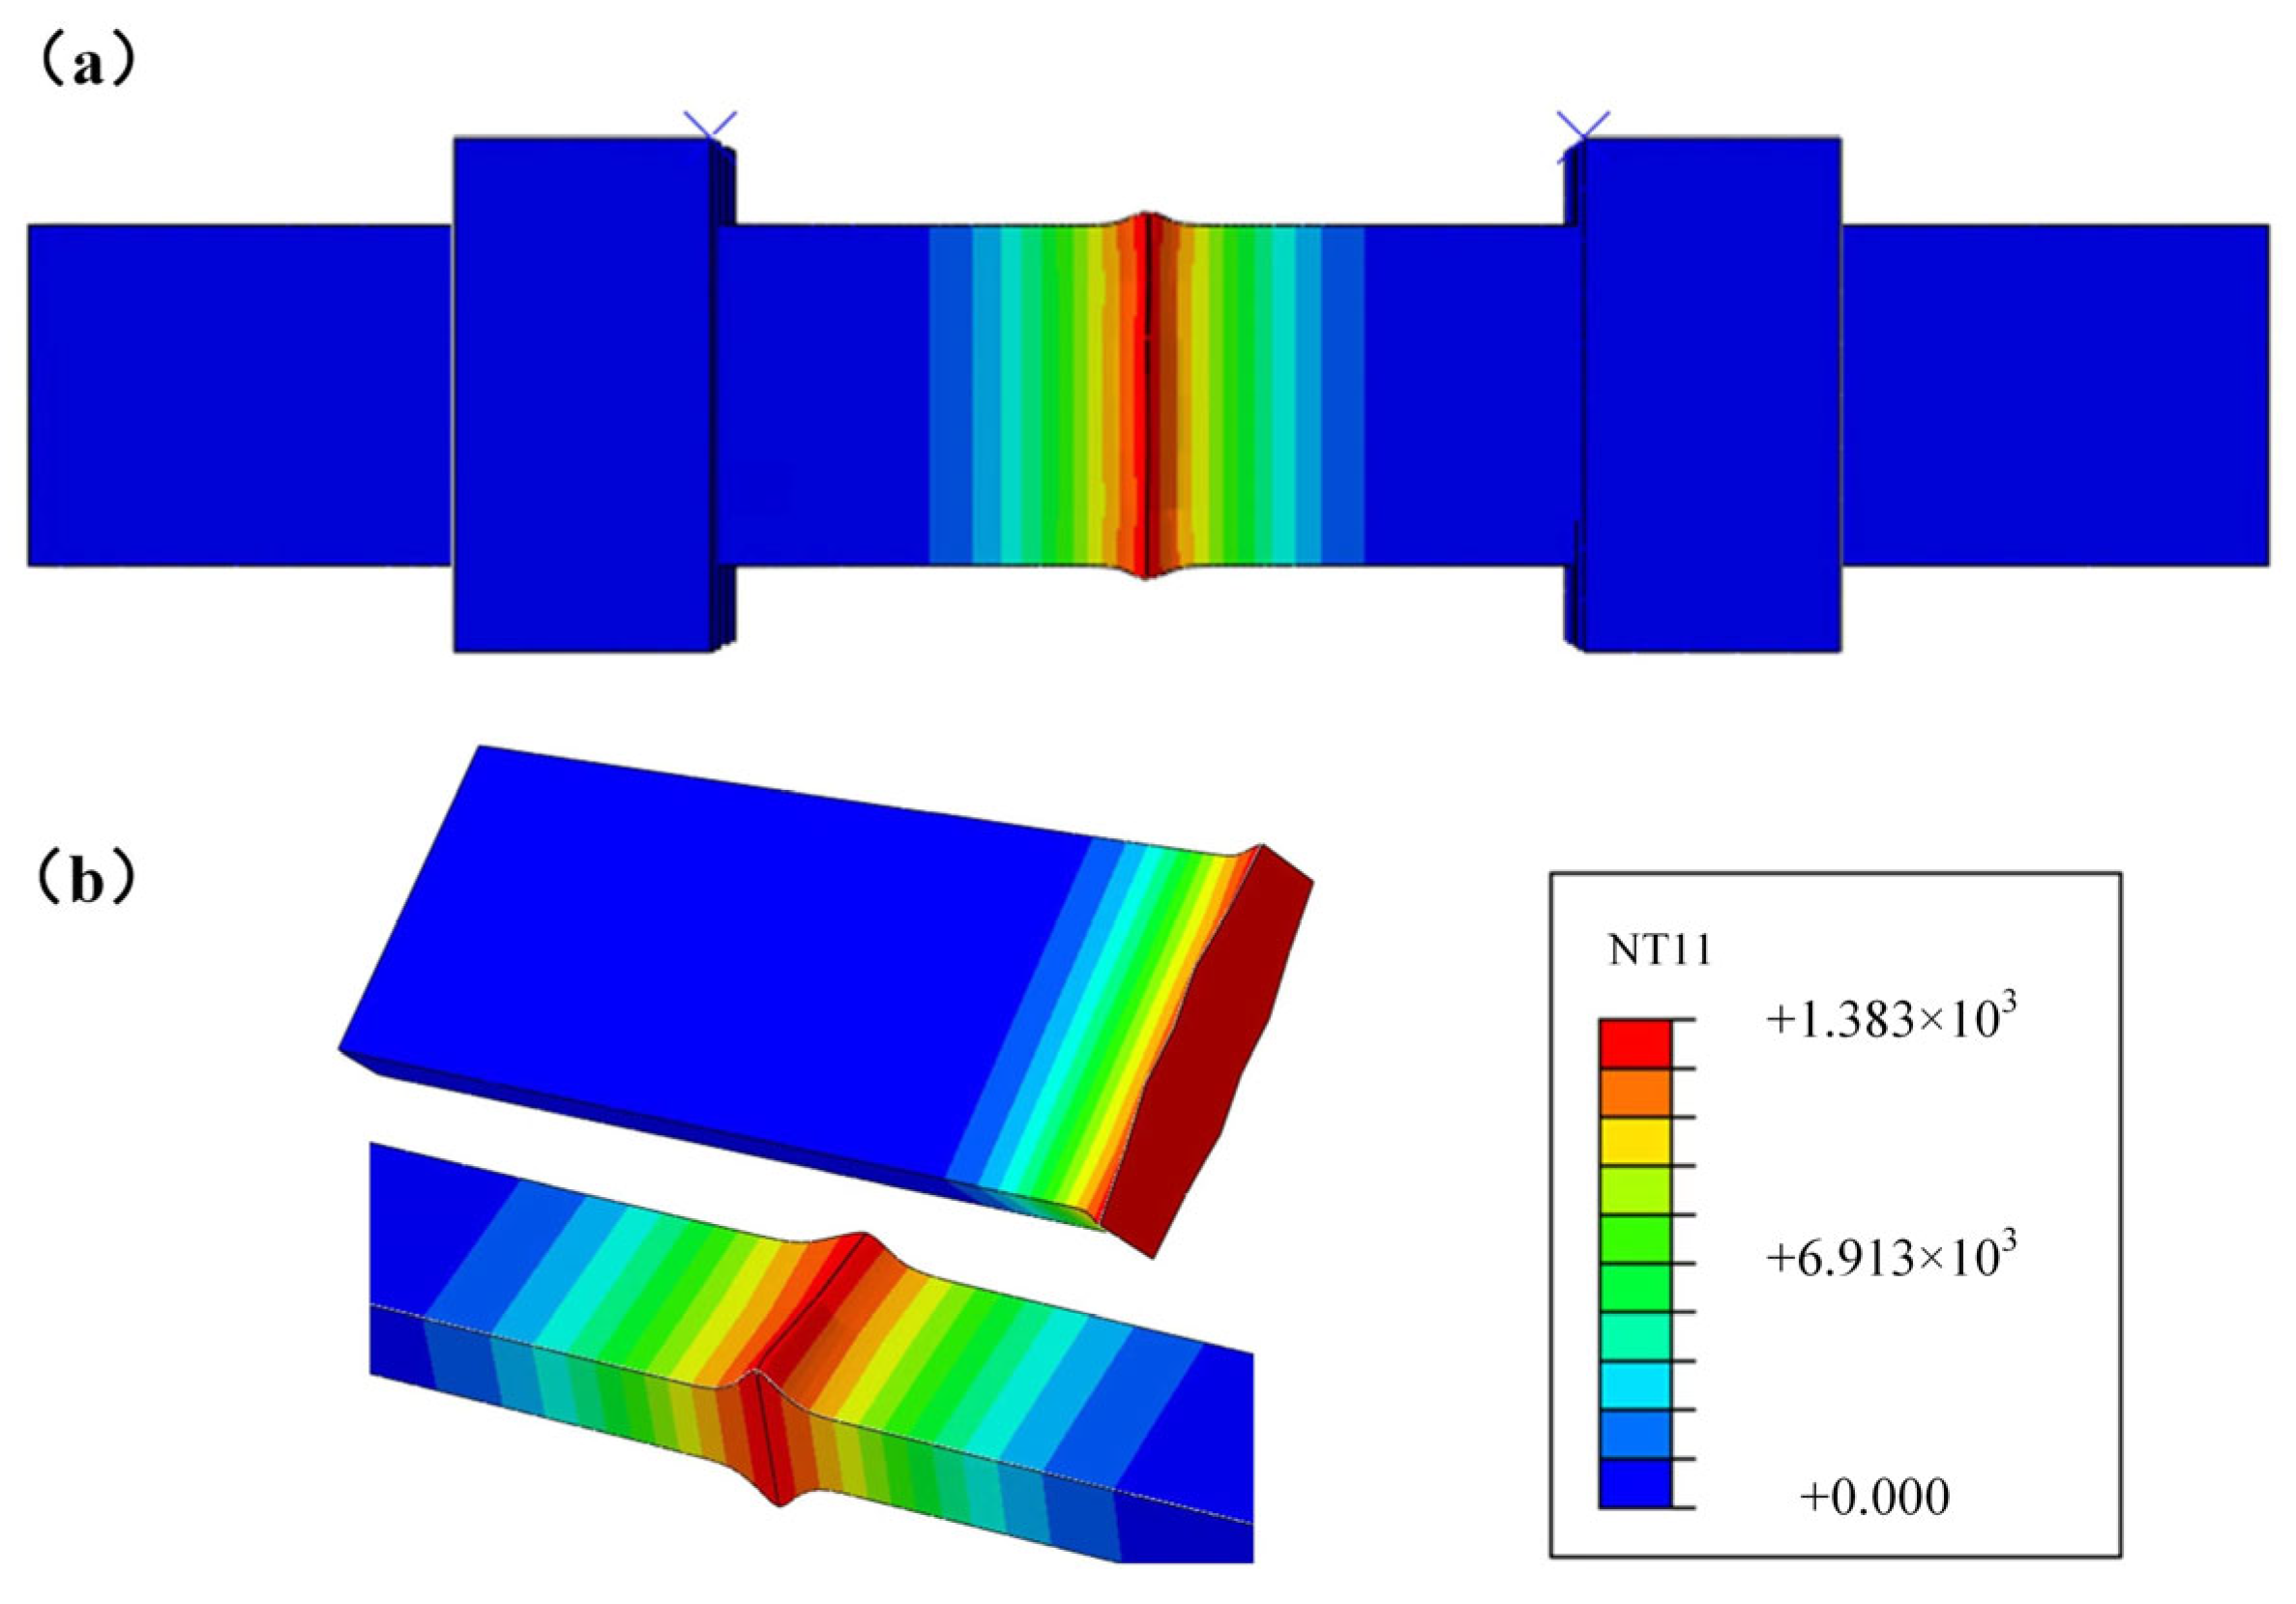
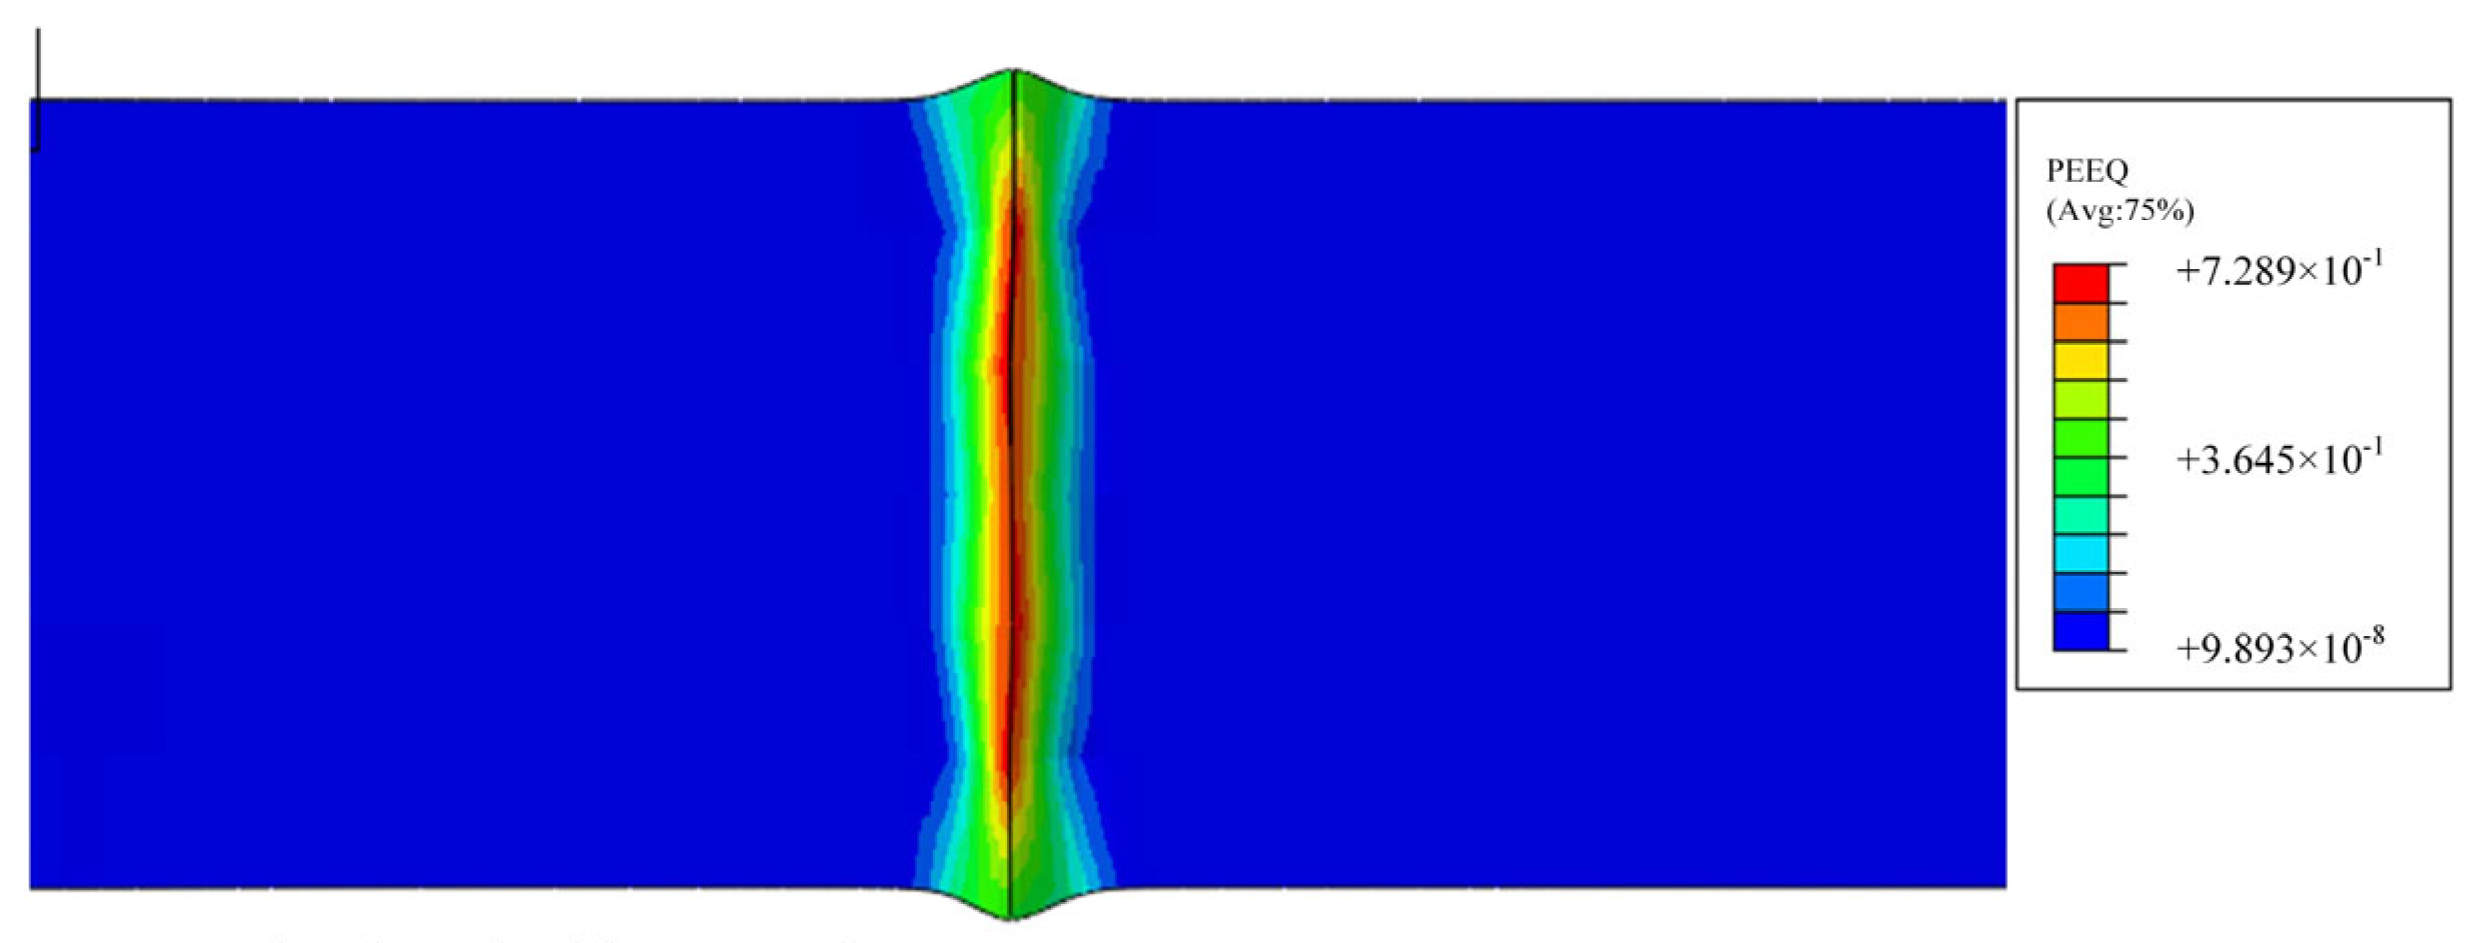
3.3. Simulation Results and Analysis

The temperature of the flash-butt welding joint is the crucial factor for weld formation. The welding process of flash-butt welding and phase transition during welding and phase transition was characterized. Based on the exploration of preliminary experiments and the results of thermodynamic calculations in the previous section, the simulation results of different welding parameters were compared. Ultimately, the simulation results of typical welding parameters (thyristor angle 45°, CAM angle 100° and forging force 0.4 MPa) were selected for analysis. Figure 11 shows the temperature field at a thyristor angle of 45°. At this stage, the maximum temperature of the connecting end face reached 1383 °C, which was higher than the melting point of the experimental materials. The temperature field on both sides of the weld was symmetrically distributed. The isotherms were relatively concentrated in the weld center, with a high temperature gradient. The farther away from the weld center, the sparser the isotherms on both sides, and the smaller the temperature gradient. Sections were cut along the weld direction and the vertical weld direction to intuitively present the temperature distribution inside the joint. Figure 11b shows the center section diagram along the vertical weld.
Figure 12 shows the equivalent strain distribution diagram during the upset process. The material close to the weld center exhibited a great plastic deformation, up to 0.7289. In the process of forging forces, the material on the end of the weldment was subjected to both high temperature and forging force at the same time. Therefore, the melted metal on the end was extruded, and the plastic metal near the end face turned outward. The grains grown in the interface area under the influence of the welding thermal cycle were partially extruded, and dynamic recrystallization resulted in grain refinement.
Combined with the simulation results of the phase diagram and temperature field, the temperature of the interface zone was 1008~1383 °C. As shown in Figure 13, almost all the microstructure was transformed into austenite at 960 °C, and only a small amount of the MNS phase was observed. The δ-F was produced at approximately 1010 °C, and held until complete melting occurred at 1390 °C. The IZ phase included austenite, δ-F and a small amount of the MNS phase. The temperature of the OZ ranged from 922 °C to 1008 °C. As shown in Figure 13, the M2 (C, N) phase displayed the highest precipitation temperature, at approximately 960 °C, and the phase composition of the OZ was mainly austenite, ferrite and some MNS phase M2 (C, N). The heat-affected zone temperature of the phase was 615–922 °C, and the σ phase and Laves phase displayed the maximum precipitation temperature, at approximately 870 °C. The structure was still composed of the Laves phase, M2 (C, N) phase, sigma phase, austenite and ferrite phase.

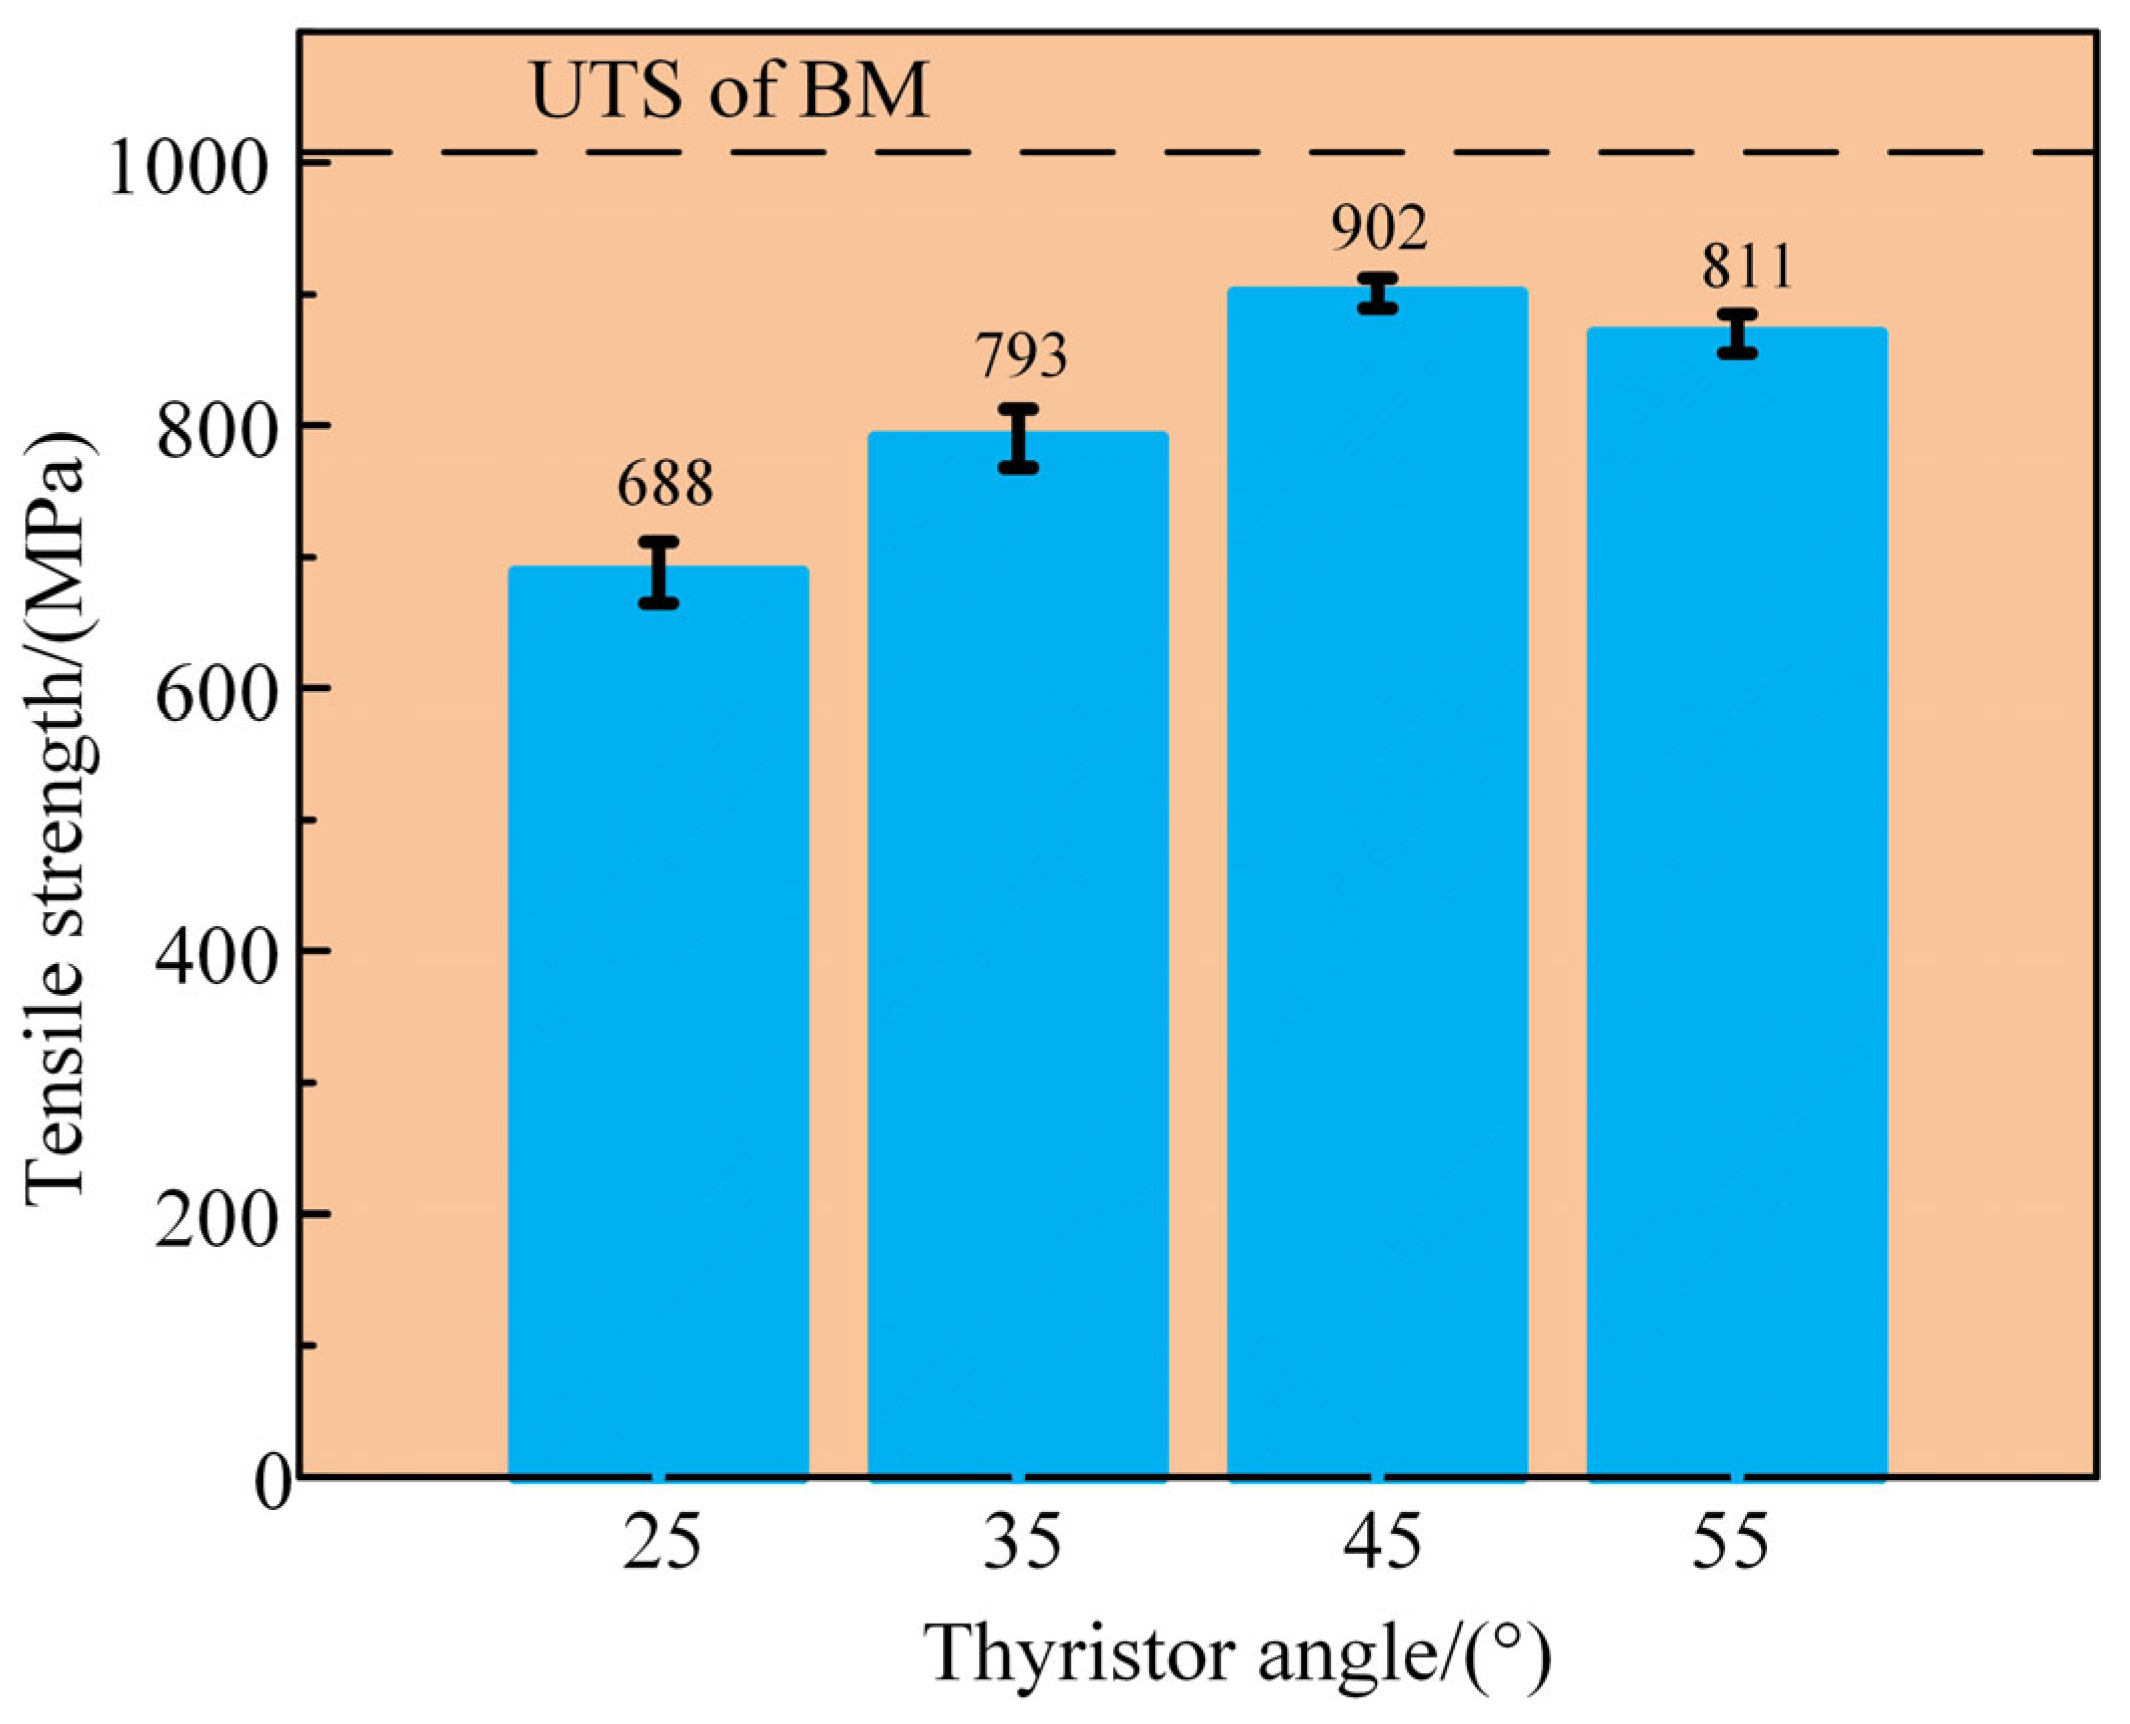
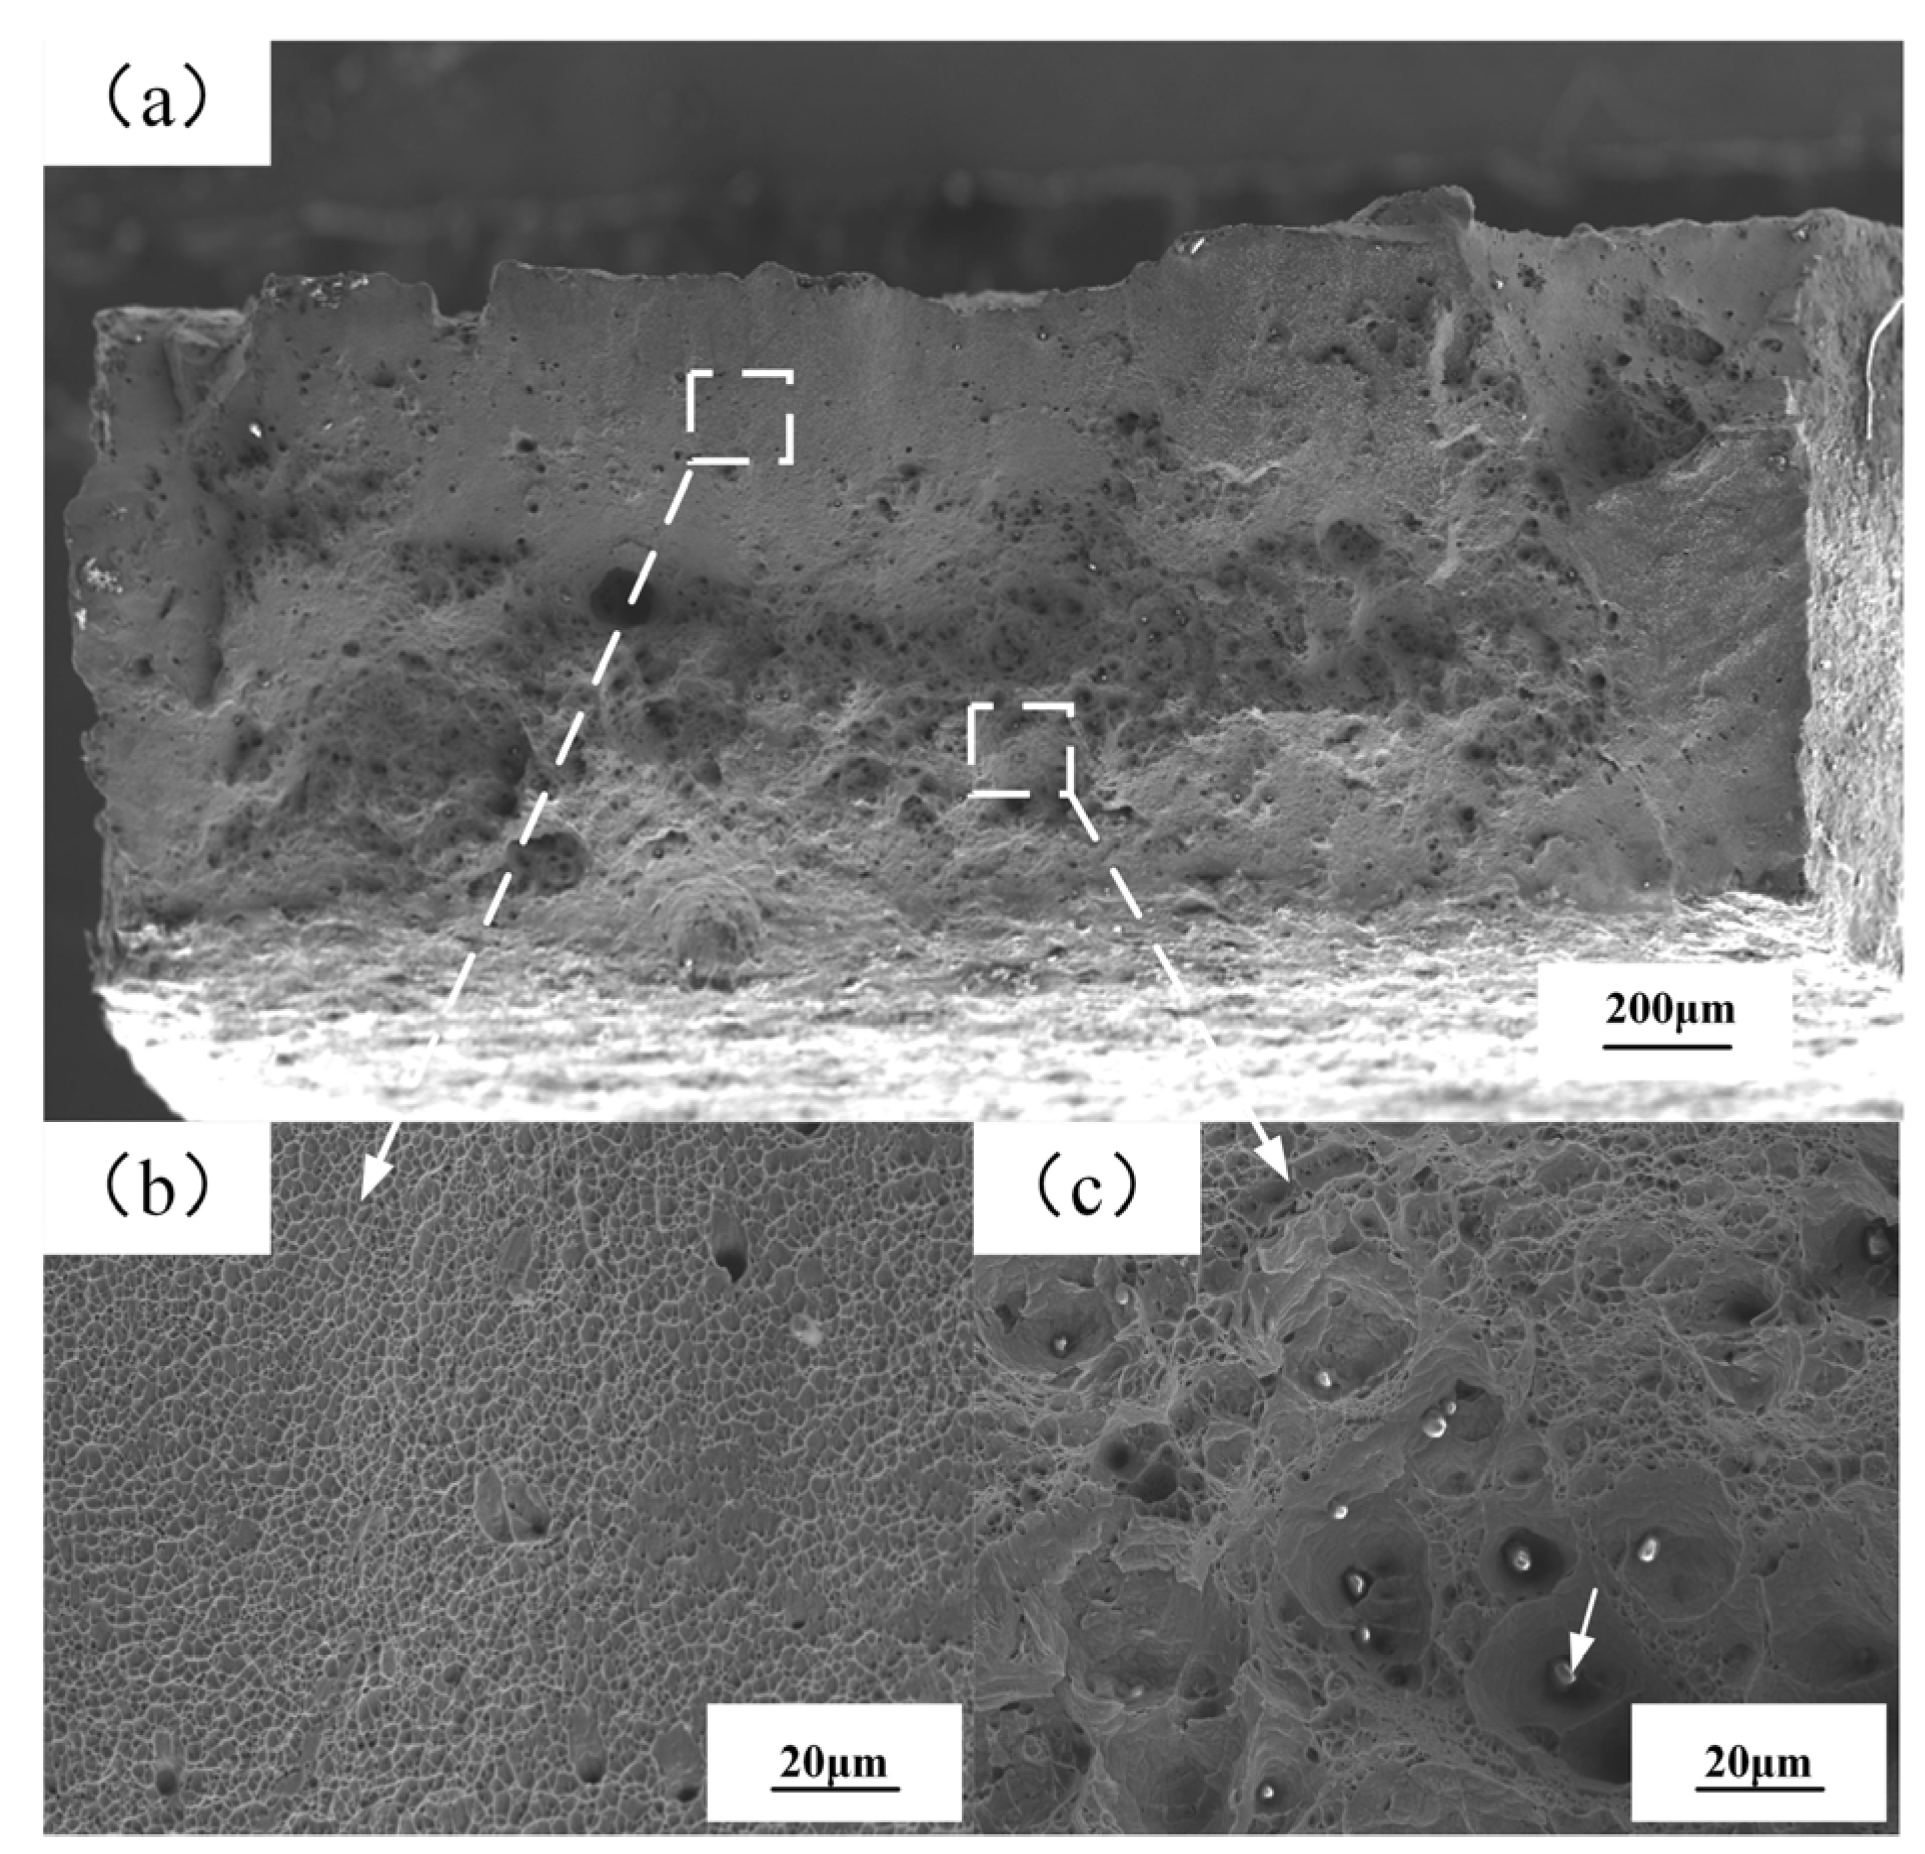
3.4. Mechanical Properties

The overall hardness of flash-butt welding joints displayed a “V” shape. The interface exhibited the lowest hardness, and the hardness gradually increased with the distance from the interface area. Although the interface presented fine grains, the austenite phase zone decreased due to the precipitation of nitrogen, and the hardness decreased with increasing ferrite content. Figure 14 shows the microhardness with different thyristor angles. The joint hardness reached the lowest value of 237 HV at 55° because the relatively small, recrystallized grains in the interface area were excessively extruded, resulting in relatively coarse grains at the interface. Therefore, the joint hardness in the interface reached the lowest value. When the thyristor angle was 25°, 35° and 45°, the hardness reached 252 HV, 246 HV and 247 HV, respectively.
Figure 15 shows the tensile strength of the joint at different thyristor angles. The joint sample at different thyristor angles displayed a lower tensile strength than that of the base material. The tensile strength first increased and then decreased with increasing thyristor angle, and reached 902 MPa at 45°, which was 86.4% of the tensile strength of the base material. The tensile strength decreased to 811 MPa at 55 °C, mainly due to a large plastic zone and a high plasticization degree induced by the increased heat input in the weld. The high degree of plastic deformation and the increased plastic heat resulted in an improvement in the mechanical properties of the weld. The plastic zone became larger at 55° due to the excessive heat input, and the corresponding dynamic recrystallized grains of the joint were severely extruded. Therefore, the joint microstructure exhibited relatively coarse grains, leading to a reduction in tensile strength.
According to the joint hardness and tensile properties, the optimal parameters of the flash-butt welding process were determined to be the thyristor conduction angle of 45°. As shown in Figure 16a, the macroscopic fractures presented uniform and ductile fractures. Figure 16b,c are partially enlarged views of Figure 16a. Zone b displayed small and uniform tear margins and dimples, without visible precipitated phases. Zone c, located in the center, showed larger and deeper dimples than those in zone b, located at the edge, and contained a number of precipitated phase particles. The element composition of the precipitated phase was determined by EDS analysis, and the result is shown in Figure 17. Atomic percent of Cr was 6.10, atomic percent of Mn was 17.35 and atomic percent of Fe was 3.9.
The welding displayed a relatively high thermal cycle temperature near the weld center with a long thermal cycle action time, resulting in the generation of second phase particles. The fracture occurred in the heat-affected zone. During the welding process, the temperature in the heat-affected zone ranged from 615 to 922 °C, and the precipitated phase in Figure 7 was mainly the Cr2 (C, N) phase.

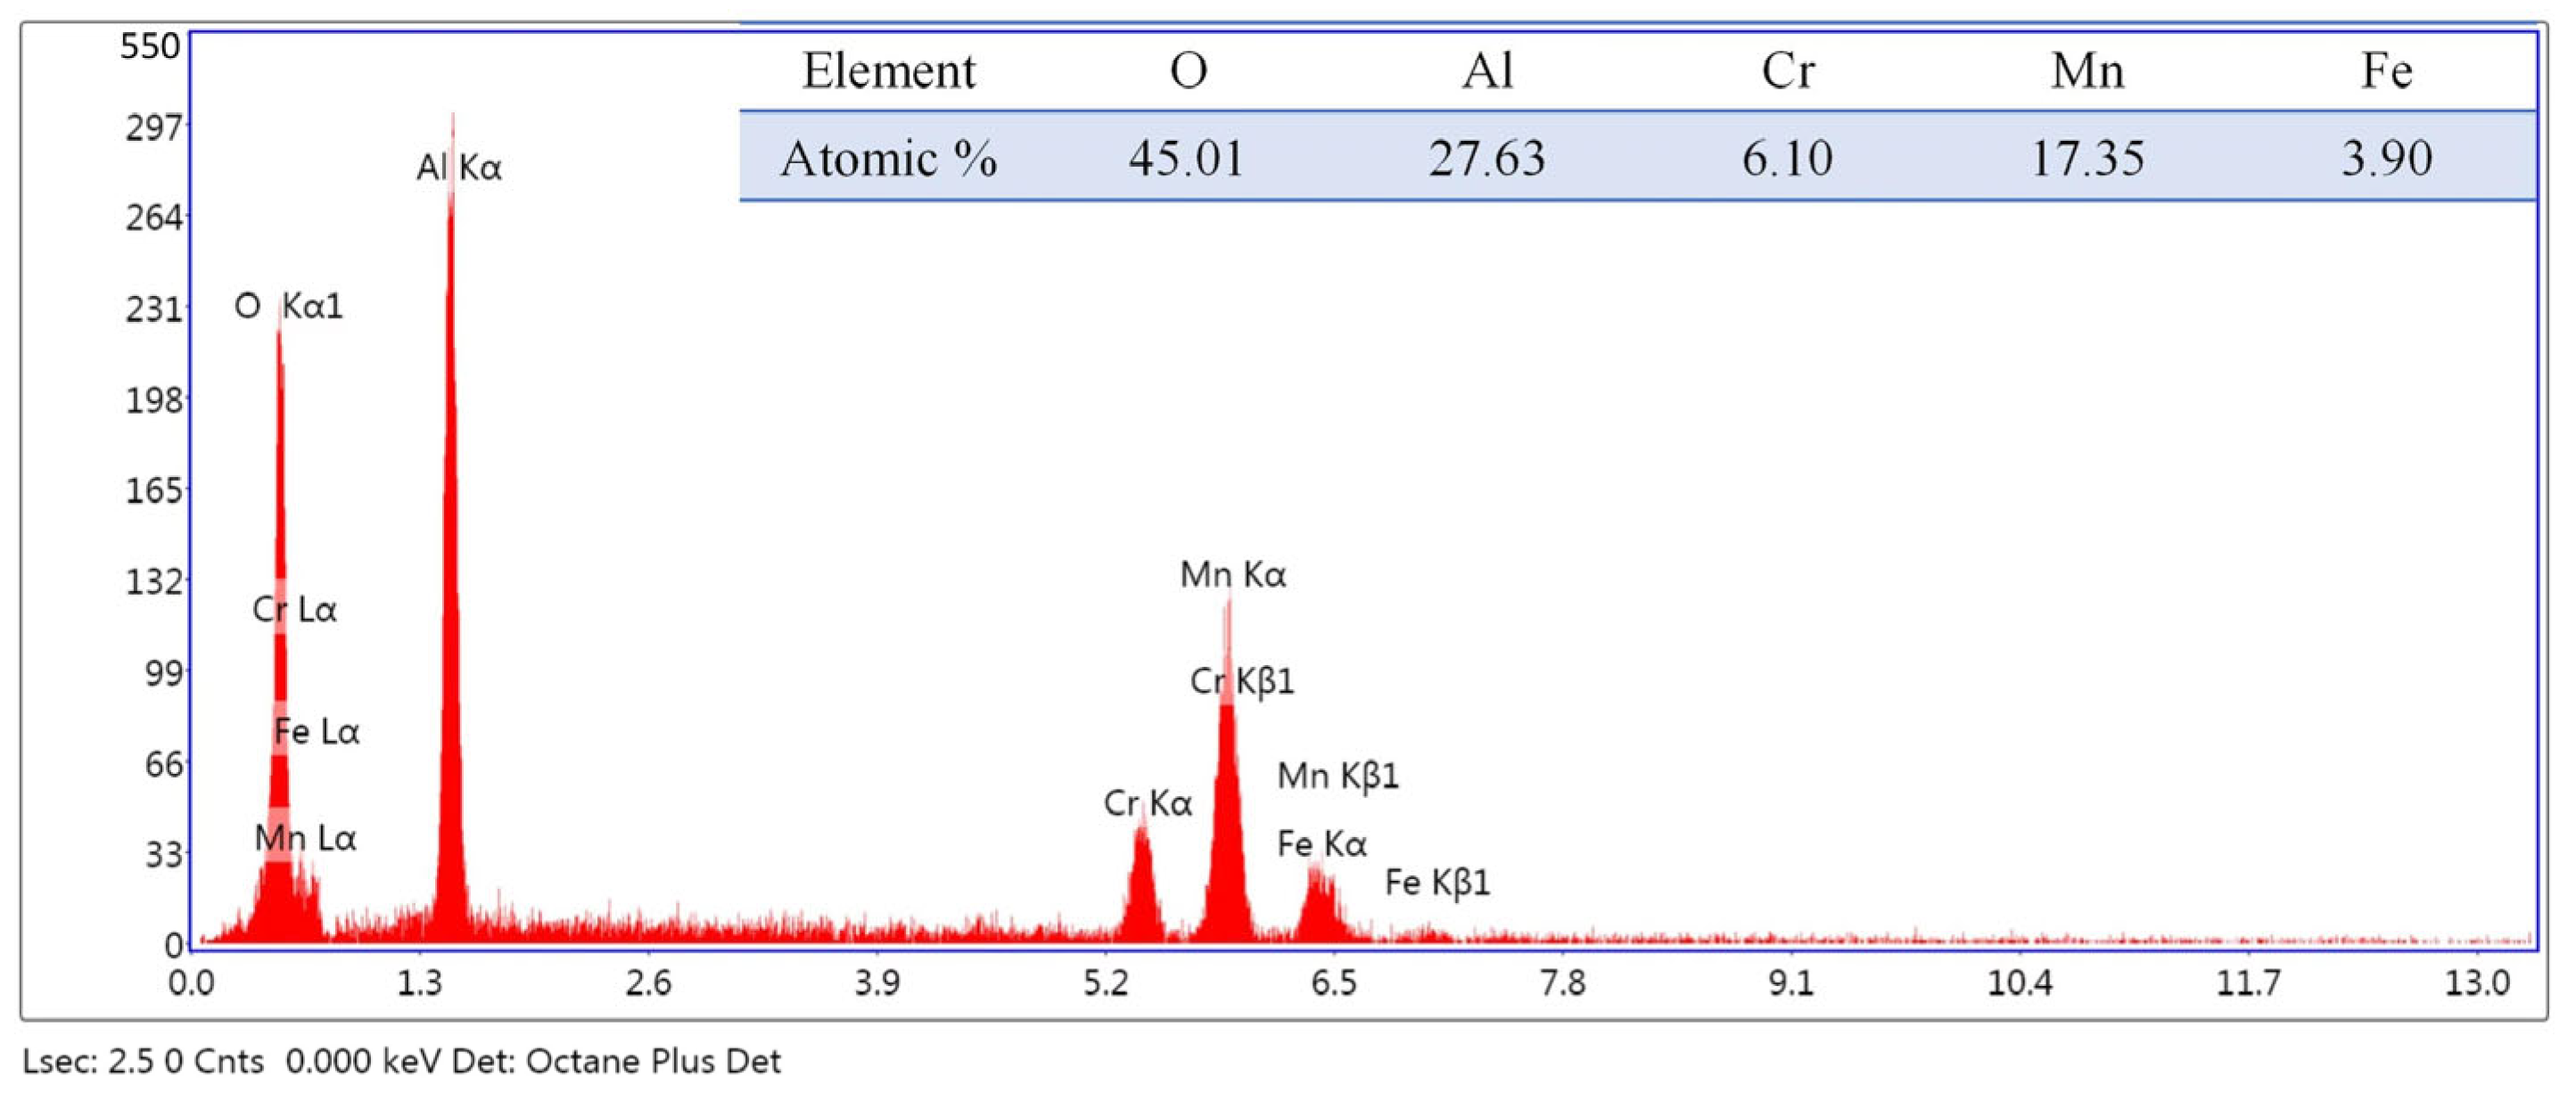
3.5. Full Immersion Corrosion Test

The corrosion rate of the BM reached 0.0013 g/cm2 at 10 min and 0.0012 g/cm2 at 1 h, suggesting a basically stable corrosion rate with increasing immersion time. As shown in Figure 5, the supersaturated nitrogen in the BM was combined with Cr, Mo and other elements to form the corresponding nitride. The products attached to the sample surface inhibited the corrosion to a certain extent. The corrosion rate of the welded joint was 0.0072 g/cm2 at 10 min and 0.0208 g/cm2 at 1 h. Second phase precipitation was found at the interface and a small amount of the M2(Cr, N) phase was found in the HAZ. In addition, the loss of nitrogen and chromium during welding further reduced the corrosion resistance. During joint corrosion, no dense corrosion products were observed on the surface of the specimen [20,21,22].
The corrosion behavior of high nitrogen steel was analyzed by surface morphological observation [23]. Figure 18 shows the corrosion morphology of the welded joint after 10 min of etching in a 10% H2SO4 solution at room temperature. As shown in Figure 18a, the corrosion degree was quite serious in the interface center but was reduced on both sides. As shown in Figure 18a–c, the austenite grain boundaries were black and deep, and intergranular corrosion was observed in the high nitrogen steel. Meanwhile, small etched pits inside the grains were found, as shown in Figure 18b–d. As shown in the joint heat-affected zone c, the grain structure of the heat-affected zone can be observed, with small etch pits in zone d under a larger magnification. Thus, corrosion differences occurred between the intercrystalline and internal grains, accompanied by the nucleation in internal grains.
Figure 19 shows the morphology of different regions in the high nitrogen steel joints after etching in 10% H2SO4 solution for 1 h at room temperature. As shown in Figure 19a, the interface area was seriously corroded, with a large number of dark corrosion products, while the surface of the superheated area in Figure 19b displayed relatively few dark corrosion products. The joint corrosion morphology and the black corrosion products of the HAZ shown in Figure 19c suggested that the corrosion products generated on the sample surface tended to inhibit the corrosion. The grain boundary morphology can be partially observed from the corrosion morphology of the BM, as shown in Figure 19d. Compared with other corrosion areas, fewer holes and pits were observed, indicating the lightest corrosion degree. In addition, the corrosion degree of the welded joint was more serious than that of the original BM. The phases in the IZ consisted of austenite, δ-F, and a small amount of MNS phases. The phase composition of the superheated region was composed of austenite, ferrite and some M2 (C, N) phase. The heat-affected zones were mainly the Laves phase, M2 (C, N) phase, Σ phase, austenitic phase and ferrite phase. These analyses indicated that the welded joint area with different compositions accelerated the corrosion rate.

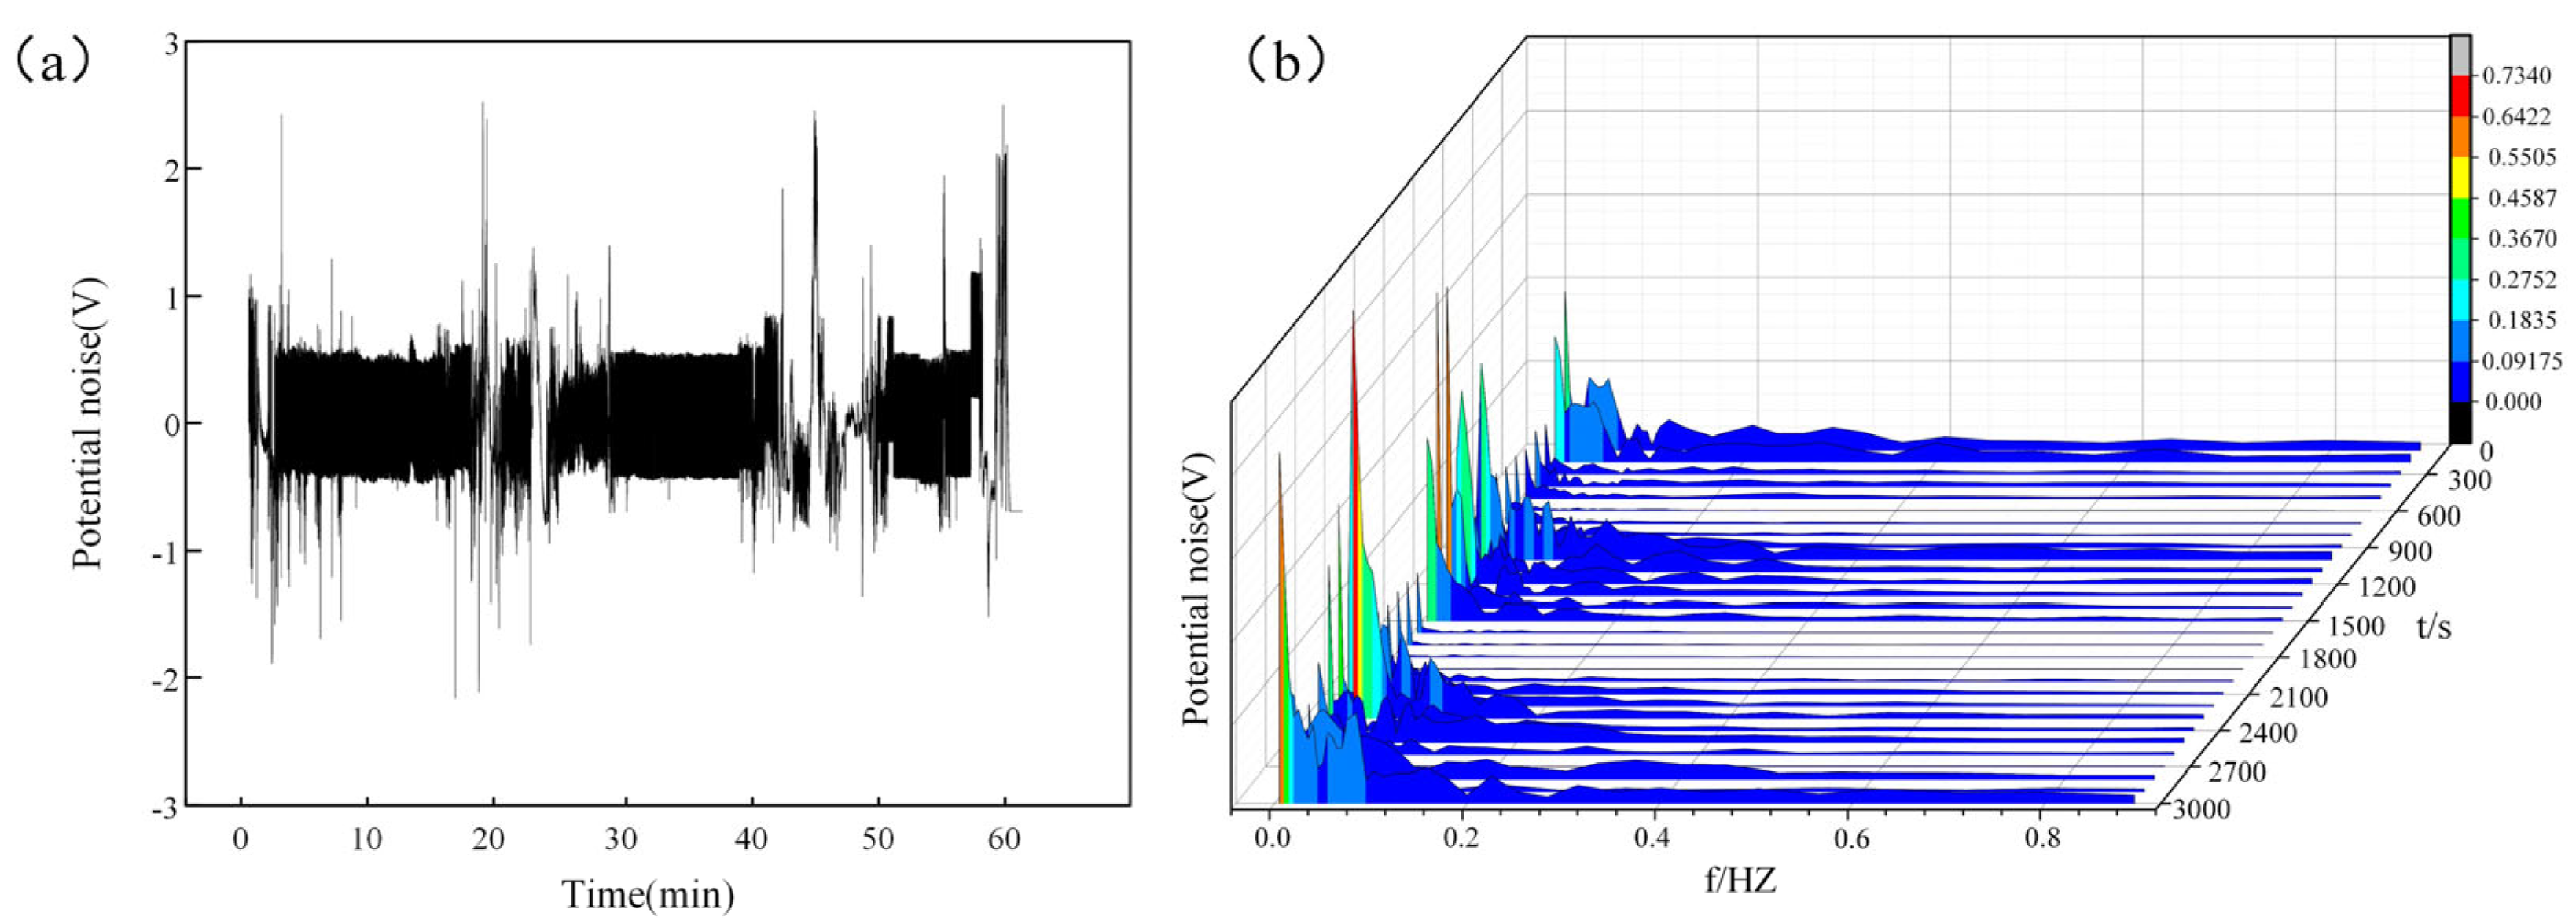
3.6. In Situ Detection

Electrochemical noise monitoring of high nitrogen steel joints was conducted to further explore the corrosion process of welded joints, in which the noise signal was affected by the DC drift signal. Figure 20a shows the transient wave patterns of electrochemical noise in different periods at room temperature. At the initial stage of corrosion, the potential fluctuated greatly, and then tended to be stable. Corrosion occurred first in the interface area of the joint, resulting in a great potential fluctuation. The potential fluctuated again at 20 min due to the shedding of the product. Similarly, the potential waveform fluctuated greatly at 40~50 min, because more corrosion products fell off at the joint [24,25].
Figure 20b shows the noise potential in the frequency domain. The joint corrosion potential was concentrated in the low-frequency region, and the potential fluctuated at 300 s. The potential fluctuated periodically with increasing time, mainly related to the charging/discharging process on the electrode surface. Each potential fluctuation corresponded to the nucleation and growth of an etch, and the recovery of the potential corresponded to the extinction of the etch. The potential recovery rate corresponded to the extinction rate of the etch [26].

4. Conclusions

The high nitrogen content poses challenges for welding of high nitrogen steels. Escape and accumulation of nitrogen will happen during the fusion welding process of high nitrogen steel. However, flash-butt welding is a highly effective technique for welding high nitrogen steels, which can effectively address this issue. In this work, the joint phase composition of high nitrogen steel was predicted though finite element simulation and phase diagrams. The microstructure and mechanical properties of welded joints under different flash currents were explored, and a full immersion corrosion test with optimal parameters was conducted. This article provides theoretical guidance for the engineering application of high nitrogen steel.
  • The numerical simulation results of the FBW process of high nitrogen steel were consistent with the experimental results. The maximum temperature for the welded joints of high nitrogen steel using flash-butt welding with typical parameters was 1383 °C.
  • When the thyristor angle was 45°, the interface was composed of austenite and high-temperature ferrite, while the superheated zone consisted of austenite, ferrite and a small amount of the M2 phase. The heat-affected zone was mainly single-phase austenite.
  • The joint hardness showed a V-shaped distribution with the lowest hardness at the interface. The hardness and tensile strength of the interface area of the joint increased first and then decreased with increasing flash current. The maximum tensile strength reached 902 MPa at 45°, showing the best mechanical property. The fracture mode of the joint was ductile fracture.
  • The total erosion experiment suggested that the interface center presented the most serious corrosion and the corrosion occurred first in the interface area of the joint.

Author Contributions

Y.Z.: Conceptualization, Project administration; T.L.: Methodology, Writing—original draft.; Q.J.: Data curation, Software; H.Y.: Project administration, Writing—review and editing; H.Z.: Visualization, Supervision. All authors have read and agreed to the published version of the manuscript.

Funding

The research was sponsored by the Youth Fund of the National Natural Science Foundation of China (No. 52205395) and the Natural Science Foundation of Shandong Province (No. ZR201911140194).

Data Availability Statement

Data is unavailable due to privacy.

Acknowledgments

The authors thank the referees of this study for their valuable and very helpful comments.

Conflicts of Interest

The authors declare that they have no known competing financial interest or personal relationships that could have appeared to influence the work reported in this paper.

References

  1. Mohammed, R.; Reddy, G.M.; Rao, K.S. Welding of nickel free high nitrogen stainless steel: Microstructure and mechanical properties. Def. Technol. 2017, 13, 59–71. [Google Scholar] [CrossRef] [Green Version]
  2. Li, S.; Zhang, C.S.; Lu, J.P.; Chen, R.D.; Chen, D.Z. A review of progress on high nitrogen austenitic stainless-steel research. Mater. Express 2021, 11, 1901–1925. [Google Scholar] [CrossRef]
  3. Mohammed, R.; Rao, K.S.; Reddy, G.M. Studies on Fusion Welding of High Nitrogen Stainless Steel: Microstructure, Mechanical and corrosion Behaviour. Mater. Sci. Eng. 2018, 330, 012035. [Google Scholar] [CrossRef]
  4. Kiellerup, B.V.; Olesen, B.H.; Nielsen, J.L.; Sowers, K.R.; Nielsen, P.H. In situ detection of bacteria involved in cathodic depolarization and stainless steel surface corrosion using microautoradiography. J. Appl. Microbiol. 2008, 105, 2231–2238. [Google Scholar] [CrossRef] [PubMed]
  5. Li, H.B.; Jiang, Z.H.; Feng, H. Microstructure, mechanical and corrosion properties of friction stir welded high nitrogen nickel-free austenitic stainless steel. Mater. Des. 2015, 84, 291–299. [Google Scholar] [CrossRef]
  6. Zhao, L.; Tian, Z.L.; Peng, Y. Porosity and nitrogen content of weld metal in laser welding of high nitrogen austenitic stainless steel. ISIJ Int. 2007, 12, 1772–1775. [Google Scholar] [CrossRef] [Green Version]
  7. Dong, W.; Kokawa, H.; Sato, Y.S. Nitrogen desorption by high-nitrogen steel weld metal during CO2 laser welding. Metall. Mater. Trans. B Vol. 2005, 36, 677–681. [Google Scholar] [CrossRef]
  8. Liu, Z.; Fan, C.L.; Ming, C.L.; Chen, C.; Liu, A.; Yang, C.L. Gas metal arc welding of high nitrogen stainless steel with Ar-N-2-O-2 ternary shielding gas. Def. Technol. 2021, 17, 923–931. [Google Scholar] [CrossRef]
  9. Liu, Z.; Fan, C.L.; Ming, Z.; Chen, C.; Yang, C.L.; Lin, S.B. Optimization of shielding gas composition in high nitrogen stainless steel gas metal arc welding. J. Manuf. Process. 2020, 58, 19–29. [Google Scholar] [CrossRef]
  10. Liu, Z.; Fan, C.L.; Chen, C.; Ming, Z.; Yang, C.L.; Lin, S.B. Design and evaluation of nitrogen-rich welding wires for high nitrogen stainless steel. J. Mater. Process. Technol. 2021, 288, 116885. [Google Scholar] [CrossRef]
  11. Chausov, M.G.; Maruschak, P.O.; Hutsaylyuk, V.; Śnieżek, L.; Pylypenko, A.P. Effect of complex combined loading mode on the fracture toughness of titanium alloys. Vacuum 2018, 147, 51–57. [Google Scholar] [CrossRef]
  12. Li, B.W.; Lei, Z.L.; Zhang, X.R.; Chen, Y.B.; Chen, X. Effect of mixed powder proportion on microstructure and defects of high-nitrogen steel welded joints. Opt. Laser Technol. 2023, 163, 109430. [Google Scholar] [CrossRef]
  13. Hafez, K.M. The effect of welding atmosphere on the pitting corrosion of AISI 304L resistance spot welds. Int. J. Adv. Manuf. Technol. 2018, 97, 243–251. [Google Scholar] [CrossRef]
  14. Fukumoto, S.; Matsuo, T.; Kuroda, D.; Yamamoto, A. Weldability of Nickel-Free Austenitic Stainless Steel Thin Sheet by Small-Scale Resistance Spot Welding. Mater. Trans. 2008, 49, 2844–2849. [Google Scholar] [CrossRef] [Green Version]
  15. Somervuori, M.E.; Johansson, L.S.; Heinonen, M.H.; Akdut, N.; Hanninen, H.E. Characterisation and corrosion of spot welds of austenitic stainless steels. Mater. Corros. 2004, 55, 6. [Google Scholar] [CrossRef]
  16. Woo, I.; Kikuchi, Y. Weldability of High Nitrogen Stainless Steel. ISIJ Int. 2002, 42, 1334–1343. [Google Scholar] [CrossRef] [Green Version]
  17. Konovalov, N.A.; Oshkadyorov, S.P.; Poloskov, S.I. The Ways of Improvement of the Joints’ Quality under Resistance Butt Welding with a Flash-Off. Metallofiz. Noveishie Tekhnol. 2014, 35, 1539–1549. [Google Scholar]
  18. Wang, X.; Liu, X.; Deng, J.R. Numerical simulation of end face heating in alternating current flash butt welding based on electrical-thermal bidirectional coupling. Int. J. Adv. Manuf. Technol. 2022, 120, 173–183. [Google Scholar] [CrossRef]
  19. Ma, N.S.; Cai, Z.P.; Huang, H.; Deng, D.A.; Murakawa, H.; Pan, J.L. Investigation of welding residual stress in flash-butt joint of U71Mn rail steel by numerical simulation and experiment. Mater. Des. 2015, 88, 1296–1309. [Google Scholar] [CrossRef]
  20. Goldak, J.; Bibby, M.; Moore, J. Computer modeling of heat flow in welds. Metall. Trans. B 1986, 17, 587–600. [Google Scholar] [CrossRef]
  21. Katada, Y.; Washizu, N.; Baba, H. \Localized corrosion behavior of high nitrogen steel. Mater. Sci. Forum 2005, 475, 225–228. [Google Scholar]
  22. Speidel, M.O.; Pedrazzoli, R.M. High nitrogen stainless-steels in chloride solutions. Mater. Perform. 1992, 31, 59–61. [Google Scholar]
  23. Alvarez, K.; Hyun, S.K.; Tsuchiya, H.; Fujimoto, S.; Nakajima, H. Corrosion behaviour of Lotus-type porous high nitrogen nickel-free stainless steels. Corros. Sci. 2008, 50, 183–193. [Google Scholar] [CrossRef]
  24. Klyuev, A.L.; Davydov, A.D.; Grafov, B.M.; Dobrovolskii, Y.A.; Ukshe, A.E. Electrochemical noise spectroscopy: Method of secondary Chebyshev spectrum. Russ. J. Electrochem. 2016, 52, 1001–1005. [Google Scholar] [CrossRef]
  25. Stakenborghs, R.J.; Goitia, R.M. Detection and characterization of corrosion under coatings. In Proceedings of the ASME Pressure Vessels and Piping Conference, Anaheim, CA, USA, 20–24 July 2014; p. 5. [Google Scholar]
  26. Braasch, D.A.; Gillis, M.; Pramanik, M.; Ferguson, R.C.; Delatte, D.; Blanton, M.; Rawlins, J.W. Detection of in Situ Early Corrosion on Polymer-Coated Metal Substrates. ACS Appl. Mater. Interfaces 2019, 11, 37193–37208. [Google Scholar] [CrossRef]
Figure 1. Metallographic structure of the base material.
Metals 13 01200 g001
Figure 2. (a) Electrode; (b) Electrode 3D design drawing.
Metals 13 01200 g002
Figure 3. Schematic diagram of microhardness test.
Metals 13 01200 g003
Figure 4. Diagram of tensile specimen size.
Metals 13 01200 g004
Figure 5. Mesh division of the geometric model.
Metals 13 01200 g005
Figure 6. Temperature distribution inside the connector.
Metals 13 01200 g006
Figure 7. Equilibrium phase diagram and phase element composition of high nitrogen steel. (a) phase diagram; (b) element composition of M2 (C, N); (c) element composition of Sigma; (d) element composition of laves.
Metals 13 01200 g007
Figure 8. Distribution diagram of flash-butt weld.
Metals 13 01200 g008
Figure 9. The microstructure of the joint interface area obtained when the cam angle is 100°, the top forging is 0.4 MPa, and the thyristor angle is 45°. (a) Macrojoint; (b) IZ; (c) OZ; (d) HAZ.
Metals 13 01200 g009
Figure 10. Microstructure of the interface area at different thyristor angles: (a) 25°; (b) 35°; (c) 45°; (d) 55°.
Metals 13 01200 g010
Figure 11. Simulation results: (a) Joint temperature distribution diagram at the flash stage; (b) Temperature distribution inside the connector.
Metals 13 01200 g011
Figure 12. Point strain distribution diagram at the top forging stage.
Metals 13 01200 g012
Figure 13. Temperature distribution in different areas of joints.
Metals 13 01200 g013
Figure 14. Microhardness distribution of joints.
Metals 13 01200 g014
Figure 15. Tensile strength of joints at different thyristor angles.
Metals 13 01200 g015
Figure 16. Tensile fracture morphology with typical parameters: (a) Macroscopic fracture; (b,c) The local topography.
Metals 13 01200 g016
Figure 17. EDS point scan at the arrow in Figure 16c.
Metals 13 01200 g017
Figure 18. Corrosion morphology of high nitrogen steel joint in 10% H2SO4 solution for 10 min. (a) Weld corrosion morphology; (b,d) Enlarged area; (c) Corrosion morphology of BM.
Metals 13 01200 g018
Figure 19. Corrosion morphology of high nitrogen steel joint after 1 h of etching in 10% H2SO4 solution. (a) IZ; (b) OZ; (c) HAZ; (d) BM.
Metals 13 01200 g019
Figure 20. Electrochemical noise monitoring of high nitrogen steel joints: (a) Electrochemical potential noise time spectra; (b) Frequency domain noise potential map.
Metals 13 01200 g020
Table 1. Chemical composition of high nitrogen steel (mass fraction %).
CCrMnNMoPSSiNb
0.0221.116.80.832.34≤0.012≤0.050.480.14
Table 2. Main parameters used in the FBW process.
No.Thyristor AngleCAM AngleForging Force
125°100°0.4 Mpa
235°100°0.4 Mpa
345°100°0.4 Mpa
455°100°0.4 Mpa
Table 3. Thermal physical property parameters of high nitrogen steel.
Temperature/°CThermal Conductivity/[W/(m·°C)]Specific Heat/[J/(kg·°C)]
2014.1450
20016.4520
40018.9560
80021.5610
100027.2640
140033.6700
Disclaimer/Publisher’s Note: The statements, opinions and data contained in all publications are solely those of the individual author(s) and contributor(s) and not of MDPI and/or the editor(s). MDPI and/or the editor(s) disclaim responsibility for any injury to people or property resulting from any ideas, methods, instructions or products referred to in the content.

