
Ni-Fe Alloy Coatings Prepared via Jet Electrodeposition for the Optimization of the Electrochemical Detection Performance of Laser-Induced Graphene for Pb(II)

Abstract
:1. Introduction
2. Materials and Methods
2.1. Materials
2.2. Experiments
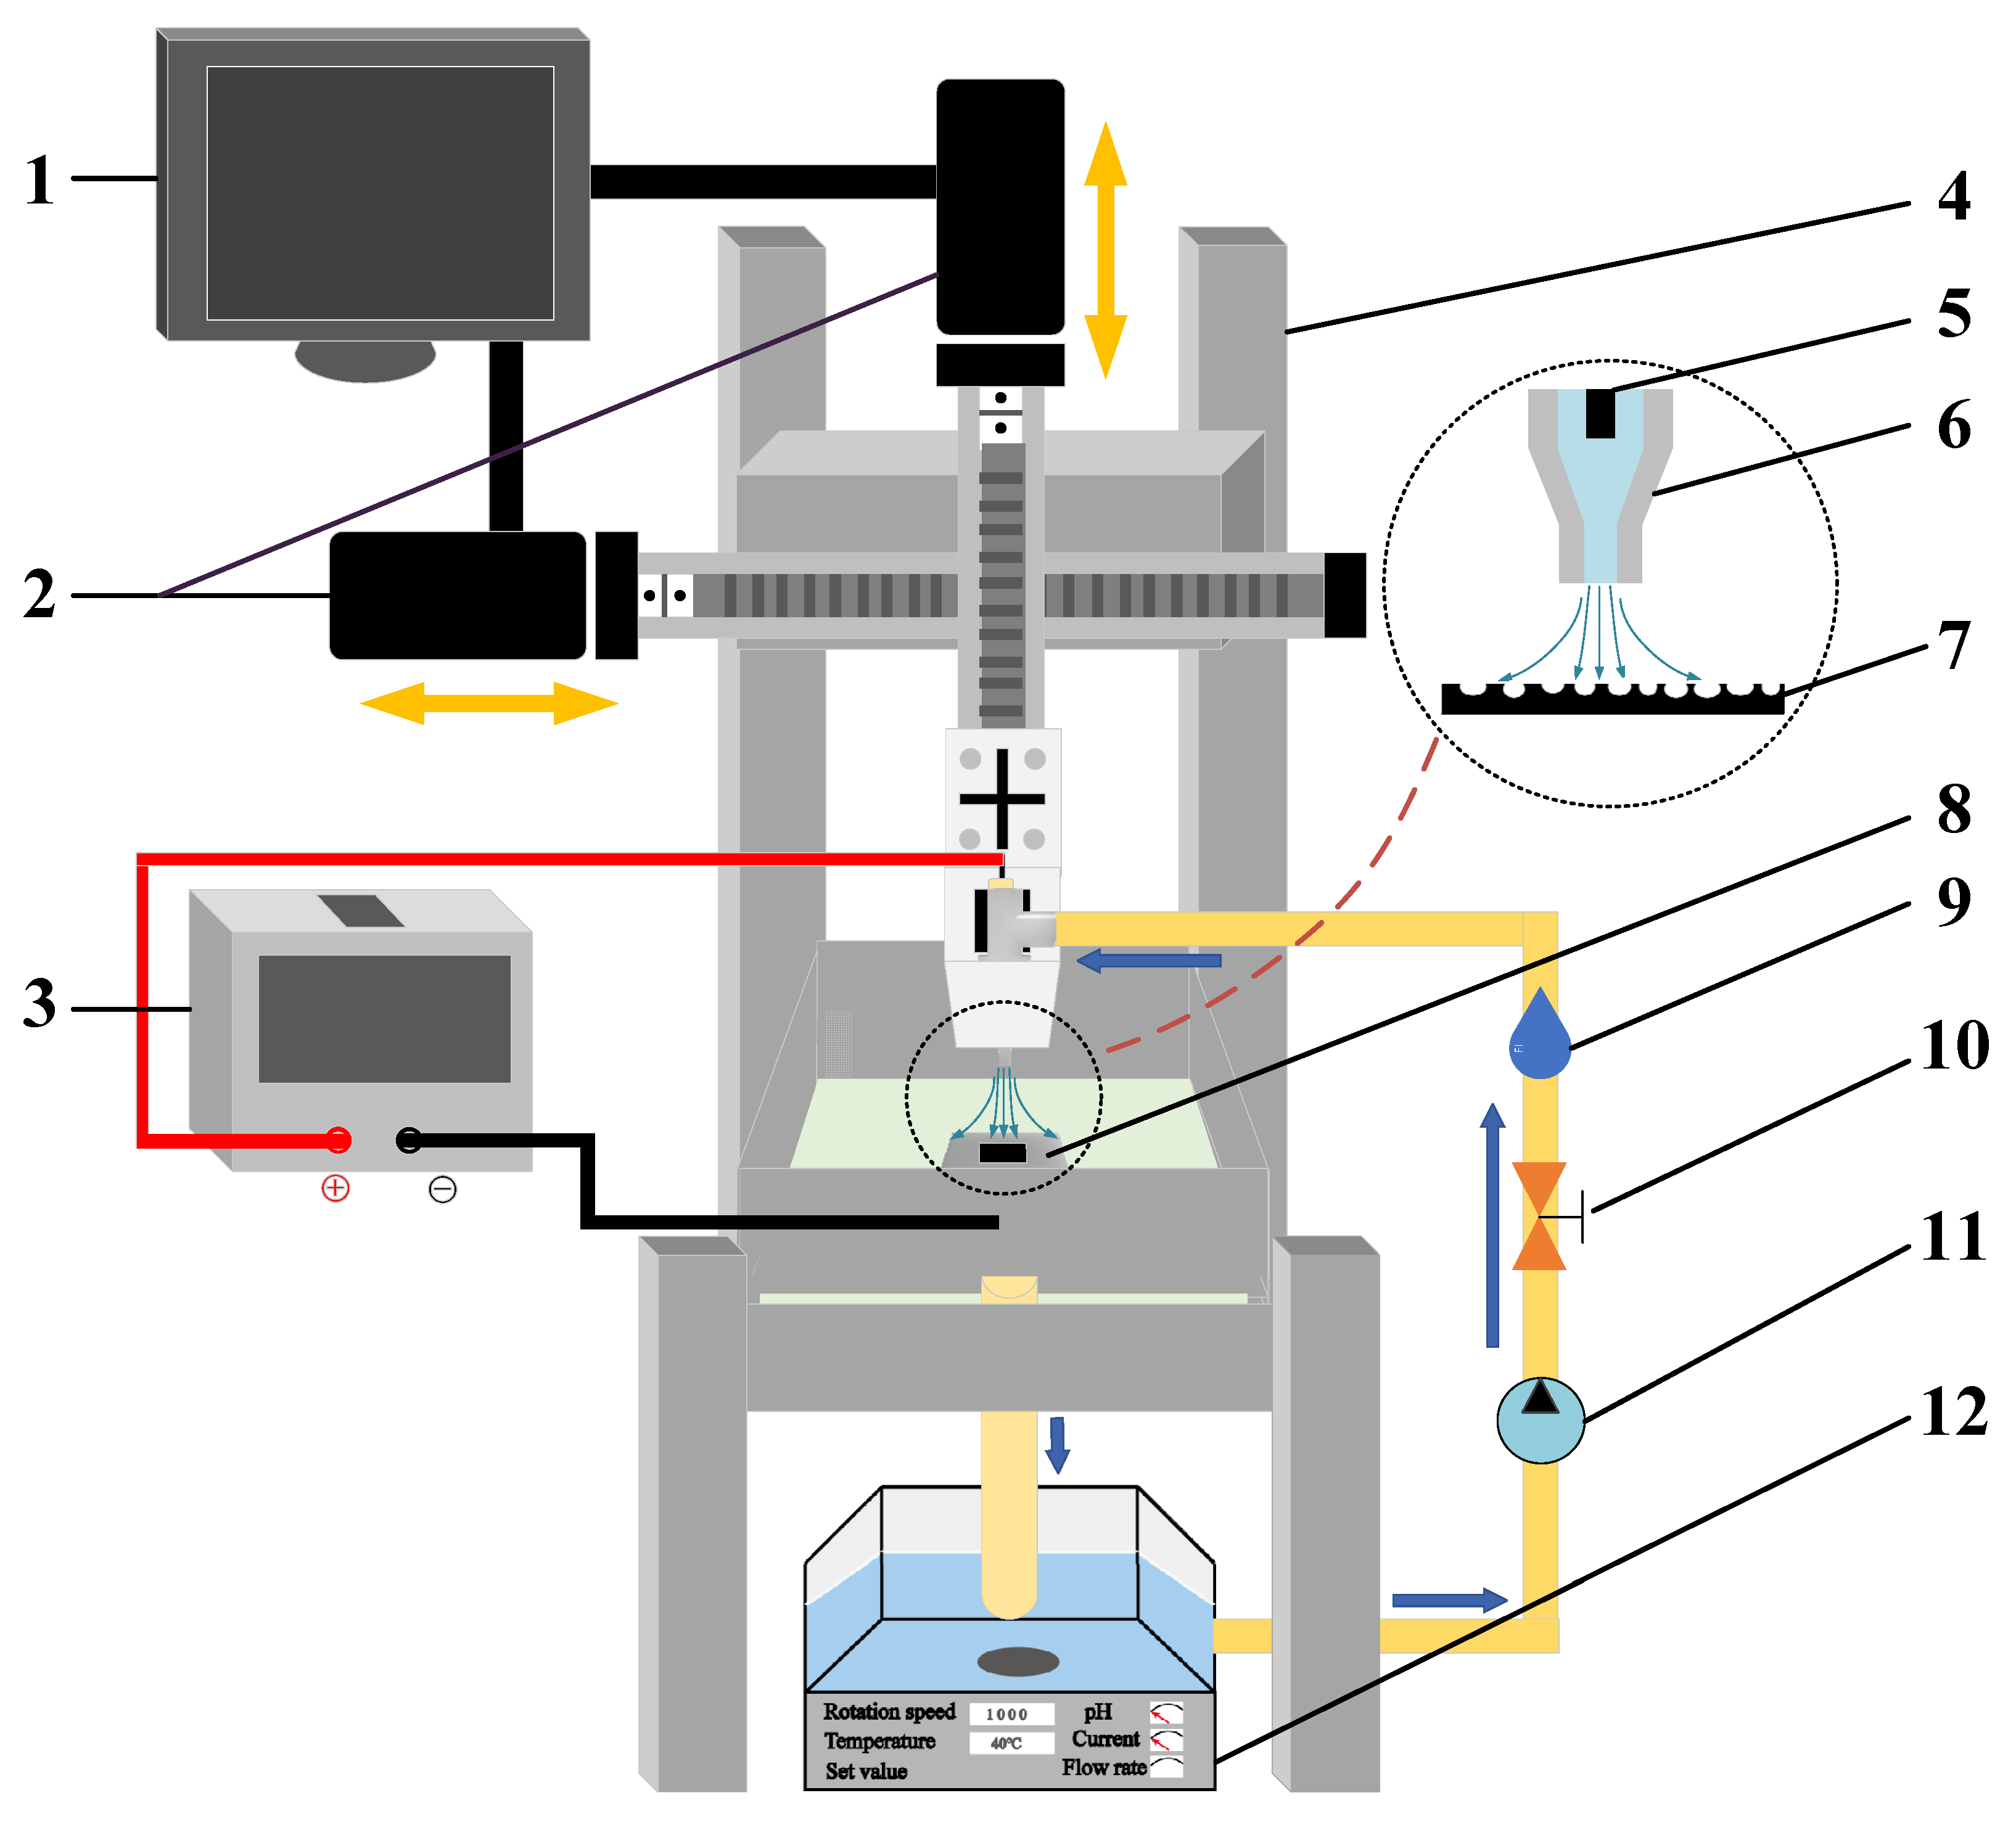
2.3. Instruments
3. Results and Discussion
3.1. Qualitative Analysis of LIG and Ni-Fe/LIG
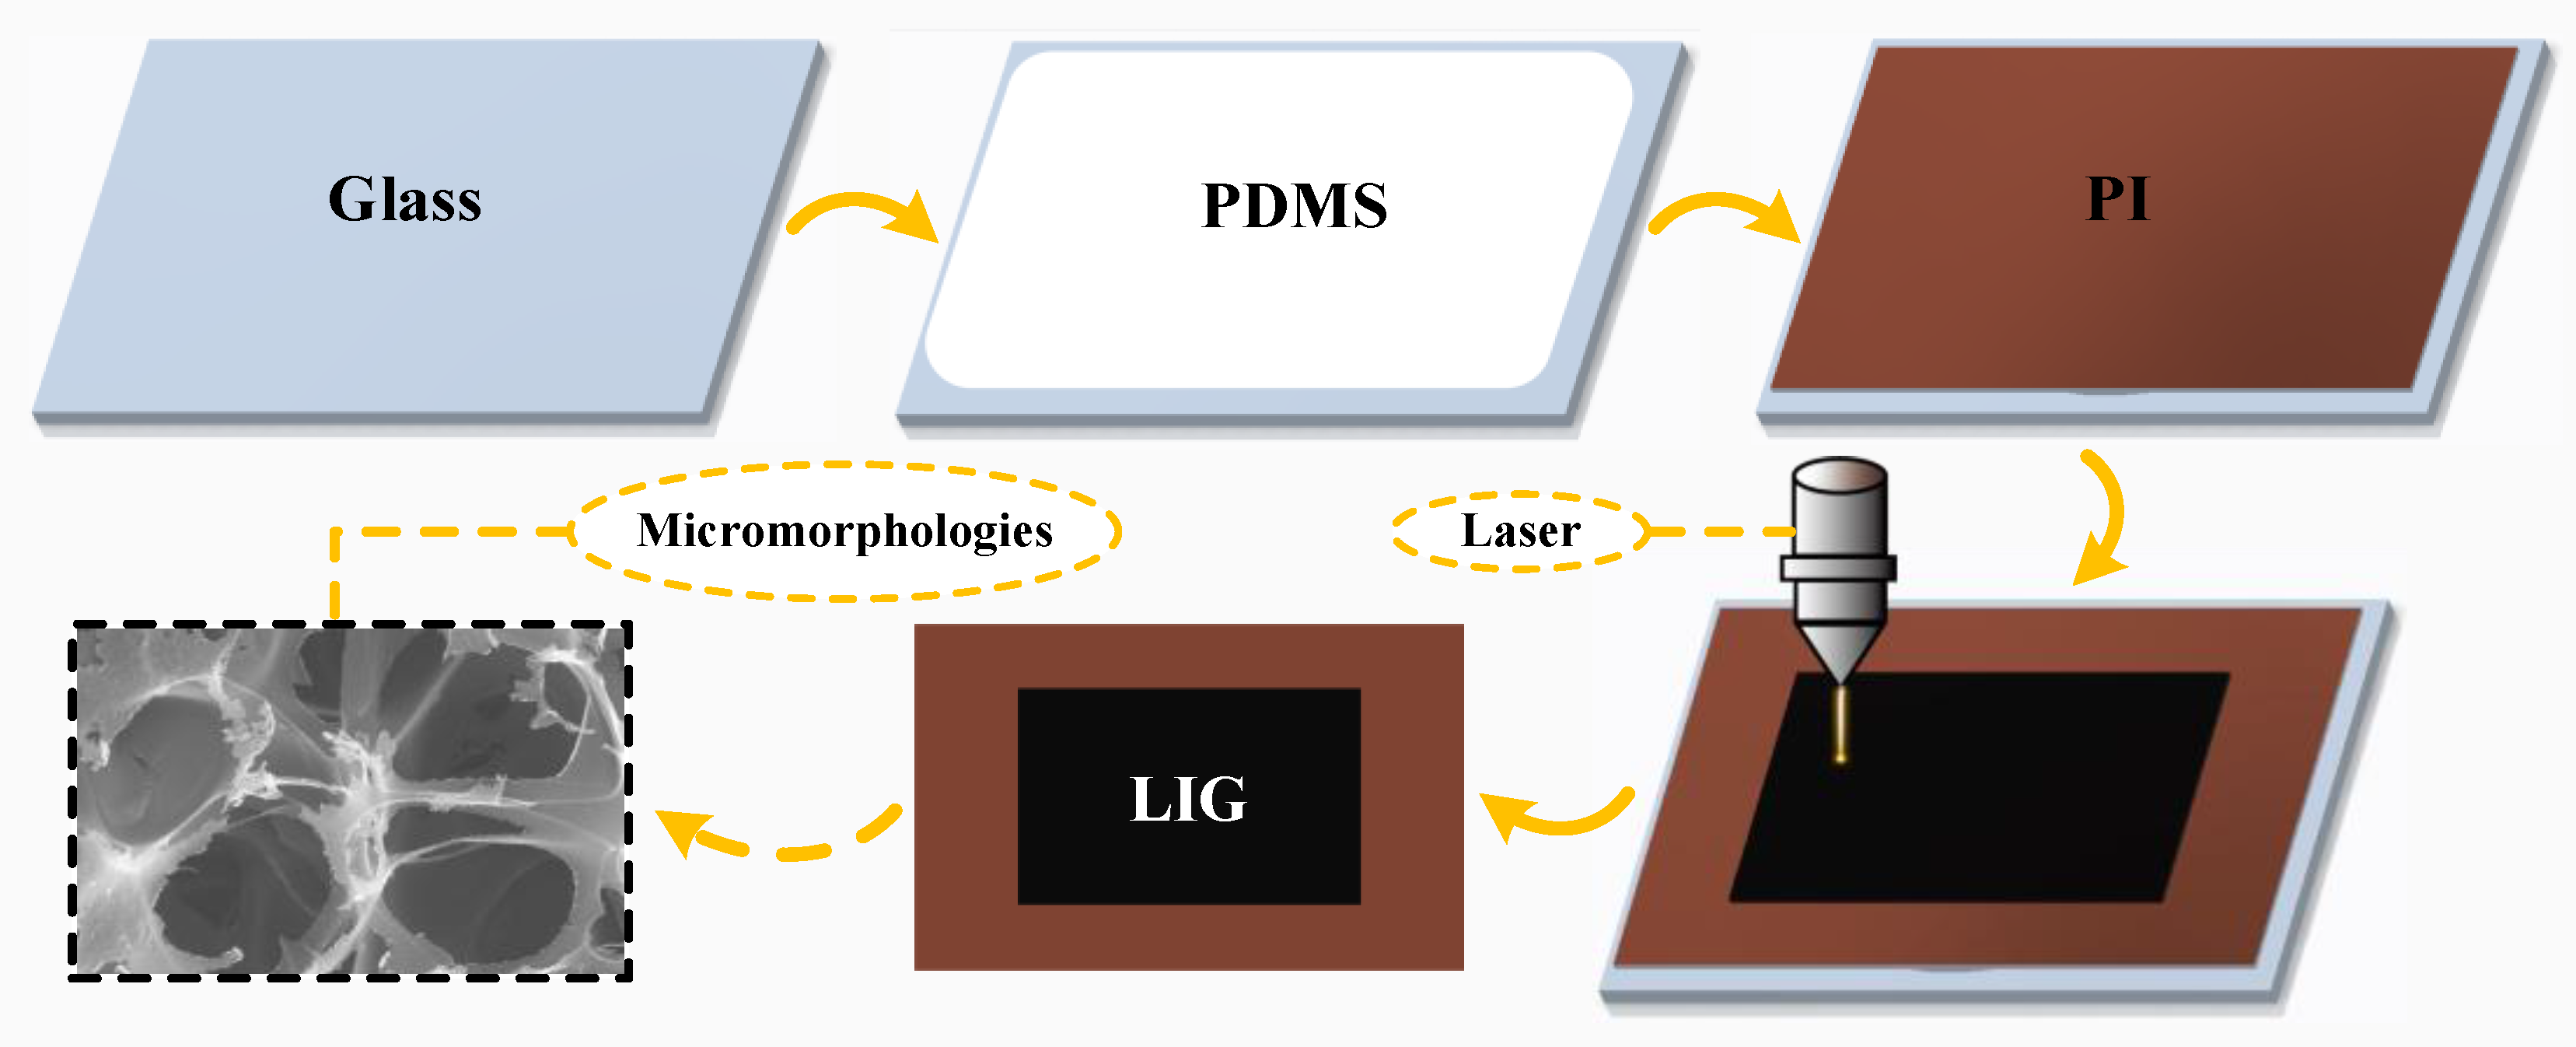
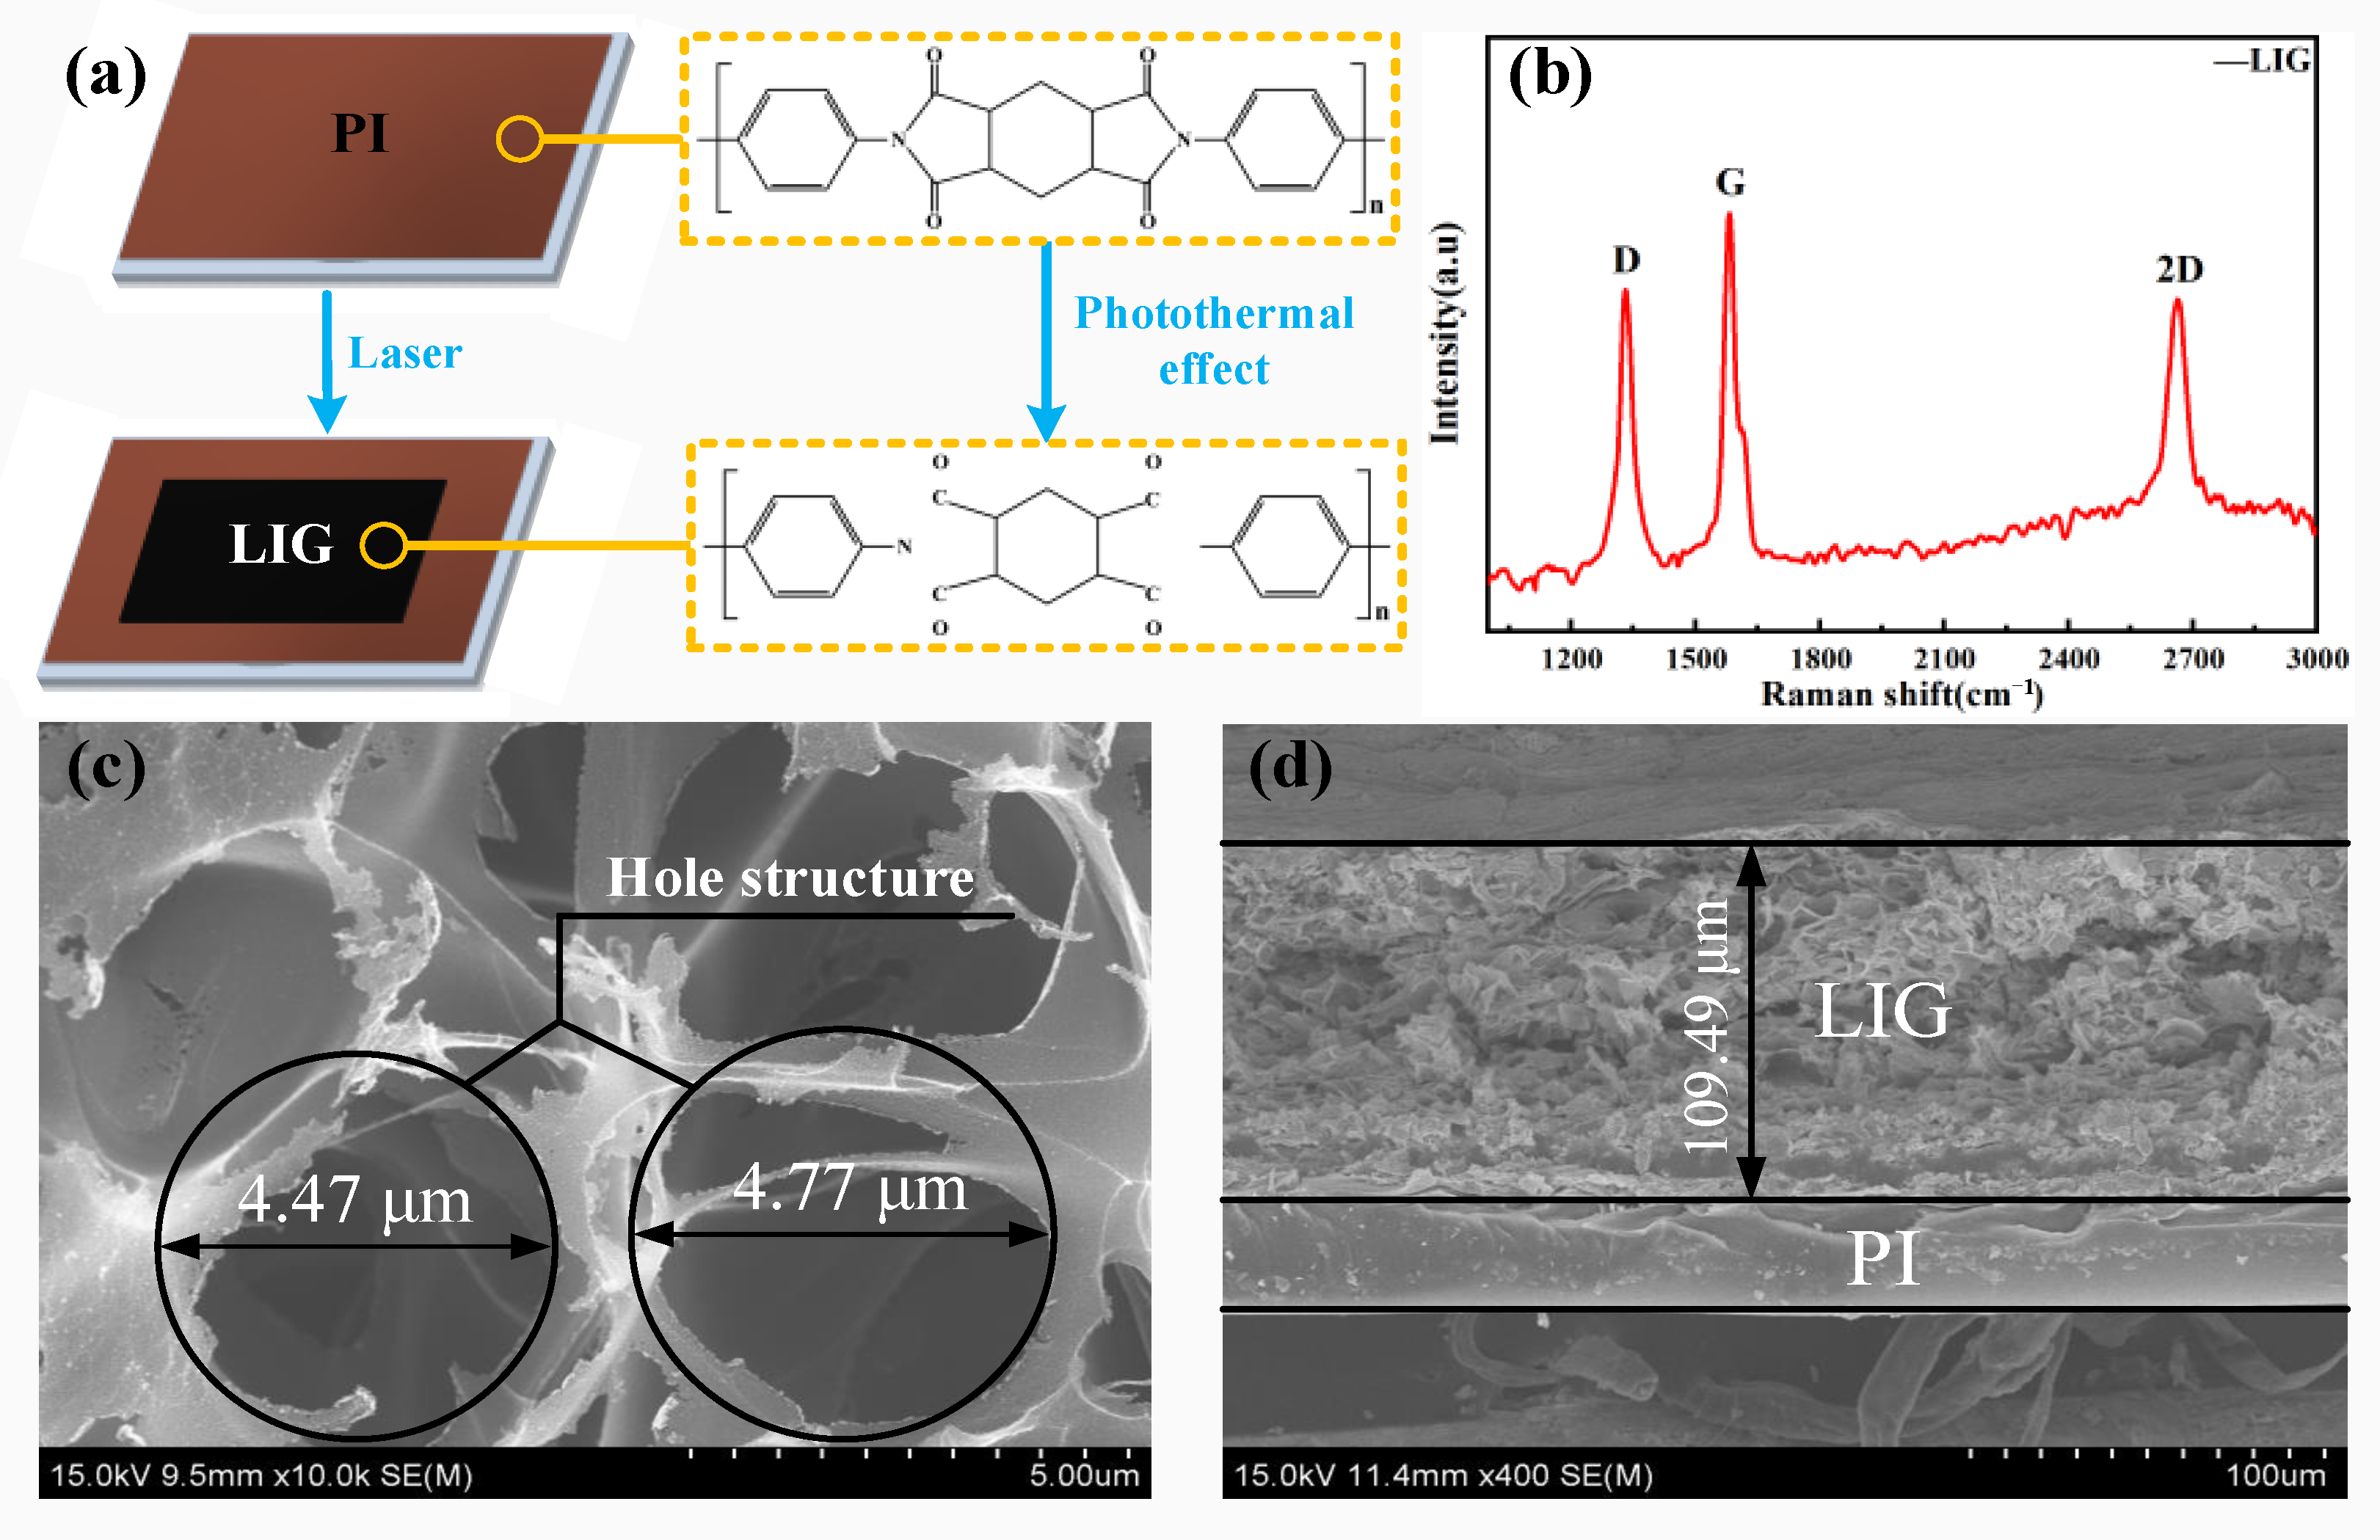
3.1.1. Qualitative Analysis of LIG
3.1.2. Qualitative Analysis of Ni-Fe/LIG
3.2. Analysis of the Surface Micromorphology of LIG and Ni-Fe/LIG
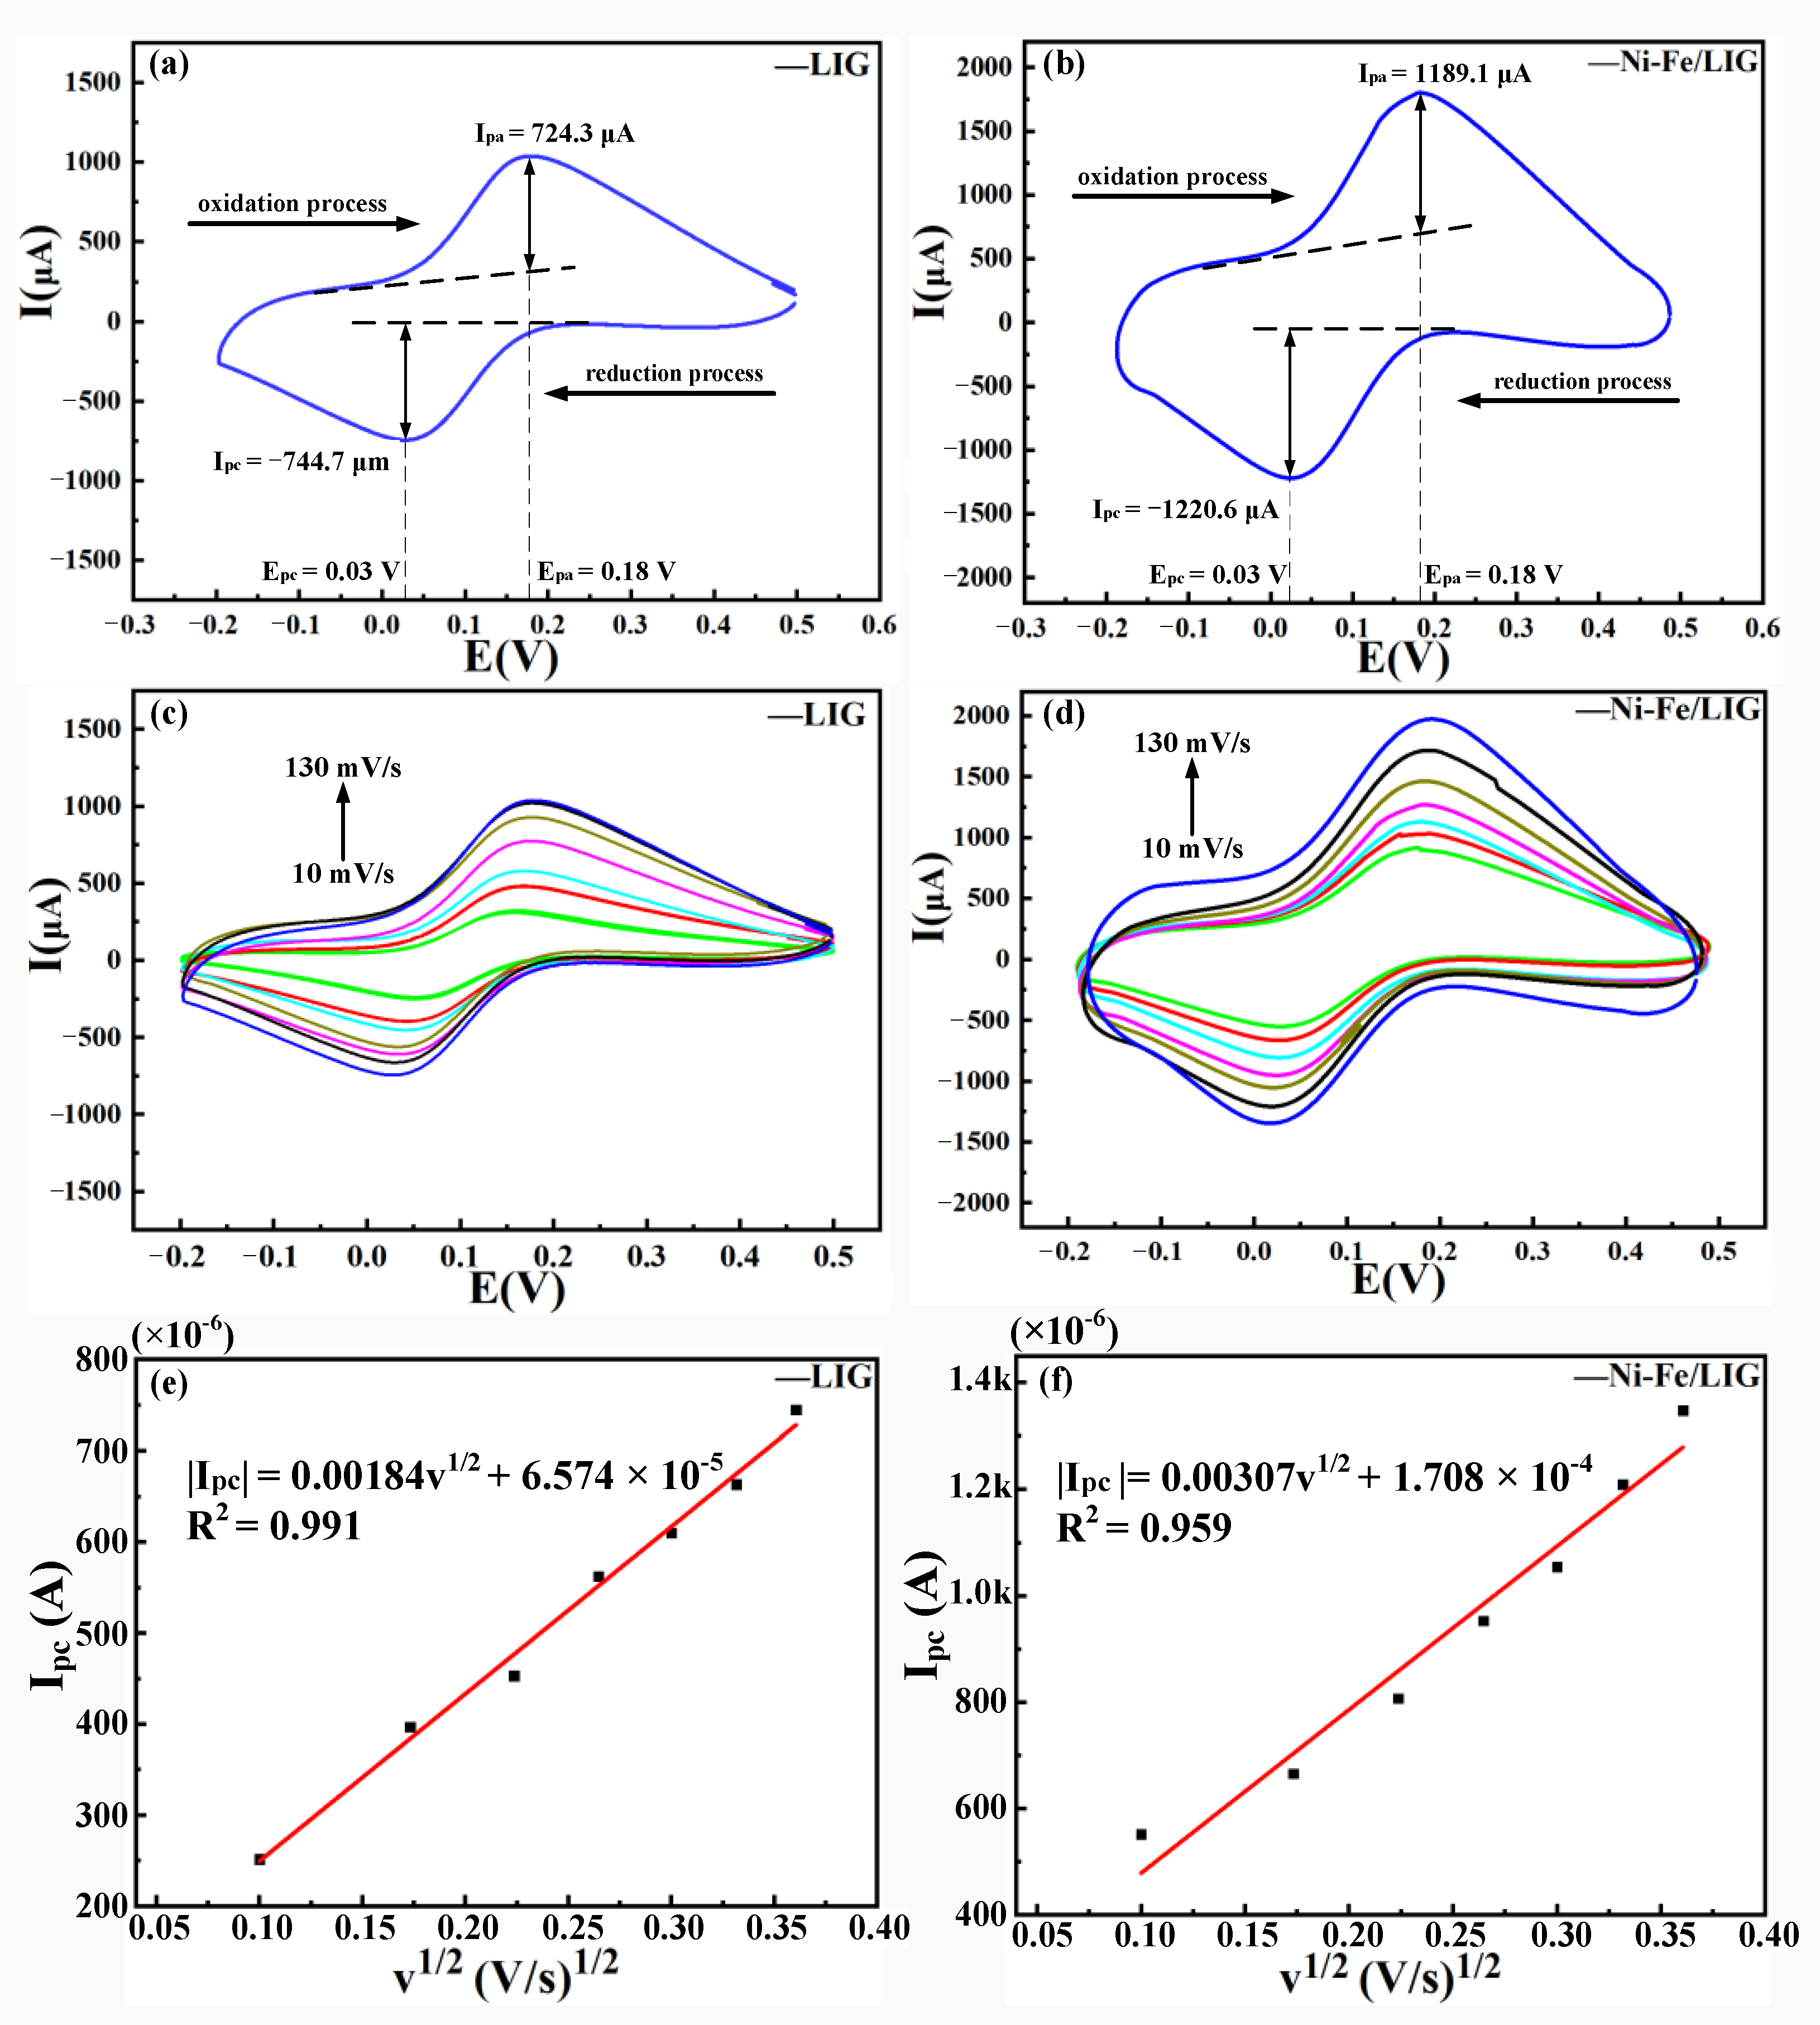
3.3. Analysis of the Charge Transfer Capabilities and Electrochemically Active Surface Areas of Lig and Ni-Fe/Lig
3.4. Analysis of the Detection Ranges and LOD of Pb (II) by LIG and Ni-Fe /LIG
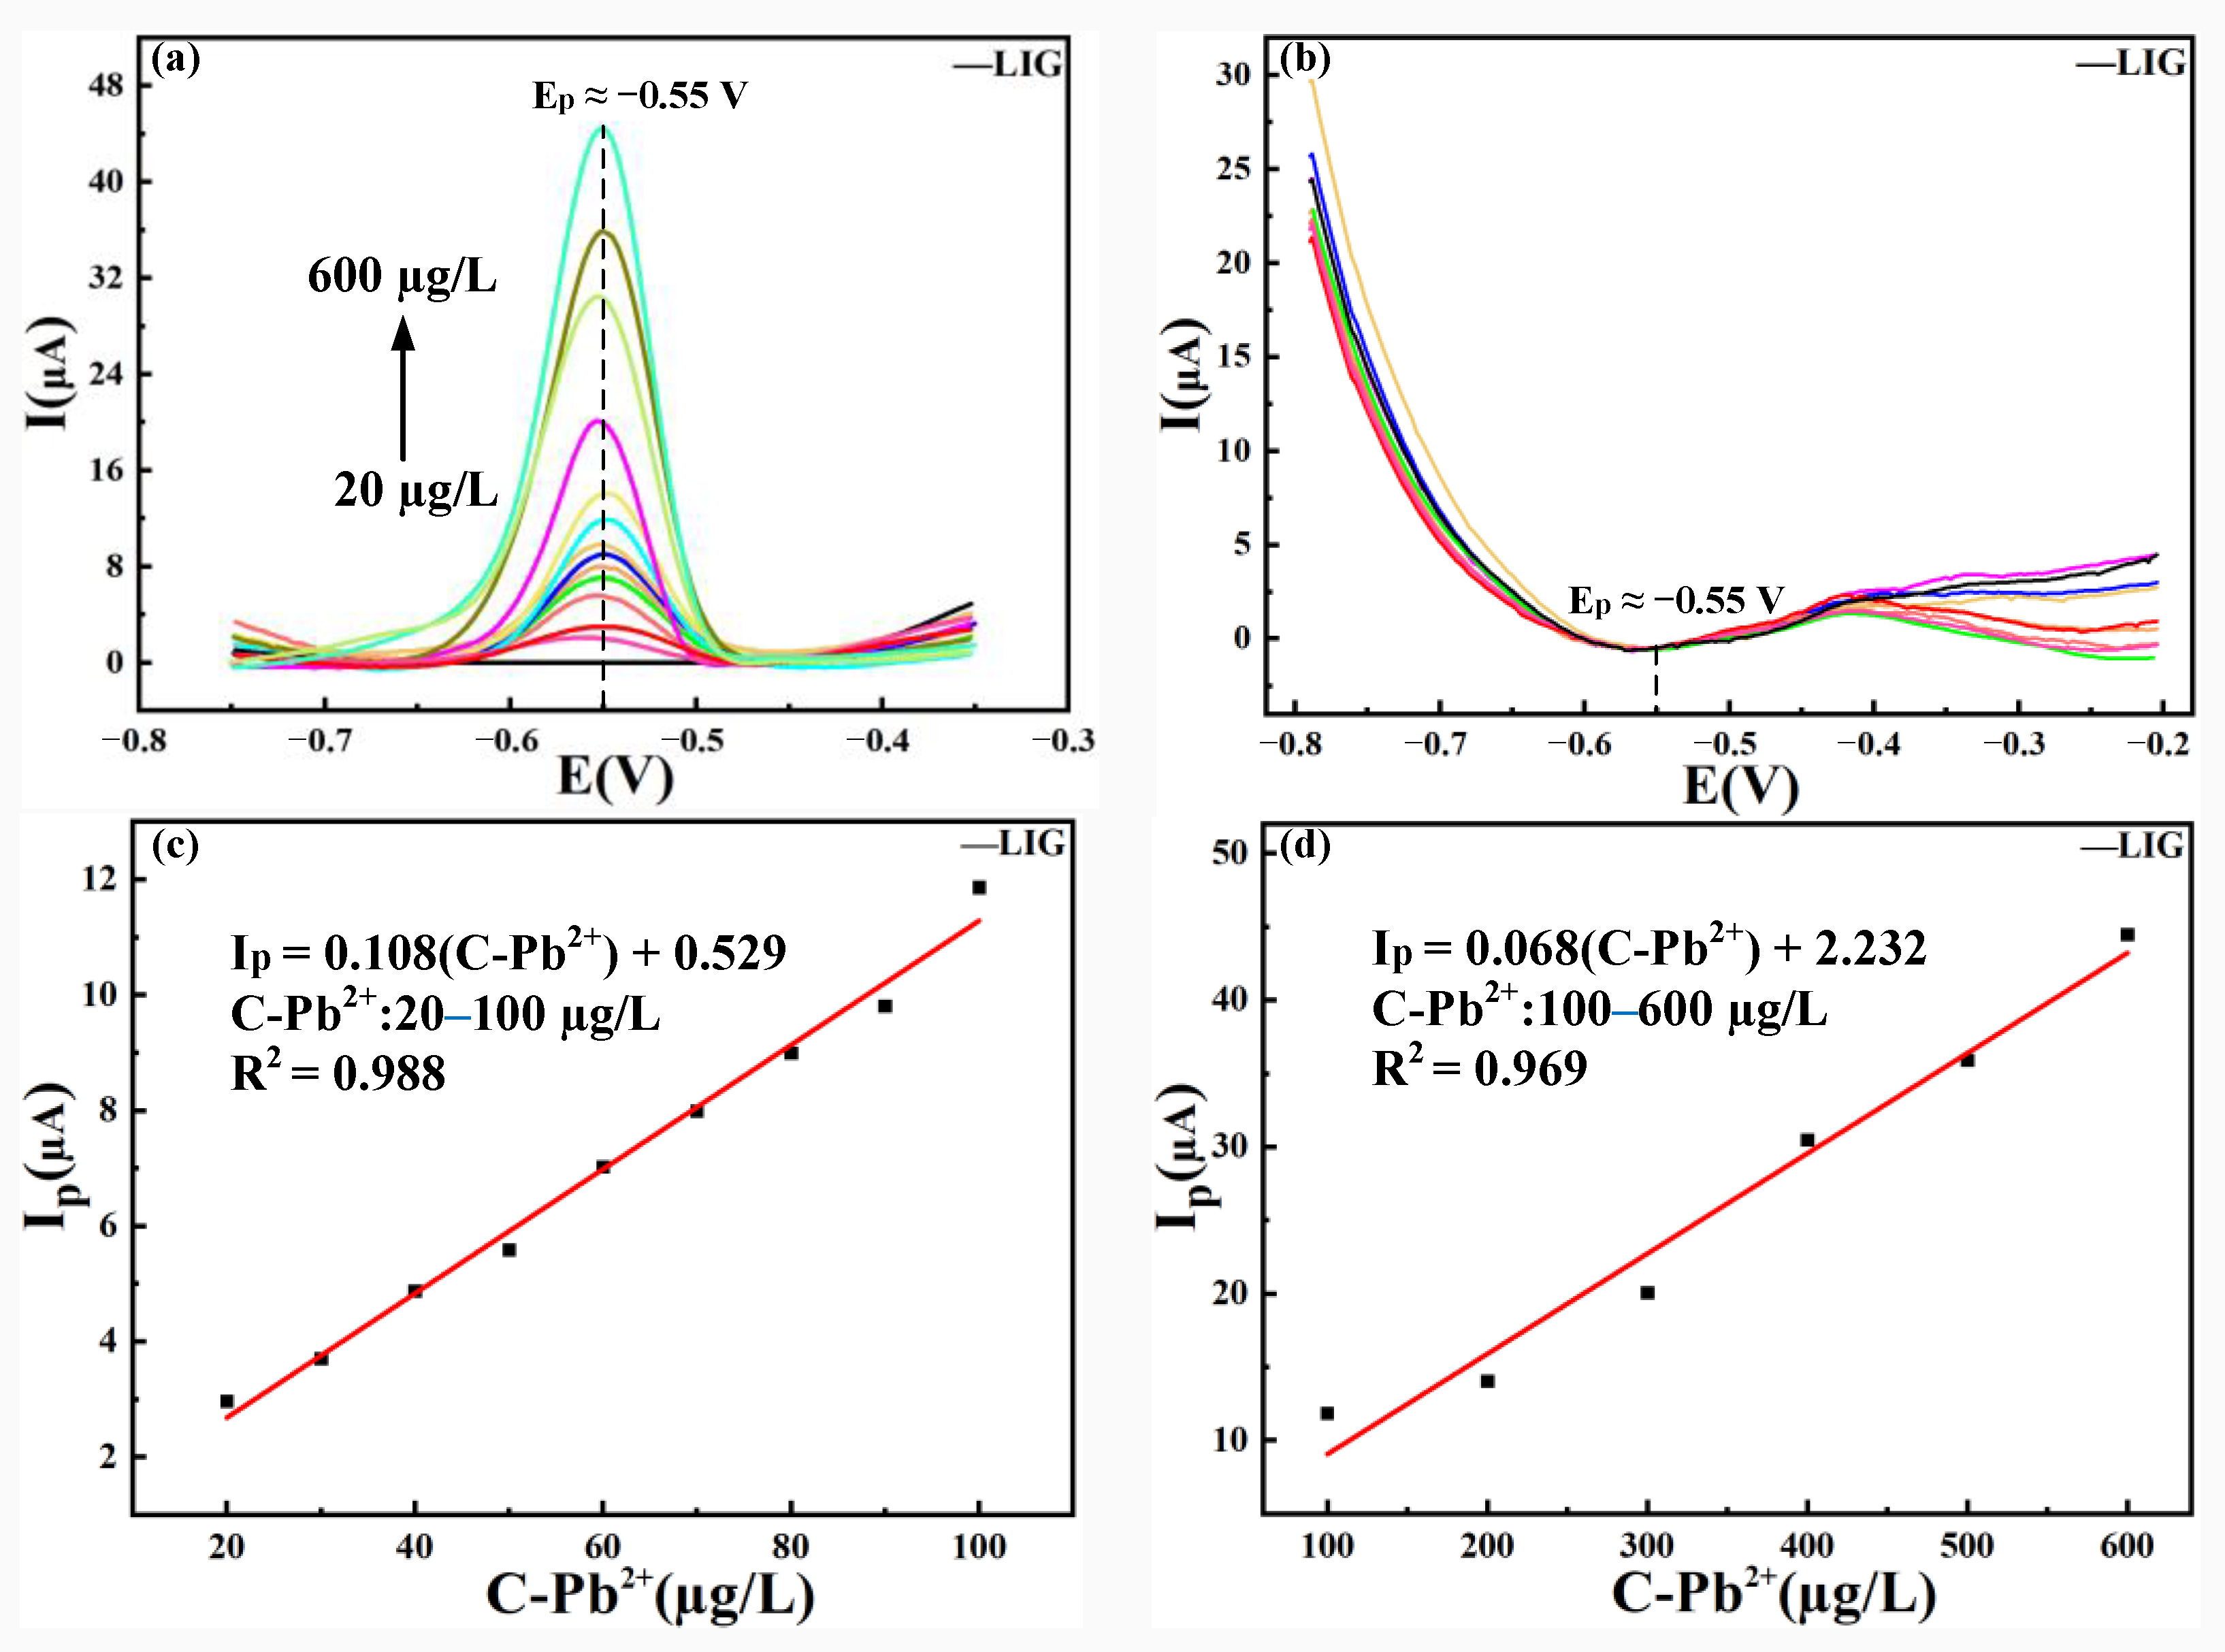
3.4.1. Analysis of the Detection Range and LOD of Pb(II) by LIG
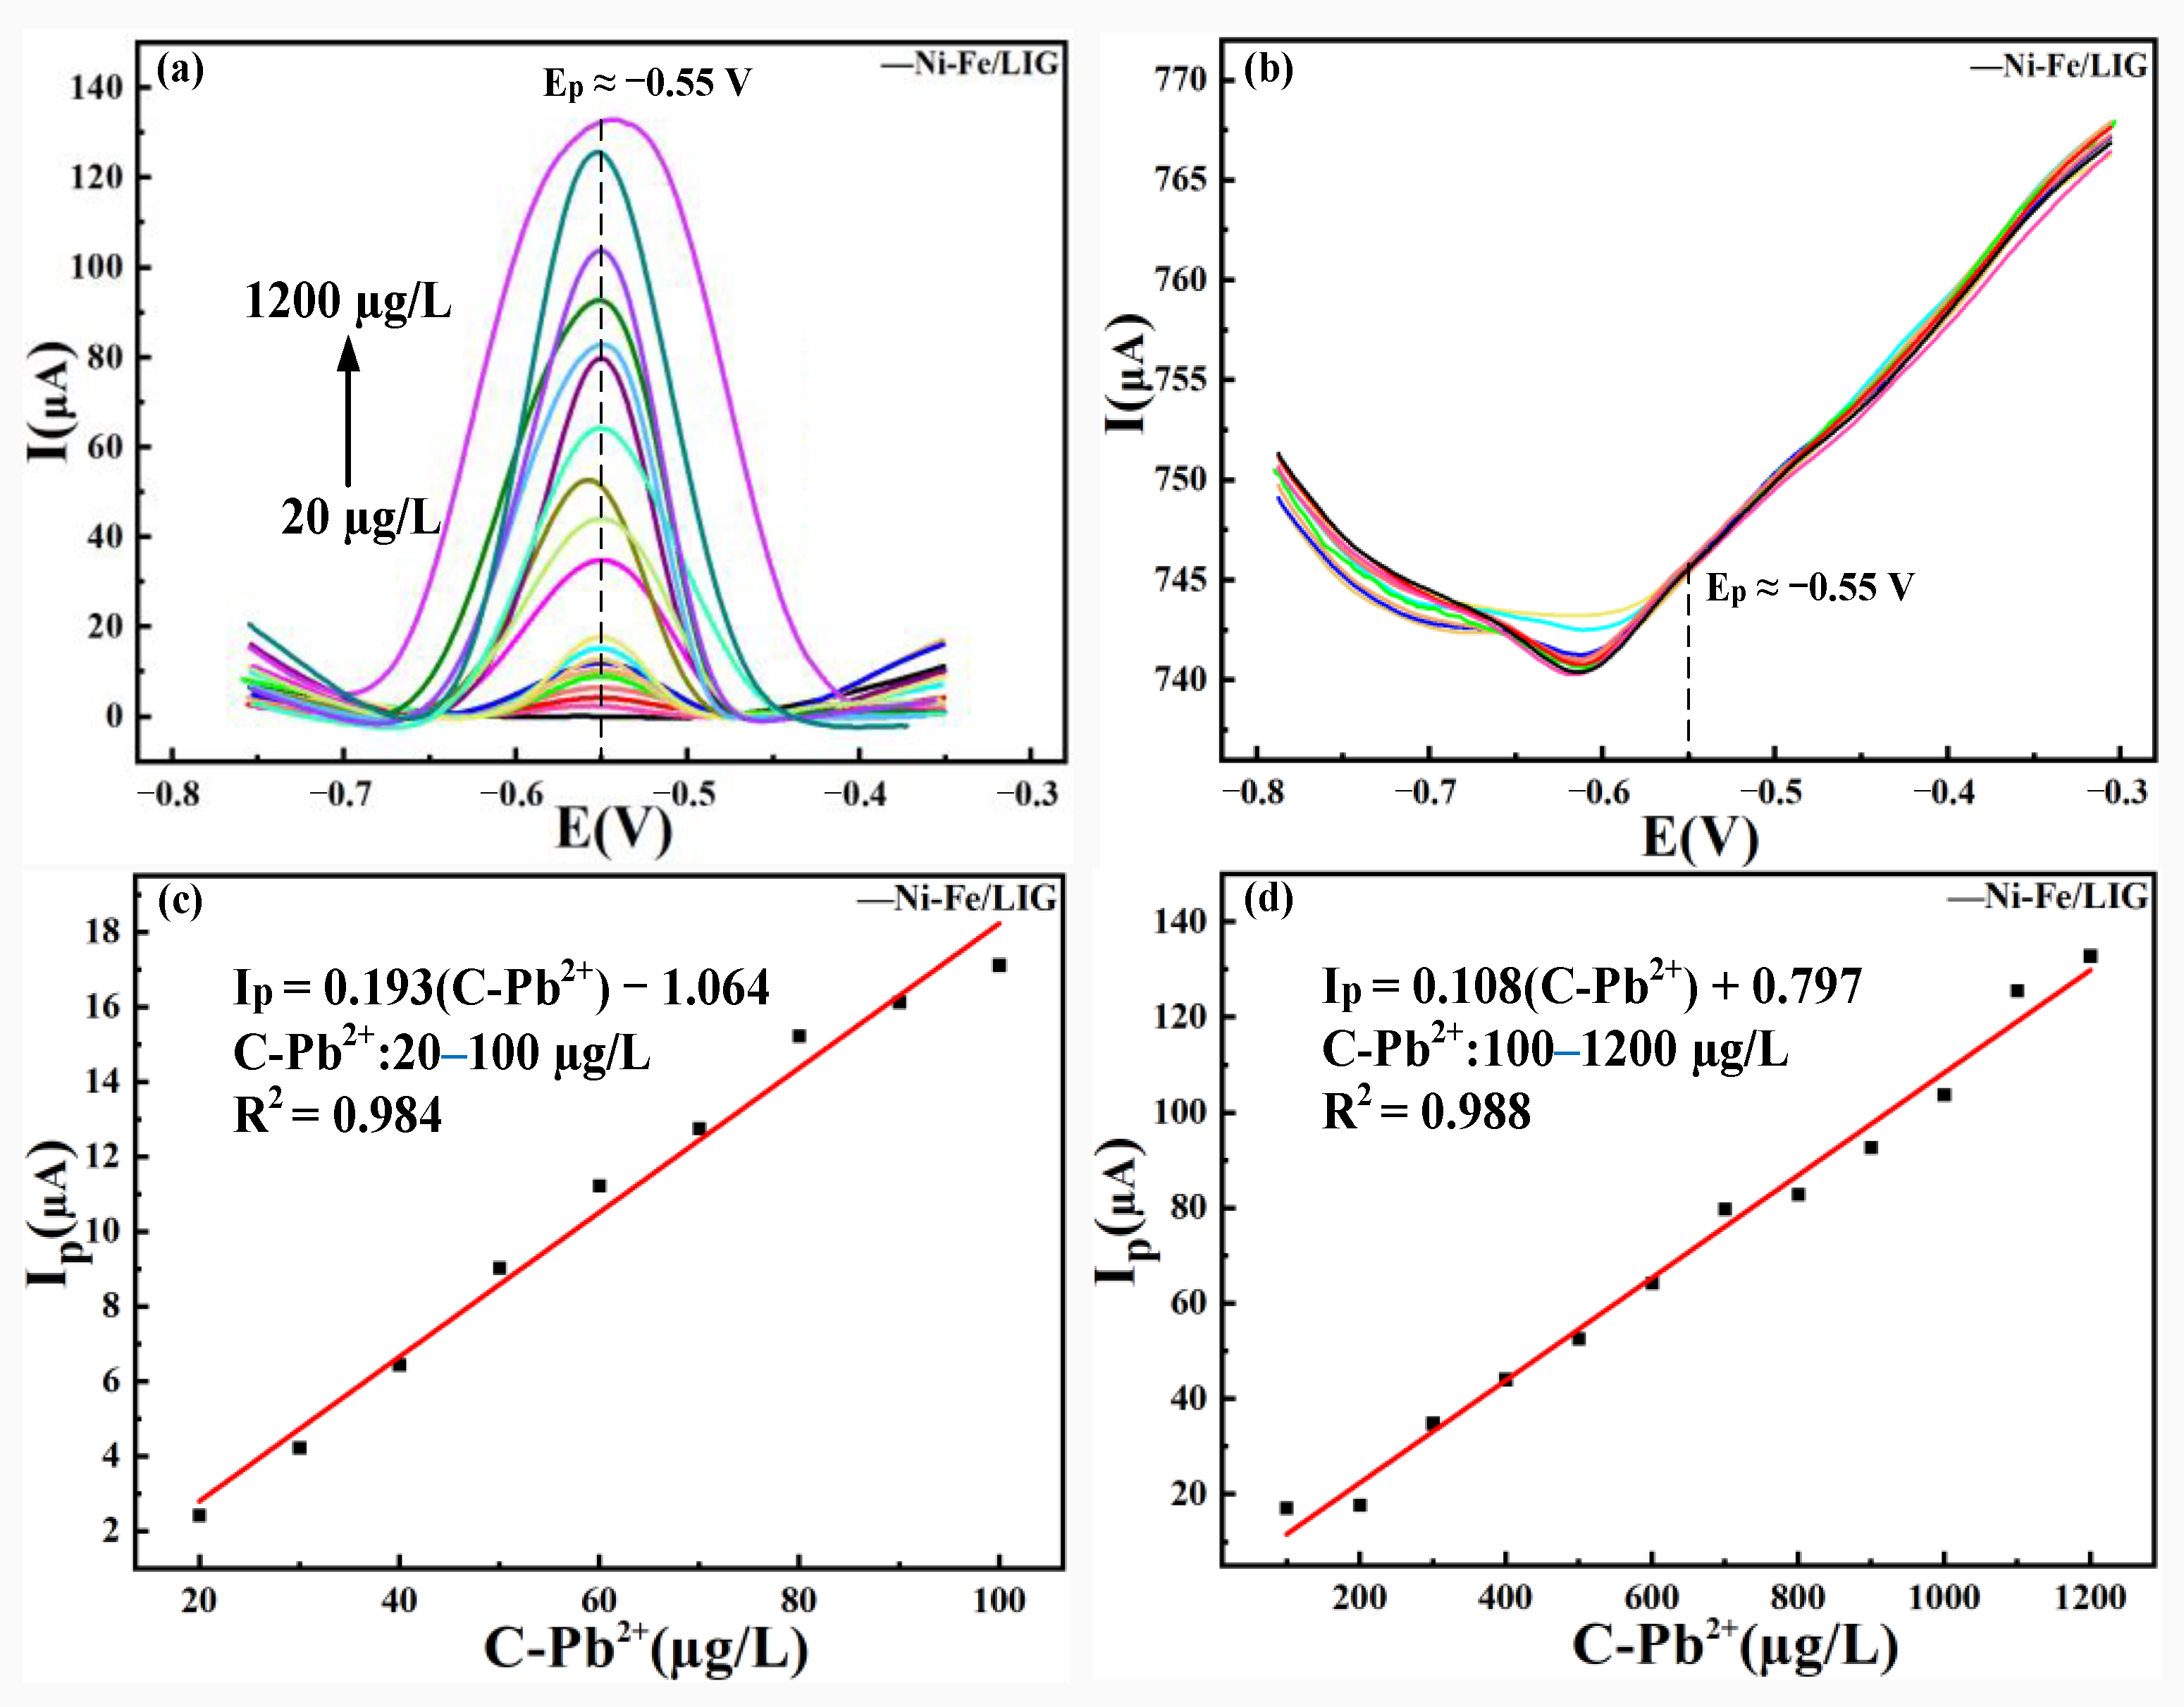
3.4.2. Analysis of the Detection Range and LOD of Pb(II) by Ni-Fe /LIG
4. Conclusions
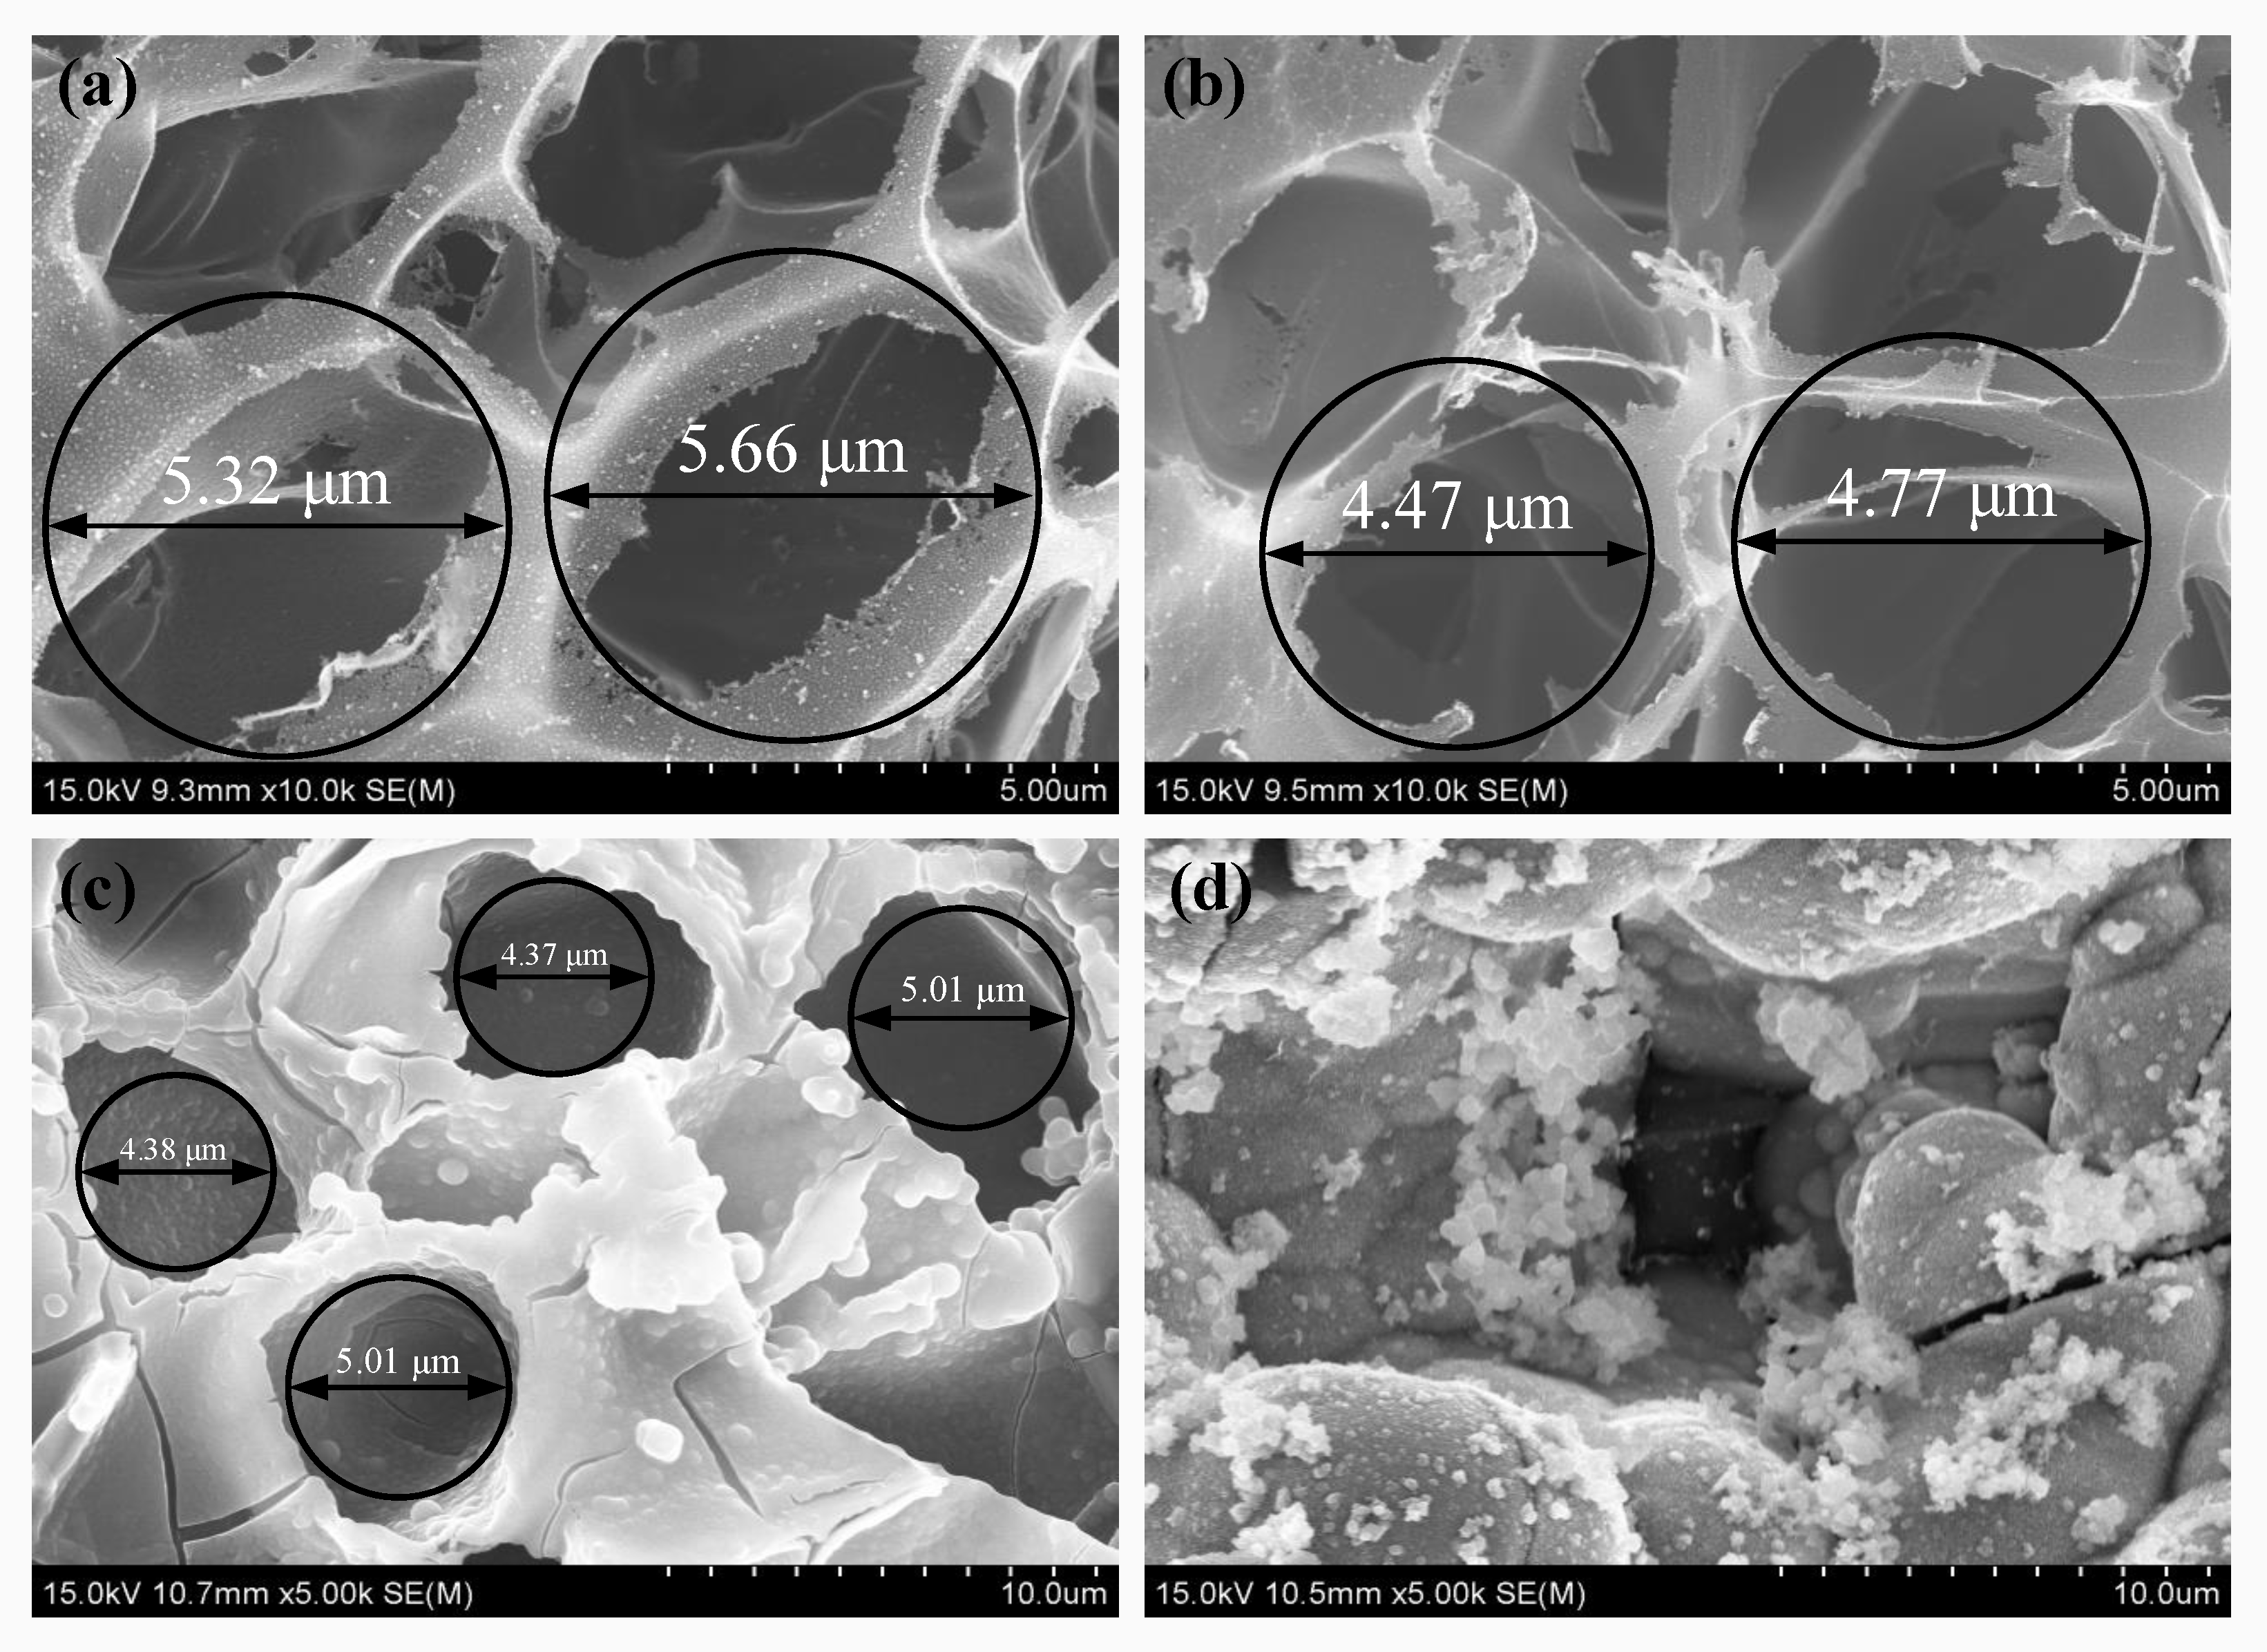
- Ni-Fe/LIG had more surface active sites than LIG. Ni-Fe alloy was fully deposited on the surfaces of LIG’s internal hole walls, and the surface active sites increased to retain the original three-dimensional porous network structure of LIG. This effect was beneficial for improving the detection range of Ni-Fe/LIG as an electrochemical sensor.
- Ni-Fe/LIG had a higher charge transfer capability and larger electrochemically active surface area than LIG. The charge transfer capability of Ni-Fe/LIG was higher than that of LIG, and the electrochemically active surface area of Ni-Fe/LIG reached 0.828 cm2. This characteristic was beneficial for improving the detection efficiency and detection performance of Ni-Fe/LIG as an electrochemical sensor.
- Ni-Fe/LIG had a wider detection range and lower LOD than LIG when used as an electrochemical sensor. Ni-Fe/LIG had the detection range of 20–1200 µg/L and a LOD of as low as 0.771 µg/L. The preparation of Ni-Fe alloy coatings optimized the detection range and LOD of LIG successfully. Therefore, Ni-Fe/LIG had a better electrochemical detection performance than LIG.
Author Contributions
Funding
Data Availability Statement
Conflicts of Interest
References
- Zirlianngura; Tiwari, D.; Ha, J.H.; Lee, S.M. Efficient Use of Porous Hybrid Materials in a Selective Detection of Lead(II) from Aqueous Solutions: An Electrochemical Study. Metals 2017, 7, 124. [Google Scholar] [CrossRef] [Green Version]
- Yu, T.; Jiang, T.Y.; Liu, X.; Ma, X.D.; Yang, Z.F.; Hou, Q.Y.; Xia, X.Q.; Li, F.Y. Research progress in current status of soil heavy metal pollution and analysis technology. Geol. China 2021, 48, 460–476. [Google Scholar]
- Boskabady, M.; Marefati, N.; Farkhondeh, T.; Shakeri, F.; Farshbaf, A.; Boskabady, M.H. The effect of environmental lead exposure on human health and the contribution of inflammatory mechanisms, a review. Environ. Int. 2018, 120, 404–420. [Google Scholar] [CrossRef] [PubMed]
- Du, C.; Liu, B.; Hu, J.; Li, H.L. Determination of iodine number of activated carbon by the method of ultraviolet–visible spectroscopy. Mater. Lett. 2021, 285, 129137. [Google Scholar] [CrossRef]
- Viktorija, T.; Jaunius, U.; Dalius, R. A direct electron transfer formaldehyde dehydrogenase biosensor for the determination of formaldehyde in river water. Talanta 2021, 234, 122657. [Google Scholar]
- Zhao, K.; Ge, L.Y.; Wong, T.I.; Zhou, X.D.; Grzegorz, L. Gold-silver nanoparticles modified electrochemical sensor array for simultaneous determination of chromium(III)and chromium(VI)in wastewater samples. Chemosphere 2021, 281, 130880. [Google Scholar] [CrossRef] [PubMed]
- Li, X.; Zou, N.; Wang, Z.X.; Shangguan, W.; Ma, Z.H.; Wang, X.L. Stripping voltammetry detection of Pb2+ using poly(amino benzenesulfonic acid)-MoS2 nanosheets composite membrane modified glassy carbon electrode. Chin. J. Anal. Lab. 2020, 39, 1075–1079. [Google Scholar]
- Hernandez, P.R.; Galan, C.A.; Morales, A.; Alegret, S. Measuring system for amperometric chemical sensors using the three-electrode technique for field application. J. Appl. Res. Eng. Technol. 2003, 1, 107–113. [Google Scholar] [CrossRef]
- Yin, H.S.; Zhou, Y.L.; Ma, Q.; Ai, S.Y.; Chen, Q.P.; Zhu, L.S. Electrocatalytic oxidation behavior of guanosine at graphene, chitosan and Fe3O4 nanoparticles modified glassy carbon electrode and its determination. Talanta 2010, 82, 1193–1199. [Google Scholar] [CrossRef]
- Yoshii, T.; Nishitsugu, F.; Kikawada, K.; Maehashi, K.; Ikuta, T. Identification of Cadmium Compounds in a Solution Using Graphene-Based Sensor Array. Sensors 2023, 23, 1519. [Google Scholar] [CrossRef]
- Liu, Q.; Chen, J.; Li, Y.R.; Shi, G.Q. High-performance strain sensors with fish-scale-like graphene-sensing layers for full-range detection of human motions. ACS Nano 2016, 10, 7901–7906. [Google Scholar] [CrossRef] [PubMed]
- Chen, S.; Jiang, K.; Lou, Z.; Chen, D.; Shen, G.Z. Recent developments in graphene-based tactile sensors and E-skins. Adv. Mater. Technol. 2018, 3, 1700248. [Google Scholar] [CrossRef]
- Castro Neto, A.H.; Guinea, F.; Peres, N.M.R.; Novoselov, K.S.; Geim, A.K. The electronic properties of graphene. Rev. Mod. Phys. 2009, 81, 109–162. [Google Scholar] [CrossRef] [Green Version]
- You, R.; Liu, Y.Q.; Hao, Y.L.; Han, D.D.; Zhang, Y.L.; You, Z. Laser Fabrication of Graphene-Based Flexible Electronics. Adv. Mater. 2020, 32, 1901981. [Google Scholar] [CrossRef] [PubMed]
- Qian, Z.S.; Shan, X.Y.; Chai, L.J.; Chen, J.R.; Feng, H. A fluorescent nanosensor based on graphene quantum dots–aptamer probe and graphene oxide platform for detection of lead (II) ion. Biosens. Bioelectron. 2015, 68, 225–231. [Google Scholar] [CrossRef]
- Ullah, S.; Hasan, M.; Ta, H.Q.; Zhao, L.; Shi, Q.; Fu, L.; Choi, J.; Yang, R.Z.; Liu, Z.F.; Rümmeli, M.H. Synthesis of doped porous 3D graphene structures by chemical vapor deposition and its applications. Adv. Funct. Mater. 2019, 29, 1904457. [Google Scholar] [CrossRef] [Green Version]
- Yang, Z.F.; Tian, J.R.; Yin, Z.F.; Cui, C.J.; Qian, W.Z.; Wei, F. Carbon nanotube and graphene-based nanomaterials and applications in high-voltage supercapacitor: A review. Carbon 2019, 141, 467–480. [Google Scholar] [CrossRef]
- Cui, Y.X. Research on Flexible Mechanical Sensor Based on Laser-Induced Graphene. Master’s Thesis, Nanjing University of Posts and Telecommunications, Nanjing, China, 2021. [Google Scholar]
- Lin, J.; Peng, Z.; Liu, Y.; Francisco, R.Z.; Ye, R.; Samuel, E.L.G.; Yacaman, M.J.; Yakobson, B.Y.; Tour, J.M. Laser-induced porous graphene films from commercial polymers. Nat. Commun. 2014, 5, 5714. [Google Scholar] [CrossRef] [Green Version]
- Ye, R.Q.; James, D.K.; Tour, J.M. Laser-Induced Graphene:From Discovery to Translation. Adv. Mater. 2019, 31, 1803621. [Google Scholar] [CrossRef]
- Lin, K.C.; Muthukumar, S.; Prasad, S. Flex-GO (Flexible graphene oxide) sensor for electrochemical monitoring lactate in low-volume passive perspired human sweat. Talanta 2020, 214, 120810. [Google Scholar] [CrossRef]
- Feng, X.M.; Zhang, Y.; Zhou, J.H.; Li, Y.; Chen, S.F.; Zhang, L.; Ma, Y.W.; Wang, L.H.; Yan, X.H. Three-dimensional nitrogen-doped graphene as an ultrasensitive electrochemical sensor for the detection of dopamine. Nanoscale 2015, 7, 2427–2432. [Google Scholar] [CrossRef] [PubMed]
- Kwak, Y.H.; Choi, D.S.; Kim, Y.N.; Kim, H.; Yoon, D.H.; Ahn, S.S.; Yang, J.W.; Yang, W.S.; Seo, S. Flexible glucose sensor using CVD-grown graphene-based field effect transistor. Biosens. Bioelectron. 2012, 37, 82–87. [Google Scholar] [CrossRef] [PubMed]
- Ruecha, N.; Rodthongkum, N.; Cate, D.M.; Volckens, J.; Chailapakul, O.; Henry, C.S. Sensitive electrochemical sensor using a graphene–polyaniline nanocomposite for simultaneous detection of Zn(II), Cd(II), and Pb(II). Anal. Chim. Acta 2015, 874, 40–48. [Google Scholar] [CrossRef]
- Huang, L.B.; Guo, W.H.; Cheng, L.; Su, J.J.; Song, Y.; Hu, F.J.; Law, Y.L.; Yan, Z.; Lin, J.; Ye, R.Q. Differentiating structure of in situ and ex situ formation of laser-induced graphene hybrids. Rare Met. 2022, 41, 3035–3044. [Google Scholar] [CrossRef]
- Zhang, J.B.; Ren, M.Q.; Li, Y.L.; Tour, J.M. In Situ Synthesis of Efficient Water Oxidation Catalysts in Laser-Induced Graphene. ACS Energy Lett. 2018, 3, 677–683. [Google Scholar] [CrossRef]
- Fu, X.Q.; Duan, S.L.; Lin, J.R.; Shen, M.Q.; Wang, Q.Q. Effects of CeO2 Nano-Rare Earth Particles Doping on Properties of Ni-Fe-Co-P Alloy Coatings. Rare Met. Mater. Eng. 2020, 49, 2095–2103. [Google Scholar]
- Ren, A.H.; Fu, X.Q.; Duan, S.L.; Shen, M.Q.; Lin, J.R. Effect of Current Density on the Performance of Ni-Fe-P-CeO2 Composite Coating Prepared by Jet Electrodeposition. Int. J. Electrochem. Sci. 2020, 15, 8563–8583. [Google Scholar]
- Fu, X.Q.; Ma, W.K.; Duan, S.L.; Wang, Q.Q.; Lin, J.R. Electrochemical Corrosion Behavior of Ni-Fe-Co-P Alloy Coating Containing Nano-CeO2 Particles in NaCl Solution. Materials 2019, 12, 2614. [Google Scholar] [CrossRef] [Green Version]
- Fu, X.Q.; Li, J.; Zhang, H.W.; Xian, J.Y. Simulation and experimental research on nickel-based coating prepared by jet electrodeposition at different scanning speeds. Int. J. Adv. Manuf. Technol. 2022, 121, 1851–1866. [Google Scholar] [CrossRef]
- Duan, S.L.; Fu, X.Q.; Shen, M.Q.; Wang, Q.Q.; Ma, W.K. Study on the corrosion resistance of Ni-P-ZrO2 composite coating deposited by spray electrodeposition on the surface of rotating body. Mater. Sci. Technol. 2020, 28, 73–81. [Google Scholar]
- Ren, A.H.; Fu, X.Q.; Chen, X.X.; Lin, J.R.; Cao, H.B. Effect of Current Density on the Properties of Ni-CeO2 Composite Coatings prepared using Magnetic Field-Assisted Jet Electrodeposition. Int. J. Electrochem. Sci. 2021, 16, 210658. [Google Scholar]
- Zhuo, K.; Li, D.; Wang, J.H. TiO2 Nanotubes/Au Nanoparticles Composites for Electrochemical Sensor of Heavy Metal Ions. Micronanoelectronic Technol. 2021, 58, 137–143. [Google Scholar]
- Liu, Z.G.; Chen, X.; Liu, J.H.; Huang, X.J. Well-arranged porous Co3O4 microsheets for electrochemistry of Pb(II) revealed by stripping voltammetry. Electrochem. Commun. 2013, 30, 59–62. [Google Scholar] [CrossRef]
- Armstrong, K.C.; Tatum, C.E.; Dansby-Sparks, R.N. Individual and simultaneous determination of lead, cadmium, and zinc by anodic stripping voltammetry at a bismuth bulk electrode. Talanta 2010, 82, 675–680. [Google Scholar] [CrossRef] [Green Version]
- Tang, S.R.; Ting, T.; You, X.H.; Lu, W.; Chen, J.H.; Li, G.W.; Zhang, L. Label free electrochemical sensor for Pb2+ based on graphene oxide mediated deposition of silver nanoparticles. Electrochim. Acta 2016, 187, 286–292. [Google Scholar] [CrossRef]
- Jeong, S.Y.; MA, Y.W.; Lee, J.U.; Je, G.J.; Shin, B.S. Flexible and Highly Sensitive Strain Sensor Based on Laser-Induced Graphene Pattern Fabricated by 355 nm Pulsed Laser. Sensors 2019, 19, 4867. [Google Scholar] [CrossRef] [PubMed] [Green Version]
- Ferrari, A.C.; Basko, D.M. Raman spectroscopy as a versatile tool for studying the properties of graphene. Nat. Nanotechnol. 2013, 8, 235–246. [Google Scholar] [CrossRef] [Green Version]
- Ferrari, A.C.; Meyer, J.C.; Scardaci, V.; Casiraghi, C.; Lazzeri, M.; Mauri, F.; Piscanec, S.; Jiang, D.; Novoselov, K.S.; Roth, S.; et al. Raman spectrum of graphene and graphene layers. Phys. Rev. Lett. 2006, 97, 187401. [Google Scholar] [CrossRef] [PubMed] [Green Version]
- Casiraghi, C.; Hartschuh, A.; Lidorikis, E.; Qian, H.; Harutyunyan, H.; Gokus, T.; Novoselov, K.S.; Ferrari, A.C. Rayleigh Imaging of Graphene and Graphene Layers. Nano Lett. 2007, 7, 2711–2717. [Google Scholar] [CrossRef] [Green Version]
- Wahab, H.; Jain, V.; Tyrrell, A.S.; Seas, M.A.; Kotthoff, L.; Johnson, P.A. Machine-learning-assisted fabrication: Bayesian optimization of laserinduced graphene patterning using in-situ Raman analysis. Carbon 2020, 167, 609–619. [Google Scholar] [CrossRef]
- Mei, Z.F.; Yao, M.T.; Chen, R.S.; Hu, C.G. Sensitive Non-Enzymatic Glucose Electrochemical Sensor Based on Dendrite Copper Modified Laser-Induced Graphene Electrodes. J. Anal. Sci. 2021, 37, 522–528. [Google Scholar]
- Oliver-Tolentino, A.; Vazquez-Samperio, J.; Manzo-Robledo, A.; González-Huerta, R.; Flores-Moreno, J.; Ramírez-Rosales, D.; Guzmán-Vargas, A. An Approach to Understanding the Electrocatalytic Activity Enhancement by Superexchange Interaction Toward OER in Alkaline Media of Ni-Fe LDH. J. Phys. Chem. C 2014, 118, 22432–22438. [Google Scholar] [CrossRef]
- Gao, R.M.; Liu, H.G. Discussion of Concept of Detection Limit-The Definition, the Estimation and the Use of IUPAC and etc. Approaches. Chin. J. Anal. Chem. 1993, 21, 1232–1236. [Google Scholar]


| Composition | Content/(g·L−1) | Effect |
|---|---|---|
| NiSO4·6H2O | 180 | Provide Ni2+ |
| FeSO4·7H2O | 30 | Provide Fe2+ |
| C6H8O7 | 30 | Complexing agent |
| H3BO3 | 30 | pH SRP |
| CH4N2S | 0.01 | Stabilizer |
| C12H25SO4Na | 0.08 | Surfactant |
| Parameters | Numerical Value |
|---|---|
| Current | 0.02 A |
| Temperature | 40 °C |
| Machining gap | 1.5 mm |
| Processing time | 10 min |
| Scanning length | −15–15 mm |
| pH | 3.5–4.0 |
Disclaimer/Publisher’s Note: The statements, opinions and data contained in all publications are solely those of the individual author(s) and contributor(s) and not of MDPI and/or the editor(s). MDPI and/or the editor(s) disclaim responsibility for any injury to people or property resulting from any ideas, methods, instructions or products referred to in the content. |
© 2023 by the authors. Licensee MDPI, Basel, Switzerland. This article is an open access article distributed under the terms and conditions of the Creative Commons Attribution (CC BY) license (https://creativecommons.org/licenses/by/4.0/).
Share and Cite
Gao, J.; Fu, H.; Liu, C.; Zhu, Y.; Fu, X. Ni-Fe Alloy Coatings Prepared via Jet Electrodeposition for the Optimization of the Electrochemical Detection Performance of Laser-Induced Graphene for Pb(II). Metals 2023, 13, 1253. https://doi.org/10.3390/met13071253
Gao J, Fu H, Liu C, Zhu Y, Fu X. Ni-Fe Alloy Coatings Prepared via Jet Electrodeposition for the Optimization of the Electrochemical Detection Performance of Laser-Induced Graphene for Pb(II). Metals. 2023; 13(7):1253. https://doi.org/10.3390/met13071253
Chicago/Turabian StyleGao, Jiaming, Haiwei Fu, Chen Liu, Yifan Zhu, and Xiuqing Fu. 2023. "Ni-Fe Alloy Coatings Prepared via Jet Electrodeposition for the Optimization of the Electrochemical Detection Performance of Laser-Induced Graphene for Pb(II)" Metals 13, no. 7: 1253. https://doi.org/10.3390/met13071253