Abstract
Ion irradiation is a promising tool to emulate neutron-irradiation effects on reactor pressure vessel (RPV) steels, especially in the situation of limited availability of suitable neutron-irradiated material. This approach requires the consideration of ion-neutron transferability issues, which are addressed in the present study by comparing the effect of ions with neutron-irradiation effects reported for the same materials. The first part of the study covers a comprehensive characterization, based on dedicated electron microscopy techniques, of the selected unirradiated RPV materials, namely a base metal and a weld. The results obtained for the grain size, dislocation density, and precipitates are put in context in terms of hardening contributions and sink strength. The second part is focused on the depth-dependent characterization of the dislocation loops formed in ion-irradiated samples. This work is based on scanning transmission electron microscopy applied to cross-sectional samples prepared by the focused ion beam technique. A band-like arrangement of loops is observed in the depth range close to the peak of injected interstitials. Two levels of displacement damage, 0.1 and 1 dpa (displacements per atom), as well as post-irradiation annealed conditions, are included for both RPV materials. Compared with neutron irradiation, ion irradiation creates a similar average size but a higher number density of loops presumably due to the higher dose rate during ion irradiation.
1. Introduction
From the perspective of safety and reliability, the reactor pressure vessel (RPV) is a critical component in a nuclear fission reactor. It is specifically designed to withstand the temperatures, pressures, and radiation levels present in nuclear reactors. In Western pressurized water reactors, the operating temperature is approximately 290 °C, the operating pressure is up to 15.5 MPa and the neutron fluence is up to 1023 m−2 (E > 1 MeV) for 40-year full-time operation [1]. To some extent, embrittlement is an unavoidable consequence of neutron irradiation [2,3,4,5,6].
Although the microstructure of neutron-irradiated RPV steels has been analyzed many times, e.g., [7,8,9,10,11,12,13], there are still open issues [14], which pose the need for additional neutron irradiations. However, there are several challenges to performing neutron-irradiation experiments, such as the handling of activated samples, long irradiation time, and the lack of neutron-irradiation facilities. Therefore, recent research followed the idea to use ion irradiations in order to emulate neutron-irradiation effects [2,15,16,17,18,19,20,21]. Ion irradiations allow the irradiation time to be reduced (to days or hours) and the variability of irradiation conditions (temperature, dose rate) to be improved. However, some difficulties exist in ion irradiation. First, unlike neutron irradiation, ions have a short penetration range (of the order of some µm) and thus the irradiation effects can only be studied in a comparatively small volume near the surface of ion-irradiated samples. Second, ions are implanted in the sample and the damage profile is complex. Despite this, a “safe zone” [22] is obtained with high-energy ions, such as 5 MeV and above. In the “safe zone”, there is a broad enough region where injected interstitials and sample surface artifacts can be neglected. The defects induced in the “safe zone” are mainly caused by ion-irradiation displacement damage, and thus are better comparable to defects induced by neutron irradiation.
Microstructure investigations of ion-irradiated RPV steels have been reported before. Ma et al. [23] reported the irradiated microstructure in a thin foil taken from the region of maximum irradiation damage for two different doses. Unfortunately, the position of maximum damage is affected by the injected interstitials. Ding et al. [24] characterized the microstructure induced by various doses of ion irradiation at room temperature and discussed the relation with mechanical properties. The microstructure was limited to the maximum damage region too, and the influence of injected interstitials was not mentioned. Fujii et al. [25] characterized the ion-irradiated microstructure within the whole depth region (the region near the surface was lost due to the preparation process) but the quantitative analysis was performed in a shallow region close to peak damage. Watanabe et al. [26] discussed the formation of loops in the matrix and in the vicinity of dislocations. In addition, recovery of hardening by post-irradiation annealing was demonstrated but without information on the as-annealed microstructure. The current stage of research justifies the need to quantitatively analyze the complete through-depth region in order to identify the safe zone and largely exclude ion-related artifacts.
The subject of this paper is to investigate the microstructure of an RPV weld and an RPV base metal by means of electron microscopy including scanning transmission electron microscopy (STEM). The study covers the unirradiated, ion-irradiated and post-irradiation annealed (PIA) microstructures. In order to study the effects of ion irradiation and annealing, cross-sectional samples were prepared and analyzed using depth-resolved STEM. Moreover, an additional aim is the direct comparison of the ion-irradiated microstructure in the safe zone with the microstructure reported for the same neutron-irradiated materials.
2. Materials and Methods
2.1. Materials
Two commercial RPV steels with body-centered cubic (bcc) structure, here referred to as ANP-6 and ANP-10, are investigated in this study. Both of them were provided by Framatome GmbH (Erlangen, Germany) as broken Charpy-V specimens. ANP-6 is a western second-generation RPV weld of type S3NiMo/OP41TT, while ANP-10 is a western 2nd/3rd generation RPV steel (forging) of type 22NiMoCr3-7. The compositions are given in Table 1.

Table 1.
Composition in wt. % (Fe is balance).
2.2. Sample Preparation
First, the samples were cut into pieces with a geometry of 10 × 10 × 1 mm3 by electrical discharge machining. Subsequent preparation steps are different for each electron microscope instrument and ion irradiation.
For electron backscatter diffraction (EBSD), samples were ground with SiC paper for up to 200 s down to 2500 grit, followed by mechanical polishing for up to 8 min with 3 µm and 1 µm diamond paste and fine polishing for 2 min with 60 nm silica suspension (MasterMet, Buehler, Leinfelden-Echterdingen, Germany). The load for all grinding and polishing operations was 17 Newton.
For scanning electron microscopy (SEM) imaging and energy dispersive X-ray spectroscopy (EDX), samples were prepared with the same steps as the samples prepared for EBSD but with additional electro-polishing in 2% perchloric acid in Butylcellosolve as the last step. The last step provides an enhanced particle contrast.
For classical transmission electron microscopy (TEM)/scanning transmission electron microscopy (STEM), samples were ground down to 100 µm and punched out as 3 mm discs, followed by electrolytic thinning using 5% perchloric acid in methanol (Tenupol 5 Struers) at −40 °C for 1–3 min.
Before ion irradiation, samples were prepared with the same steps as the samples prepared for EBSD. In addition, shortly before ion irradiation, the samples were cleaned for 2 min in a plasma cleaner (Fischione Instruments Model 1020, Hanau, Germany) to prevent the formation of a possible carbon contamination layer.
The ion-irradiated target samples observed in (S)TEM were initially characterized by EBSD and grains with preferred orientations were chosen for the subsequent focused ion beam (FIB) preparation. The chosen areas were lifted out as lamella in a wedge shape with around 10 µm width, a depth of at least 3 µm, and a thickness between 60 and 200 nm at the relevant areas.
2.3. Microstructure Characterization of the Unirradiated Material
An EVO 50 SEM (Zeiss, Oberkochen, Germany) with a tungsten filament was used for surface imaging with secondary electron (SE) and backscattered electron (BSE) detectors. For EBSD, an NVision 40 SEM (Zeiss, Oberkochen, Germany) with a field emission gun (FEG) equipped with a Bruker EBSD system was used to study the initial microstructure. SEM-EDX was applied to identify the type of particles. A series of SE and InLens micrographs was used to provide detection of particles with the best possible edge, as well as gray value contrast of particles and matrix. Each particle was manually marked in order to achieve correct separation. Afterward, in-house written software was used to identify the marked areas as particles. Thus, the number, area fraction, and mean size of particles in the acquired micrographs were obtained. Using these data, the number density of particles was calculated.
EBSD mappings with 1400 × 1050 points were recorded using an acceleration voltage of 16 kV, a step size of 200 nm, and a pattern acquisition time between 55 and 62 ms. EBSD evaluation was conducted using in-house written software. The grains were identified as areas enclosed by grain boundaries with a misorientation angle ≥5°. The grain size was calculated as the equivalent circle diameter from the averaged grain area. Grains with less than 5 pixels (diameter < 0.5 µm) were not considered for grain size determination.
For (S)TEM, a Talos 200 FEG TEM (FEI, Eindhoven, Netherlands) was applied to image dislocations and to measure dislocation density. The thickness was measured by the acquisition of convergent beam electron diffraction (CBED) patterns at <211> bands and a subsequent comparison of experimental and simulated CBED patterns. CBED simulations were carried out by the software TEMStrain 1.4 (Kraków, Poland) by A. Morawiec. In order to measure the dislocation density, grains were oriented to either <113> or <001> zone axis for STEM imaging. The correct orientation was confirmed by both, conventional selected area diffraction (SAD) as well as CBED patterns. Imaging on these zone axes allows the visibility of most dislocations with ½ <111> and <001> type Burgers vectors that exist in bcc structural materials. After imaging dislocations, the thickness of each corresponding grain was measured. The grain was tilted so that the direct beam was aligned with a <211> type Kikuchi band. Through tilting, the grain orientation was adjusted so that one Kikuchi line was crossing the center of the transmitted disc, while the complementary Kikuchi line was crossing the center of the diffracted disc. These experimental CBED patterns were then compared to simulated CBED patterns. The rocking curve in these patterns is very sensitive to changes in sample thickness. Thus, the accuracy of this method for measuring sample thickness at a single point is approximately 5 nm or better. However, the thickness is not always constant over the whole grain. If a thickness gradient was noticed, several points of thickness measurement were taken and an average grain thickness was determined. After imaging of dislocations and thickness measurement, the line intercept method was applied to calculate the dislocation density for each grain. Since a mere gray-value-based recognition of STEM images of dislocations did not work reliably, the dislocations were marked manually. In the next step, in-house written software was used to draw vertical and horizontal lines with a spacing of 10 image pixels. The total number of intercepts N with dislocation lines was counted automatically. Ambiguous areas were excluded. Finally, for each grain, the dislocation density ρ was calculated as:
where N is the number of interception points, L is the total line length, and t is the grains thickness. The dislocation density was measured using at least 10 grains for both materials and a grain volume-weighted average dislocation density was calculated.
2.4. Ion Irradiation
Ion irradiations were performed in the Ion Beam Center at Helmholtz-Zentrum Dresden-Rossendorf using a 3 MV tandetron accelerator. Fe2+ ions with an energy of 5 MeV were implanted into the polished side of the samples. In order to investigate the effect of different doses in the unit of displacement per atom (dpa), the binary collision code Stopping and Range of Ions in Matter (SRIM) version 2013.00 was applied to calculate the doses and corresponding ion fluences. The calculations were based on the quick Kinchin–Pease calculation suggested by [27]. The depth profile of the dose, given in dpa, and injected interstitials, given in atomic parts per million (appm), calculated by SRIM, are plotted in Figure 1. The depth range around 0.5 µm can be considered as the “safe zone” due to the almost complete absence of injected interstitials. A summary of irradiation conditions is listed in Table 2. Two irradiation conditions resulting in 0.1 dpa (low dose) and 1 dpa (high dose) at the depth of 0.5 µm (reference depth, dotted line in Figure 1) were applied for both materials using the same dose rate (dose rate at 0.5 µm: 4.67 × 10⁻⁵ dpa/s, flux: 1.25 × 1011 cm−2/s).
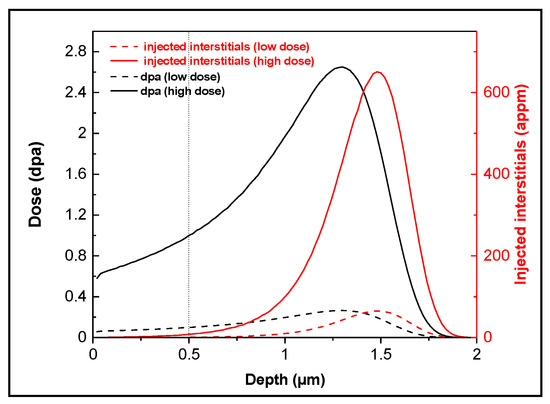
Figure 1.
Depth profiles of dose (in dpa) and injected interstitials (in appm) for low (dash lines) and high (solid lines) doses calculated by SRIM.
Table 2.
Summary of irradiation conditions.
2.5. STEM Study of Irradiation-Induced Defects
After ion irradiation, cross-sectional samples of irradiated materials were lifted out by FIB, as described in Section 2.2, using a FEI Helios G4 CX Crossbeam with pre-chosen grain orientation, so that the grain would appear in <001> zone axis in the TEM.
Ion-induced dislocation loops were imaged under diffraction condition g = <110> near the <001> zone axis in bright field and dark field STEM mode. The number densities and size measurements of loops were conducted using bright field images. Segments with a width of 0.1 µm were defined and analyzed along the perpendicular direction from the surface of the cross-sectional samples, thus the depth profiles of the number density and size of loops were acquired. In order to avoid possible preparation defects induced by the FIB technique near the sample surface, the first segment ranges from a depth of 0 to 0.1 µm was neglected and analysis started at a depth of 0.1 µm.
In bcc structural materials, dislocation loops are formed only with Burgers vectors b = <001> and b = ½ <111> [28]. According to the visibility criteria, loops are invisible under STEM images when g · b = 0. As shown in Table 3, specifically under diffraction condition g = <110>, half of b = ½ <111> type, and one-third of b = <001> type loops are invisible. Therefore, the total number density of loops Nd lies between 1.5 Nc and 2 Nc [29], where Nc is the number density of loops counted and calculated under diffraction condition g = <110>. In the present work, Nd = 1.75 Nc is chosen with an error range of ±0.25 Nc.
Table 3.
Visibility criteria for dislocation loops in bcc structure steels with the TEM sample orientation close to the [001] zone axis. b: Burgers vector, g: diffraction vector, V = visible, 0 = invisible.
In order to determine the type of ion-irradiation induced loops, STEM images under [001] zone axis, diffraction vectors g = [10] and g = [110] near [001] zone axis need to be taken. In the STEM image taken under [001] zone axis condition, all the loops are visible except those with b = [001]. If the loops are visible for both diffraction vectors g = [110] and g = [10], then the loops can be distinguished as <001>-type of loops. If the loops are visible for one of the diffraction vectors but invisible for the other one, then the loops are ½ <111>-type.
2.6. Effect of PIA
After ion irradiation, annealing was applied to investigate the thermal stability of the irradiation-induced dislocation loops. As-irradiated samples of ANP-6 and ANP-10 with high doses were annealed at a temperature of 475 °C for 3 h. Additionally, as-irradiated ANP-10 with a high dose was annealed at 550 °C for 3 h. In order to avoid oxidation, the samples were wrapped inside multi-layered steel foil envelopes and placed into an evacuated quartz tube. The tube was inserted into a furnace pre-heated to the desired temperature, which is monitored and controlled by a thermocouple. After annealing, a high cooling rate was achieved by retracting the tube.
3. Results
3.1. Unirradiated Microstructure
The unirradiated microstructure of as-received samples was initially characterized by SEM. Figure 2 and Figure 3 show the SEM micrographs of ANP-6 and ANP-10, respectively. In contrast to ANP-10, ANP-6 obviously exhibits more large (≥1 µm in diameter) spherical particles.
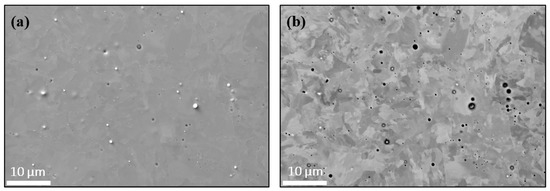
Figure 2.
SEM micrographs of ANP-6 using (a) SE detector and (b) BSE detector.
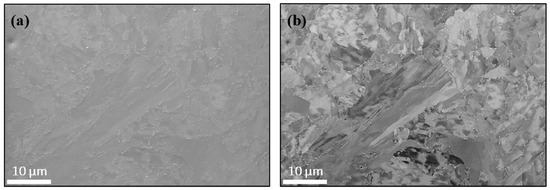
Figure 3.
SEM micrographs of ANP-10 using (a) SE detector and (b) BSE detector.
The particles were analyzed by SEM-EDX. Figure 4a displays the overview SE micrograph of the area on ANP-6, the crosses with numbers indicate the spots at which EDX spectra have been collected. Figure 4b shows a spectrum from the metal matrix as a reference. As represented by position 2 (Figure 4c), the larger spherical particles are Al-, Si-, and Mn-rich oxides. The smaller particles, located mostly in the vicinity of grain boundaries, are carbides enriched with Cr (position 3, Figure 4d).
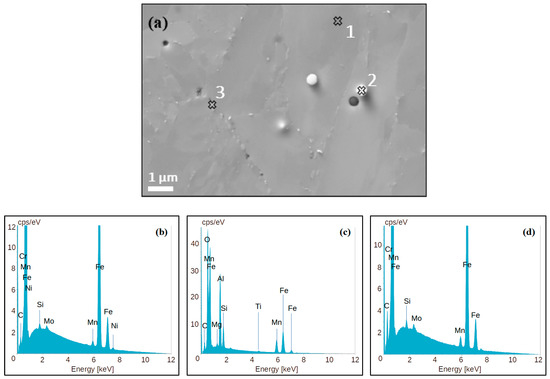
Figure 4.
SEM-EDX on ANP-6. (a) shows an overview SE micrograph. The crosses with numbers indicate the spots at which EDX spectra have been collected. (b) shows the spectrum at position 1 (matrix), (c) at position 2 (oxide particle), and (d) at position 3 (carbide).
Figure 5a displays the overview SE micrograph of the area on ANP-10, the crosses with numbers indicate the spots at which EDX spectra have been collected. Figure 5b shows a spectrum from the metal matrix as a reference. Figure 5c,d display the spectra of the chosen particles. All identified particles in ANP-10 are carbides. Most of the larger carbides are predominantly enriched with Mn and contain some excess Mo and Cr (e.g., position 2). Some of the smaller carbides are predominantly enriched with Mo (e.g., position 3), and show a little excess of Mn and Cr, too.
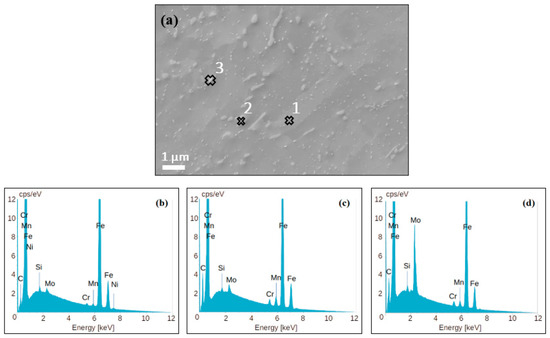
Figure 5.
SEM-EDX on ANP-10. (a) shows an overview SE micrograph. The crosses with numbers indicate the spots at which EDX spectra have been collected. (b) shows the spectrum at position 1 (matrix), (c) at position 2 (carbide), and (d) at position 3 (another carbide).
The microstructure of the as-received samples was additionally characterized by EBSD. Inverse pole figure (IPF) plots for the sample normal direction were calculated from the EBSD mappings as shown in Figure 6. The global texture for both materials is weak. EBSD mapping of grain boundaries is shown in Figure 7. The average grain size amounts to 2.9 µm and 5.5 µm for ANP-6 and ANP-10, respectively.
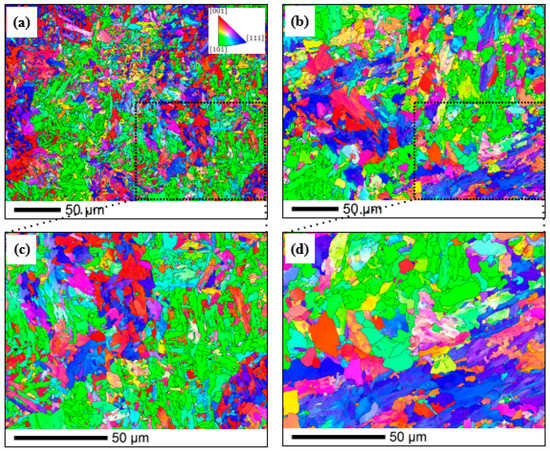
Figure 6.
EBSD IPF-Z mappings of (a) ANP-6 overview, (b) ANP-10 overview, (c) ANP-6 detail, and (d) ANP-10 detail.
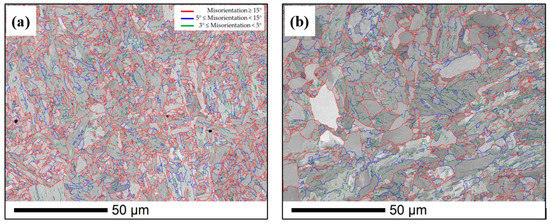
Figure 7.
EBSD pattern quality map with grain boundaries (a) ANP-6 detail, (b) ANP-10 detail.
The initial dislocations were imaged by STEM and the dislocation density was measured afterward. Figure 8 shows a typical example of initial dislocation imaging under zone axis <113> condition for ANP-6 and ANP-10. The dislocation density in ANP-6 is approximately one order of magnitude larger than ANP-10. The measured microstructure parameters by EBSD, SEM-EDX, STEM, and yield stress at room temperature provided by [30] are summarized in Table 4. The microstructure of materials has a close relation to the yield stress. In the discussion part, this topic will be elaborated.
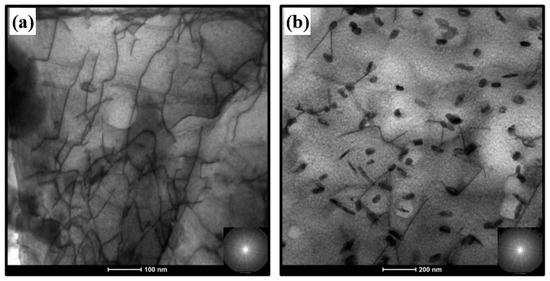
Figure 8.
STEM imaging of initial dislocations for (a) ANP-6, (b) ANP-10.
Table 4.
Microstructure parameters and yield stress.
3.2. Ion-Irradiation Effect
After both materials were ion irradiated, dislocation loops can be observed mostly as small black dots (approximate diameter < 10 nm), while rarely some appear as ‘‘real loops’’ (approximate diameter > 15 nm) in the STEM bright field images. Figure 9a,b and Figure 10a,b show examples of STEM images of ion-irradiated cross sections for sample ANP-6 (high and low doses) and ANP-10 (high and low doses), respectively. On the left-hand side of the STEM images, depth profiles of displacement damage and injected interstitials calculated by SRIM are attached. The most important feature is the damage band with a high density of dislocation loops located in the range from 1.2 to 1.6 µm below the surface, which overlaps with the depth range of maximum dose and injected interstitials. The band is clearly distinguished in the high-dose samples. While still present, it is less obvious in low-dose samples. In the depth range between the band and the surface, significantly fewer loops are present. They are distributed inhomogeneously and located preferentially in the vicinity of sinks (initial line dislocations, grain boundaries, and precipitates). The density of loops below the damage band decreases dramatically and loops are barely observed below a depth of approximately 2.0 µm, where the unirradiated substrate is located.
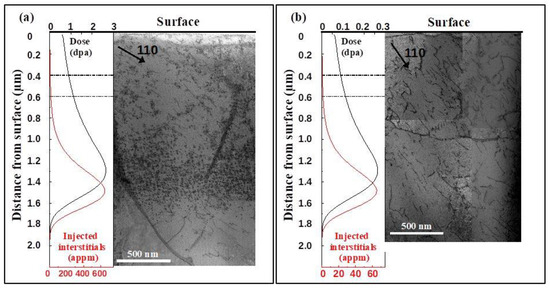
Figure 9.
STEM images of ion-irradiated ANP-6 and depth profiles of SRIM calculation. (a) high dose, 1 dpa at 0.5 µm (b) low dose, 0.1 dpa at 0.5 µm.
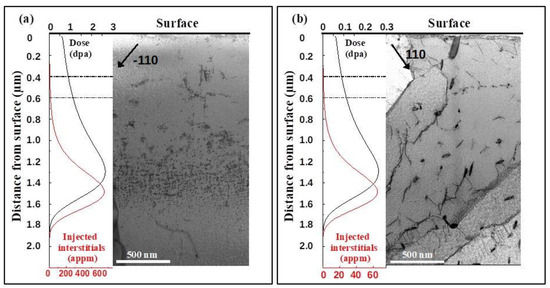
Figure 10.
STEM images of ion-irradiated ANP-10 and depth profiles of SRIM calculation. (a) high dose, 1 dpa at 0.5 µm (b) low dose, 0.1 dpa at 0.5 µm.
The number density and average diameter of loops were measured segment by segment as described in the experimental section and are presented in Figure 11 and Figure 12 as functions of depth. Error bars for the number density are derived from the square root of the total number considered. For the size, the error is the standard deviation.
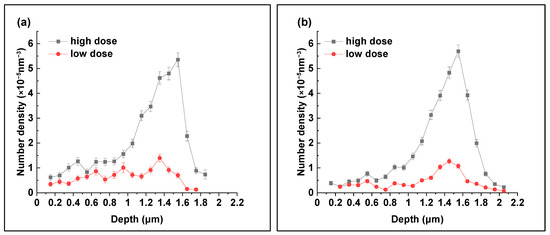
Figure 11.
Measured depth profile of number density of loops for samples (a) ANP-6, (b) ANP-10.
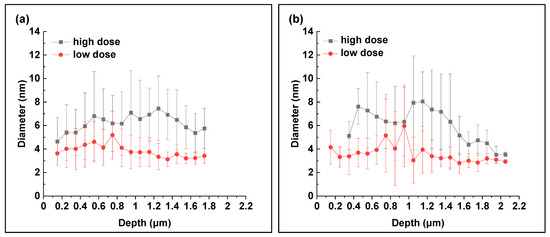
Figure 12.
Measured depth profile of size of loops in diameter for samples (a) ANP-6, (b) ANP-10.
Table 5 summarizes the peak positions (depth from the surface) for the ion-irradiation dose and the injected interstitials, which were calculated by SRIM. In addition, the measured peak positions of the number density Nd of loops for low and high doses are also included.
Table 5.
Peak positions for ion-irradiation dose, injected interstitials, and number density Nd of loops for low and high doses.
Regardless of the dose level and the material, the peak positions of the number density Nd of loops are deeper than the peak position of the dose and close to the peak position of the injected interstitials. For both materials, the peak positions of the number density of loops are deeper for the high dose as compared to the low dose.
The measured number densities of loops at the peak position and the diameters of loops averaged over the whole depth range are summarized in Table 6 for both ANP-6 and ANP-10.
Table 6.
Summary of loop measurements (number density at peak position, diameter averaged over the whole depth profile).
The number densities of loops at the peak position are higher for the high dose as compared to the low dose. The factors are 3.9 and 4.5 for ANP-6 and ANP-10, respectively. The average size of loops is slightly larger for the high dose as compared to the low dose for both materials.
Figure 13 and Figure 14 show the size distribution of loops. Parts a, b, and c of both figures refer to the whole depth range, the depth range above the damage band (from 0.1 to 1.2 µm), and the depth range close to the damage band (from 1.2 to appr. 2.0 µm), respectively. There is no obvious difference between cases b and c, so the size distribution of loops appears depth independent for both materials.
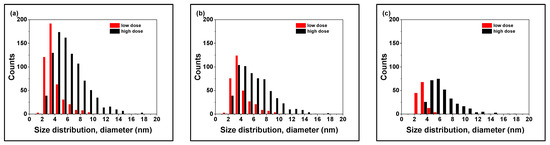
Figure 13.
Size distribution of loops in ANP-6 (a) whole depth, (b) above damage band (from 0.1 to 1.2 µm), (c) on band (from 1.2 to appr. 2.0 µm).
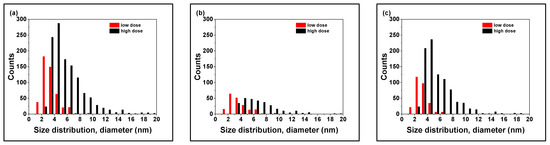
Figure 14.
Size distribution of loops in ANP-10 (a) whole depth, (b) above damage band (from 0.1 to 1.2 µm), (c) on band (from 1.2 to appr. 2.0 µm).
3.3. Effect of PIA
ANP-6 and ANP-10 with high doses were subsequently heat treated for 3 h at 475 °C. The STEM images of these annealed cross-sectional samples are shown in Figure 15. Loops are still visible after the annealing of both materials. The measured depth profiles of the number density and diameter of loops for both samples before and after annealing are plotted in Figure 16 and Figure 17. The overall results are similar for both samples. The number density of loops at peak position decreases significantly with respect to the as-irradiated materials. The loop size increases after annealing in the whole depth range. Additionally, as-irradiated ANP-10 with a high dose was annealed for 3 h at 550 °C. A STEM image is shown in Figure 18. No loops can be observed. Table 7 shows the quantitative comparison.
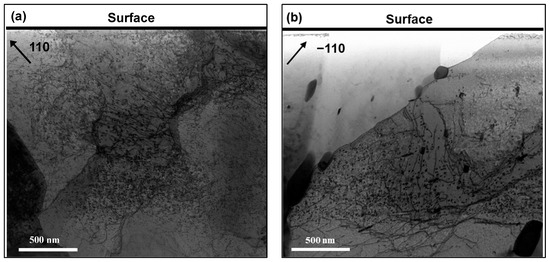
Figure 15.
STEM images after PIA at 475 °C for samples (a) ANP-6, (b) ANP-10.
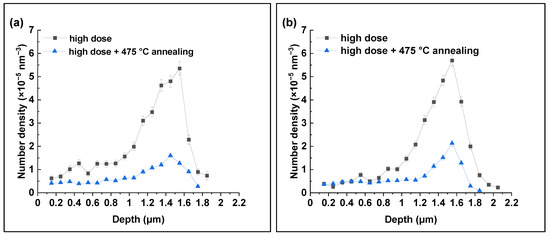
Figure 16.
Depth profiles of loops number density in ion-irradiated (high dose) and subsequently annealed at 475 °C (a) ANP-6, (b) ANP-10.
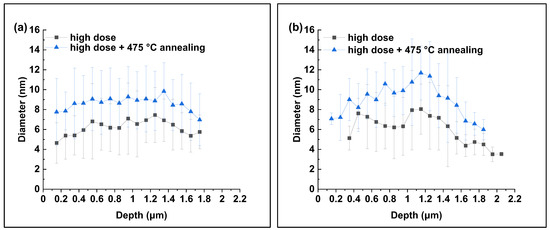
Figure 17.
Depth profiles of loops diameter in ion-irradiated (high dose) and subsequently annealed at 475 °C (a) ANP-6, (b) ANP-10.
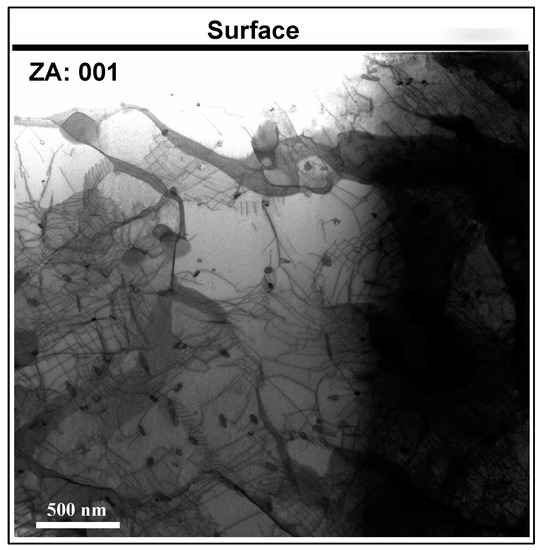
Figure 18.
STEM image after PIA at 550 °C for ANP-10.
Table 7.
Summary of loops for the effect of PIA (number density at peak position, diameter averaged over the whole depth profile).
A comparison of the size distribution of loops before and after annealing is given in Figure 19. Loops with a diameter below 5 nm, which are dominant for the as-irradiated samples, almost completely disappear after annealing. The peak positions of the size distributions are shifted by around 4 nm toward higher diameters.
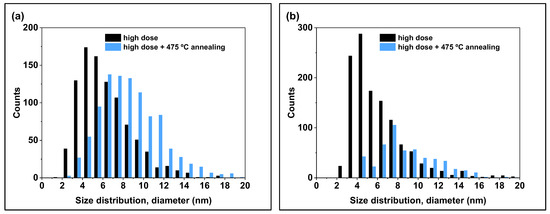
Figure 19.
Size distribution of loops in the whole depth of (a) ANP-6, (b) ANP-10.
3.4. Determination of Burgers Vector of Loops
For the Burgers vector analysis, it is important to distinguish between different imaging conditions, namely “in zone axis” and “specific g vectors close to zone axis”, as mentioned in Section 2.5. An example of Burgers vector determination is demonstrated in Figure 20. The final results are shown in Table 8. Approximately 150 loops were measured in the region between the sample surface and the damage band for each sample. The number in brackets in Table 8 is the exact number of loops considered. The error is given as the inverse square root of the total number of considered loops. In both materials, <001>-type loops are dominant, representing approximately 70% of all loops.
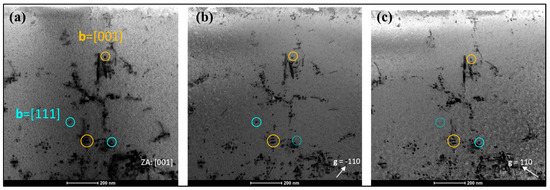
Figure 20.
Visibility of loops by STEM in the same area under different conditions (example of ANP-10 with high dose). Visible: solid circle. Invisible: dot circle. (a) zone axis [001] micrograph, (b) diffraction vector g = [10], (c) diffraction vector g = [110].
Table 8.
Results of percentage of loops (number of considered loops in bracket) for ANP-6 and ANP-10 with high dose.
4. Discussion
4.1. Correlation between Initial Microstructure and Yield Stress
The yield stress of materials is related to its microstructure. The yield stress (σy) of materials at room temperature can be tentatively calculated by the linear sum of strengthening contributions [31], as in Equation (2):
where σ0, σs, σg, σd, σp are lattice friction, solid solution strengthening, Hall–Petch strengthening (grain boundary strengthening), dislocation forest strengthening, and particle strengthening, respectively.
However, according to [32], the calculated yield stress has the best match with measured yield stress, using a different expression (3), where the friction and solute strengthening are neglected, while the contribution of dislocation forest strengthening and particles strengthening are added geometrically [33,34].
within Equation (3), Hall–Petch strengthening contribution σg can be calculated as:
where αg = 0.2 [35], G is the shear modulus (=83 GPa at room temperature) [34,36], b is the Burgers vector (=0.248 nm for bcc ½ <111>-type dislocations, assuming all are ½ <111>-type) and dg is average grain size.
Dislocation forest strengthening (σd) can be calculated as:
where αd = 1/3 [35], M is the Taylor factor recommended to be 3.06 for most polycrystalline bcc metals [37] and ρd is the dislocation density.
For the unirradiated materials in this study, only carbides are relevant. Indeed, only carbides were observed for ANP-10, whereas for ANP-6, the number density of oxides was found to be two orders of magnitude lower than that of the carbides. The particle strengthening (σp) can be calculated as:
where αp is the obstacle strength for carbides (=0.8) [38], Np and dp are the number density and mean size of carbides.
The yield stress calculated according to Equation (3) and the experimental yield stress are compared in Table 9.
Table 9.
Comparison of experimental and calculated yield stress for ANP-6 and ANP-10.
The calculated yield stress is quite precise for ANP-6 (~1% deviation) and close for ANP-10 (~10% deviation). This confirms the applicability of Equations (3)–(6) for the unirradiated RPV materials of this study. We have also found that each of the three yield-stress contributions is significant. For ANP-6, forest strengthening is dominant, while particle (carbide) strengthening is dominant for ANP-10. The achieved understanding of the strengthening mechanisms will be an important input for the interpretation of irradiation-induced changes in the microstructure and mechanical properties.
4.2. Effect of Dose
The depth-dependent characteristics of the irradiation-induced loops were already described in Section 3.2 and listed in Table 6 for both materials and both doses. We are especially interested in the dose effect on the formation of loops in terms of ratios between high and low doses, see Table 10. The ratio (ƒe) between high and low dose is 10. Comparing high and low doses, the ratio of the maximum number density of loops (ƒn) is 3.9 for ANP-6 and 4.4 for ANP-10. The ratio of the average diameter of loops (ƒd) is 1.6 for ANP-6 and 1.7 for ANP-10.
Table 10.
Calculation results of the ratios ƒn, ƒd, ƒp, ƒe.
For the Chinese RPV steel A508-3, an increase in the dose from 0.08 dpa to 1.5 dpa (that is, a ratio of 19) with Fe ions at room temperature was reported to result in an increase in the number density of loops from 0.51 × 10⁻⁵ nm−3 to 1.78 × 10⁻⁵ nm−3 (that is a ratio of 3.5). The loop diameter was found to increase from 3.8 nm to 4.1 nm (that is a ratio of 1.08) [23]. Comparing these reported results with the present study reveals the trends as a function of dose to be similar. More specifically, the number density of loops is slightly smaller and evolves slightly slower for the Chinese RPV steel, whereas the loop size is similar at the lower dpa level and evolves much slower. These differences may be mainly due to the different irradiation temperatures, which are known to play an important role in loop formation.
As the irradiation-induced point defects are the source of dislocation loops, we are also interested in the number density of point defects that constitute the loops and its relation to dose in this study. The ratio of those point defects (ƒp) constituting the loops between the two doses can be calculated using Equation (7). The final calculation results of ƒp are shown in Table 10.
For both materials, the ratio of the number densities of point defects between high and low doses is roughly the same as the ratio of doses. This indicates a linear increase in the number density of point defects as a function of dose. Such linear increase is not self-evident, it depends on the evolution of the sink strength. The concept of sink strength will be explained in Section 4.3. Here we can distinguish between point defect sinks that are initially present (e.g., grain boundaries, dislocations, particle–matrix interface) or added during irradiation (e.g., loops). A significant increase in the sink strength during irradiation would result in a less-than-linear increase in the number density of point defects as a function of dose. The present results, therefore, indicate that the irradiation-induced loops do not contribute substantially to the total sink strength for the relatively low doses of this study.
4.3. Comparison between ANP-6 and ANP-10
Ion-irradiation-induced microstructure for ANP-6 and ANP-10 is quite similar. In order to rationalize this finding, we make use of the concept of sink strength. Sinks include dislocations, particle-matrix interfaces, grain boundaries, etc., so the total sink strength (Stotal) combines the contributions from different types of sinks. Materials with larger total sink strengths are more irradiation resistant, which means that the irradiated materials are expected to have a lower number density of loops and less hardening. The calculation of Stotal is the linear sum of specific sink strength of dislocations (Sd), particles (Sp), and grain boundaries (Sg) [2,39,40]:
sink strength of dislocations (Sd) can be calculated as:
where Zd is the dislocation capture efficiency, for which a value of 1.2 was suggested [2]. ρ is dislocation density. Sink strength of particles (Sp) is:
where Np and dp are the number density and the average diameter of particles. Sink strength of grain boundaries (Sg) is:
where dg is the mean diameter of grains. Note that Equation (11) depends on Stotal. All the required parameters were shown in Table 4, and the final results are displayed in Table 11.
Table 11.
Calculation results of sink strength. Ranges reported for ODS alloys [41] are shown for comparison.
For ANP-6 and ANP-10, the contributions to sink strength differ substantially. ANP-6 has a higher Sd and Sg, while ANP-10 has a higher Sp contribution. These differences are partly leveled out in the total sink strength. If compared to [41], the total sink strengths for ANP-6 and ANP-10 are one order of magnitude smaller than for oxide dispersion-strengthened (ODS) Fe-Cr alloys. ODS alloys are candidate materials for next-generation reactors. The high-sink-strength ODS alloys exhibit a pronounced decrease in irradiation-induced hardening with higher Stotal [39]. At decreasing Stotal, there is no unbounded increase in the irradiation-induced hardening but a roughly constant level of the irradiation hardening, indicating that it is no longer dominated by the sinks. Thus, it is reasonable to assume that in ANP-6 and ANP-10, the total sink strength Stotal belongs to this regime of constant irradiation hardening, which is consistent with the observation of similar irradiation-induced microstructures for ANP-6 and ANP-10.
4.4. Effect of PIA
The effect of PIA at 475 °C for 3 h (high dose only) is that the number density of loops decreases and the average size of loops increases for both materials (see Table 7). The annealing effects on the number density and size of loops qualitatively agree with results reported for neutron-irradiated EUROFER97 [42] and a neutron-irradiated Fe-9Cr alloy [43]. According to [42], the loops behave in two extremely different ways during annealing: either shrinkage or coarsening. These behaviors are mainly driven by vacancy or interstitial diffusion. Whether a loop shrinks or coarsens depends on the presence or absence of external sources and sinks in the vicinity of the loop. For example, if the loops are near sinks with more vacancies, loops tend to shrink. If the loops are near sinks with more interstitials, loops tend to grow. If two or more loops are close to each other and external sources or sinks are far away, the loops could grow and merge. Therefore, all these mechanisms compete during PIA and determine the final evolution of loops during PIA, namely decrease in number density but increase in size. The qualitative agreement on the evolution of loops during PIA between the present study and the reported studies indicates that the same mechanisms operate in both cases.
Compared to the as-irradiated conditions, the observed decrease in the number density of loops together with the increase in size gives rise to a net decrease in the total number of point defects constituting the loops. The estimated net decrease amounts to roughly 44% and 17% for ANP-6 and ANP-10, respectively. In spite of large errors (see Table 7), these numbers mark a trend.
Loops are absent in the sample of ANP-10 after PIA at 550 °C for 3 h. During annealing, the loops either shrink until disappearance or coarsen until they encounter initial dislocations or grain boundaries so that loops merge into the dislocation network [2].
4.5. Comparison between Ion and Neutron Irradiation
Ref. [44] contains neutron-irradiation data for ANP-6 and ANP-10. The details of neutron irradiation are summarized in Table 12. Information on ion irradiation with low dose for ANP-6 and ANP-10 conducted in this study is also displayed. The number density and average diameter of loops in ion-irradiated samples are measured in the depth range from 0.4 to 0.6 µm, which is in the “safe zone” where there are almost no injected ions. At comparable dose levels, the size of loops is almost the same, but the number density for ion-irradiated samples is significantly higher (by at least one order of magnitude) than for the neutron-irradiated samples.
Table 12.
Comparison of neutron irradiation and ion irradiation at “safe zone”.
The much higher number density of loops for ion irradiation can be tentatively explained as detailed below. The rate of change of the concentrations of vacancies and interstitials, Cv and Ci, is described by Equations (12) and (13), respectively [45,46].
At steady state, the left-hand sides of Equations (12) and (13) are equal to 0. Gv and Gi are generation rates of free vacancies and interstitials due to irradiation, both are proportional to the dose rate. R is the recombination parameter, which is related to the diffusivity of vacancies and interstitials, Dv and Di, respectively. Kv and Ki represent the reaction parameter of vacancies and interstitials absorbed by sinks. Kv and Ki are related to the diffusivities Dv and Di and sink strengths for both defects. The second term on the right-hand sides describes the recombination of vacancies and interstitials. The third term quantifies the point defect absorption by sinks. An increase in dose rate increases the generation rate of point defects (first term) but does not change the second and third term. Thus, the total concentration of point defects at a steady state will also increase with increasing dose rate. Irradiation-induced point defects are the source of dislocation loops. Therefore, at comparable dose levels, ion irradiation with a higher dose rate gives rise to a higher number density of dislocation loops than neutron irradiation, which qualitatively explains the experimental results obtained in the present study. A quantitative description of dose rate effects on the number density of loops would require a more complete rate theory model [47], which is beyond the scope of the present study.
5. Conclusions
In this study, the microstructures of unirradiated, as-irradiated, and post-irradiation annealed RPV base metal and weld were characterized using different electron microscopy techniques. The initial microstructure was acquired to calculate both the yield stress and the sink strength. Ion irradiations with displacement damage of 0.1 dpa and 1 dpa at the depth of 0.5 μm were performed to investigate the irradiation-induced dislocation loops as a function of depth. The number density and size of loops were compared with results reported for the same materials irradiated with neutrons. Post-irradiation annealing was conducted to analyze the stability of the loops. The major findings are listed below:
- The yield stress calculated from the measured initial dislocation density, grain size, and number density of particles agrees well with the measured yield stress for both ANP-6 (~1% deviation) and ANP-10 (~10% deviation).
- The number densities of irradiation-induced loops peak close to the depths of maximum injected interstitials. The regions around the peaks have a band-like appearance. In the depth range between the surface and the band, loops are preferentially located close to point-defect sinks (line dislocations, grain boundaries, precipitates). The loop size does not strongly depend on depth.
- Both the number density and size of irradiation-induced loops increase as functions of dose in such a way that the number density of point defects constituting the loops is linearly related to dose.
- For the 1 dpa irradiations of both materials, we have found ½ <111>- and <001>-type loops. In both materials, <001>-type loops are dominant representing approximately 70% of all loops.
- The total sink strengths calculated from the initial microstructures for ANP-6 and ANP-10 are both small (as compared to ODS steels) and comparable, which is consistent with the observation of similar irradiation-induced microstructures.
- PIA at 475 °C for 3 h leads to a reduction in the number density but an increase in the average diameter of loops for both materials in such a way that the total number of point defects constituting the loops decreases. PIA at 550 °C for 3 h carried out for ANP-10 completely removes irradiation-induced loops.
- The number density and size of loops representative of the zone between the surface and the band (safe zone) were compared with results reported for the same materials irradiated with neutrons. At comparable dose levels, the size of dislocation loops is almost the same for ion and neutron irradiation. The number density of loops for the ion-irradiated samples is significantly higher (by at least one order of magnitude) than for the neutron-irradiated samples. This is related to the higher dose rate of ion irradiation as compared to neutron irradiation.
Author Contributions
Conceptualization: F.B., P.C. and L.L.; Methodology: L.L., P.C., J.-E.B. and S.A.; Software: P.C.; Validation: L.L. and P.C.; Formal analysis: L.L., P.C. and F.B.; Investigation: L.L., P.C., and S.A.; Data curation: L.L. and P.C.; Writing—original draft preparation: L.L.; Writing—review and editing, L.L., P.C., F.B., J.-E.B. and S.A.; Supervision: P.C. and F.B.; Project administration: F.B. and P.C.; Funding acquisition: F.B. All authors have read and agreed to the published version of the manuscript.
Funding
This research was funded by project ENTENTE, Euratom research and training programme 2019/2020 under grant agreement No. 900018.
Data Availability Statement
Not applicable.
Acknowledgments
We acknowledge the funding by the ENTENTE project. We are grateful to Vanessa Reinke for the preparation of traditional TEM samples; Wolfgang Webersinke for annealing treatment; Hans-Jürgen Engelmann for the preparation of FIB samples; and Cornelia Kaden, Karin Vogel, and René Hübner for the TEM discussion. Support by the Structural Characterization Facilities Rossendorf at IBC is gratefully acknowledged.
Conflicts of Interest
The authors declare no conflict of interest.
References
- Ballesteros, A.; Brumovský, M.; Davies, L.M.; Debarberis, L.; Jumel, S.; Kang, K.S.; Kryukov, A.; Kupca, L.; Langer, R.; Lott, R.; et al. Integrity of Reactor Pressure Vessels in Nuclear Power Plants: Assessment of Irradiation Embrittlement Effects in Reactor Pressure Vessel Steels; International Atomic Energy Agency: Vienna, Austria, 2009. [Google Scholar]
- Was, G.S. Fundamentals of Radiation Materials Science: Metals and Alloys; Springer: New York, NY, USA, 2016. [Google Scholar]
- Yuya, H.; Yabuuchi, K.; Kimura, A. Radiation embrittlement of clad-HAZ of RPV of a decommissioned BWR plant. J. Nucl. Mater. 2021, 557, 153300. [Google Scholar] [CrossRef]
- Rabung, M.; Kopp, M.; Gasparics, A.; Vértesy, G.; Szenthe, I.; Uytdenhouwen, I.; Szielasko, K. Micromagnetic characterization of operation-induced damage in charpy specimens of RPV steels. Appl. Sci. 2021, 11, 2917. [Google Scholar] [CrossRef]
- Kolluri, M.; ten Pierick, P.; Bakker, T.; Straathof, B.; Magielsen, A.; Szaraz, Z.; D’Agata, E.; Ohms, C.; Martin, O. Influence of Ni-Mn contents on the embrittlement of PWR RPV model steels irradiated to high fluences relevant for LTO beyond 60 years. J. Nucl. Mater. 2021, 553, 153036. [Google Scholar] [CrossRef]
- Hata, K.; Takamizawa, H.; Hojo, T.; Ebihara, K.; Nishiyama, Y.; Nagai, Y. Grain-boundary phosphorus segregation in highly neutron-irradiated reactor pressure vessel steels and its effect on irradiation embrittlement. J. Nucl. Mater. 2021, 543, 152564. [Google Scholar] [CrossRef]
- Kočík, J.; Keilova, E.; Čížek, J.; Prochazka, I. TEM and PAS study of neutron irradiated VVER-type RPV steels. J. Nucl. Mater. 2002, 303, 52–64. [Google Scholar] [CrossRef]
- Meslin, E.; Lambrecht, M.; Hernández-Mayoral, M.; Bergner, F.; Malerba, L.; Pareige, P.; Radiguet, B.; Barbu, A.; Gómez-Briceño, D.; Ulbricht, A. Characterization of neutron-irradiated ferritic model alloys and a RPV steel from combined APT, SANS, TEM and PAS analyses. J. Nucl. Mater. 2010, 406, 73–83. [Google Scholar] [CrossRef]
- Hernández-Mayoral, M.; Gómez-Briceño, D. Transmission electron microscopy study on neutron irradiated pure iron and RPV model alloys. J. Nucl. Mater. 2010, 399, 146–153. [Google Scholar] [CrossRef]
- Sprouster, D.; Sinsheimer, J.; Dooryhee, E.; Ghose, S.; Wells, P.; Stan, T.; Almirall, N.; Odette, G.; Ecker, L. Structural characterization of nanoscale intermetallic precipitates in highly neutron irradiated reactor pressure vessel steels. Scr. Mater. 2016, 113, 18–22. [Google Scholar] [CrossRef]
- Fujita, T.; Hirabayashi, J.; Katayama, Y.; Kano, F.; Watanabe, H. Contribution of dislocation loop to radiation-hardening of RPV steels studied by STEM/EDS with surveillance test pieces. J. Nucl. Mater. 2022, 572, 154055. [Google Scholar] [CrossRef]
- Carter, M.; Gasparrini, C.; Douglas, J.O.; Riddle, N.; Edwards, L.; Bagot, P.A.; Hardie, C.D.; Wenman, M.R.; Moody, M.P. On the influence of microstructure on the neutron irradiation response of HIPed SA508 steel for nuclear applications. J. Nucl. Mater. 2022, 559, 153435. [Google Scholar] [CrossRef]
- Naziris, F.; Kolluri, M.; Bakker, T.; Hageman, S.; Petrosyan, V.; Petrosyan, A.; Sevikyan, G. Mechanical properties and microstructure of VVER 440 RPV steels irradiated to extremely high fluences and the effect of recovery annealing. J. Nucl. Mater. 2021, 551, 152951. [Google Scholar] [CrossRef]
- Kolluri, M.; Martin, O.; Naziris, F.; D’Agata, E.; Gillemot, F.; Brumovsky, M.; Ulbricht, A.; Autio, J.; Shugailo, O.; Horvath, A. Structural MATerias research on parameters influencing the material properties of RPV steels for safe long-term operation of PWR NPPs. Nucl. Eng. Des. 2023, 406, 112236. [Google Scholar] [CrossRef]
- Jiao, Z.; Michalicka, J.; Was, G. Self-ion emulation of high dose neutron irradiated microstructure in stainless steels. J. Nucl. Mater. 2018, 501, 312–318. [Google Scholar] [CrossRef]
- Xu, S.; Yao, Z.; Jenkins, M. TEM characterisation of heavy-ion irradiation damage in FeCr alloys. J. Nucl. Mater. 2009, 386, 161–164. [Google Scholar] [CrossRef]
- Taller, S.; VanCoevering, G.; Wirth, B.D.; Was, G.S. Predicting structural material degradation in advanced nuclear reactors with ion irradiation. Sci. Rep. 2021, 11, 2949. [Google Scholar] [CrossRef] [PubMed]
- Was, G.; Jiao, Z.; Getto, E.; Sun, K.; Monterrosa, A.; Maloy, S.; Anderoglu, O.; Sencer, B.; Hackett, M. Emulation of reactor irradiation damage using ion beams. Scr. Mater. 2014, 88, 33–36. [Google Scholar] [CrossRef]
- Bai, X.; Han, Y.; Liaw, P.K.; Wei, L. Effect of Ion Irradiation on Surface Microstructure and Nano-Hardness of SA508-IV Reactor Pressure Vessel Steel. J. Mater. Eng. Perform. 2022, 31, 1981–1990. [Google Scholar] [CrossRef]
- Iwata, K.; Takamizawa, H.; Ha, Y.; Shimodaira, M.; Okamoto, Y.; Honda, M.; Katsuyama, J.; Nishiyama, Y. EXAFS studies for atomic structural change induced by ion irradiation of a reactor pressure vessel steel. Nucl. Instrum. Methods Phys. Res. Sect. B Beam Interact. Mater. At. 2022, 511, 143–152. [Google Scholar] [CrossRef]
- Gasparrini, C.; Xu, A.; Short, K.; Wei, T.; Davis, J.; Palmer, T.; Bhattacharyya, D.; Edwards, L.; Wenman, M. Micromechanical testing of unirradiated and helium ion irradiated SA508 reactor pressure vessel steels: Nanoindentation vs in-situ microtensile testing. Mater. Sci. Eng. A 2020, 796, 139942. [Google Scholar] [CrossRef]
- Zinkle, S.; Snead, L. Opportunities and limitations for ion beams in radiation effects studies: Bridging critical gaps between charged particle and neutron irradiations. Scr. Mater. 2018, 143, 154–160. [Google Scholar] [CrossRef]
- Ma, X.; Zhang, Q.; Song, L.; Zhang, W.; She, M.; Zhu, F. Microstructure Evolution of Reactor Pressure Vessel A508-3 Steel under High-Dose Heavy Ion Irradiation. Crystals 2022, 12, 1091. [Google Scholar] [CrossRef]
- Ding, Z.; Han, X.; Yang, Y.; Chen, Y.; Zhang, X.; Niu, M.; Zhang, C.; Liu, X.; Xue, F. Characterization of microstructures and mechanical property of Fe-ion-irradiated China A508-3 steel. Nucl. Instrum. Methods Phys. Res. Sect. B Beam Interact. Mater. At. 2021, 504, 14–20. [Google Scholar] [CrossRef]
- Fujii, K.; Fukuya, K. Characterization of defect clusters in ion-irradiated A533B steel. J. Nucl. Mater. 2005, 336, 323–330. [Google Scholar] [CrossRef]
- Watanabe, H.; Masaki, S.; Masubuchi, S.; Yoshida, N.; Kamada, Y. Radiation induced hardening of ion irradiated RPV steels. J. Nucl. Mater. 2011, 417, 932–935. [Google Scholar] [CrossRef]
- Stoller, R.E.; Toloczko, M.B.; Was, G.S.; Certain, A.G.; Dwaraknath, S.; Garner, F.A. On the use of SRIM for computing radiation damage exposure. Nucl. Instrum. Methods Phys. Res. Sect. B Beam Interact. Mater. At. 2013, 310, 75–80. [Google Scholar] [CrossRef]
- Eyre, B.; Bullough, R. On the formation of interstitial loops in bcc metals. Philos. Mag. 1965, 12, 31–39. [Google Scholar] [CrossRef]
- Hernández-Mayoral, M.; Heintze, C.; Oñorbe, E. Transmission electron microscopy investigation of the microstructure of Fe–Cr alloys induced by neutron and ion irradiation at 300 °C. J. Nucl. Mater. 2016, 474, 88–98. [Google Scholar] [CrossRef]
- Hein, H. Deliverable of Euratom Project SOTERIA, D3.5—Set of Guidelines on Use of Experiments Carried Out in WP3, Grant Agreement No. 661913, 2019. Framatome GmbH, Erlangen, Germany.
- Iza-Mendia, A.; Gutiérrez, I. Generalization of the existing relations between microstructure and yield stress from ferrite–pearlite to high strength steels. Mater. Sci. Eng. A 2013, 561, 40–51. [Google Scholar] [CrossRef]
- Chauhan, A.; Bergner, F.; Etienne, A.; Aktaa, J.; De Carlan, Y.; Heintze, C.; Litvinov, D.; Hernandez-Mayoral, M.; Oñorbe, E.; Radiguet, B. Microstructure characterization and strengthening mechanisms of oxide dispersion strengthened (ODS) Fe-9% Cr and Fe-14% Cr extruded bars. J. Nucl. Mater. 2017, 495, 6–19. [Google Scholar] [CrossRef]
- Dadé, M.; Malaplate, J.; Garnier, J.; De Geuser, F.; Barcelo, F.; Wident, P.; Deschamps, A. Influence of microstructural parameters on the mechanical properties of oxide dispersion strengthened Fe-14Cr steels. Acta Mater. 2017, 127, 165–177. [Google Scholar] [CrossRef]
- Monnet, G. Multiscale modeling of irradiation hardening: Application to important nuclear materials. J. Nucl. Mater. 2018, 508, 609–627. [Google Scholar] [CrossRef]
- Praud, M.; Mompiou, F.; Malaplate, J.; Caillard, D.; Garnier, J.; Steckmeyer, A.; Fournier, B. Study of the deformation mechanisms in a Fe–14% Cr ODS alloy. J. Nucl. Mater. 2012, 428, 90–97. [Google Scholar] [CrossRef]
- Ghosh, G.; Olson, G. The isotropic shear modulus of multicomponent Fe-base solid solutions. Acta Mater. 2002, 50, 2655–2675. [Google Scholar] [CrossRef]
- Stoller, R.; Zinkle, S. On the relationship between uniaxial yield strength and resolved shear stress in polycrystalline materials. J. Nucl. Mater. 2000, 283, 349–352. [Google Scholar] [CrossRef]
- Foreman, A.; Makin, M. Dislocation movement through random arrays of obstacles. Philos. Mag. 1966, 14, 911–924. [Google Scholar] [CrossRef]
- Zinkle, S.J.; Snead, L.L. Designing radiation resistance in materials for fusion energy. Annu. Rev. Mater. Res. 2014, 44, 241–267. [Google Scholar] [CrossRef]
- Odette, G.; Alinger, M.; Wirth, B. Recent developments in irradiation-resistant steels. Annu. Rev. Mater. Res. 2008, 38, 471–503. [Google Scholar] [CrossRef]
- Duan, B.; Heintze, C.; Bergner, F.; Ulbricht, A.; Akhmadaliev, S.; Oñorbe, E.; de Carlan, Y.; Wang, T. The effect of the initial microstructure in terms of sink strength on the ion-irradiation-induced hardening of ODS alloys studied by nanoindentation. J. Nucl. Mater. 2017, 495, 118–127. [Google Scholar] [CrossRef]
- Chauhan, A.; Yuan, Q.; Dethloff, C.; Gaganidze, E.; Aktaa, J. Post-irradiation annealing of neutron-irradiated EUROFER97. J. Nucl. Mater. 2021, 548, 152863. [Google Scholar] [CrossRef]
- Yuan, Q.; Chauhan, A.; Gaganidze, E.; Aktaa, J. Direct observation of dislocation loops shrinkage upon annealing neutron-irradiated Fe–9Cr alloy. J. Nucl. Mater. 2020, 542, 152401. [Google Scholar] [CrossRef]
- Ulbricht, A.; Hernandez-Mayoral, M.; Onorbe, E.; Etienne, A.; Radiguet, B.; Hirschmann, E.; Wagner, A.; Hein, H.; Bergner, F. Effect of Neutron Flux on an Irradiation-Induced Microstructure and Hardening of Reactor Pressure Vessel Steels. Metals 2022, 12, 369. [Google Scholar] [CrossRef]
- Mansur, L. Correlation of neutron and heavy-ion damage: II. The predicted temperature shift if swelling with changes in radiation dose rate. J. Nucl. Mater. 1978, 78, 156–160. [Google Scholar] [CrossRef]
- Mansur, L. Theory of transitions in dose dependence of radiation effects in structural alloys. J. Nucl. Mater. 1993, 206, 306–323. [Google Scholar] [CrossRef]
- Duparc, A.H.; Moingeon, C.; Smetniansky-de-Grande, N.; Barbu, A. Microstructure modelling of ferritic alloys under high flux 1 MeV electron irradiations. J. Nucl. Mater. 2002, 302, 143–155. [Google Scholar] [CrossRef]
Disclaimer/Publisher’s Note: The statements, opinions and data contained in all publications are solely those of the individual author(s) and contributor(s) and not of MDPI and/or the editor(s). MDPI and/or the editor(s) disclaim responsibility for any injury to people or property resulting from any ideas, methods, instructions or products referred to in the content. |
© 2023 by the authors. Licensee MDPI, Basel, Switzerland. This article is an open access article distributed under the terms and conditions of the Creative Commons Attribution (CC BY) license (https://creativecommons.org/licenses/by/4.0/).