Article

Investigation on the Effect of Mesomixing on Crystal Quality during Antisolvent Crystallization of Nd2(SO4)3·8H2O

by
Tinjombo Octavious Baloyi
,
Jemitias Chivavava
and
Alison Emslie Lewis
*
Department of Chemical Engineering, University of Cape Town, Rondebosch, Cape Town 7700, South Africa
*
Author to whom correspondence should be addressed.
Metals 2023, 13(8), 1378; https://doi.org/10.3390/met13081378
Submission received: 20 June 2023 / Revised: 19 July 2023 / Accepted: 26 July 2023 / Published: 31 July 2023
(This article belongs to the Section Extractive Metallurgy)

Abstract

:
Rare earth elements (REEs) are essential for permanent magnets that are vital for wind turbines and electric vehicles motors (EV), and are also used in a range of high-tech devices such as smartphones, digital cameras, and electronic displays. Nickel metal hydride (NiMH) batteries have been identified as a potential source due to their short lifespans and an anticipated boom in the production of EV. The aim of this study was to investigate the effect of mesomixing on crystal quality in a non-confined impinging jet mixer (NCIJM) during antisolvent crystallization of 3.2 g/L Nd2(SO4)3 from a synthetic leach solution of NiMH battery using ethanol at an O/A ratio of 1.1. The jet streams were supplied at a Reynolds number (Re) between 7500 and 15,000. The product slurry was allowed to further crystallize in a stirred batch crystallizer at a Re of 13,000 for 45 s. An average yield of 90% was achieved. Laser diffraction and scanning electron microscopy (SEM) were used for size analysis. The initial results were inconclusive due to the secondary mixing effect in the stirred batch crystallizer. Therefore, the experiments were repeated, and samples were collected immediately after mixing in the NCIJM onto a porous grid placed on a high absorbance filter paper to abruptly halt crystallization. The samples were analysed using a transmission electron microscope (TEM), and the acquired images were processed using ImageJ to obtain crystal size distributions (CSDs). It was found that the enhanced mesomixing conditions resulted in smaller crystal sizes and narrower CSDs. This was because the nucleation rate was found to be mass-transfer-limited, such that higher mesomixing intensities promoted the nucleation rate from 6 × 10¹² to 5 × 10¹³ m−3 s−1 and, therefore, favoured the formation of smaller crystals. In parallel, intensified mesomixing resulted in uniform distribution of the supersaturation and, hence, narrowed the CSDs.

1. Introduction

Rare earth elements (REEs) are a group of 17 metallic elements made up of 15 lanthanides, as well as yttrium and scandium. They are essential for permanent magnets that are vital for wind turbines and EV motors and are also used in a range of devices such as smartphones, digital cameras, computer hard disks, fluorescent and light-emitting-diode (LED) lights, flat-screen televisions, computer monitors, and electronic displays. REEs are primarily produced from monazite sand, xenotime, bastnasite, and phosphate rock [1]. They are recovered through a combination of methods, including leaching, solvent extraction, ion exchange, and precipitation. There have been growing demands for these elements due to the expansion of their applications, especially in the energy transition sector. Consequently, there is a view that the global supply is at a substantial risk and, thus, the metals are listed as critical elements [2].
There are efforts to recover these elements from end-of-life products such as fluorescent lamps, permanent magnets, and metal hydride batteries [3]. The recovery of REEs from the leachates of nickel metal hydride (NiMH) batteries using crystallization methods has been the subject of recent research [4,5]. NiMH batteries are prone to a short lifespan (2 years) and have been identified as a potential secondary source for REEs.
Antisolvent crystallization is a precipitation process based on altering the solubility of the solute in an aqueous solution by adding a water-miscible organic solvent and creating a supersaturated solution, thus causing target salts to precipitate out. The precipitation process is characterized by high yields, fast kinetics, and high supersaturation levels, where the nucleation process predominates over the crystal growth [6]. This often leads to concentration gradients within the precipitation reactor, with locally steep supersaturation gradients near the inlet points. Thus, the process is carried out under mixing-limited conditions [6]. This results in very fine crystals, impure agglomerates, as well as other unexpected polymorphs and amorphous phases [6]. Therefore, mixing and hydrodynamics play a role in product quality.
How reactants are mixed can greatly influence the product distribution of a chemical reaction [7]. The reaction occurs on a molecular scale; therefore, micromixing always needs to be considered. However, mesomixing and macromixing can be controlling as well, since fast reactions are generally localized nearer to the feed points where mesomixing can be slower than micromixing, hence rate-limiting. Micromixing provides homogeneity on a molecular scale, i.e., molecular diffusion. Baldyga and Bourne [8] modelled and interpreted micromixing in terms of molecular diffusion and small-scale fluid motions using information about the turbulent flow.
Previous studies have shown that the mixing intensity can negatively or positively impact the crystal sizes and CSDs, depending on the system under investigation [9,10,11,12,13,14]. Poor crystal qualities, i.e., very fine particle sizes and leaf- or plate-like morphology, are undesirable during the solid–liquid separation process due to poor settleability and filterability [15]. It is, therefore, important to investigate the effect of hydrodynamics on crystal quality to understand the underlying principles that will help to achieve crystals with desirable properties. The aim of this work was to investigate the effect of mixing intensity on crystal sizes and CSDs during antisolvent crystallization of REEs from a NiMH battery synthetic leach liquors in a non-confined impinging jet mixer (NCIJM) crystallizer. Impinging fluid jet streams are applied in continuous crystallization processes to achieve high-intensity micromixing of the fluid streams in a turbulent regime, such that a homogeneous composition is formed before the start of nucleation [16]. This allows for the crystallization of particles with high surface areas, high purity, and stability.
Neodymium sulphate was chosen as the model system because it is relevant in the production of permanent magnets used in electronics. It has also been used in previous research and, therefore, offers a basis for comparison. Korkmaz and co-workers [4] recovered REEs from a leachate of a discharged Panasonic prismatic NiMH battery module using antisolvent crystallization. Ethanol and 2-propanol were used as antisolvents. The battery was manually stripped, and the anode active material containing the REEs was leached in 2 mol/L H 2 S O 4 at 25 °C under atmospheric pressure. The leach liquor contained a mixture of metals, including Ni, La, Co, Mn, Al, Y, Ce, Pr, and Nd. About 1.5 g/L of elemental Nd was present (3 g/L of N d 2 ( S O 4 ) 3 ). Therefore, for this work, N d 2 ( S O 4 ) 3 at a concentration of 3.2 g/L was used as a model system. Ethanol was selected as the antisolvent. Ethanol was chosen over 2-propanol due to its higher dielectric constant to control the degree of supersaturation.

2. Experimental Setup and Procedure

2.1. Thermodynamic Modelling

The solubility, yield, and other thermodynamic properties of the N d 2 ( S O 4 ) 3 C 2 H 5 O H H 2 O ternary system were modelled using the OLI Stream Analyser [17], a thermodynamic modelling software package, which uses the revised Helgeson–Kirkham–Flowers (HKF) model for the calculation of standard thermodynamic properties of aqueous species and the frameworks of Bromley, Zemaitis, Pitzer, Debye-Huckel, and others for the excess terms.

2.2. Leach Liquor Preparation

The synthetic leach liquor was prepared from 99.9% pure neodymium sulphate octahydrate ( N d 2 ( S O 4 ) 3 · 8 H 2 O a q ), purchased from Thermo Fischer Scientific (Whaltam, MA, USA). Deionized water was used to prepare all solutions, and 99.9% ethanol purchased from Kimix was used as the antisolvent. All chemicals and reagents were used as supplied/received. Alcohol-compatible 0.22 µ m nylon membrane filters were purchased from Lasec. The feed solution was prepared by dissolving 4 g of N d 2 ( S O 4 ) 3 · 8 H 2 O in 1 L of deionized water. The resulting solution was stirred at 350 RPM for 48 hrs, and a negligible amount of residue was filtered in a 0.22 µ m nylon membrane filter and transferred into a reagent bottle for storage. A sample was collected and sent for inductively coupled plasma mass spectroscopy (ICP) elemental analysis.

2.3. Measurement Techniques

The inertial convective subrange describes the largest eddies encountered in the system. Macromixing in this subrange gives rise to vorticity, where the segregation of concentration is reduced towards the Kolmogorov scale ( λ K ) . The size of the smallest eddies in turbulent flows is determined by the viscosity, and the Kolmogorov microscale, where kinetic energy is dissipated through heat ( λ K ) is defined as follows [18]:
λ K = ν 3 ε 1 4
where ν is the kinematic viscosity (m2 s−1) and ε (m2 s−3) is the turbulent energy dissipation rate.
Mesomixing is the intermediate mixing time scale between the bulk circulation and the micromixing, and it occurs because of turbulent diffusion and inertial convection. Mesomixing is more evident in the feed pipe scale, where it describes the turbulent exchange of fresh feed with the surrounding environment. The formation of the diffusion profile is characterized by the turbulent diffusion mechanism [19]:
τ D = Q f e e d u ¯ D T
where τ D is the characteristic time for turbulent dispersion (s), Q f e e d is the volumetric flow rate of the feed to the system (m3 s−1), u ¯ is the magnitude of the velocity in the region of the feed pipe (ms−1), and D T is the turbulent diffusivity (m2 s−1).
The contribution of inertial convection to mesomixing is characterized as follows [7]:
τ S = A Ʌ C 2 3 ε 1 3
where τ S is the time scale for dissipation of segregation in inertial–convective subrange (s); A is a factor between 1 to 2; and Ʌ c is the integral scale of concentration fluctuation (m), equal to the jet diameter [20].
As the Kolmogorov length scales are approached, the viscous forces become dominant and rapidly reduce the vorticity in a process of exponential decay until it returns to its isotropic state [8], after which it is set in rotation by local strain forces. In this way, laminar structures are formed due to vorticity stretching in the viscous convective subrange. These laminar structures give rise to steep concentration gradients between the fluids to be mixed, which lead to molecular diffusion. Therefore, macromixing and mesomixing set the conditions under which the micromixing takes place. Vorticity causes engulfment of one fluid by another, where the fluid elements deform because of shear and elongation, causing kinetic energy to be dissipated through heat. The heat then accelerates molecular diffusion. When deformation and diffusion are not rate-limiting, the engulfment time constant, τ E , describes the viscous–convective part of the concentration spectrum [21]:
τ E = 1 E = 17.24 υ ε 1 2
where τ E is the time constant due to engulfment (s) and E is the engulfment rate (s−1).
In the viscous diffusive subrange, where the molecular diffusion is important, the time constant due to molecular diffusion ( τ G ) is described as [22]:
τ G = τ E 0.030 + 17.050 S C 1
where S C is the dimensionless Schmidt number.
Mahajan and Kirwan [10] and Johnson and Prud’homme [23] modelled τ m , the micromixing time (s), as diffusion across a slab of thickness equal to Kolmogorov length ( λ K ) which was subject to the mixing energy input into the system:
τ m =   ( 0.5 λ K ) 2 D
where D is molecular diffusivity (m2 s−1) [10,24]. As shown in Equation (1), λ K is inversely proportional to the rate of energy dissipation per unit mass. Therefore, the higher the rate of energy dissipation in the mixing volume V m , the smaller λ K becomes, leading to faster micromixing. The energy dissipation rate per unit mass is expressed as the power input P (W) into the system over the mass in which energy is dissipated:
ε = P ρ V m
where ρ   is the fluid density (kgm−3) and V m is the molecular volume (m3). It is assumed that the energy is dissipated homogeneously and that the λ K characterizes all striations leaving the mixing volume [23]. This model does not consider the laminar stretching phenomena which would further reduce the characteristic length over which the diffusion takes place [25].
The power input (kgm2 s−3) into the system can be formulated from the rate of kinetic energy input of each stream, expressed as mass flow rate m (kgs−1) and the incoming stream velocity u (ms−1).
P = 1 2 m A u A 2 + 1 2 m O u O 2
The diffusion time constant can be simplified as [10]:
τ m = ρ ¯ v ¯ d O V m ρ O v O 3 R e O 3 1 + m O m A 0.5
where subscripts A and O represents the aqueous and organic phases, respectively. ρ ¯ is the density of the product stream (kgm−3), ν ¯ is the kinematic viscosity of the product stream (m2 s−1), and d is the jet diameter of the feed stream (m).
A laser diffraction technique (Malvern Mastersizer 2000) was used to measure the PSD of the suspension. Scanning electron microscopy (SEM) and transmission electron microscopy (TEM) were used to capture images for morphology studies. ImageJ [26] was used to estimate the equivalent diameter of particles from the TEM images, where random samples from the same experiment were selected and analysed. The minimum total particle count per data set was 1000, including repeats. The mean crystal size was defined as the arithmetic mean of the crystal sizes. The width of the PSD, the span (-), was estimated using Equation (10) [27]:
S p a n =   d 90 d 10 d 50
where d 10 , d 50 , and d 90 represent the cut sizes at 10, 50, and 90 percent passing, respectively.
The system’s supersaturation, S a m (-), was quantified from Equation (11), where the equilibrium concentration was determined from the experiments. The activity coefficients were estimated using OLI Stream Analyzer [17].
S a m = γ i c i v i K S P
where c ( k g solute per k g or m 3 solvent) is the concentration of the solute in a solvent. K S P ( M v ) is the solubility product of the solid, v is the number of ions in the solution, and i represent the type of species. The activity coefficients were estimated using OLI Stream Analyzer [17].
Inductively coupled plasma mass spectroscopy (ICP) analysis was used to identify elemental neodymium ( N d ) and its concentrations in the solution. The number of crystals ( N τ m i c r o ) , that develop over the micromixing time ( τ m i c r o (s)) by the generation of new nuclei that grow out at constant supersaturation in the micromixing volume ( V m i c r o (m3)) is expressed as [6]:
N τ m i c r o = J V m i c r o τ m i c r o
where J is the nucleation rate ( m 3 s 1 ) . N τ m i c r o was estimated by counting the number of particles from the TEM images. It was assumed that the high supersaturation was consumed during initial mixing in the micromixing volume, after which nucleation no longer took place. The induction time ( t I (s)) is given by [6]:
  t I = 1 J m i c r o V m i c r o
assuming that the system loses its metastability from the point at which the first nucleus is formed and for extremely small liquid volumes ( V m i c r o ) , such that it can only accommodate one nucleus that grows to a detectable size [6]. The mixing intensity of the system was defined as the Reynolds number ( R e ), given by:
R e = ρ D ν
where D is the jet diameter for the NCIJM and an impeller diameter for the stirred batch crystallizer.

2.4. Experimental Procedures

The initial concentration of the N d 2 ( S O 4 ) 3 was kept constant at 3.2 g/L for all the experiments. The organic-to-aqueous ( O / A ) ratio was also kept constant at 1.14. This O / A ratio was selected to conserve the momentum of the jets between the neodymium sulphate solution and ethanol in the mixing plane. All of the apparatus were washed with soap and hot water, rinsed in deionized water, and air-dried before each experiment was conducted. All the equipment was calibrated before use. All the experiments were conducted in triple replicates, and the average of the three was presented as the result.

2.4.1. Equilibrium Studies

The solubility of the neodymium sulphate in a mixture of ethanol and water at an O / A ratio of 1.14 was investigated. Proportionate amounts of 3.2 g/L N d 2 ( S O 4 ) 3 ( a q ) solution and ethanol were added for a final mixture of 25 mL. The addition was simultaneous and rapid into a stirred batch crystallizer at 23 °C and atmospheric pressure. The Reynolds number was fixed at 13,000, where a complete suspension was observed. The stirred batch crystallizer was closed with a rubber stopper immediately after the addition. The suspension was allowed to rest for 15 days, after which it was filtered in a 0.22 µ m nylon membrane filter. The filtrate was sent for ICP analysis to quantify the amount of elemental neodymium at equilibrium. Korkmaz, Alemrajabi, Rasmuson and Forsberg [4] showed that the concentration of elemental neodymium reached equilibrium after 2 h. Therefore, enough time was allocated to reach equilibrium.

2.4.2. Effect of Mixing Intensity in the Non-Confined Impinging Jet Mixer (NCIJM) Coupled with Secondary Mixing in the Stirred Batch Crystallizer on Crystal Quality

The reagent bottles were filled with 500 mL of N d 2 ( S O 4 ) 3 ( a q ) and ethanol, respectively. The pump speed was adjusted to give proportionate amounts ( O / A ratio of 1.14) of the solution and ethanol, as shown in Table 1. The pumps were started to allow the solution and the ethanol to impinge and mix in the NCIJM. The resulting product stream was bypassed from the stirred batch crystallizer until a steady state was attained after 5 residence times. The product from the NCIJM was collected in a 25 mL vial and transferred into a 50 mL stirred batch crystallizer at 350 RPM, 23 °C, and atmospheric pressure. The stirred batch crystallizer was sealed with a rubber stopper and crystallization was allowed to proceed for 45 s, after which a sample was sent for PSD analysis.
To quantify the yields, the same experiments were repeated in which the product from the stirred batch crystallizer was filtered in a 0.22 µ m nylon membrane filter and dried at 23 °C and atmospheric pressure. After 10 days, the dry mass was recorded.

2.4.3. Effect of Mixing Intensity in the NCIJM on Crystal Quality

It was found that the secondary mixing in the stirred batch crystallizer also influenced the results. Therefore, another set of experiments was designed to decouple the effect of secondary mixing occurring in the stirred batch crystallizer from intensified mixing in the NCIJM. The experimental setup is as demonstrated in Figure 1. The experimental conditions were kept constant. However, instead of transferring the NCIJM product into the stirred batch crystallizer, the samples were collected onto a porous grid on top of a high absorbance filter membrane directly after the NCIJM tube. This was carried out to completely halt the crystallization process. The residence time was kept constant by sampling at different tube lengths, as illustrated in Figure 1. The grid samples were sent for transition electron microscope (TEM) analysis.

3. Results and Discussion

3.1. Thermodynamic Modelling and Equilibrium Studies

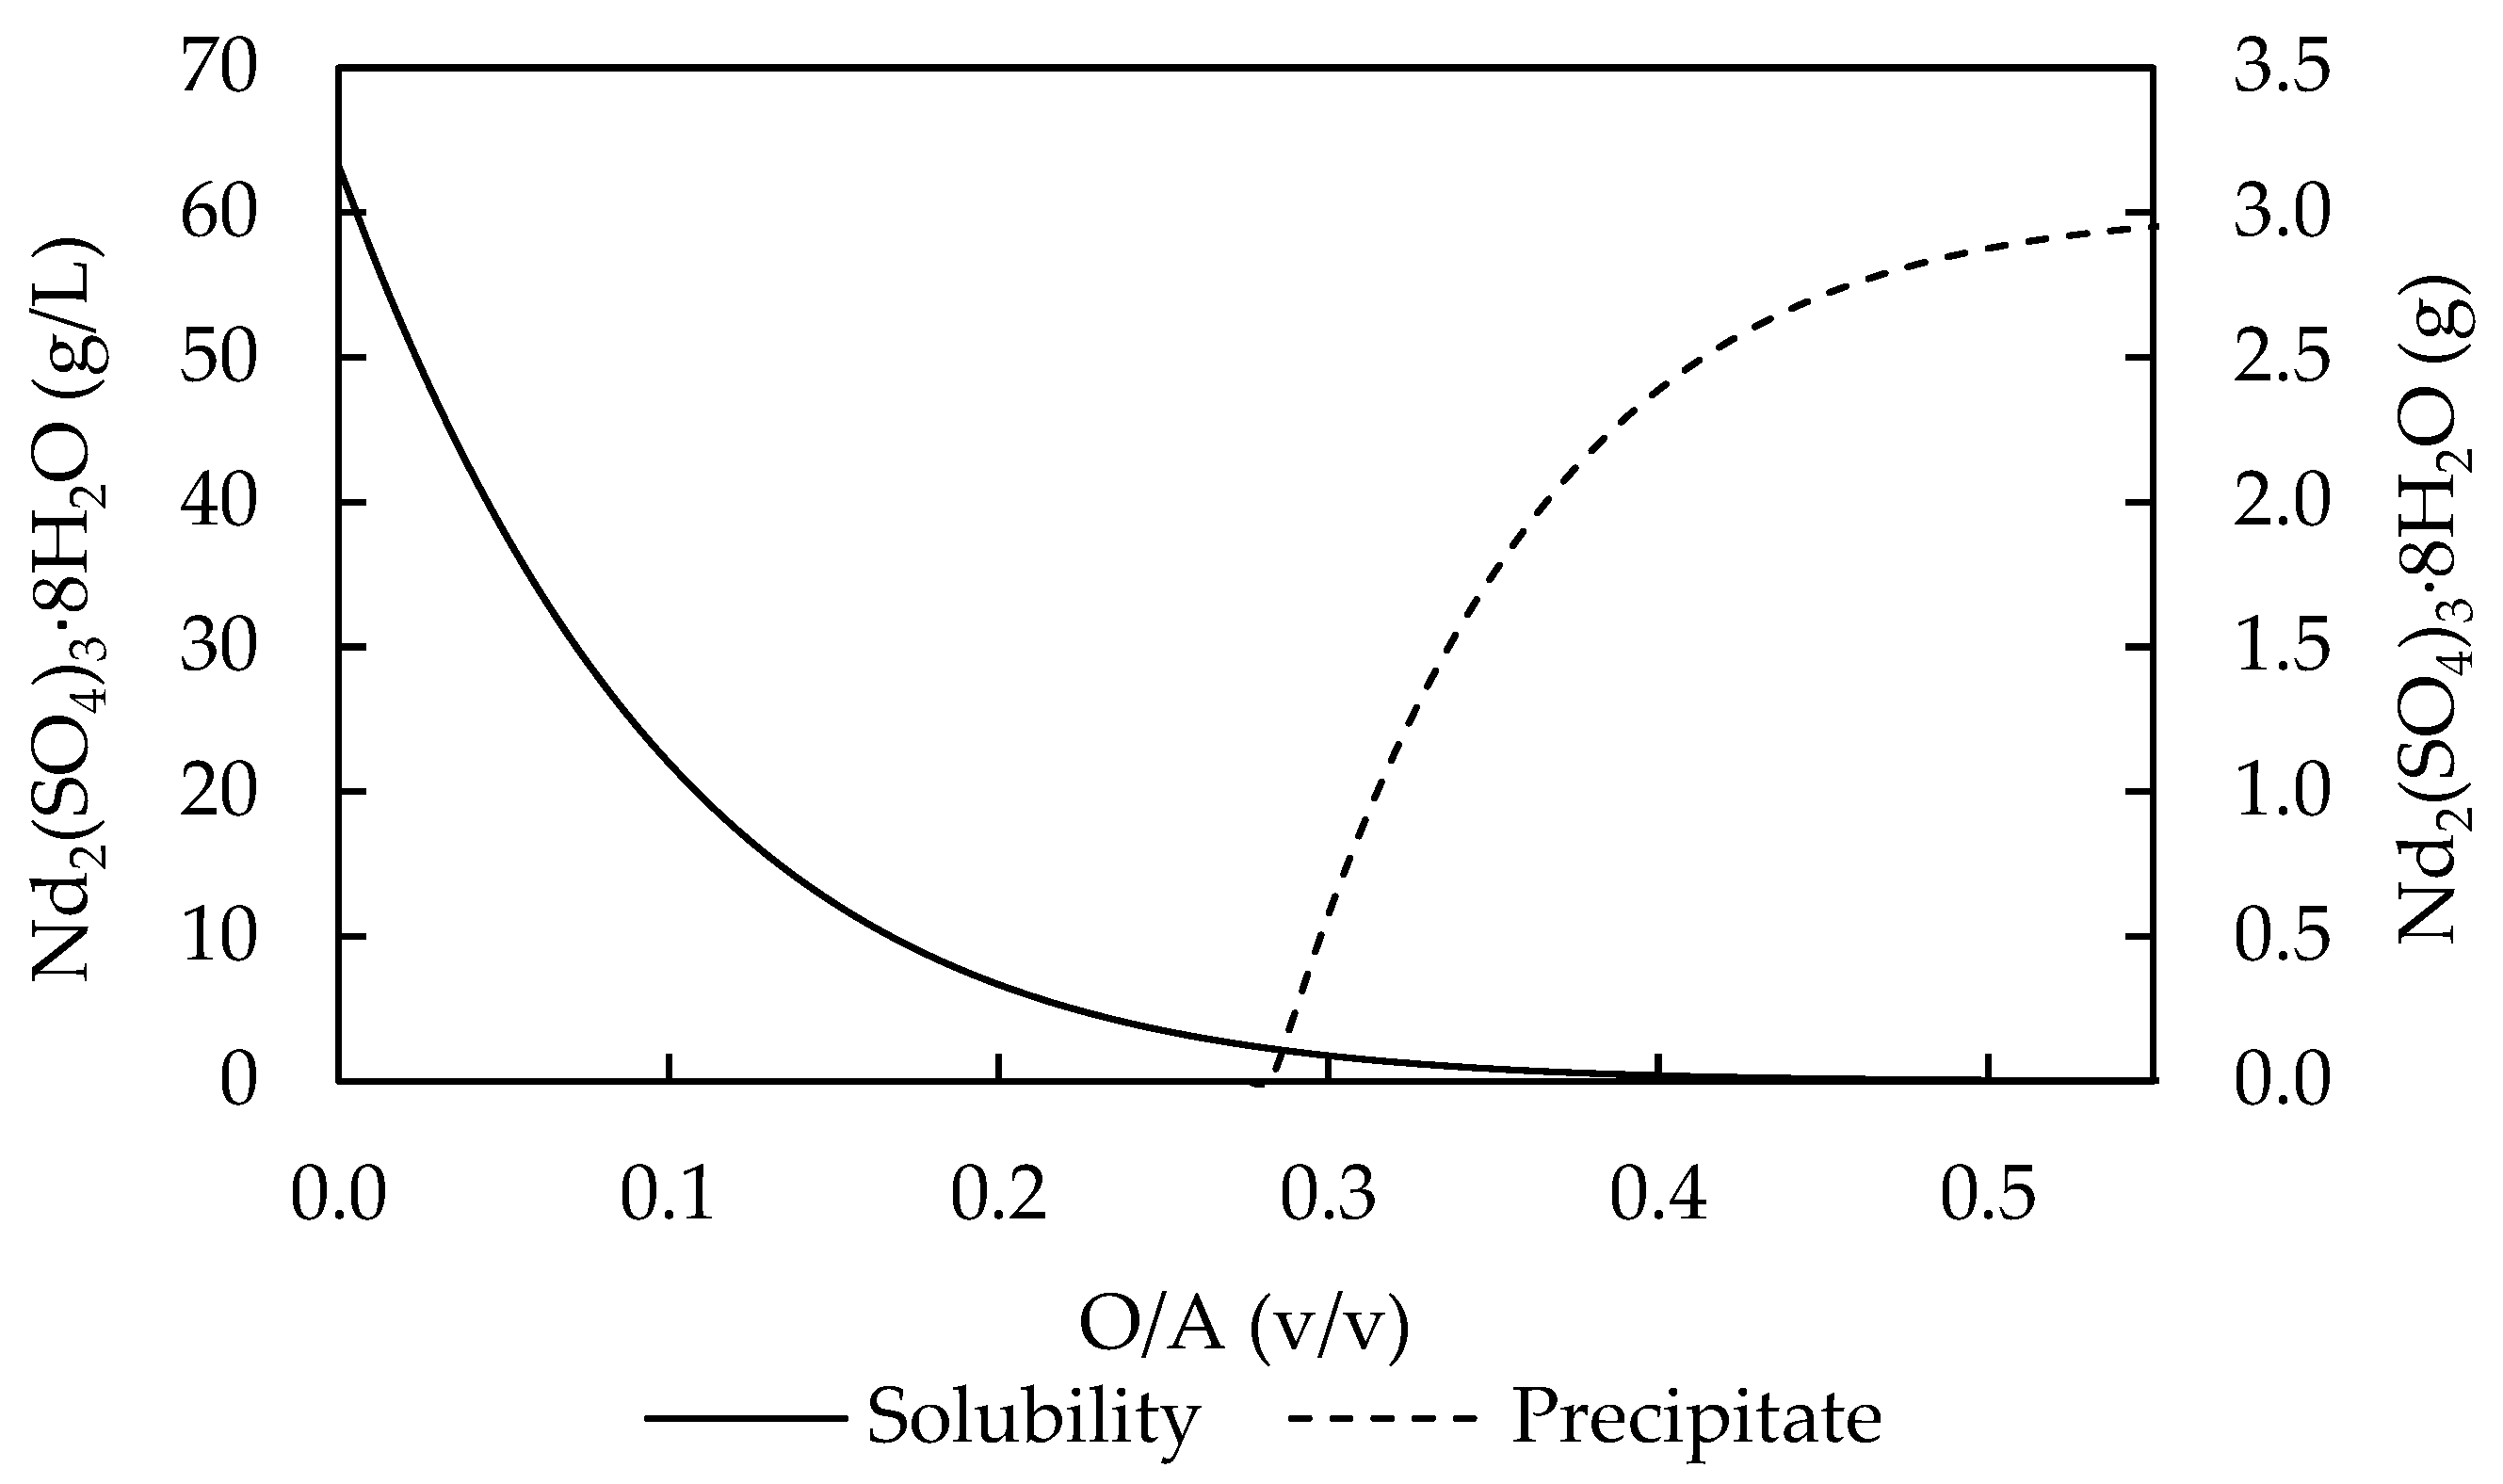
The thermodynamic properties of the N d 2 ( S O 4 ) 3 C 2 H 5 O H H 2 O ternary system were modelled at 23 °C and atmospheric pressure using an OLI Stream Analyser [17]. Figure 2 shows the solubility and mass yield of N d 2 ( S O 4 ) 3 · 8 H 2 O as a function of the O / A ratio. The solubility of N d 2 ( S O 4 ) 3 · 8 H 2 O was predicted to be about 63 g/L. It was predicted that N d 2 ( S O 4 ) 3 · 8 H 2 O ( s ) crystal would begin to form at an O / A ratio of about 0.29. A yield of over 99% was achieved at an O / A ratio of 0.58. However, in order to conserve momentum between the jet streams during collision, an O / A ratio of 1.14 was used. The OLI Stream Analyser [17] predicted an equilibrium concentration of around 7.2 × 10⁻¹⁰ g/L. Therefore, in theory, 100 % of the N d 2 ( S O 4 ) 3 · 8 H 2 O could be recovered from the solution. However, the experiments showed that the equilibrium concentration (after 15 days) of N d 2 ( S O 4 ) 3 in solution was 64 ± 3 mg/L, yielding approximately 97%. A solubility product ( K s p ) of 1.5 × 10⁻¹⁹ was estimated from the experimental results, showing a supersaturation level of 1.5 × 10⁴.
The mass diffusivities of the molecules and ions predicted from OLI Systems Inc [17] in relation to each other and in relation to the mixture, respectively, are shown in Table 2. It was predicted that the diffusion of water molecules into ethanol molecules would be rate-limiting in molecular diffusion. Also, it was modelled that the diffusion of the sulphate ions towards neodymium ions within the mixture was rate-limiting in ionic diffusion. Furthermore, it was noted that the ionic diffusivities were in the same order of magnitude, meaning that both could be rate-limiting.
The kinematic viscosity of the system was estimated to be 1 × 10⁻⁶ m2/s by OLI Systems Inc [17]. A comparison of the diffusion rate of the water molecules within the ethanol molecules and the kinematic viscosity of the mixture showed that diffusion was much slower than momentum transfer at a Schmidt number (Sc) of 2 × 10³. Therefore, molecular diffusion of water within ethanol was the rate-limiting step, since Sc is 1 [8].

3.2. Effect of Mixing Intensity on Crystal Quality

3.2.1. Effect of Power Input on Mixing Time Constants

The changes in mixing time constants as a result of a change in the power input ( P ) were analysed in a NCIJM by varying the velocities of the jets of the neodymium solution and ethanol between 10 and 22 ms−1, as tabulated in Table 3. The corresponding Reynolds numbers of the jets ranged between 5600 and 15,000. Therefore, the analysis occurred in the turbulent regime. The power input ( P ) into the system varied between 100 and 400 W. The corresponding energy dissipation rate ( ε ) per unit mass increased from 2 × 10⁵ to 9 × 10⁵ W/kg. As stated by Johnson and Prud’homme [23], impinging jets ranked at the top of rapid mixing, and were able to reach energy dissipation rate values ( ε ) of up to 105 W/kg. The λ K was reduced from 1.6 to 1.1 μm due to its inverse relationship with the ε . The mesomixing time constant as a result of turbulent dispersion, τ D , was reduced from 214 µs to 136 µs. The convective eddy-disintegration mesomixing time constant, τ s , was reduced from 255 to 162 µs. Similarly, in the viscous–convective and viscous–diffusive subranges, the micromixing time constants due to engulfment ( τ E ) and molecular diffusion ( τ G ) decreased from 38 to 19 μs and 3.7 to 1.9 µs, respectively. The micromixing time constant τ m , as a result of molecular diffusion across the Kolmogorov length as modelled by Mahajan and Kirwan [10] in an impinging jet mixer, decreased from 26 to 9 ps. From the results, it was evident that the τ D and τ s were in the same order of magnitude, and were one order of magnitude longer than the τ E and two orders of magnitude longer than τ G . Therefore, τ D and τ s were rate-limiting, and, thus, the mixing time constant with significant contribution was evaluated as the mesomixing time constant ( τ m e s o ), equal to the sum of τ D and τ s . Therefor, τ m e s o was reduced from 470 to 300 µs. It was found that the molecular diffusion time constant, τ m , was very small and considered to be negligible. Mahajan and Kirwan [10] investigated a Reynolds number range between 575 and 970, where the slowest step occurred with the τ m ranging between 145 and 65 ms, respectively.
This means that the rate at which mixing of the solution and the ethanol occurred was controlled by mesomixing ( τ m e s o ), after which the engulfment, deformation, and molecular diffusion completely eradicated the scale of segregation in concentration. Mixing of the solution and ethanol generates supersaturation, the driving force for crystallization to take place. Therefore, the degree of supersaturation which was generated was controlled by the rate of mesomixing. Thus, a change in the τ m e s o results in a change in supersaturation and, thus, influence the quality of the crystals formed.

3.2.2. Effect of Mixing Intensity in the NCIJM and Secondary Mixing in the Stirred Batch Crystallizer on Crystal Quality

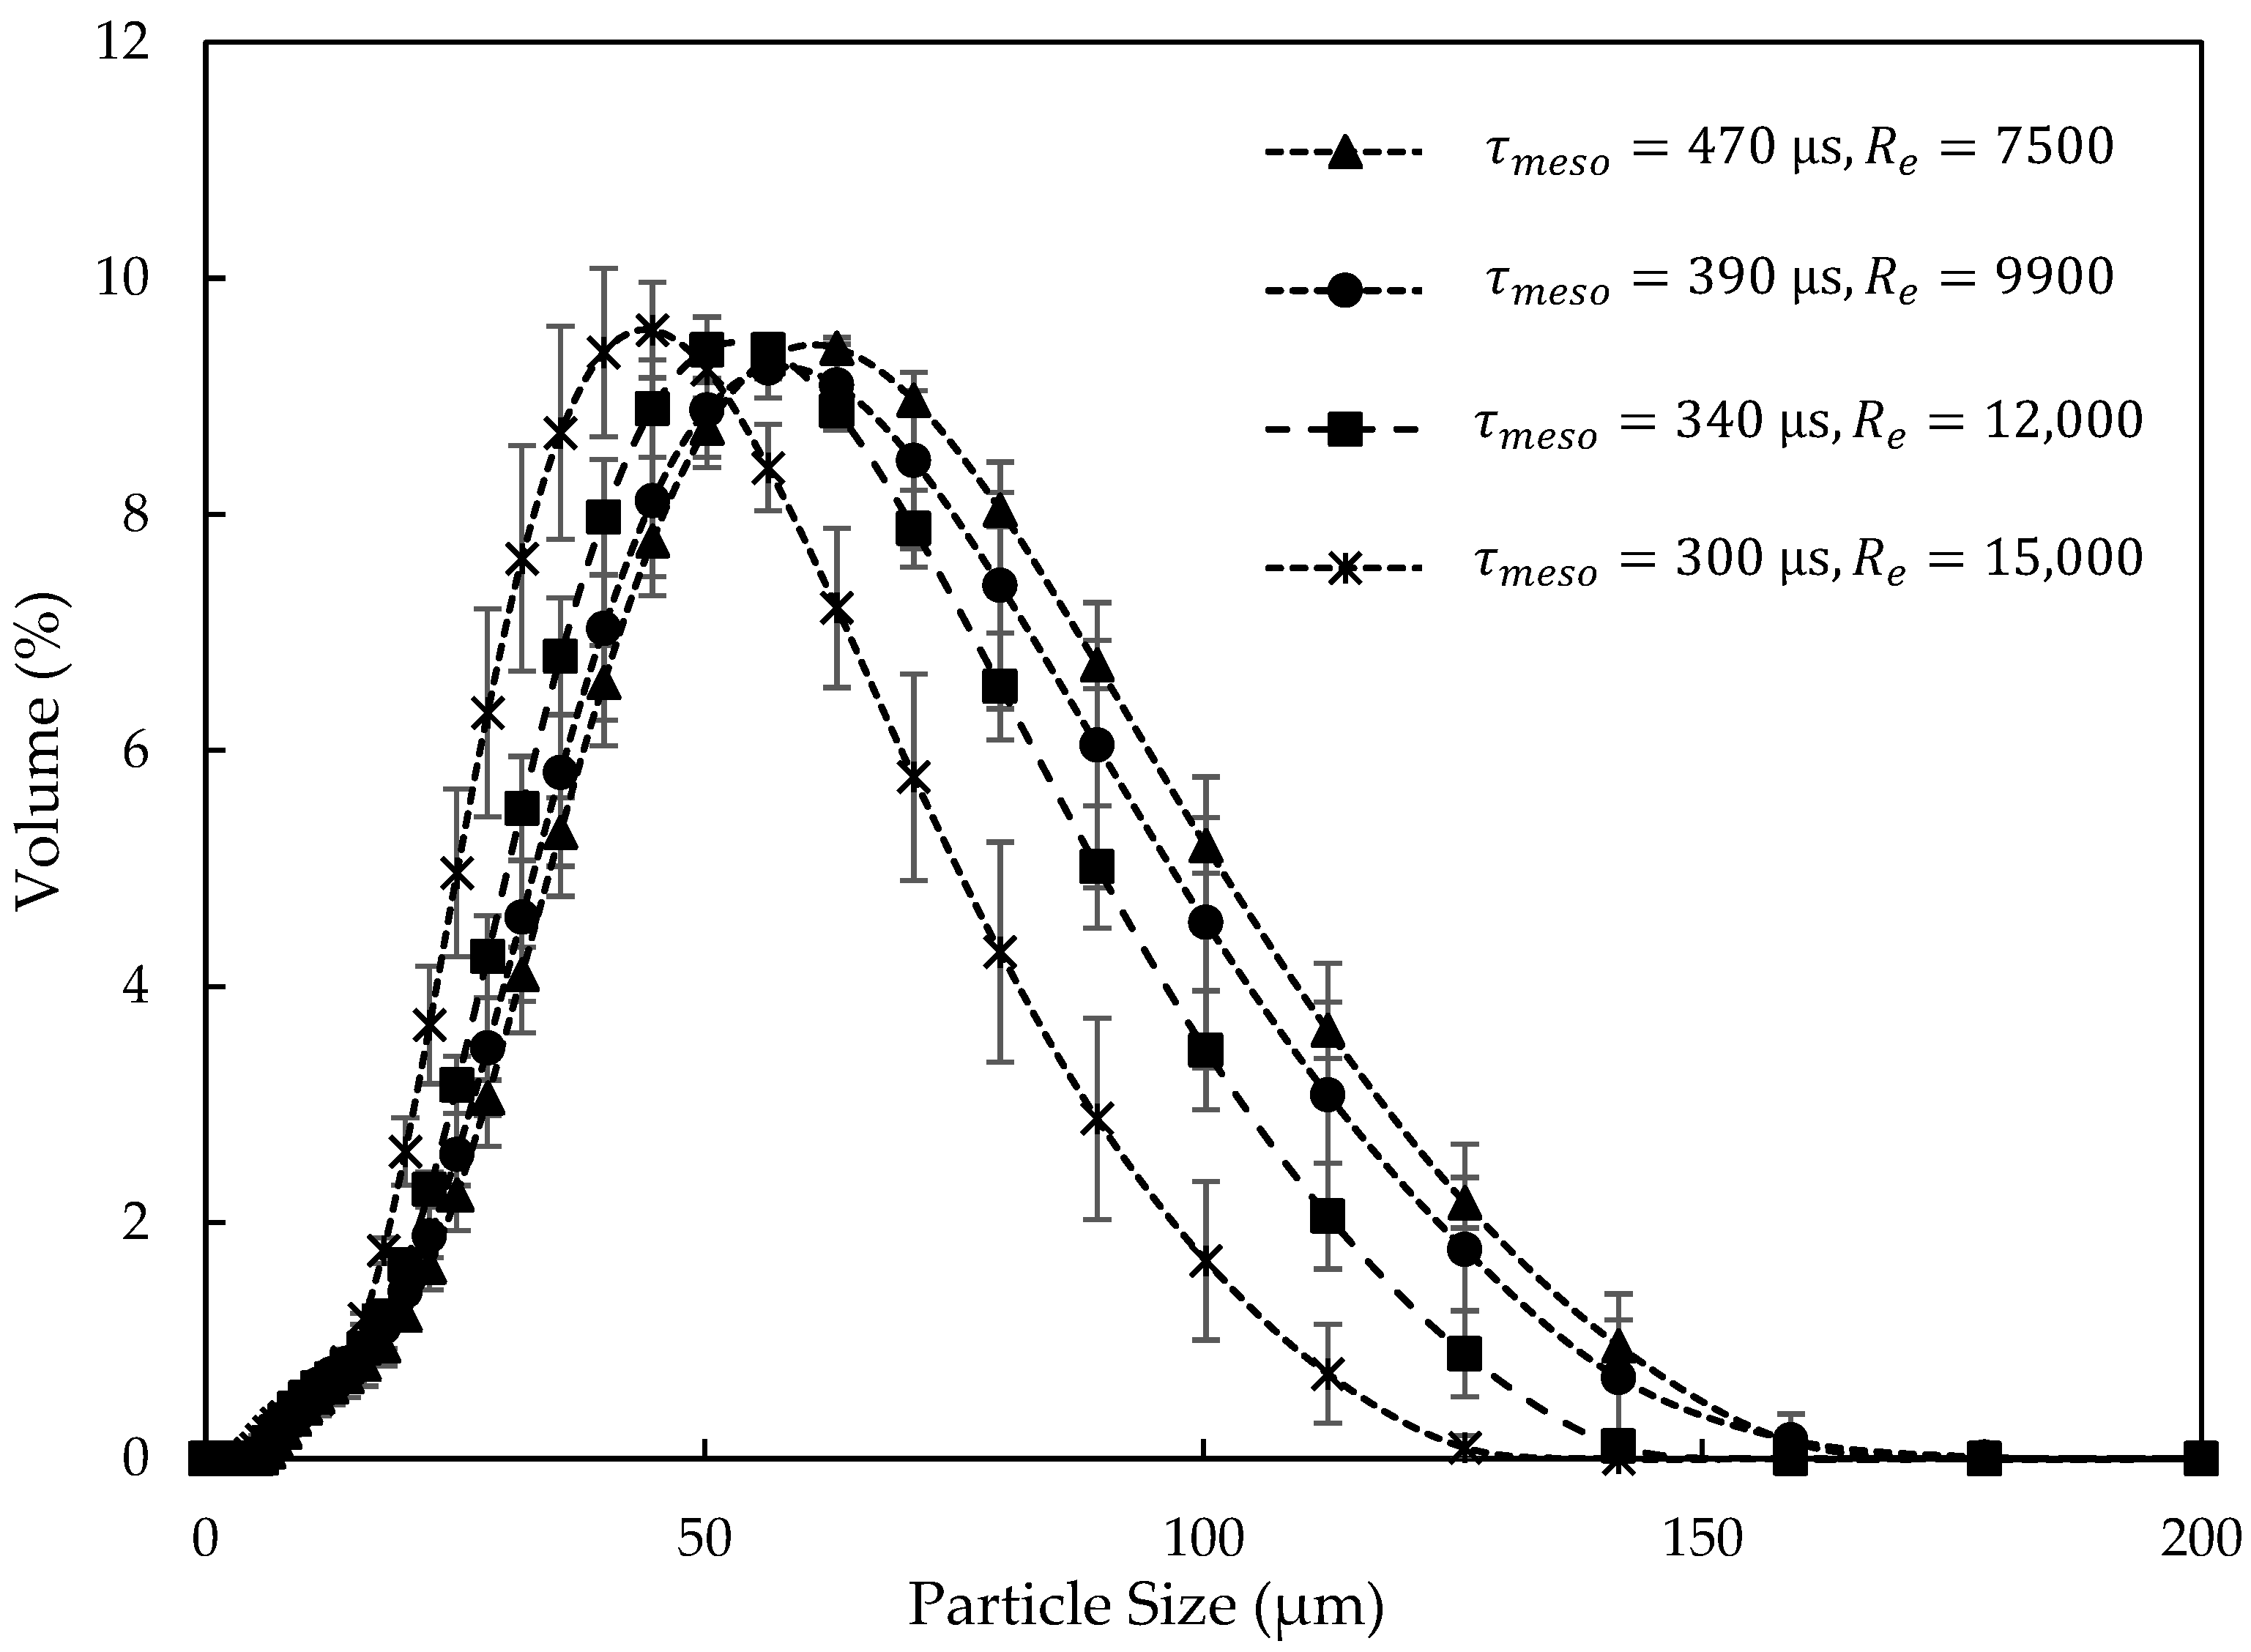
The effect of mixing intensity on crystal quality was investigated. For this experiment, the product from the NCIJM was further crystallized for 45 s in a stirred batch crystallizer. Figure 3 shows the percentage volume-based PSD as a function of intensified mesomixing ( τ m e s o ) in the NCIJM. It was observed that a decrease in τ m e s o shifted the PSDs towards the smaller size ranges. This was because τ m e s o reduced as result of an increase in the rate of turbulent dispersion and convective eddy disintegration. Because ethanol is more viscous than the solution, upon impingement of the two jet streams, plumes of ethanol in the solution and vice versa were generated. The plumes limited the interaction of the ethanol and solution molecules to generate supersaturation. The plumes were homogenized through turbulent dispersion and eddy disintegration (mesomixing). Therefore, an increase in the mesomixing rate can reduce the mass transfer limitations imposed by the plumes. Thus, at low jet streams Re and low ε , there was high mass transfer resistance, leading to the generation of lower supersaturation levels. Low supersaturation results in low nucleation rates and, hence, the formation of bigger particles. On the other hand, higher mesomixing intensities result in higher supersaturation levels and nucleation rates, leading to the formation of smaller particles. Hence, a shift in the PSD towards the finer size class was observed as the mesomixing intensity was increased.
After mesomixing, the scale of segregation in concentration was further reduced by the rate of engulfment of one fluid element by another as a result of increased ε , which increased the rate of deformation of the fluid elements through heat dissipation and thus accelerated molecular diffusion. In addition, increased ε reduced the Kolmogorov lengths scales ( λ K ) of micromixing and hence increased the micromixing intensity. Similar observations were made by Mahajan and Kirwan [10] during the antisolvent crystallization of lovastatin in a two-impinging jet (TIJ) mixer. However, the effect of secondary mixing in the stirred batch crystallizer needs to be considered.
To gain further insight into the quality of the produced particles, the effect of mesomixing on the mean, median, and modal particle sizes together with the the span, was investigated. Figure 4 shows the change in particle sizes as a result of the change in the mesomixing intensity in the NCIJM. The primary axis shows the particle sizes and the secondary axis shows the span. From Figure 4, it was noted that the mean crystal size decreased from 60 to 45 µm when the mesomixing time ( τ m e s o ) was reduced from 470 to 300 µs in the NCIJM. Enhanced mixing intensity was found to reduce the mean crystal sizes [9,12]. Similarly, the median sizes reduced from 47 to 40 µm, with the exception at τ m e s o of 340 µs, where 51 µm was recorded. This was because the mesomixing times which were investigated were in close range, making it easier for data points to overlap amongst each other. The mesomixing intensity in the NCIJM showed no effect on the modal particle size. The modal particle size was expected to decrease with decreasing τ m e s o because of increased nucleation rates. The anomality was attributed to the effect of secondary mixing that occurred in the stirred batch crystallizer. This means that the modal particle sizes might have been affected by the mesomixing intensity in the NCIJM, and that the effect was later outweighed in the secondary mixing process that occurred during further crystallization in the stirred batch crystallizer. Likewise, the span was not influenced by the degree of mesomixing in the NCIJM for the same reasons as explained above.
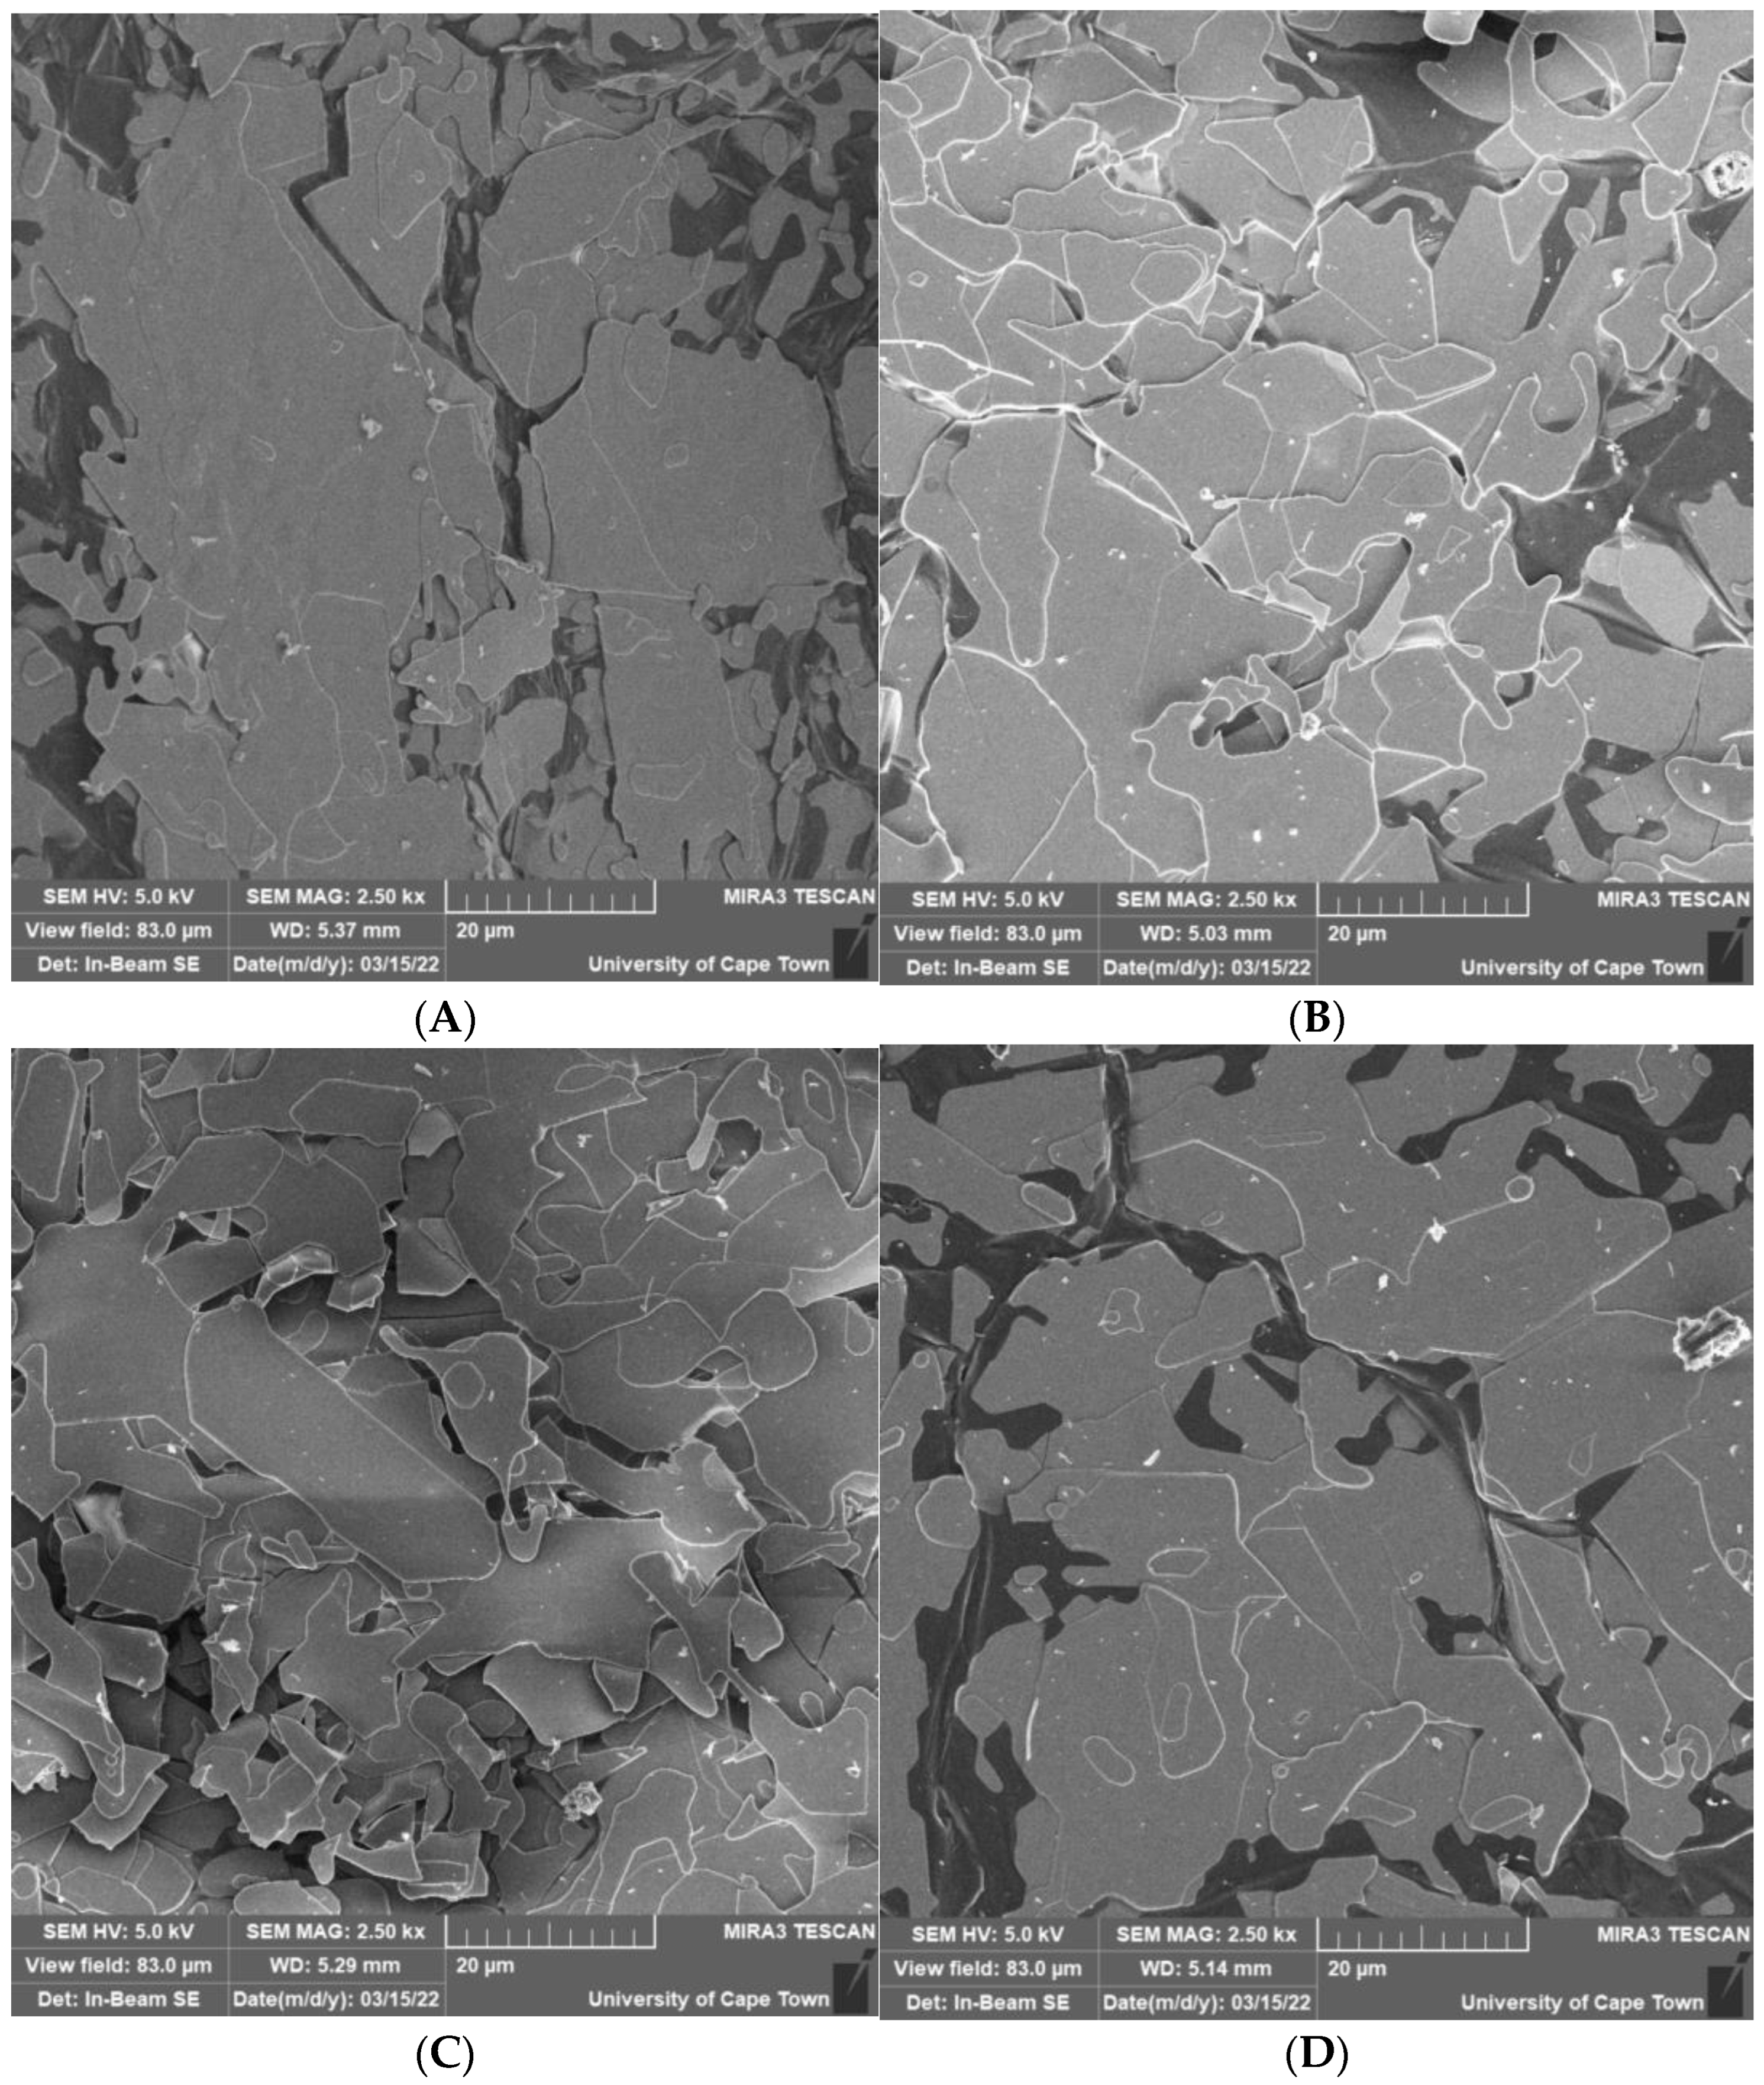
A scanning electron microscopic (SEM) analysis was performed to investigate the effect of mesomixing on the quality of the crystallized particles. Figure 5 shows the SEM images obtained at different τ m e s o values in the NCIJM, with (A) starting from 470 and reducing to 300 μs at (D). The crystals exhibited leaf- or plate-like structures with distinct crystal boundaries and were irregular in shape. It is evident that the crystals were stacked on top of each other, making it difficult to clearly distinguish the boundaries of individual crystals. Evidence of attrition/breakage, possibly caused by further mixing in the stirred batch crystallizer, can also be observed. It is not possible to identify primary crystals from these results. Therefore, the SEM images could not corroborate the reduction in the particle sizes with increasing mesomixing intensity in the NCIJM.
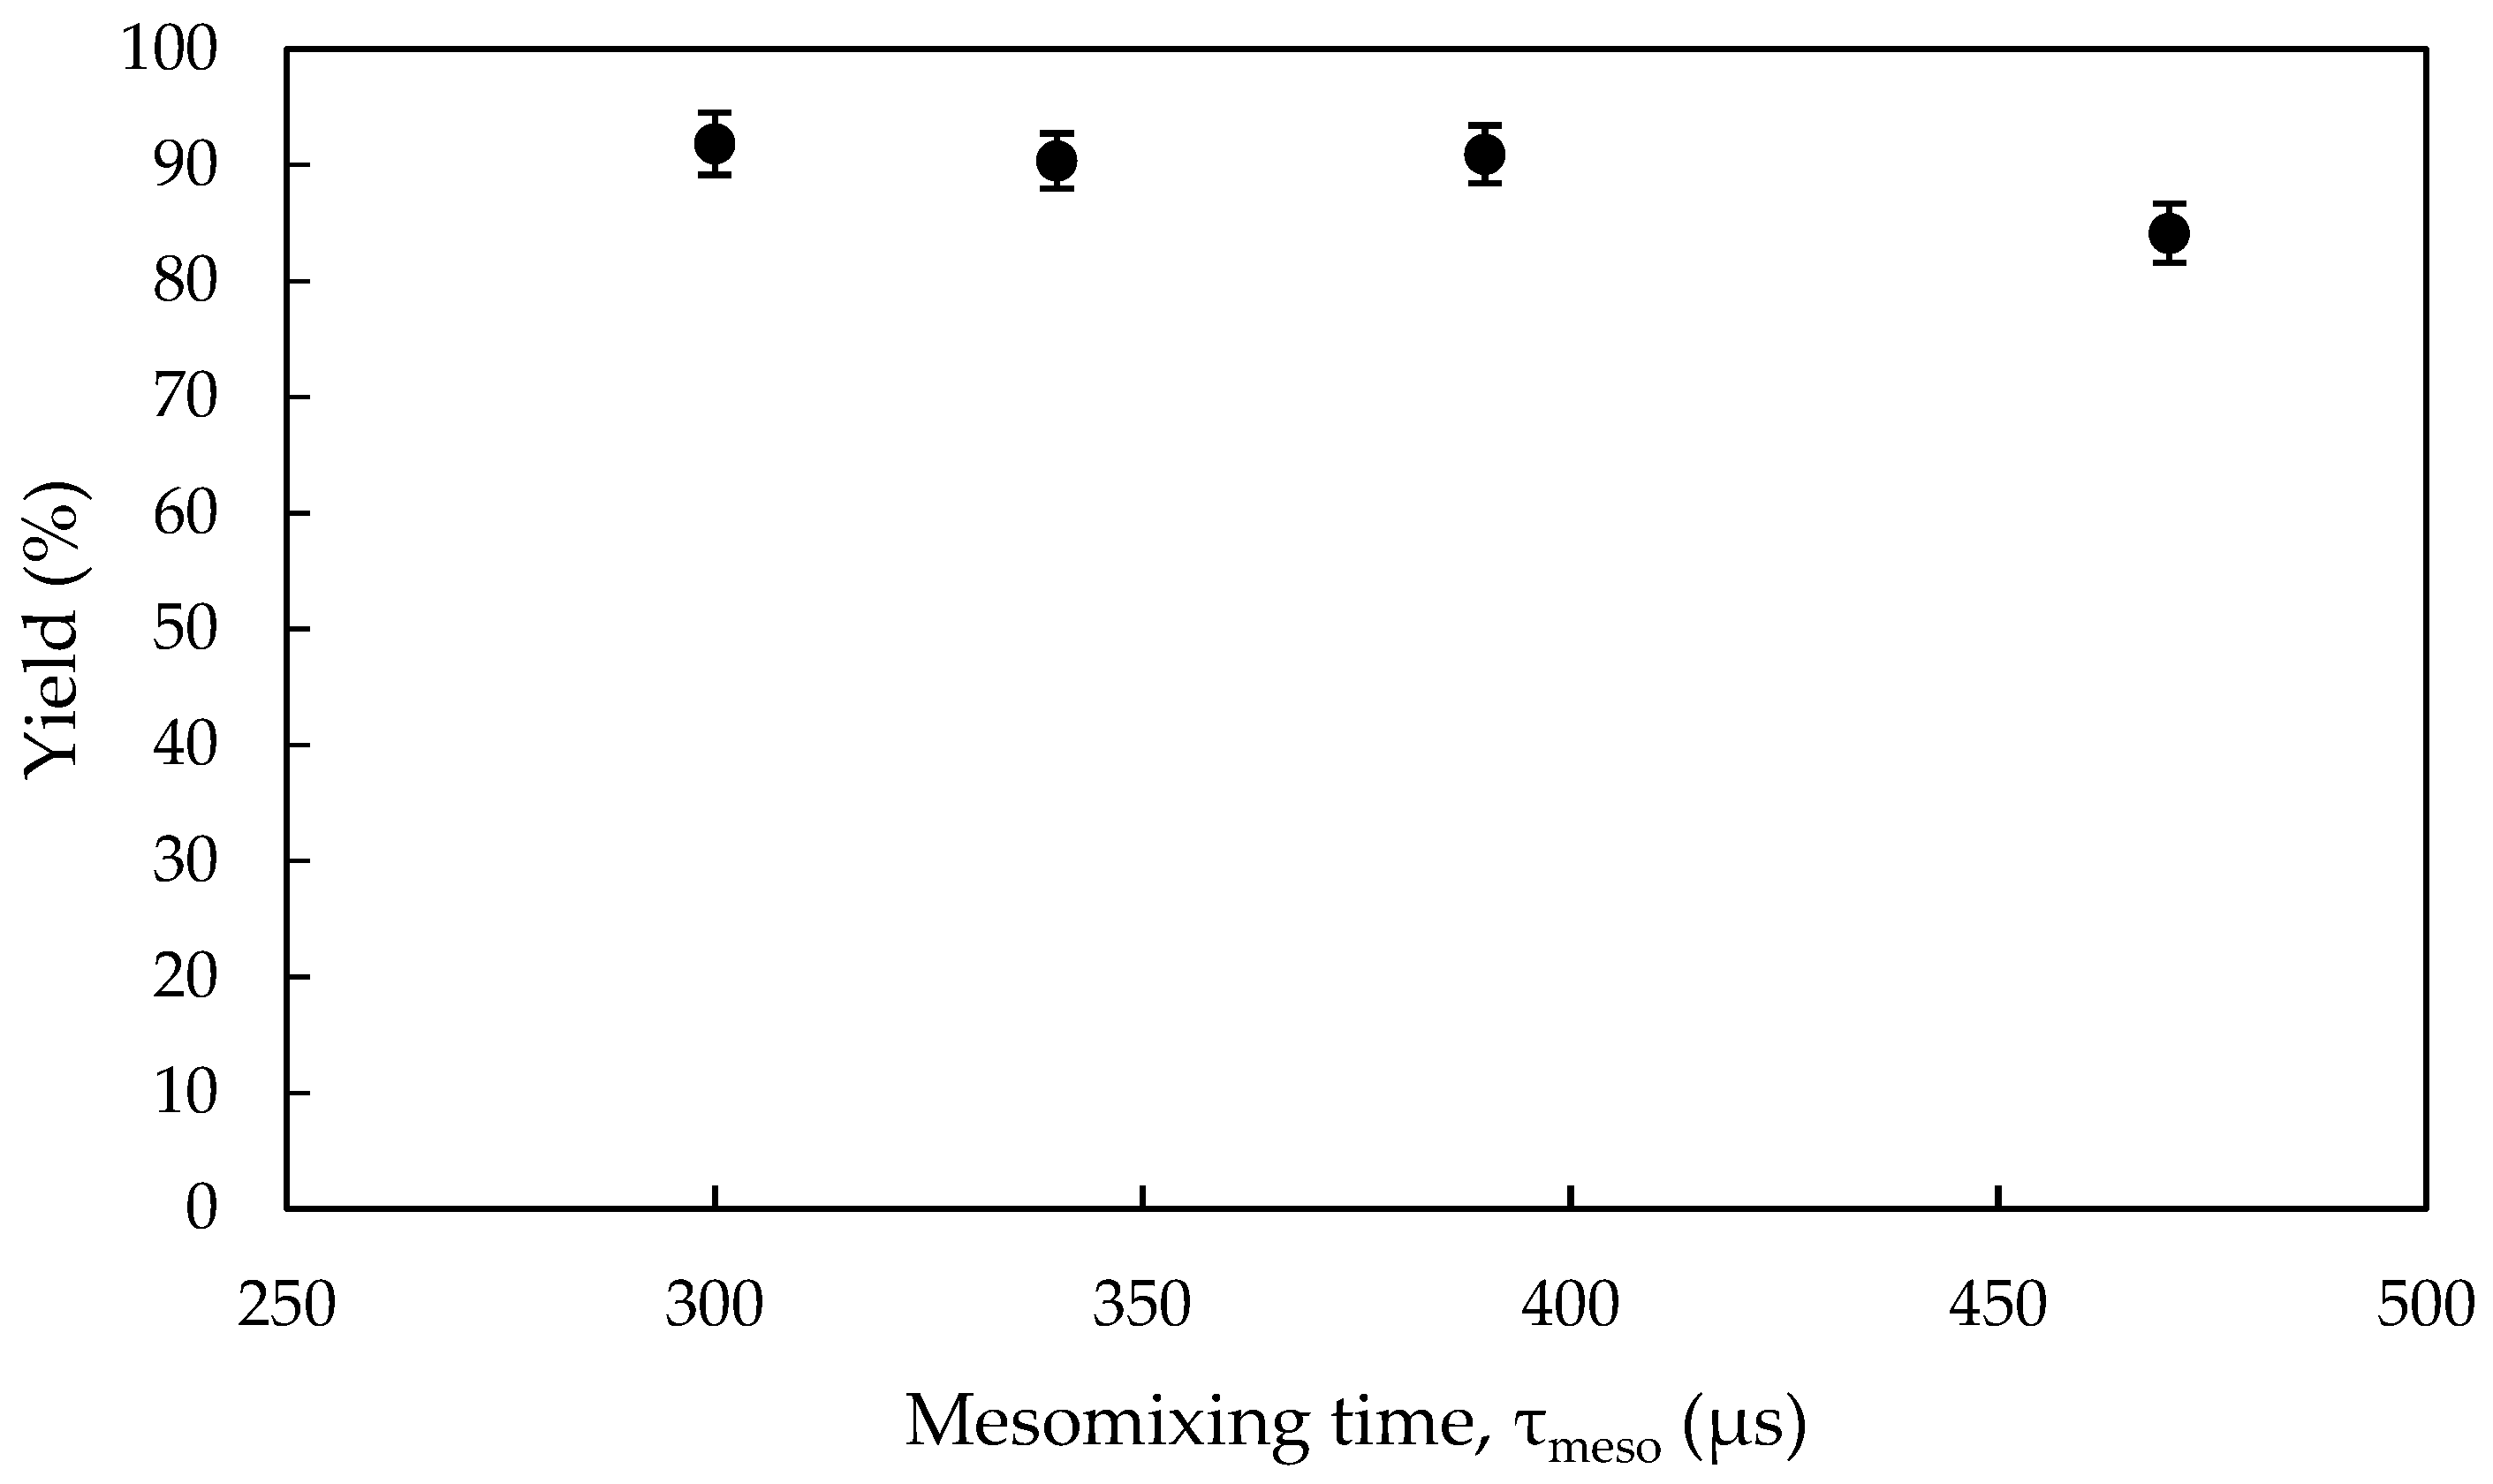
The yields produced at different mesomixing intensities in the NCIJM followed by further crystallization in the stirred batch crystallizer were measured. The results were as presented in Figure 6, where it is evident that the obtained yields were constant at the investigated mesomixing intensity in the NCIJM. This implies that the effects of different supersaturations on product yield, generated in the NCIJM at mesomixing times ( τ m e s o ) between 470 and 300 µs, were outweighed by further crystallization in the stirred batch crystallizer. This means that further crystallization in the stirred batch crystallizer allowed enough time for the systems at different supersaturations to reach the same equilibrium concentrations.
Therefore, it was evident that the effect of mesomixing intensity in the NCIJM on crystal quality cannot be investigated independently from the mixing effect in the stirred batch crystallizer. Thus, a new set of experiments was designed to decouple the two from each other.

3.2.3. Effect of Mixing Intensity in the NCIJM on Crystal Quality

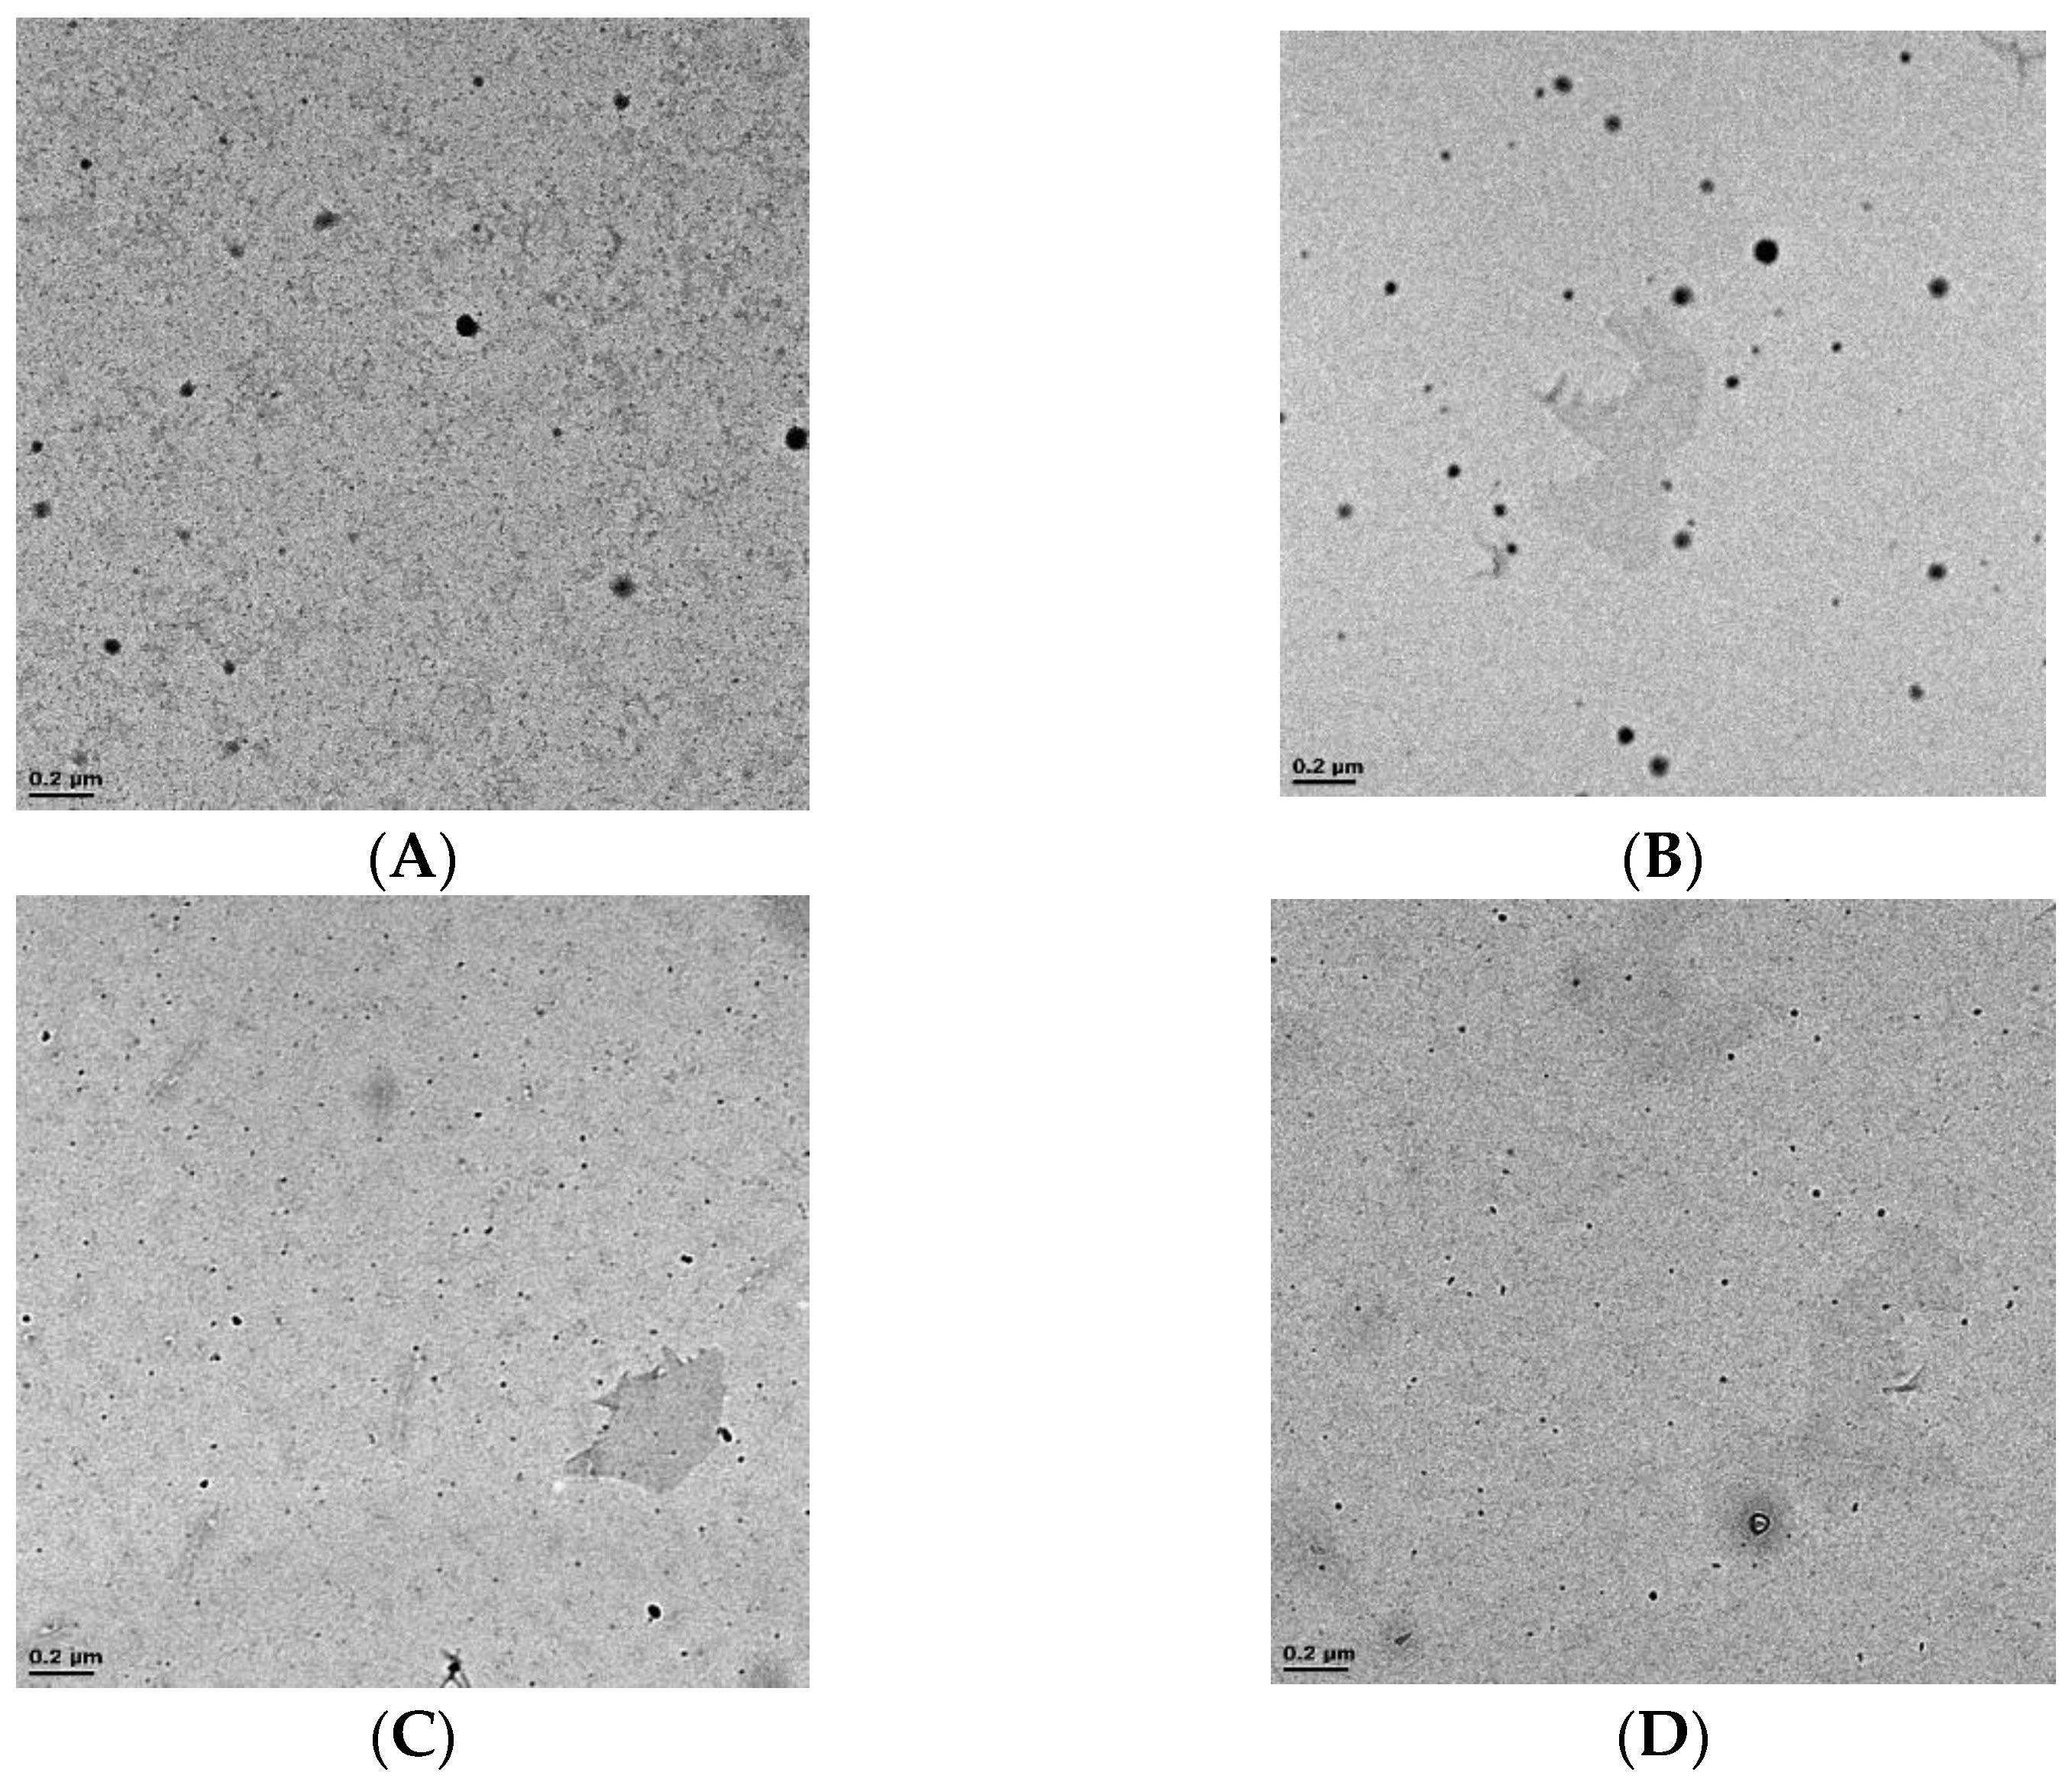
To decouple the effect of mixing in the batch crystallizer from the mesomixing in the NCIJM, a sample was harvested immediately after the NCIJM tube. Figure 7 shows the transmission electron microscope (TEM) images obtained at the investigated mesomixing times ( τ m e s o ). It was observed that the particles became smaller as the τ m e s o was reduced.
From the TEM images, ImageJ [26] was used to estimate the equivalent diameters of the crystals, and the number of crystals was counted to produce PSDs, as illustrated in Figure 8. The crystal sizes were three orders of magnitude smaller compared to the ones which were further crystallized in the stirred batch crystallizer. Because the crystallization process was truncated by sampling on a grid placed on high-absorbance filter paper, it was not possible to measure the mass yield. It was observed in Figure 8 that the PSDs shifted towards smaller size ranges as a result reduction in mesomixing time ( τ m e s o ). From Figure 9, the mean, median, and modal particle sizes reduced with increasing mesomixing intensity. This was attributed to an increase in the energy dissipation rate ( ε ) as a result of the increased Reynolds number in the jets, which increased the turbulent diffusion and the eddy disintegration rate. Thus, the τ D and τ S were reduced and, hence, mesomixing was intensified. Therefore, the mass flux per unit area between the solution and alcohol was increased. This allowed for an enhanced interaction between the solution and alcohol molecules, leading to higher supersaturation levels. Higher supersaturation levels promote nucleation rates and, in turn, the formation of smaller particles. An increased nucleation rate can be corroborated by an increase in the number of particles, as seen in Figure 7. Baber et al. (2016) made similar observations, where smaller particles were produced as a result of increasing the jet velocities.
It is worth noting that it is not always the case that enhanced mixing will promote nucleation and form smaller particles. It is system-specific and only occurs when nucleation is mass-transfer-limited. Enhanced mixing can increase the mean crystal size when the growth step is limited by the migration of the solute from the bulk phase to the solid–liquid interface, as shown by Alvarez and Myerson [9] during the antisolvent crystallization of ketoconazole. Ramisetty and co-workers [13] also made a similar observation during the antisolvent crystallization of L-serine.
Furthermore, the width of the PSDs, the span, was observed to narrow with reducing mesomixing time, as illustrated in Figure 9. This is because higher mesomixing intensity allows for uniform distribution of the solution and ethanol fluid elements, resulting in uniform distribution of supersaturation such that uniform nucleation took place, thus resulting in a narrower PSD. Poor mesomixing allowed for regions of locally high concentrations where rapid nucleation took place. This formed finer particles. There were also regions of locally low concentration where lower nucleation rates occurred, bigger particles were produced, and, hence, a broader PSD was formed. This phenomenon occurs up until a limit is reached where decreasing τ m e s o no longer affects the span of the PSD. This occurs when the complete distribution of supersaturation is attained before the onset of nucleation, as shown by Mahajan and Kirwan [10]. The current study was not able to show this limit, but it can be observed from Figure 8 that the curves were approaching a limit. It was also observed that the spans of PSDs at 470 and 390 µs were significantly wider than at 340 and 300 µs. This was attributed to low momentum of the jets at lower speeds, which introduced more mesomixing limitations because the jet streams were submerged within the mixture in the mixer, hence the term NCIJM.

3.2.4. Effect of Mixing Intensity in the NCIJM on Crystal Morphology

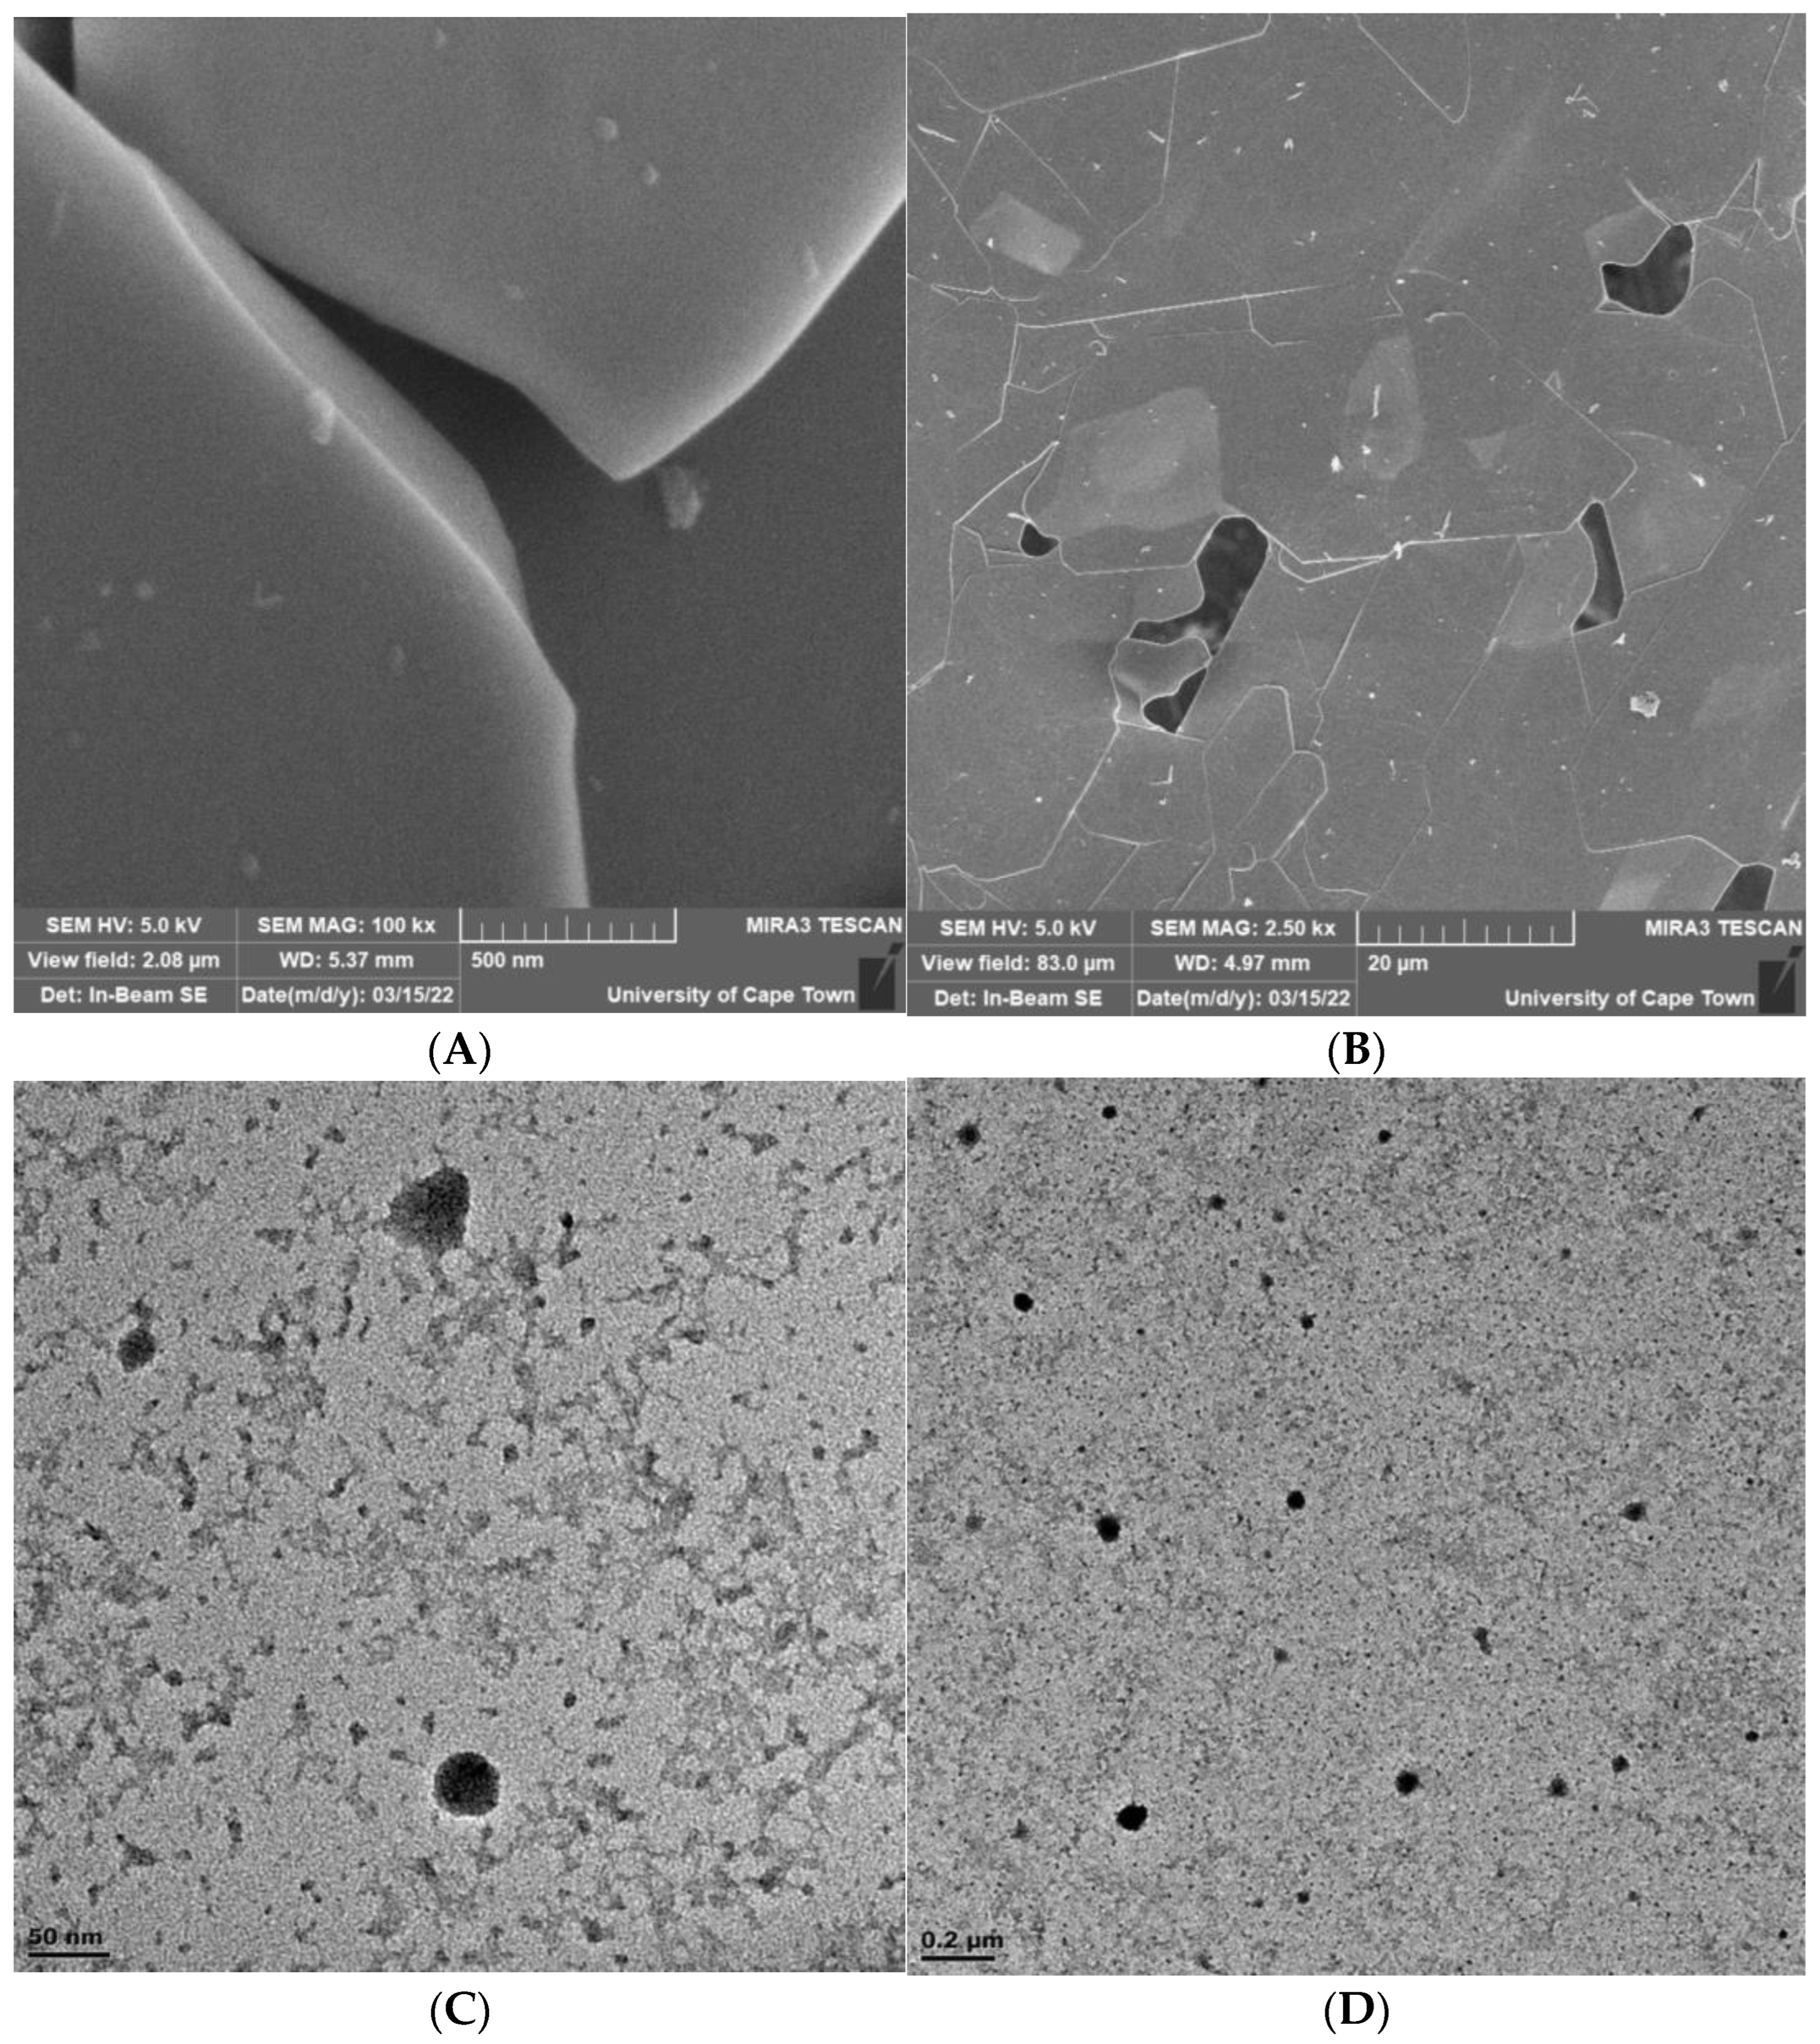
Step patterns and etch figures observed on the flat crystal faces of a polyhedral crystal are referred to as microtopographs. They represent the final stage of growth and contain atomic-level information about the growth mechanism, dissolution, or perfection of the crystal [28]. Figure 10 shows random SEM samples obtained from the NCIJM and stirred batch crystallizer experiments in the upper quadrants, as well as random TEM samples obtained from the NCIJM in the lower quadrants. From Figure 10A, the microtopography of the crystals was observed to be smooth, implying that the nature of the crystals was crystalline rather than amorphous. However, a Raman spectroscopy analysis would be required in order to validate this claim. In addition, it is evident from the morphology that the crystals were not agglomerates. Figure 10B shows evidence of breakage or attrition as a result of secondary mixing in the stirred batch crystallizer. TEM images from Figure 10C,D show single crystals, since there was no distortion in the structure nor change in the orientation of the particles [28].

3.2.5. Effect of Mixing Intensity on Nucleation and Induction Time

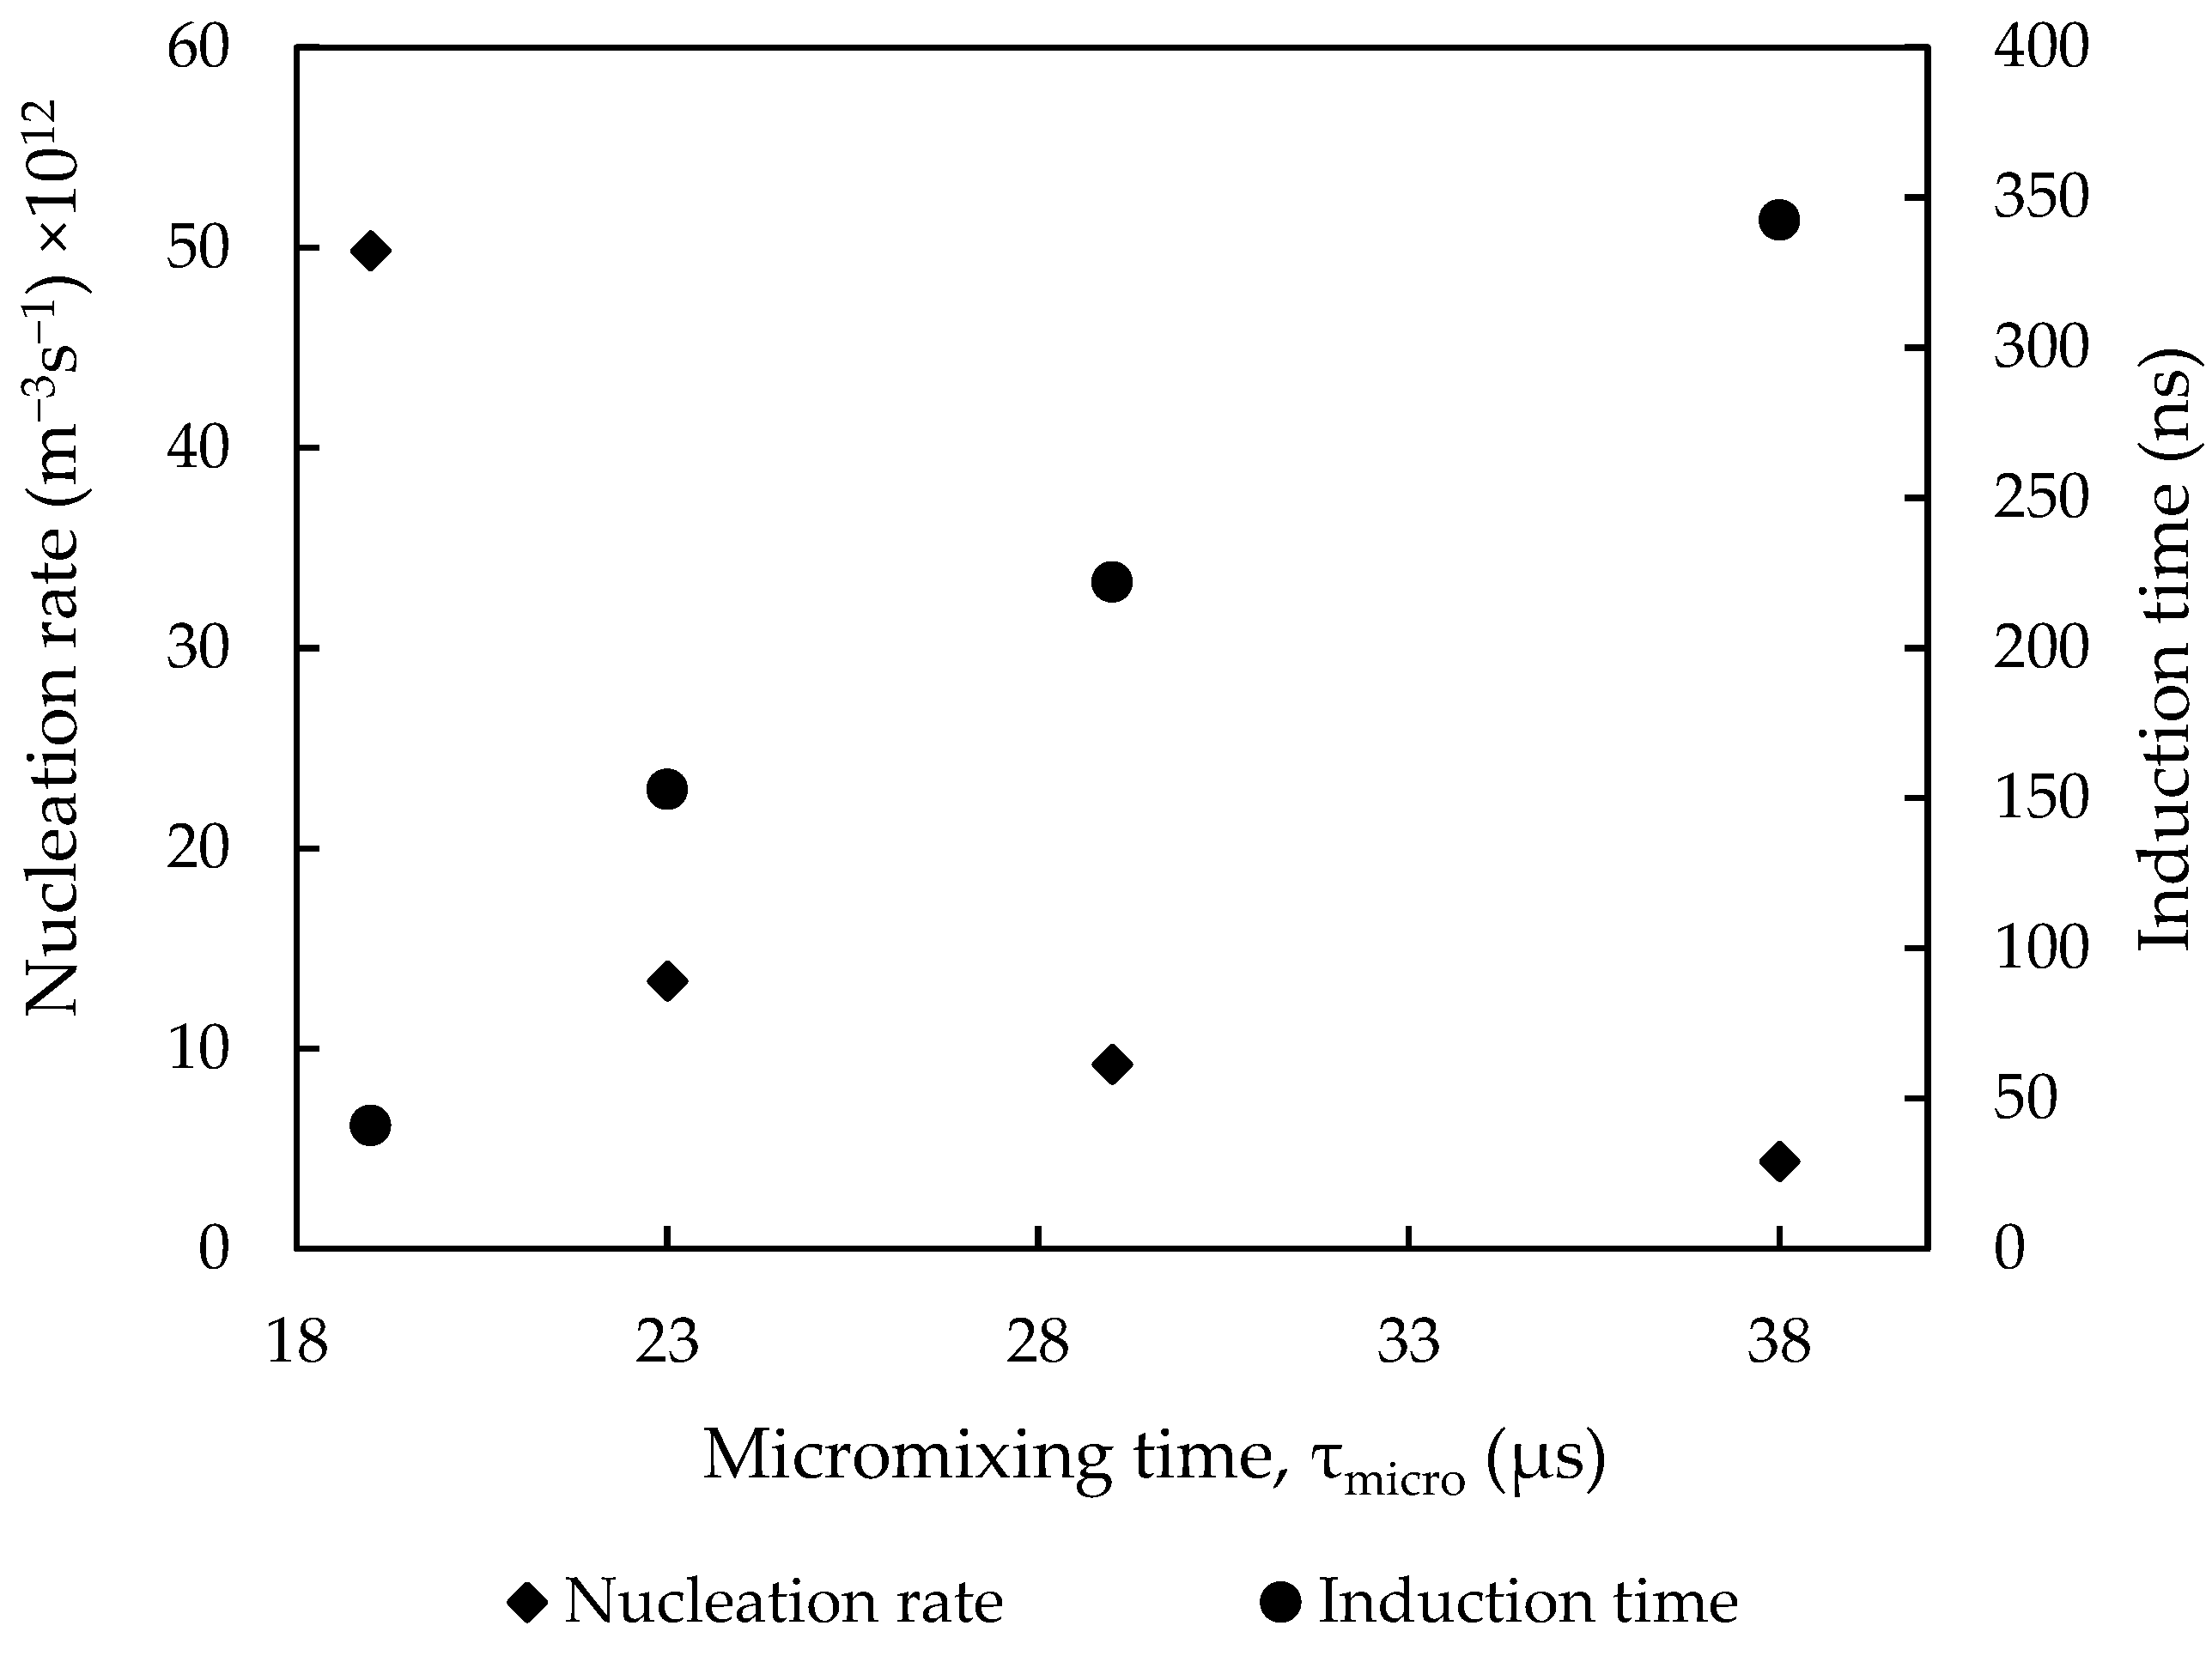
Mesomixing defines the conditions under which micromixing and, subsequently, nucleation takes place. Because nucleation is a molecular process and occurs at a smaller scale than mesomixing, micromixing was used to investigate the nucleation rate. Furthermore, the reaction rate is generally faster than the micromixing time. Hence, the latter is generally rate-limiting. In the viscous–convective and viscous–diffusive subranges, the engulfment time constant ( τ E ) was one order of magnitude longer than the molecular diffusion time constant ( τ G ). The engulfment rate was the rate limiting step. Therefore, the micromixing time constant ( τ m i c r o ) was expressed as τ G . The nucleation rate was expressed as the number of particles formed in the NCIJM micromixing volume ( V m i c r o ) at a specific micromixing time ( τ m i c r o ) under constant supersaturation. The induction time ( t I ) was estimated from Equation (13) by assuming that the system lost its metastability from the moment the first nucleus was formed. It was assumed that the particles were formed in the micromixing volume ( V m i c r o ) and allowed to grow to detectable sizes along the tube length under the same residence time ( τ ). Similar amounts of suspension were sampled onto the porous grid for each experimental data point. The number of particles obtained from Figure 7 was used to estimate the nucleation rates and induction times, as illustrated in Figure 11. It was observed that the nucleation rate increased from 6 × 10¹² to 5 × 10¹³  m 3 s 1 with increasing micromixing intensity. It was also noted that increasing mixing intensity reduced the induction time. This was because the energy dissipation rate ( ε ) shortened the engulfment rate ( E ) and the Kolmogorov length scale of mixing ( λ K ) for faster micromixing of the solution and ethanol striations, thus inducing higher nucleation rates. Similarly, the induction time was reduced with faster micromixing of the solution and ethanol striations. Lewis, Seckler, Kramer and Rosmalen [6] found that, when the supersaturation ranged from 4 × 10⁶ to 1 × 10⁸, the nucleation rate ranged between 3 × 10¹⁴ and 4 × 10¹⁷ m−3 s−1 during precipitation of barium sulphate.

4. Conclusions and Recommendations

Rare earth elements can be recovered from leachates of secondary sources, as illustrated in the current study. Neodymium sulphate was recovered from a nickel metal hydride (NiMH) battery synthetic leach liquor using antisolvent crystallization. A solution containing 3.2 g/L N d 2 ( S O 4 ) 3 ( a q ) , and ethanol was used as an antisolvent. Economically viable yields in excess of 90 % were achieved as a result of high supersaturation at 1.5 × 10⁴ generated upon mixing of the neodymium solution and ethanol. However, high supersaturation is prone to producing very fine particle sizes with broader PSDs, which are undesirable during downstream solid–liquid separation. The aim of the study was to investigate the effect of mixing intensity on crystal sizes and CSDs during antisolvent crystallization of REEs from a NiMH battery synthetic leach liquor in a non-confined impinging jet mixer (NCIJM) crystallizer. Because micromixing involves mixing on the molecular level, the engulfment, deformation, and molecular diffusion model was considered. It was found that the mesomixing was rate-limiting at one order of magnitude longer than engulfment and two orders of magnitude longer than molecular diffusion.
Increasing the energy dissipation rate ( ε ) by increasing the Reynolds number of the jets from 7500 to 15,000 reduced the mesomixing time ( τ m e s o ) constant from 470 to 300 µs due to increases in the turbulent diffusion rate and the convective eddy disintegration rate. Subsequently, the micromixing time ( τ m i c r o ) improved from 38 to 19 µs due to an increase in the engulfment rate. The deformation and the molecular diffusion rate were also increased. Intensified mesomixing improved the mass transfer of water molecules to the ethanol molecules (rate-limiting) and higher supersaturation levels were generated, causing an increase in the nucleation rate from 6 × 10¹² to 5 × 10¹³  m 3 s 1 . This led to the formation of smaller particles, where the mean crystal sizes were reduced from 48 to 24 nm. Similarly, the induction time was shortened from 342 to 41 ns. In parallel, intensified mesomixing narrowed the span of the CSDs from 1.08 to 0.81. This was because intensified mesomixing uniformly homogenized the steep concentration gradients as a result of plumes such that the supersaturation was distributed evenly, leading to uniform nucleation rates and, in turn, narrower CSDs.
For future work, it is recommended to use the particle image velocimetry to track the velocity gradients within the micromixing volume to quantify its true value. It is also recommended that in-situ concentration measurement and particle counting be implemented to track the nucleation rate more accurately. It will also be interesting to investigate how mixing intensity in the NCIJM would affect the crystal sizes and morphology at lower O / A ratios or supersaturation levels.

Author Contributions

Conceptualization, T.O.B., J.C., and A.E.L.; data curation, T.O.B.; funding acquisition, A.E.L.; investigation, T.O.B.; methodology, T.O.B., J.C., and A.E.L.; software, T.O.B.; project administration, J.C. and A.E.L.; resources, A.E.L., J.C.; supervision, J.C. and A.E.L.; writing—original draft, T.O.B.; writing—review and editing, J.C. and A.E.L. All authors have read and agreed to the published version of the manuscript.

Funding

This research received no external funding.

Data Availability Statement

Data will be available in a publicly accessible repository at the University of Cape Town https://open.uct.ac.za/, 20 June 2023 under Tinjombo Octavious Baloyi.

Acknowledgments

The authors would like to thank the Crystallization and Precipitation Research Unit for funding the research. Special thanks to Mohamed Jaffer and Miranda Waldron of the Electron Microscope Unit. Deepest gratitude to Nasseela Hytoolakhan Lal Mahomed of the Analytical Laboratory of the Chemical Engineering Department at the University of Cape Town.

Conflicts of Interest

The authors declare no conflict of interest.

References

  1. Habashi, F. Extractive metallurgy of rare earths. Can. Metall. Q. 2013, 52, 224–233. [Google Scholar] [CrossRef]
  2. Shecterle, R. BSG Ranks Global Supply Risks of Rare Earth Elements and Other Minerals. 2011. Available online: https://www.industryweek.com/finance/article/22011199/bsg-ranks-global-supply-risks-of-rare-earth-elements-and-other-minerals (accessed on 25 May 2021).
  3. Binnemans, K.; Jones, P.T.; Blanpain, B.; Van Gerven, T.; Pontikes, Y. Towards zero-waste valorisation of rare-earth-containing industrial process residues: A critical review. J. Clean. Prod. 2015, 99, 17–38. [Google Scholar] [CrossRef] [Green Version]
  4. Korkmaz, K.; Alemrajabi, M.; Rasmuson, Å.C.; Forsberg, K.M. Separation of valuable elements from NiMH battery leach liquor via antisolvent precipitation. Sep. Purif. Technol. 2020, 234, 115812. [Google Scholar] [CrossRef]
  5. Korkmaz, K.; Alemrajabi, M.; Rasmuson, Å.; Forsberg, K. Sustainable Hydrometallurgical Recovery of Valuable Elements from Spent Nickel–Metal Hydride HEV Batteries. Metals 2018, 8, 1062. [Google Scholar] [CrossRef] [Green Version]
  6. Lewis, A.; Seckler, M.; Kramer, H.; Rosmalen, G.v. Industrial Crystallization: Fundamentals and Applications; Cambridge University Press: Cambridge, UK, 2015. [Google Scholar]
  7. Baldyga, J.; Bourne, J.R.; Hearn, S.J. Interaction between chemical reactions and mixing on various scales. Chem. Eng. Commun. 1996, 52, 457–466. [Google Scholar] [CrossRef]
  8. Baldyga, J.; Bourne, J.R. A Fluid Mechanical Approach to Turbulent Mixing and Chemical Reaction Part II Micromixing in the Light of Turbulence Theory. Chem. Eng. Commun. 1983, 28, 243–258. [Google Scholar] [CrossRef]
  9. Alvarez, A.J.; Myerson, A.S. Continuous Plug Flow Crystallization of Pharmaceutical Compounds. Cryst. Growth Des. 2010, 10, 2219–2228. [Google Scholar] [CrossRef]
  10. Mahajan, A.J.; Kirwan, D.J. Micromixing Effects in a Two-Impinging-Jets Precipitator. AIChE 1996, 42, 1801–1814. [Google Scholar] [CrossRef]
  11. Charmolune, H.; Rousseau, R.W. L-Serine Obtained by Methanol Addition in Batch Crystallization. AIChE 1991, 37, 1121–1128. [Google Scholar] [CrossRef]
  12. Yu, Z.Q.; Tan, R.B.H.; Chow, P.S. Effects of operating conditions on agglomeration and habit of paracetamol crystals in anti-solvent crystallization. J. Cryst. Growth 2005, 279, 477–488. [Google Scholar] [CrossRef]
  13. Ramisetty, K.A.; Pandit, A.B.; Gogate, P.R. Ultrasound-Assisted Antisolvent Crystallization of Benzoic Acid: Effect of Process Variables Supported by Theoretical Simulations. Ind. Eng. Chem. Res. 2013, 52, 17573–17582. [Google Scholar] [CrossRef]
  14. Meyer, T.; David, R.; Renken, A.; Villermaux, J. Micromixing in a static mixer and an empty tube by a chemical method. Chem. Eng. Sci. 1988, 43, 1955–1960. [Google Scholar] [CrossRef] [Green Version]
  15. Davey, R.; Garside, J. From Molecules to Crystallizers; Oxford University Press: Oxford, UK, 1999. [Google Scholar]
  16. Midler, M.J.; Liu, P.D.; Paul, E.L.; Futran, M.; Whittington, E.F. A Crystallization Method to Improve Crystal Structure and Size. US5314506A, 24 May 1994. [Google Scholar]
  17. OLI Systems Inc. OLI Studio Stream Analyzer, v11.5 (Build 1.7) 15-Sep-2022; OLI Systems Inc.: Morris Plains, NJ, USA, 2022. [Google Scholar]
  18. Pope, S.B. Turbulent Flows; Cambridge University Press: Cambridge, UK, 2000. [Google Scholar]
  19. Baldyga, J.; Bourne, J.R. Interactions between mixing on various scales in stirred tank reactors. Chem. Eng. Sci. 1991, 47, 1839–1848. [Google Scholar] [CrossRef]
  20. Hendrik, R.; Michel, B.; Mathias, K. A new scale-up method for competitive chemical model reactions based on complete similarity. Chem. Eng. J. 2020, 400, 125763. [Google Scholar] [CrossRef]
  21. Baldyga, J.; Bourne, J.R. Simplification of micromixing calculations. I. Derivation and application of new model. Chem. Eng. J. 1989, 42, 83–92. [Google Scholar] [CrossRef]
  22. Vicum, L.; Ottiger, S.; Mazzotti, M.; Makowski, Ł.; Bałdyga, J. Multi-scale modeling of a reactive mixing process in a semibatch stirred tank. Chem. Eng. Sci. 2004, 59, 1767–1781. [Google Scholar] [CrossRef]
  23. Johnson, B.K.; Prud’homme, R.K. Chemical Processing and Micromixing in Confined Impinging Jets. AIChE 2003, 49, 2264–2282. [Google Scholar] [CrossRef]
  24. Demyanovich, R.J.; Bourne, J.R. Rapid micromixing by the impingement of thin liquid sheets. 2. Mixing study. Ind. Eng. Chem. Res. 1989, 28, 830–839. [Google Scholar] [CrossRef]
  25. Ottino, J.M. Description of mixing with diffusion and reaction in terms of the concept of material surfaces. J. Fluid Mech. 1982, 114, 83–103. [Google Scholar] [CrossRef]
  26. Schindelin, J.; Arganda-Carreras, I.; Frise, E.; Kaynig, V.; Longair, M.; Pietzsch, T.; Preibisch, S.; Rueden, C.; Saalfeld, S.; Schmid, B.; et al. Fiji: An open-source platform for biological-image analysis. Nat. Methods 2012, 9, 676–682. [Google Scholar] [CrossRef] [PubMed] [Green Version]
  27. Nobbmann, U. D90, D50, D10, and Span—for DLS? 2016. Available online: https://www.materials-talks.com/d90-d50-d10-and-span-for-dls/ (accessed on 29 August 2022).
  28. Sunagawa, I. Crystals Growth, Morphology, and Perfection; Cambridge University Press: Cambridge, UK, 2005. [Google Scholar]
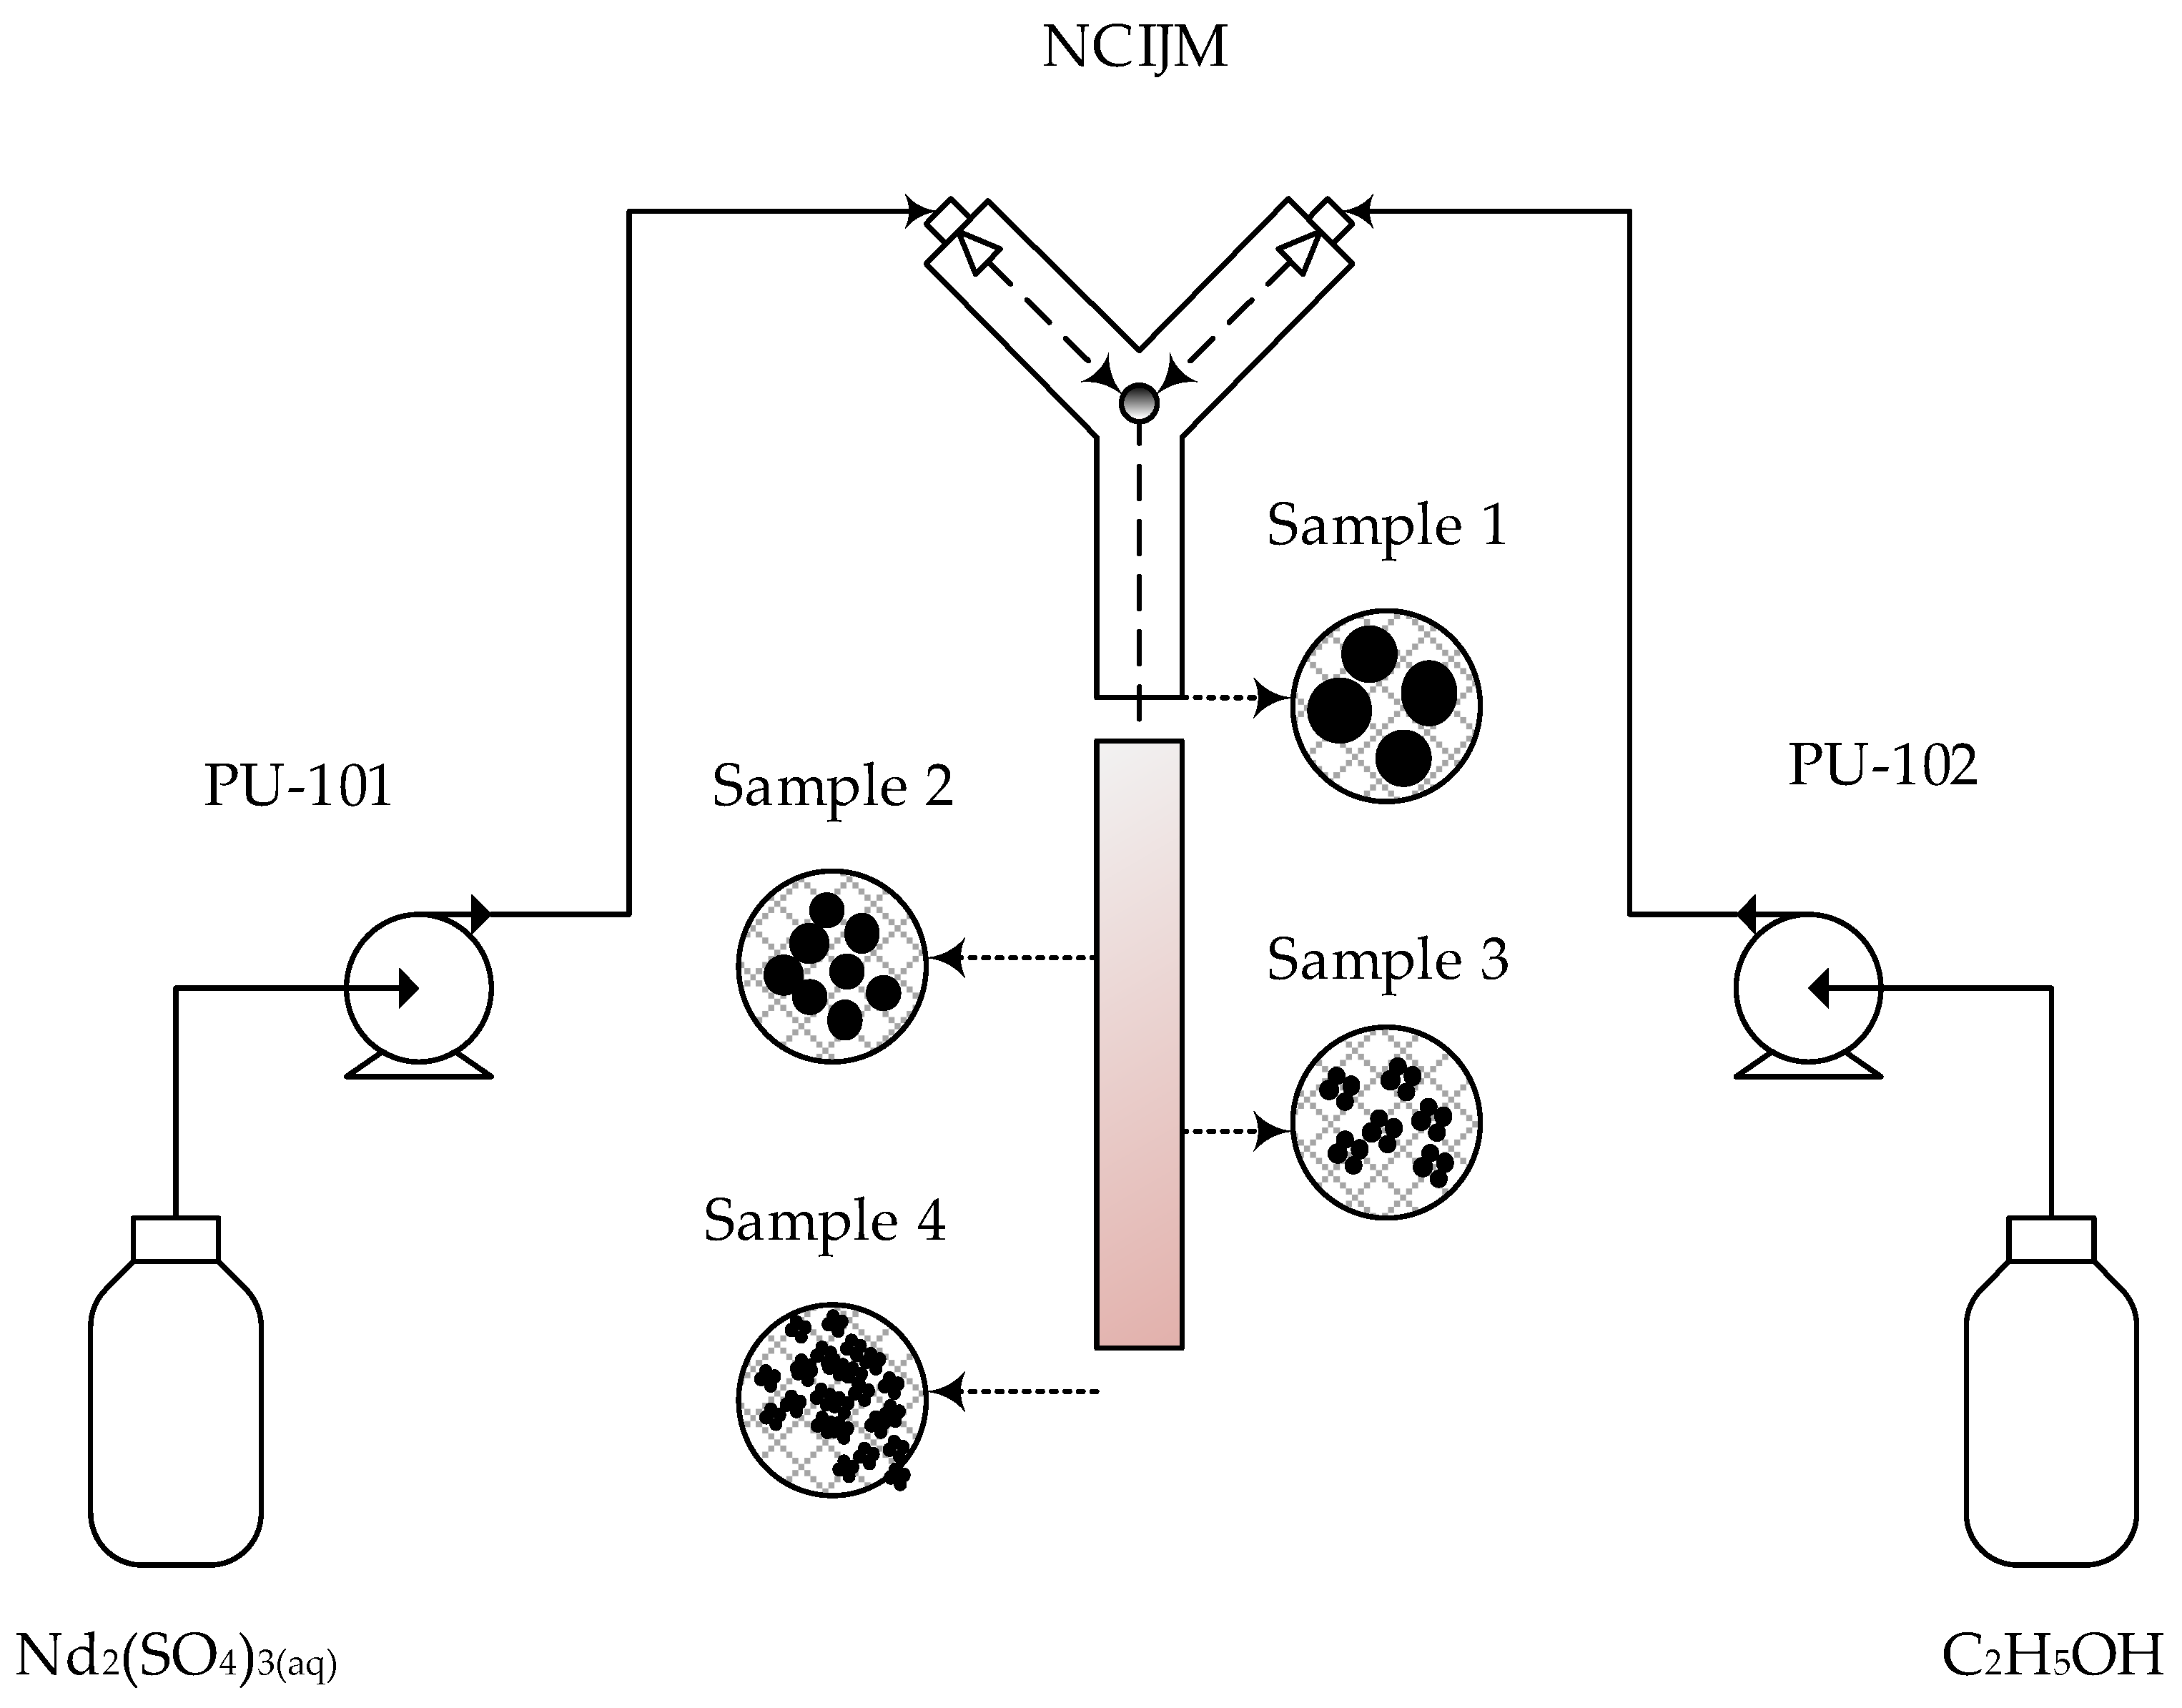
Figure 1. Intensified mixing in the NCIJM.
Metals 13 01378 g001
Figure 2. Solubility and yield curves modelled from OLI Stream Analyzer [17] at 23 °C and atmospheric pressure.
Metals 13 01378 g002
Figure 3. Particle size distribution as a function of intensified mesomixing in the NCIJM.
Metals 13 01378 g003
Figure 4. Mean, median, and modal crystal sizes, as well as span as a function of mesomixing intensity in the NCIJM.
Metals 13 01378 g004
Figure 5. Images showing particles crystallized in a NCIJM at τ m e s o of (A) −470, (B) −390, (C) −340, and (D) −300 μs, after which the suspension was allowed to age in a stirred batch crystallizer for 45 s.
Metals 13 01378 g005
Figure 6. Product yields obtained at different mesomixing intensities.
Metals 13 01378 g006
Figure 7. Images showing an increase in a number of crystals and a reduction in crystal sizes as τ m e s o was reduced. The corresponding τ m e s o values were as follows: (A) −470, (B) −390, (C) −340, and (D) −300 µs.
Metals 13 01378 g007
Figure 8. Crystal size distribution as a function of τ m e s o .
Metals 13 01378 g008
Figure 9. Mean, modal, and median crystal sizes, as well as span as a function of the mesomixing time constant.
Metals 13 01378 g009
Figure 10. Random SEM and TEM images showing (A) particles stacked on top of each other; (B) breakage; and (C,D) single crystals.
Metals 13 01378 g010
Figure 11. Effect of τ m i c r o on nucleation rate and induction time.
Metals 13 01378 g011
Table 1. Experimental operating parameters.
Neodymium Sulphate
PU-101
Ethanol
PU-102
Exp No.uA (m/s)uO (m/s)
11011
21315
31619
42022
Table 2. Mass diffusivities of the species.
Diffusivitiesm2/s
D C 2 H 5 O H H 2 O 1 × 10⁻⁹
D H 2 O C 2 H 5 O H 7 × 10⁻¹⁰
D N d 3 + m i x t u r e 5 × 10⁻¹⁰
D S O 4 2 m i x t u r e 2 × 10⁻¹⁰
Table 3. Effect of power input on mixing time constants.
Exp No.1234
u A (m/s)10131620
u o (m/s)11151922
R e A 7500990012,00015,000
R e 0 56007400920011,000
P (W)110190290410
ε (W/kg)2.4 × 1054.1 × 1056.4 × 1059.2 × 105
λ K (µm)1.61.41.21.1
τ D (s)2.1 × 10−41.8 × 10−41.5 × 10−41.4 × 10−4
τ S (s)2.6 × 10−42.1 × 10−41.8 × 10−41.6 × 10−4
τ E (s)3.8 × 10−52.9 × 10−52.3 × 10−51.9 × 10−5
τ G (s)3.7 × 10−62.8 × 10−62.2 × 10−61.9 × 10−6
τ m (s)2.6 × 10−111.7 × 10−111.2 × 10−119.2 × 10⁻¹²
τ m e s o (s)4.7 × 10−43.9 × 10−43.4 × 10−43.0 × 10−4
Disclaimer/Publisher’s Note: The statements, opinions and data contained in all publications are solely those of the individual author(s) and contributor(s) and not of MDPI and/or the editor(s). MDPI and/or the editor(s) disclaim responsibility for any injury to people or property resulting from any ideas, methods, instructions or products referred to in the content.