Article

Evolution of Microstructure and Hardness of TC11 Titanium Alloy under Different Electroshocking Treatment Directions

1
Hubei Key Laboratory of Advanced Technology for Automotive Components, Wuhan University of Technology, Wuhan 430070, China
2
Hubei Collaborative Innovation Center for Automotive Components Technology, Wuhan 430070, China
3
School of Materials Science and Engineering, Wuhan University of Technology, Wuhan 430070, China
4
State Key Laboratory of Metal Matrix Composites, School of Materials Science and Engineering, Shanghai Jiao Tong University, No. 800 Dongchuan Road, Shanghai 200240, China
*
Authors to whom correspondence should be addressed.
Metals 2023, 13(8), 1396; https://doi.org/10.3390/met13081396
Submission received: 5 July 2023 / Revised: 1 August 2023 / Accepted: 2 August 2023 / Published: 4 August 2023
(This article belongs to the Special Issue Recent Progress in the Forming of High-Strength Lightweight Alloys)

Abstract

:
The effects of electroshocking treatment (EST) direction on microstructure and hardness of TC11 alloy (Ti-6.5Al-3.5Mo-1.5Zr-0.3Si) were investigated. The results indicated that the temperature of specimens under EST along the transverse direction (T-EST) was higher than that under EST along the vertical direction (V-EST). The studies reveal the higher quantity of needle-like α martensite (αM) phases precipitated in the specimen in the case of T-EST as compared with V-EST, with a more uniform distribution of αM phases. The average Vickers hardness of specimens under T-EST and V-EST with 0.06 s were 349.3 HV and 360.8 HV, respectively, which showed an obvious increase compared to the untreated specimen. The increase in hardness was ascribed to the dispersion strengthening of needle-like αM phase, and the dispersion strengthening effect on the specimen under T-EST with 0.06 s was more obvious than on the other specimens, which was caused by a large number of evenly distributed nucleation areas for the precipitation of the αM phase and uniform distribution of the αM phase. The results indicate that a different treatment direction of EST can promote the formation of different microstructures in TC11 alloy, which demonstrates that the effect of EST cannot be simply equated with heat treatment at the same temperature.

1. Introduction

TC11 alloy (Ti-6.5Al-3.5Mo-1.5Zr-0.3Si in wt%) is a typical α+β dual-phase titanium alloy with excellent thermal strength below 500 °C. Due to high strength, excellent creep resistance, and good thermal stability, TC11 alloy is widely used in the manufacture of important aviation structural parts such as compressor disks, blades, and bladed disks [1,2,3,4,5,6,7]. The mechanical properties of alloys are very important to their applications [8,9,10,11,12,13]. To modify the microstructure and improve the mechanical properties of titanium alloys, researchers utilized different treatment methods on alloys, such as heat treatment [14,15], shot peening treatment [16], laser shock peening [17], electromagnetic treatment [18], and electric pulse treatment [19,20,21]. Studies on the evolution of microstructure and the mechanical properties of the titanium alloy under different treatment methods are essential to its practical application.
Electric pulse treatment applied to titanium alloy has been documented in many works recently as a quick and effective processing approach. Konovalov et al. [22] investigated the effect of electro pulse treatment of titanium alloy VT1-0 on the change of its fatigue life, structure, and phase composition; the results indicated that electric pulse treatment improves the fatigue life by 1.3 times which ascribes to the decrease of probable spots of crack origination owing to less internal stress concentrators in the surface layer of the material. Zhao et al. [23] prepared the ultrafine-grained Ti-6Al-4V alloy with high mechanical properties in both strength and elongation from equal channel angular pressing with a following electric pulse treatment and discovered that the elongation of the samples treated with pulsed electric current and annealing was considerably increased by 66.5% and 20.8%, respectively, while the strength remained relatively high. Ma et al. [24] carried out an electric pulse treatment to replace the traditional heat treatment in the thermal-hydrogen treatment of cast titanium alloy; the results indicated that the lamellar β phase is broken into spherical shapes and uniformly distributed in the matrix and that the cast titanium alloy was significantly strengthened after a pulsed thermal hydrogen treatment. Gao et al. [25] investigated the effects of electric pulse treatment on microstructures and mechanical properties of hot-rolled Ti-6Al-4V alloy and discovered that the specimen under an electric pulse treatment at 800 °C for 20 min with the smallest grain size of 200 μm showed the best dynamic ductility in the dynamic compression test. Lu et al. [26] explored the effects of electric pulse treatment on the microstructure evolution, mechanical properties, and crack healing of intermetallic Al3Ti alloys. Compressive stress–strain curves demonstrated that the failure strains of Al3Ti alloy increase under both the electric pulse treatment and conventional heat treatment conditions, while the increment of failure strain of Al3Ti alloy treated with electric pulse treatment is higher than that treated with conventional heat treatment. Yan et al. [27] applied a novel surface electric pulse treatment to generate local phase transformation strengthening on the surface of EBM Ti-6Al-4V while simultaneously repairing the pores in the hardened zone; the surface micro-hardness was enhanced by 36% from ∼260 HV0.2 to ∼355 HV0.2 when electric pulse treated for 120 ms.
Electroshocking treatment (EST), as a kind of optimized electric pulse treatment, shows unique advantages in improving microstructure and mechanical properties [28,29,30]. Xie et al. [31] found that EST can be used to repair defects in directed-energy-deposited Ti-5Al-5Mo-5V-3Cr-1Zr near-β titanium alloy, and the porosity of the specimen decreased significantly from 0.81% to 0.1% after EST. Song et al. [19] investigated the effects of different parameters’ processes on the fatigue life of TC11 alloy, and the results showed that the low-cycle fatigue life of the alloys increased 22.5% by the appropriate EST. Xie et al. [32] investigated the resistivity of TiB/Ti-2Al-6Sn before and after EST and found that the resistivity increased first and then decreased with the increase of EST time. Liu et al. [33] investigated the evolution mechanism of grain boundaries in TC11 alloy after EST and indicated that the proportion of high angle misorientation grain boundaries in α phase increased from 23.16% before EST to 76.61% after 0.06 s EST, which was caused by the accumulation of low angle misorientation grain boundaries at the α/β phase boundaries to form high angle misorientation grain boundaries. Wen et al. [34] characterized the microstructure of near-β Ti-5Al-5Mo-5V-3Cr-1Zr alloy with thin-wall structures manufactured with laser melting deposition (LMD) before and after EST and concluded that EST could increase the microhardness, the yield strength, and the tensile strength. Guo et al. [35] studied the effects of EST on the microstructural evolution and mechanical properties of Ti-5Al-5Mo-5V-3Cr-1Zr alloy formed with directed-energy deposition and found that the average hardness of the specimen decreased from 426 HV to 316 HV, but fracture strain increased significantly under an EST time of 0.04 s, which was attributed to the uniform dispersion of the α phase along grain boundaries and inside the β grains.
Different from traditional heat treatment, EST shows distinct directionality. However, little research about the influence of EST direction on the microstructure and mechanical properties of titanium alloys was reported. This work focuses on the influence of different EST directions on the microstructure and hardness evolution of TC11 alloy, which gives guiding significance for studying the influence of current direction on titanium alloy.

2. Experimental Procedure

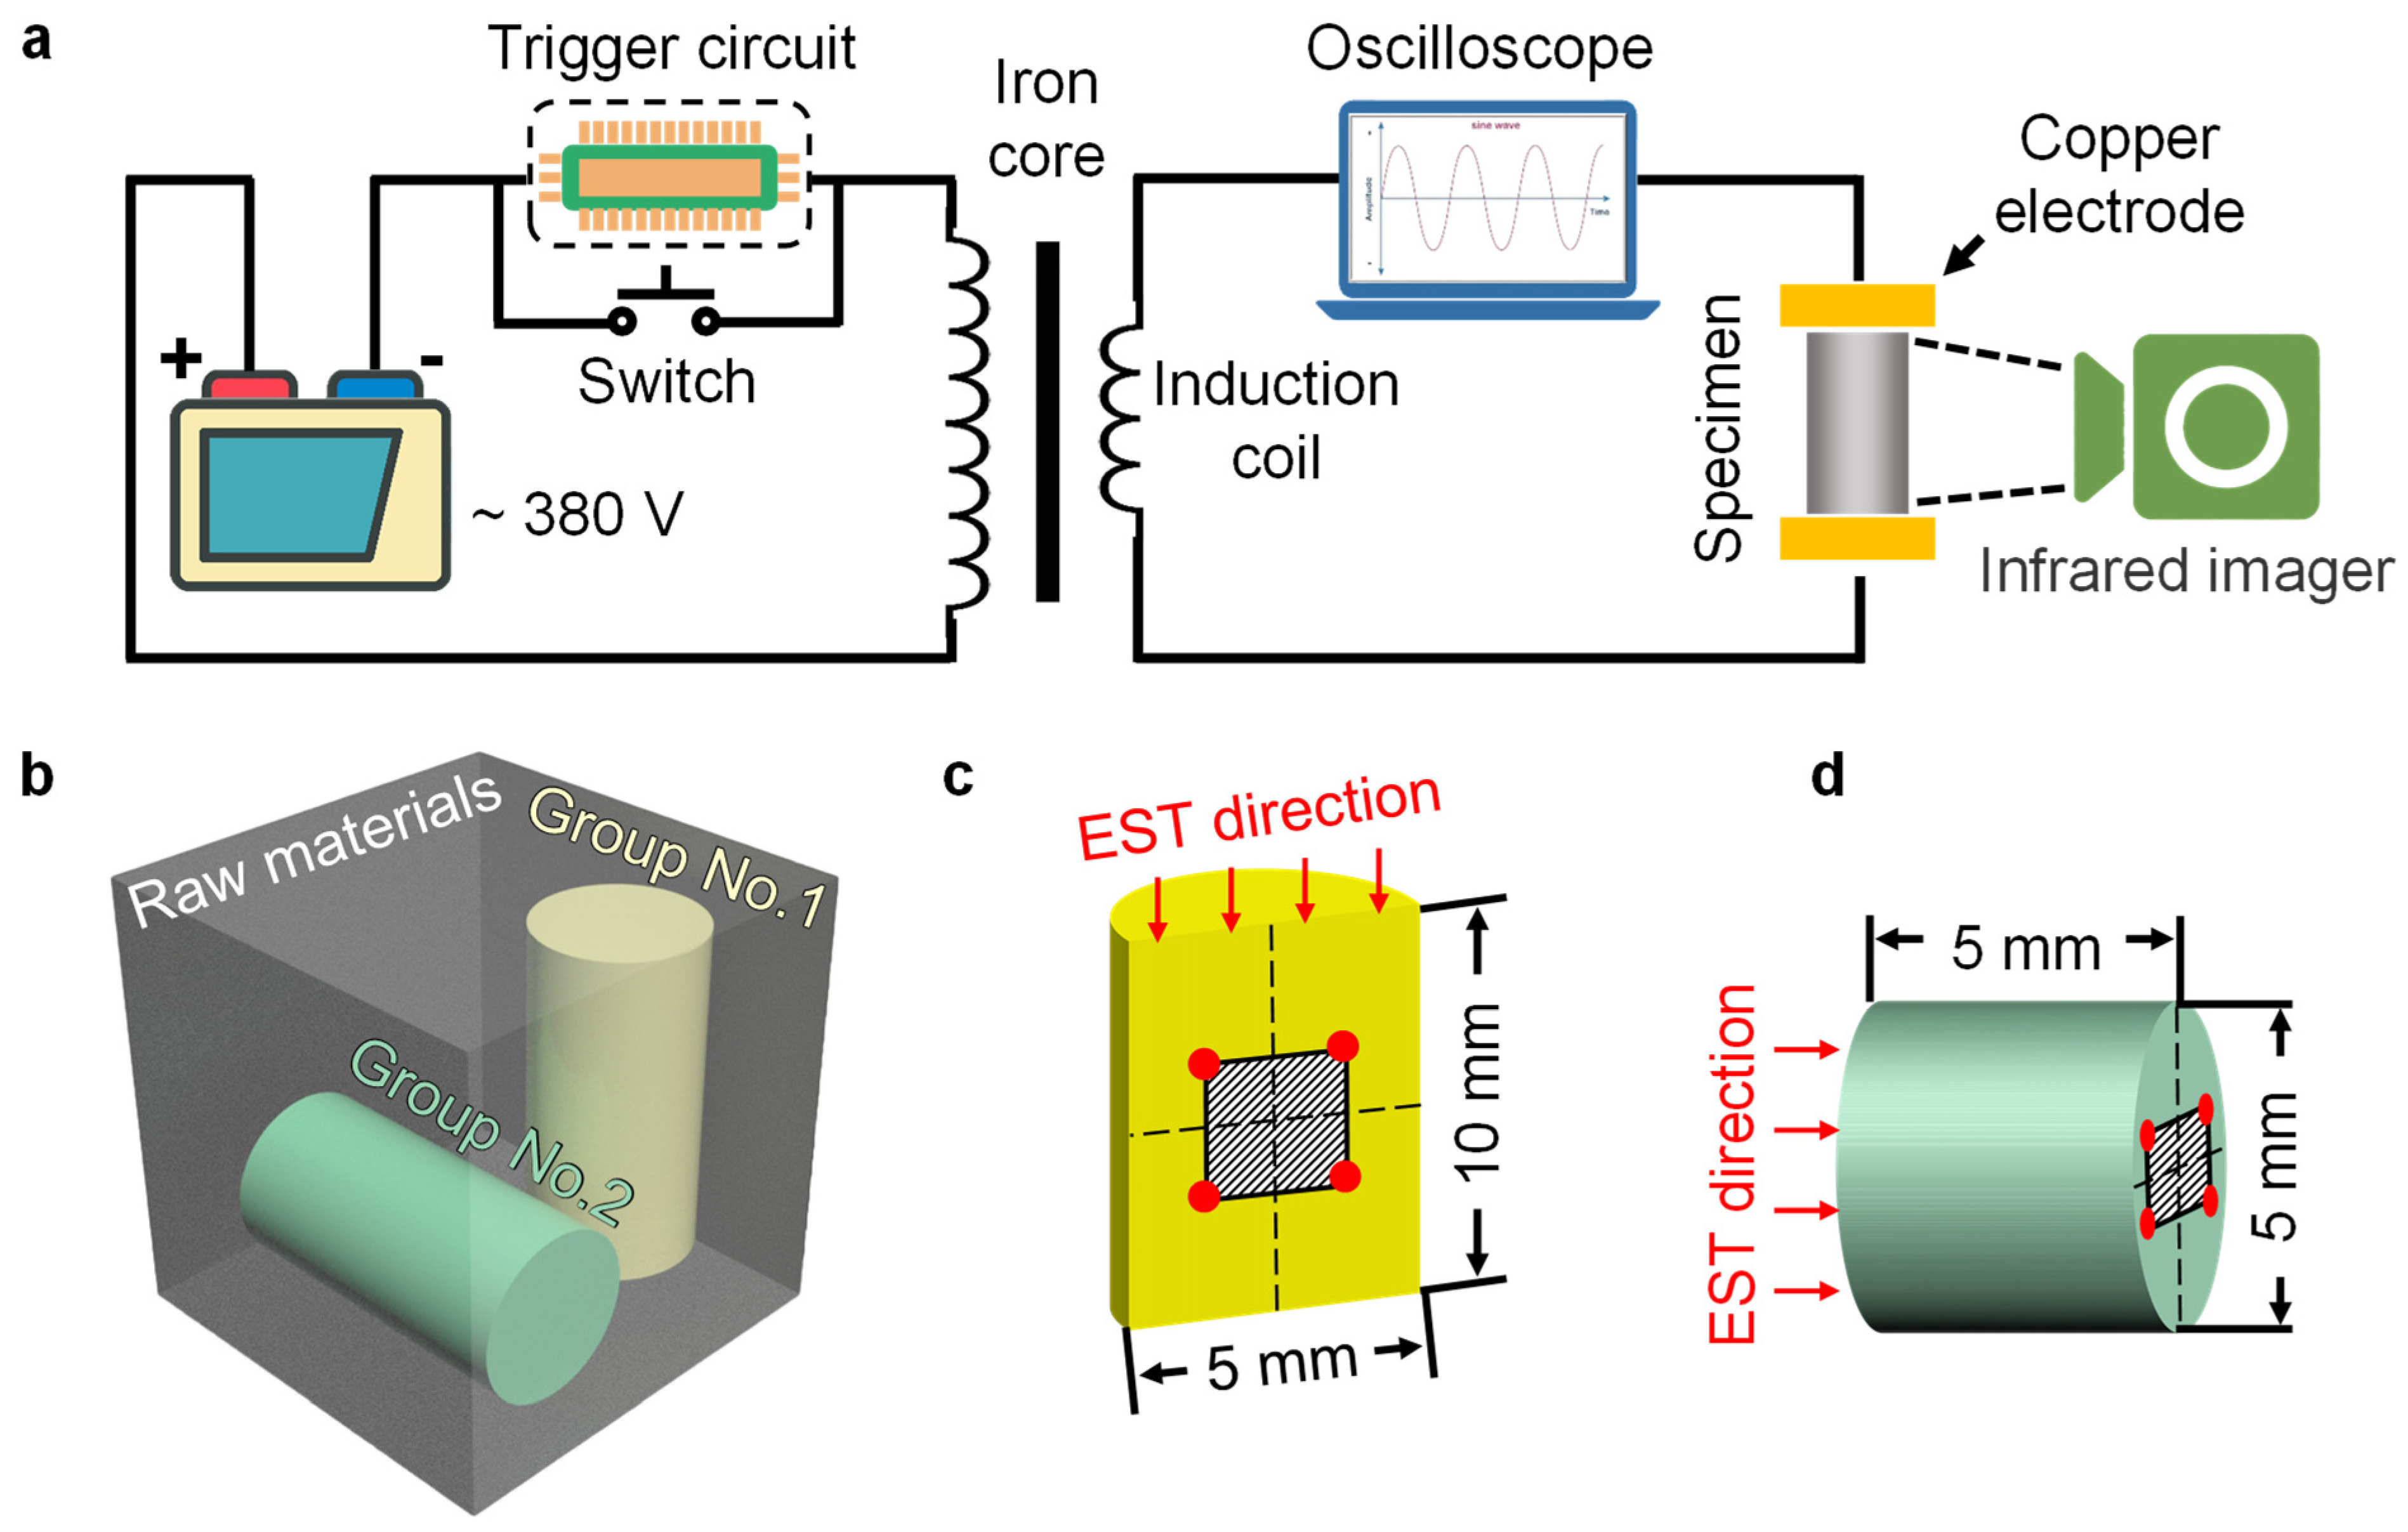
2.1. EST Experiment and Specimen Preparation

The schematic diagram of the EST experiment is depicted in Figure 1a. The specimen is placed between two copper electrodes with pulse voltage carried on through the transformer, and the pulse signal is collected by the oscilloscope. The raw rod material of TC11 alloy with a diameter of 17 mm was obtained from Baoji Titanium Industry Co., Ltd. (Baoji, China), which was obtained with hot extrusion, and the chemical composition is shown in Table 1. The raw rod material was processed into cylindrical specimens with 5 mm in diameter and 10 mm in height from wire-electrode cutting, as shown in Figure 1b. Two groups of specimens, No. 1 and No. 2, were processed into cylinders along the transverse and vertical directions, respectively. Then the polished surface specimen was placed between two electrodes of the EST equipment, making sure that the electrodes are in close contact with both the top and bottom surfaces of the cylinder specimen. The computed current density is 2.14 × 10⁴ A/cm2, while the current amplitude through the specimen under EST is 4.2 × 10³ A. Subsequently, the specimens were treated with EST in the transverse (T-EST) and vertical (V-EST) directions. The surface oxide layers of specimens were removed with abrasive papers and the corresponding specimen numbers are listed in Table 2. The temperature variations of the specimens were monitored with an infrared thermal imager (Fotric-220) with a response wavelength of 8–14 μm as shown in Figure 1a. The temperature curves were obtained from FotricAnalyzIR software. The distance between the infrared thermal imager and the specimen was 20 cm, and the measurement temperature was 20 °C.

2.2. Microstructure Characterization

Scanning Electron Microscopy (SEM) was utilized to characterize the microstructure variation. Before being made into standard metallographic specimens, the No. 1 group of specimens was cut along the central axis of cylinders (Figure 1c), and the No. 2 group of specimens was cut along the section at half-height of a cylinder (Figure 1d) with wire-electrode cutting. The characterization area was ground with abrasive papers from 240 to 4000 grits, successively, then polished by the OPS solution mixed with H2O2 (VOPS: VH2O2 = 3:2). After being polished, the specimens were cleaned using the ultrasonic method in ethanol for 10 min. SEM (JSM-IT800) was applied to characterize the microstructure variation of these two group specimens under a voltage of 20 kV and a work distance of 15 mm. To further analyze the microstructure evolution during EST, Energy Dispersive Spectroscopy (EDS) was used to analyze the element distribution in specimens while treated with different direction EST.

2.3. Hardness Test

The Vickers hardness of specimens was tested by HUAYIN HV-1000A (Laizhou Huayin Test Instrument Co., Ltd., Laizhou, China). Before hardness testing, the measurement areas of the specimen were polished. The measurement of 4 vertices of the square of 1 × 1 mm in the middle area was adopted to measure the hardness shown in Figure 1c,d. The applied load was 500 N with a holding time of 10 s.

3. Results and Discussion

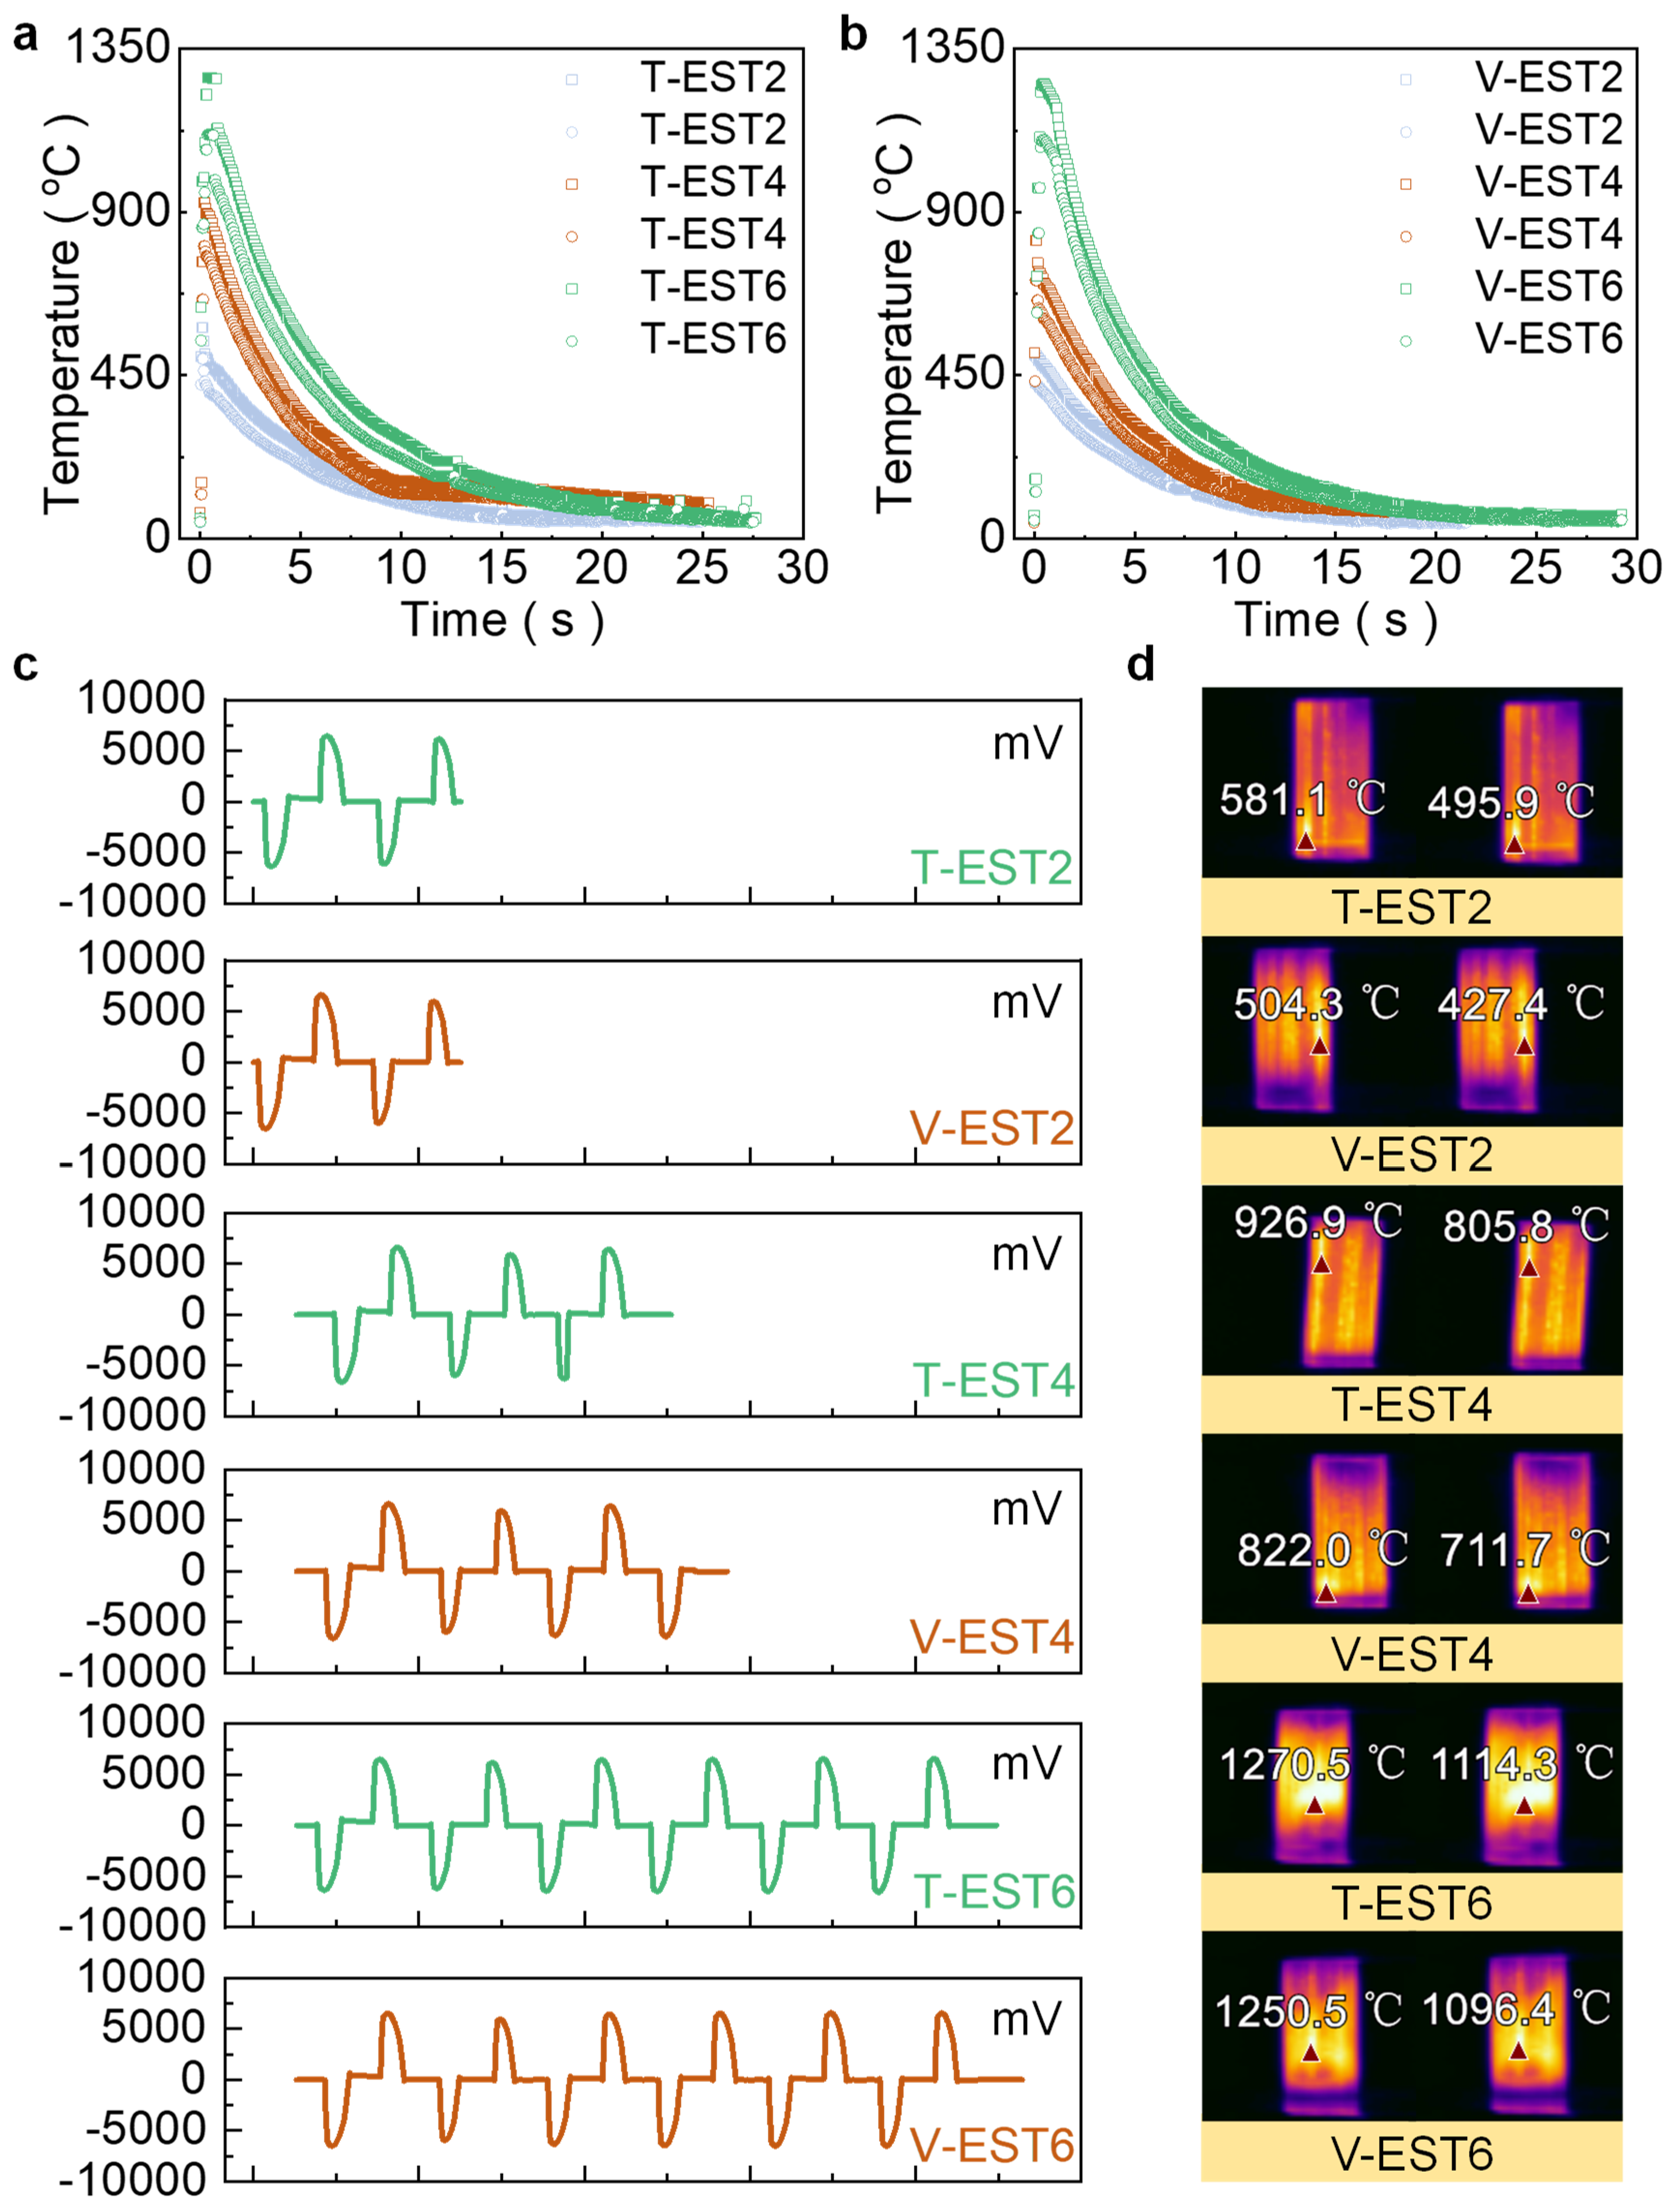
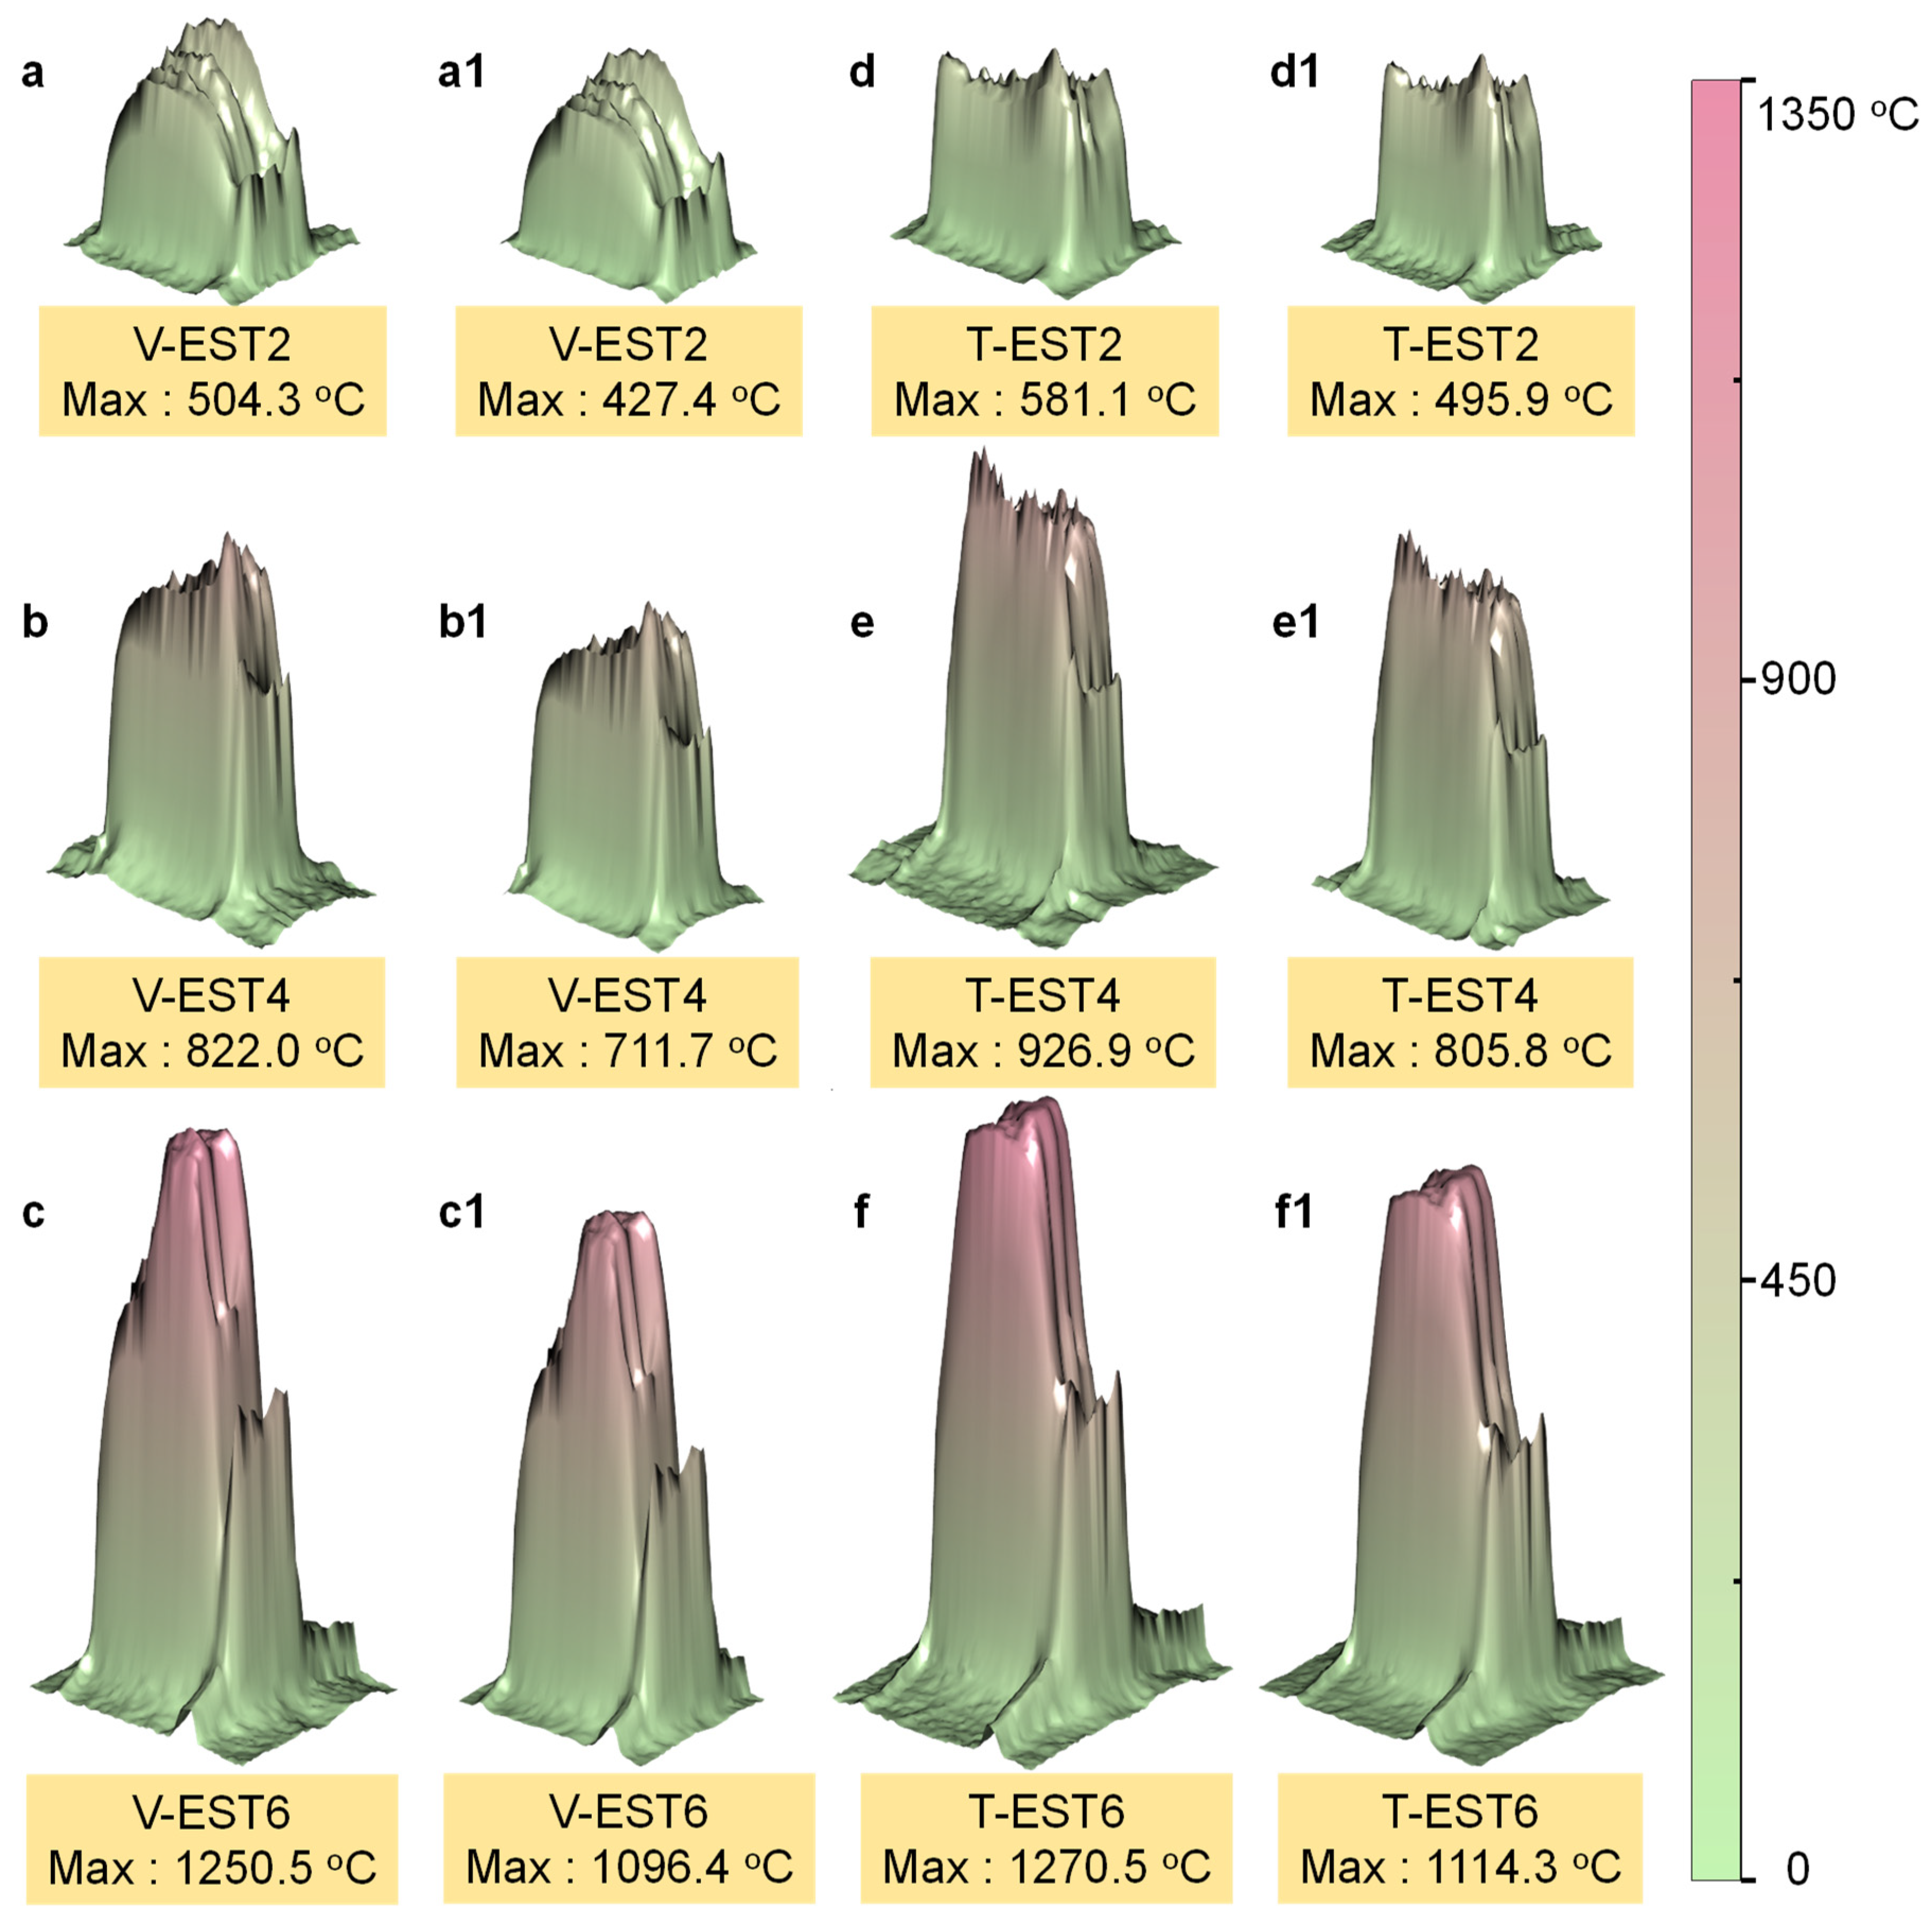
3.1. Temperature Variation of Specimen

Temperature is an important issue discussed in the research of EST, and the influence of temperature on the microstructure is crucial. The temperature variation of specimens under different direction EST are shown in Figure 2. Different wavelengths monitored during EST correspond to different emissions. Different wavelengths monitored during EST correspond to different emissions. Due to the range of the infrared wavelength used in the infrared thermal imager being 8–14 μm, the emission reference range of 0.15–0.23 is selected for the temperature calibration of titanium alloys [36]. As shown in Figure 2a,b, the temperature of specimens increased sharply in a short time and then decreased to room temperature. It can be observed from Figure 2c that the voltage amplitude is 7200 mV. The time of each cycle is 0.02 s, and the interval between two adjacent waveforms is 0.01 s, as shown in Figure 2c. As shown in Figure 2d, the maximum temperature of T-EST2, T-EST4, T-EST6 are 581.1 °C, 926.9 °C, 1270.5 °C for 0.15 emission and 495.9 °C, 805.8 °C, 1114.3 °C for 0.23 emission, respectively. The maximum temperature of V-EST2, V-EST4, V-EST6 are 504.3 °C, 822.0 °C, 1250.5 °C for 0.15 emission and 427.4 °C, 711.7 °C, 1096.4 °C for 0.23 emission, respectively, as depicted in Figure 2d. It can be found that the maximum temperature of T-EST2 and T-EST4 is higher than that of V-EST2 and V-EST4. The maximum temperature of T-EST6 shows no obvious difference from T-EST6. Different temperatures correspond to different microstructure evolutions in specimens after different direction EST.
As shown in Figure 3, the temperature distribution around the specimens at the maximum temperature is received from the infrared thermal imager data corrected with FotricAnalyzIR software. Under the same environmental condition, the higher the Joule heat generated by EST, the greater the thermal radiation energy. As depicted in Figure 3a–f,a1–f1, the thermal radiation energy of T-EST2 and T-EST4 is higher than that of V-EST2 and V-EST4, respectively, indicating that the temperatures of T-EST2 and T-EST4 are higher than that of V-EST2 and V-EST4, respectively. The thermal radiation energy of T-EST6 shows no significant difference from that of V-EST6. The phenomenon is consistent with the temperature variation depicted in Figure 2d. The results conclude that the Joule heat effect of EST is not only related to time but also to the direction.

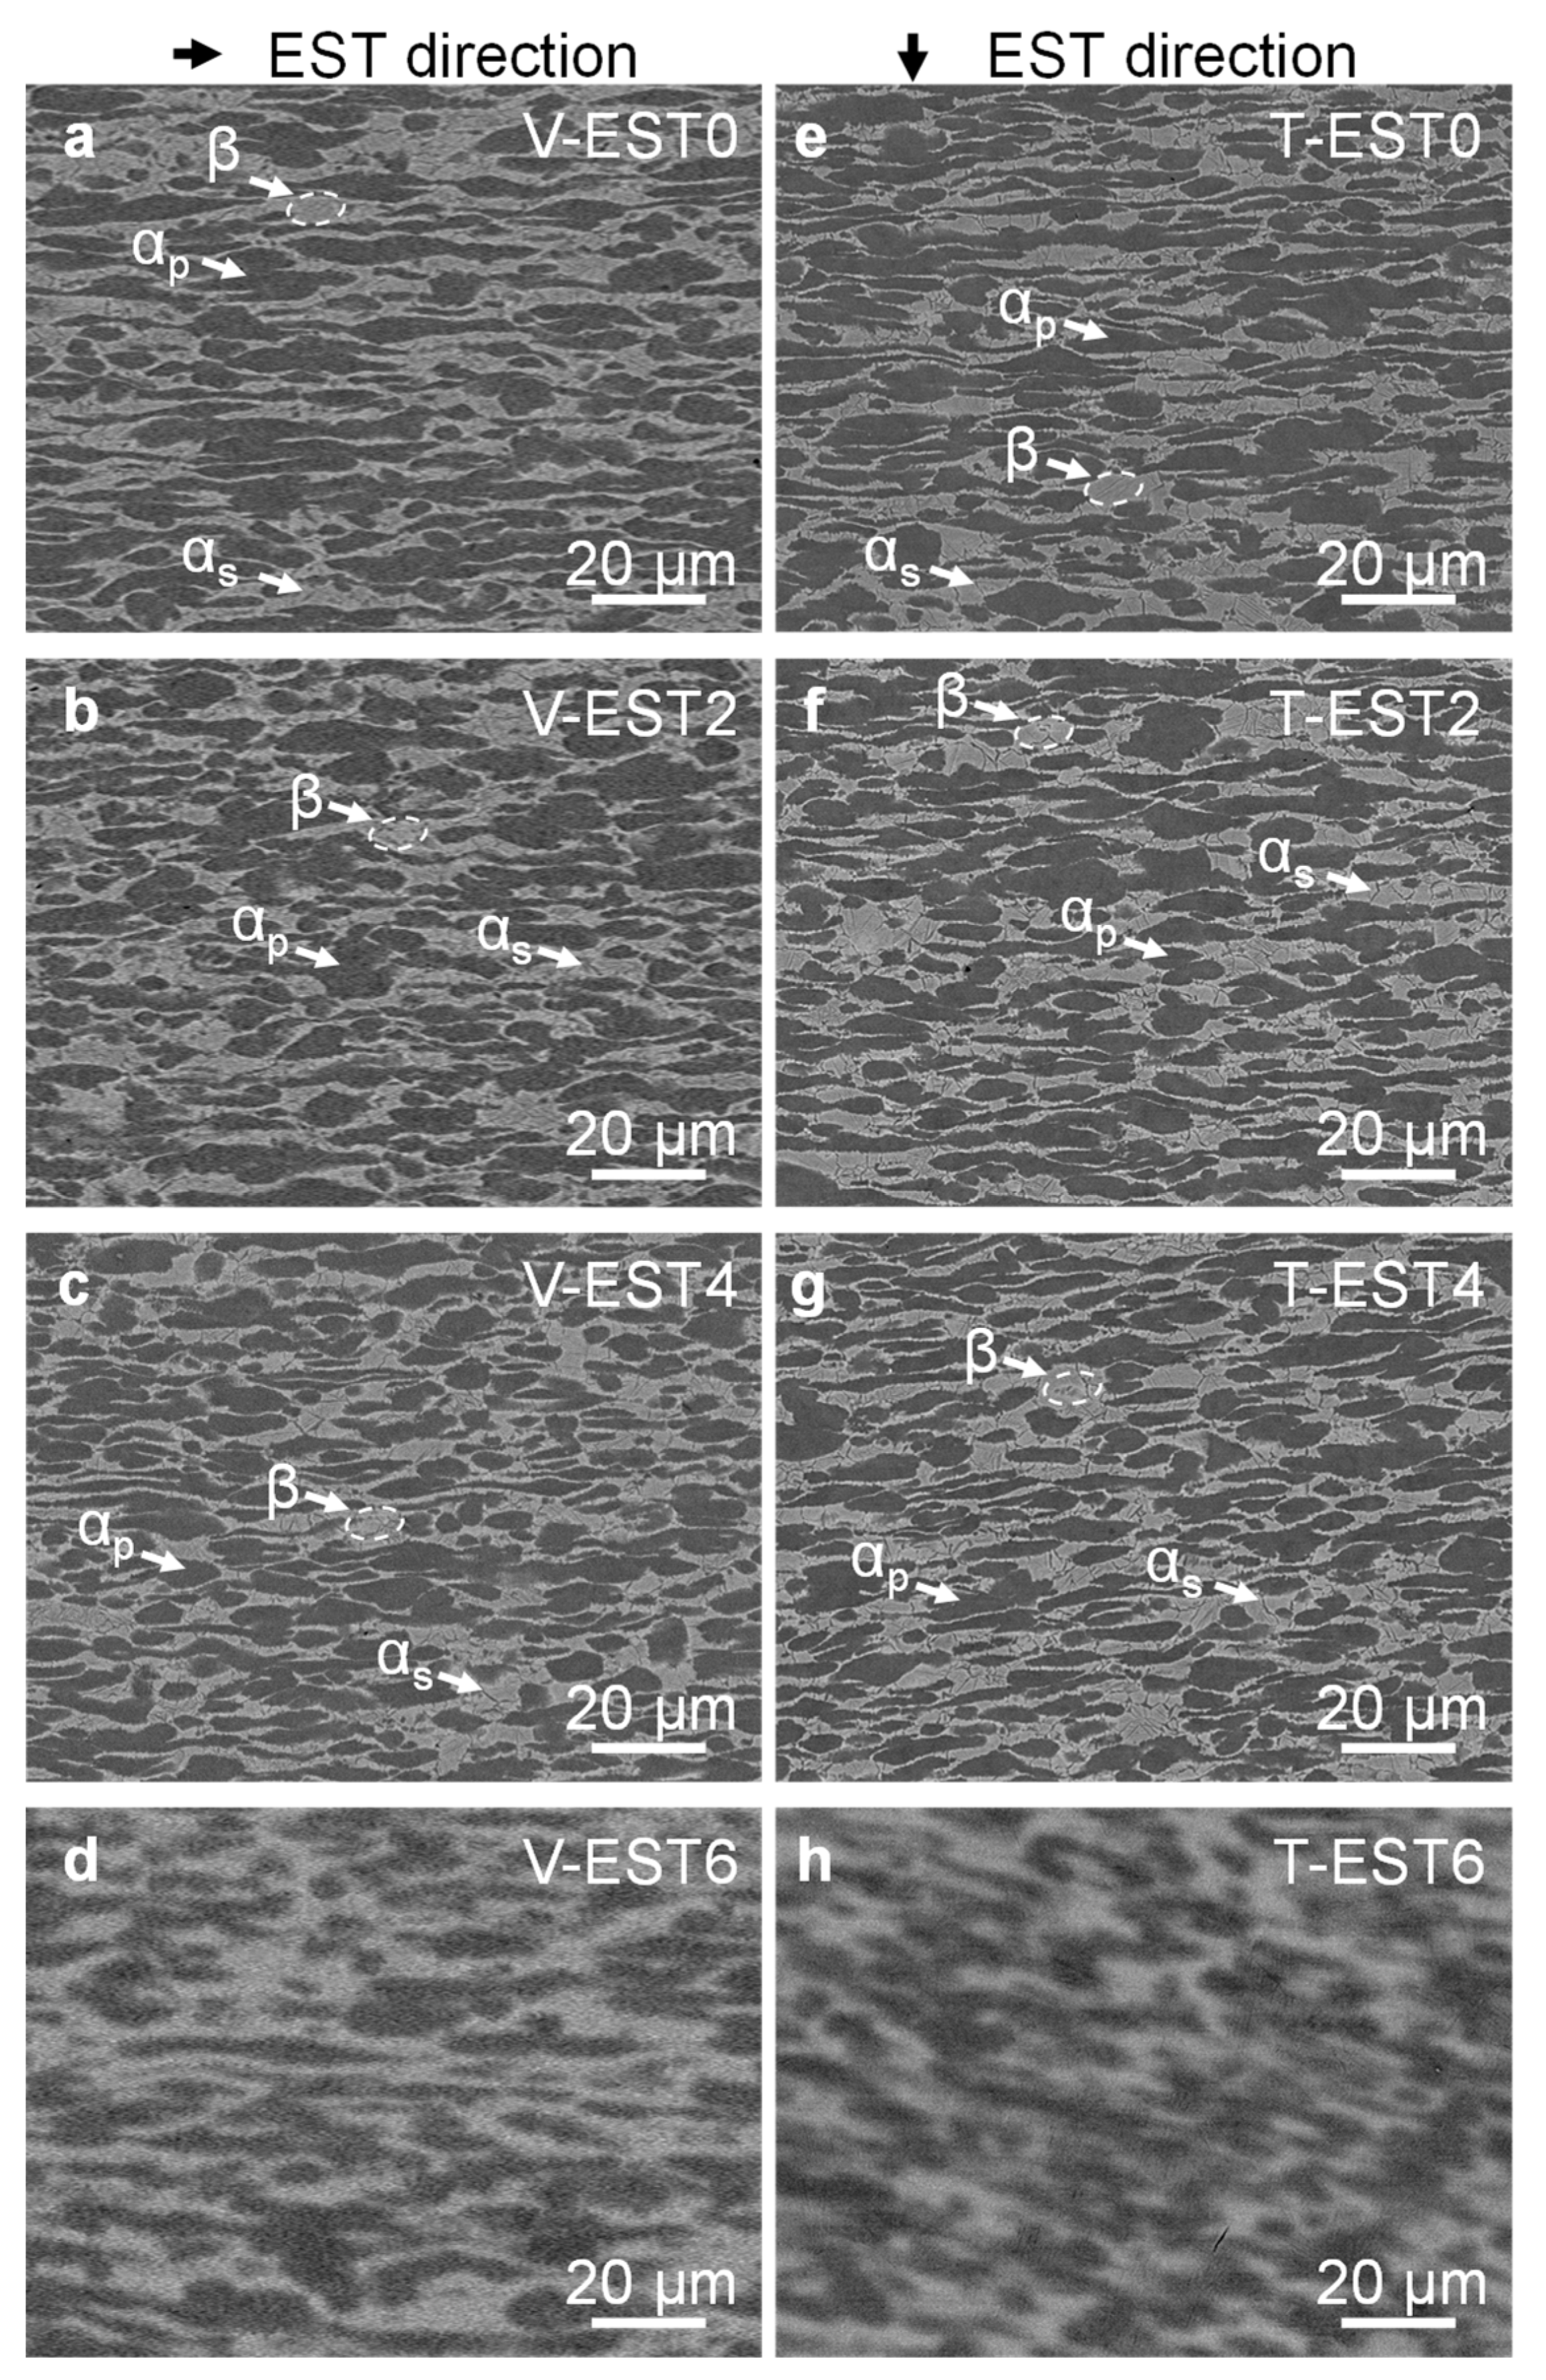
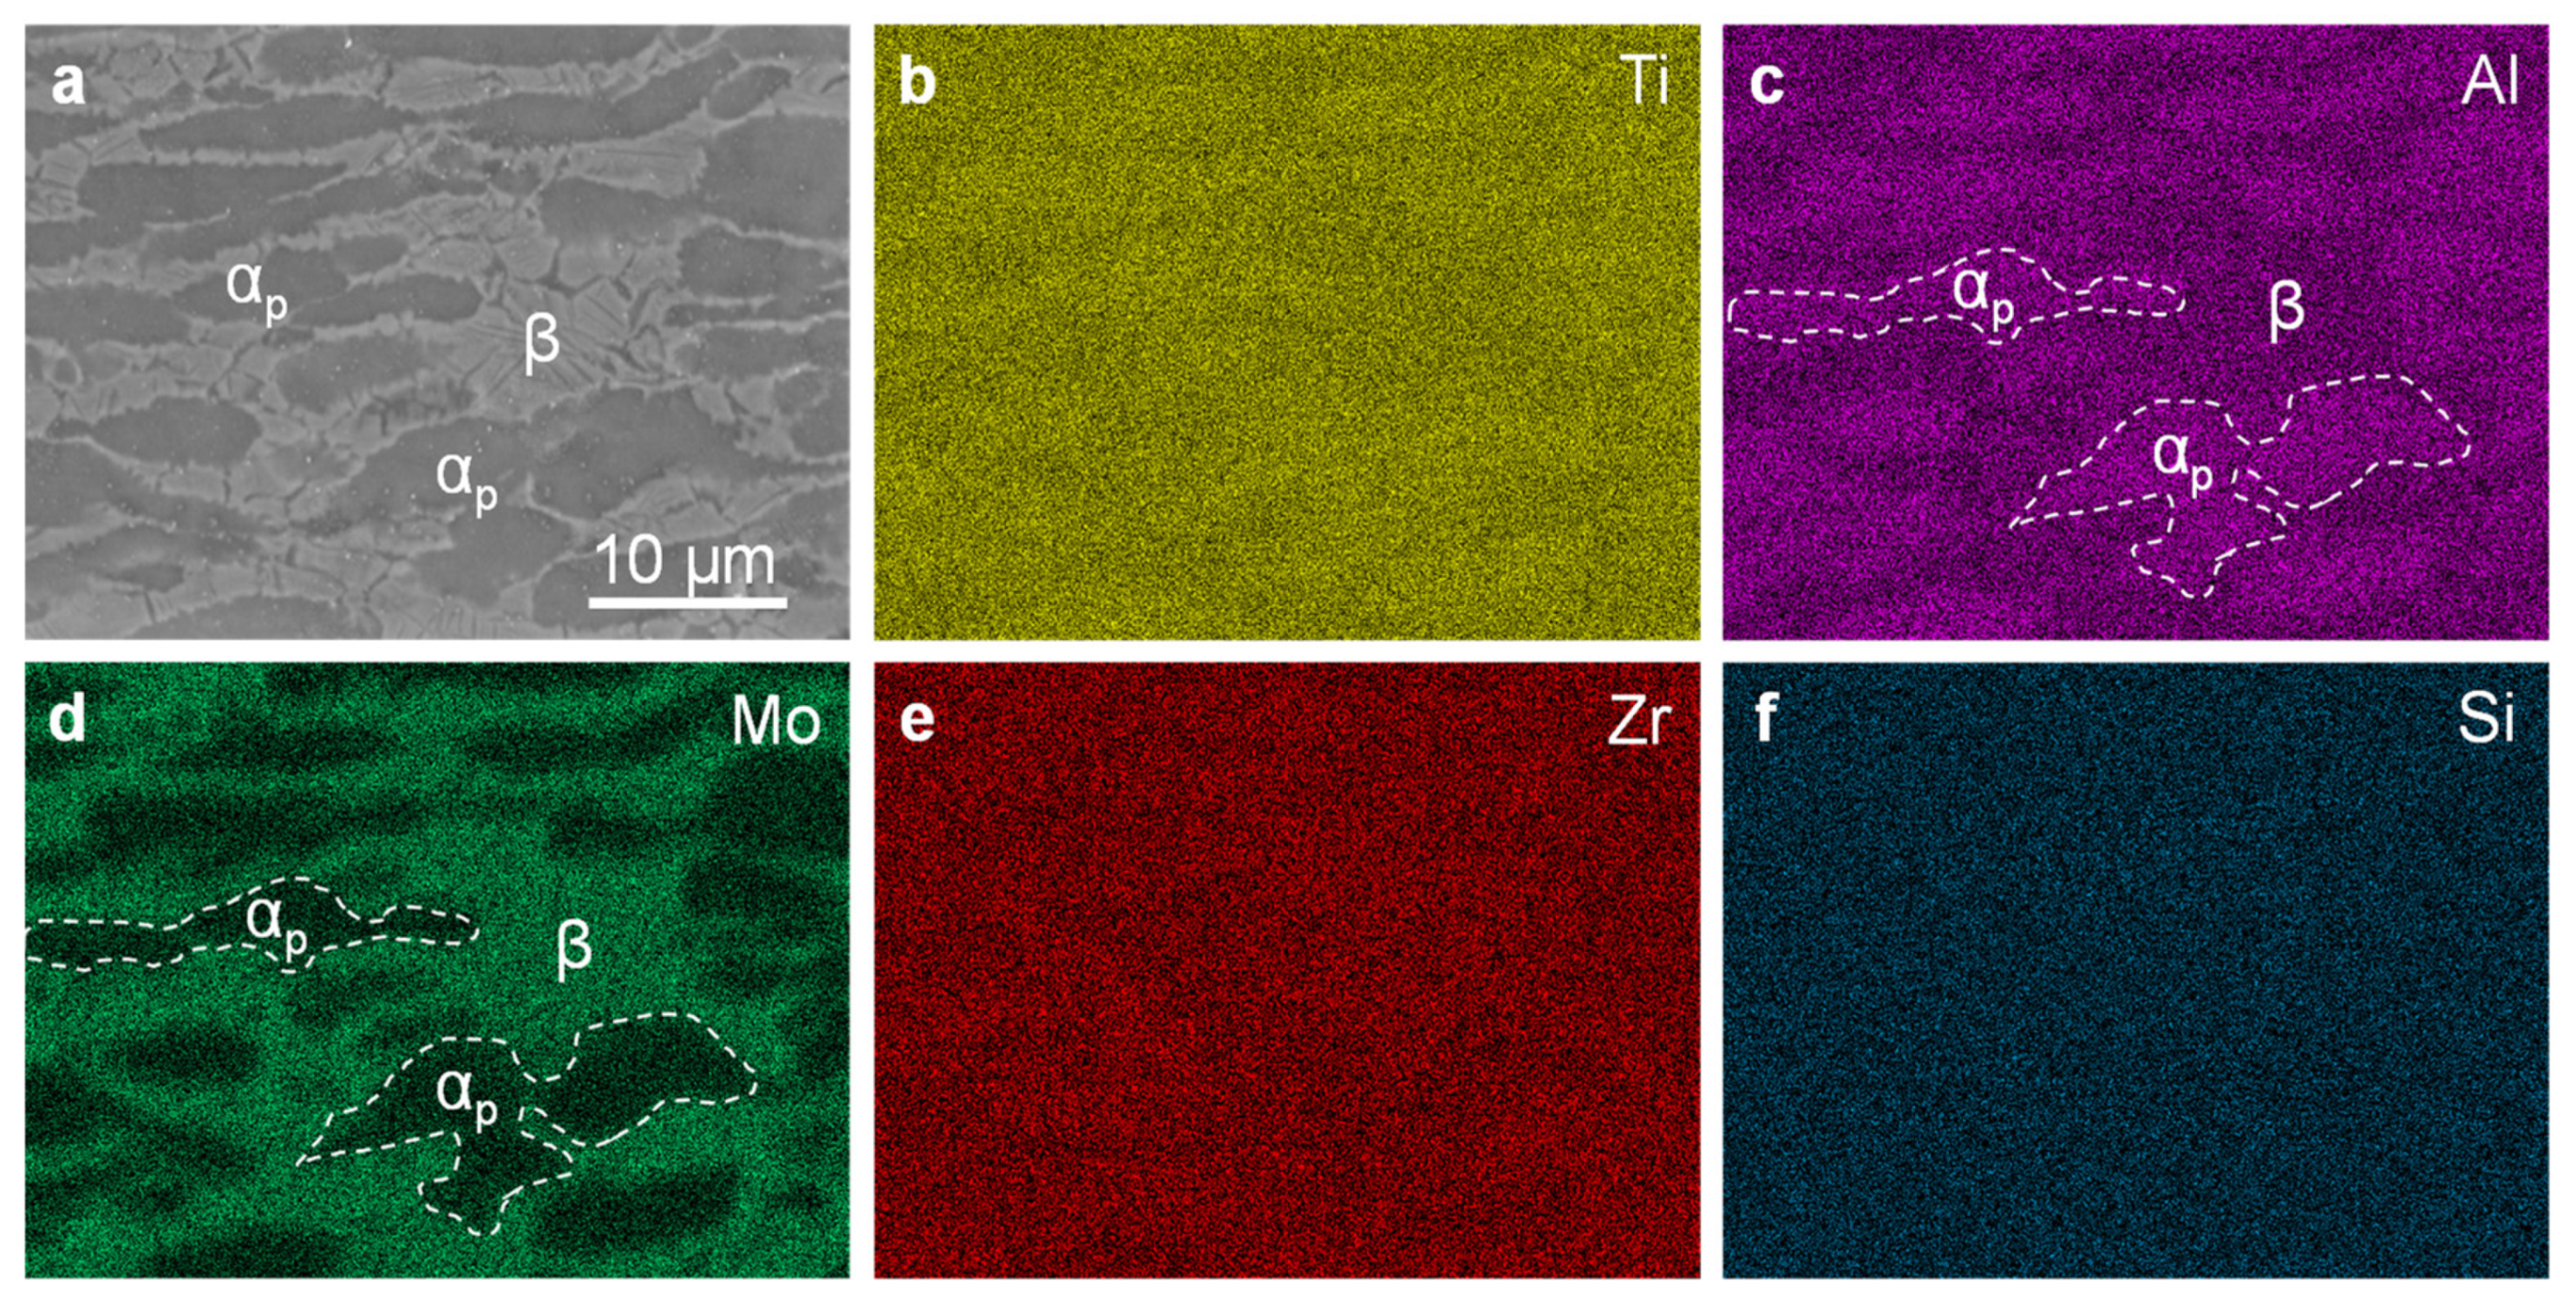
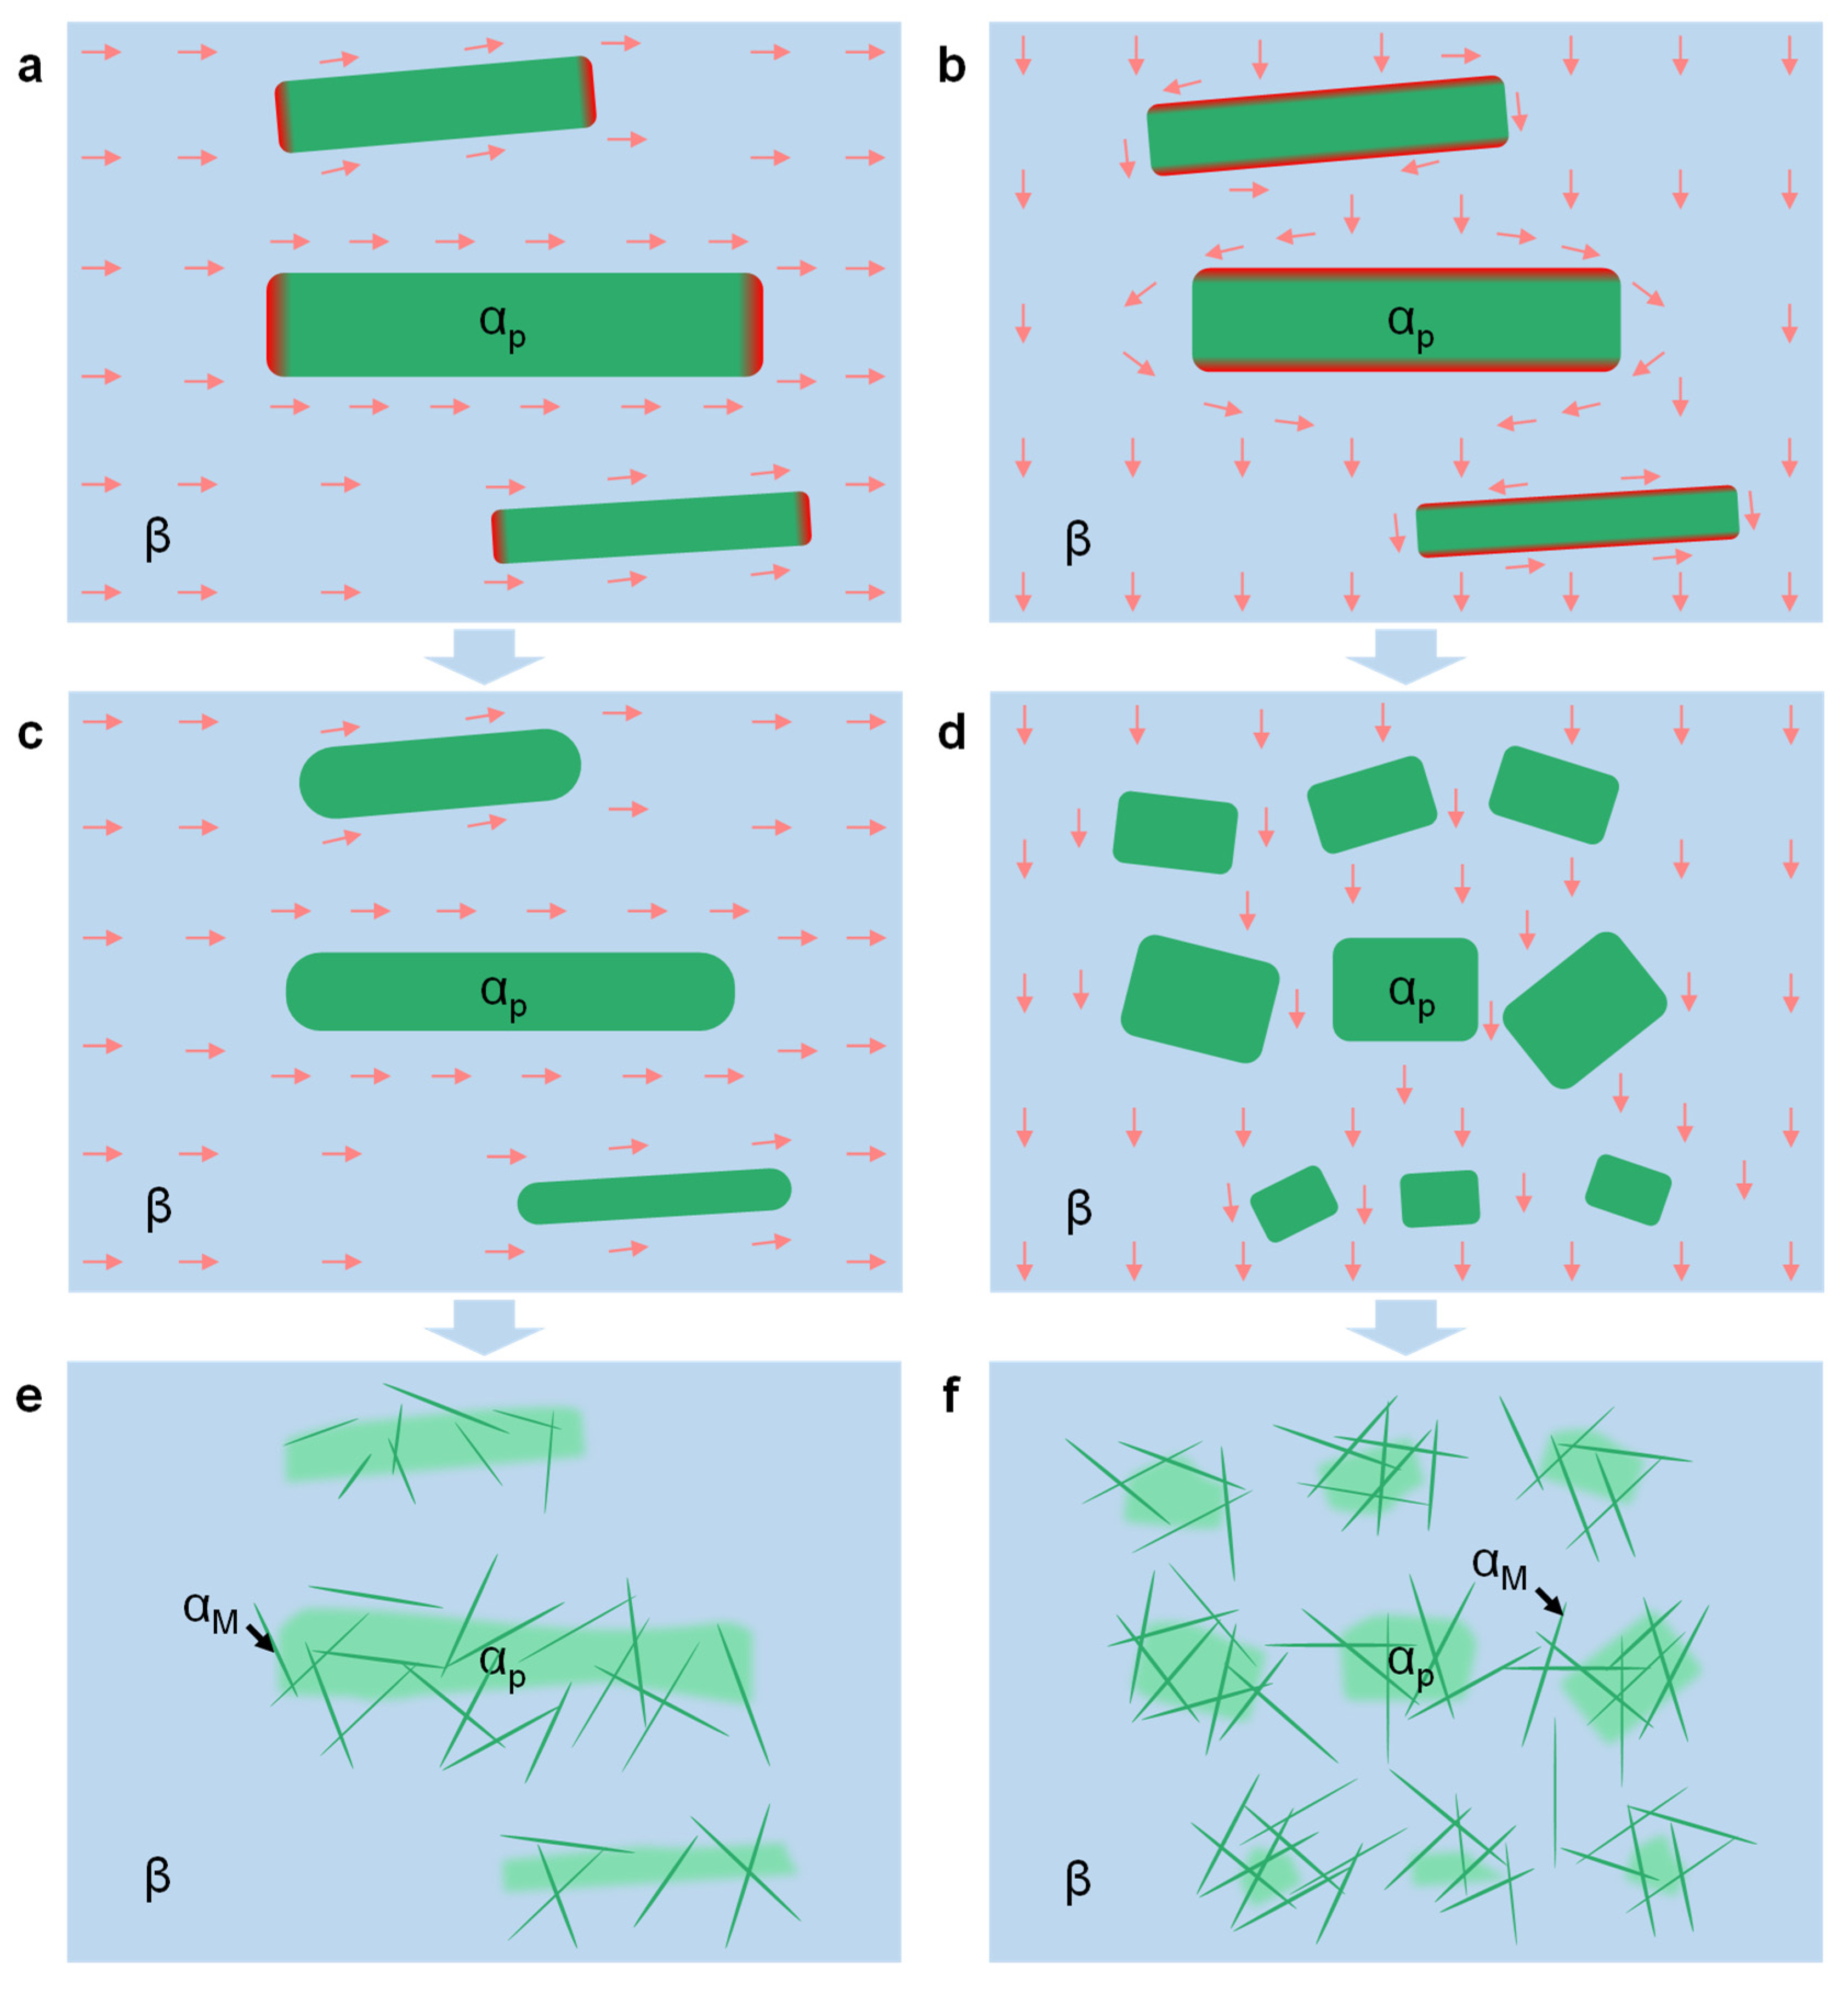
3.2. Microstructure Characterization

The increase of specimen temperature under EST inevitably affects the evolution of microstructure. As depicted in Figure 4a,e, the microstructure of V-EST0 and T-EST0 is consisted of the lath primary α phase (αp) in black and β phase in white before EST, and acicular αs phase (seen in Figure 5 clearly) is distributed in β phase. These α and β phases were distributed along the V-EST direction (Figure 1c) because of the extrusion of the raw material. To study the influence of EST direction on microstructure, the same characterization sections of group No. 1 (Figure 1c) and No. 2 (Figure 1d) were selected for comparison. The microstructures of V-EST0 and T-EST0 are similar due to the same characterization section. When the T-EST is carried out for 0.02 s, the microstructure variation of V-EST2 and T-EST2 is not significant (Figure 4b,f) and the lath-like αp phase gradually transforms into equiaxed αp phase. The equiaxed phenomenon is more obvious in T-EST2 which is ascribed to the higher temperature of T-EST2 during EST (in Figure 3d,d1). As the EST time increased to 0.04 s, the area of β phase increased (shown in Figure 4c,g). The energy concentration in V-EST4 and T-EST4 during EST increased the temperature of the specimens significantly. The specimen temperature range of V-EST4 (711.7–822.0 °C) and T-EST4 (805.8–926.9 °C) reached the α → β phase transition point as EST of 0.04 s [29]. Hence, the decrease in black area (αp phase) in T-EST4 is more obvious than that of V-EST4, which indicates that more αp phases in T-EST4 transform into β phase compared with that in T-EST4. The αp phases in T-EST2 and T-EST4 show a more obvious equiaxed shape. When EST time increased to 0.06 s, it can be found that the more obvious phase transformation in V-EST6 and T-EST6 occurs, depicted in Figure 4d,h. The main reason is that the maximum temperatures of V-EST6 (1096.4–1250.5 °C) and T-EST6 (1114.3–1270.5 °C) exceed the temperature of the β phase transformation point; both αp phase and β phase undergo phase transformation, and then a large number of needle-like αM phases are precipitated during cooling. The morphology of αM phase cannot be observed because of the low magnification of Figure 4, which will be characterized and discussed in Figure 5. The phase transformation process under the action of EST was reported in previous work [29]. The microstructure evolution of alloy is related to the solution temperature and the cooling rate during heat treatment. Comparing the microstructures of V-EST6 and T-EST6 shown in Figure 4d,h, different microstructures are formed under different EST directions with the same time, but the temperature of V-EST6 and T-EST6 shows no obvious difference. The αp areas (black area) in T-EST6 is equiaxed which is more than obviously lath αp areas (black area) in V-EST6.
According to the phenomenon described in Figure 4, it can be concluded that the effect of EST is different from the heat treatment. Comparing the Figure 4d with Figure 4h, it can be observed that the black areas (equiaxed areas) in T-EST6 are more than that of V-EST6. The black area exists in lath shape in V-EST6. However, the temperature of V-EST6 and T-EST6 displays no obvious difference during EST, and the V-EST6 and T-EST6 are all cooled in air. The different microstructures of V-EST6 and T-EST6 show that the effect of EST cannot be attributed to Joule heat simply but also the direction of EST.
As shown in Figure 5, high magnification SEM images display the phase transformation of αs to β. It can be observed in specimens of V-EST0 and T-EST0 that the acicular αs phase distributes in β phase (Figure 5a,e). With the EST time increased to 0.02 s, the acicular αs phase in V-EST2 and T-EST2 shows no obvious variation in Figure 5b,f. While EST time increased to 0.04 s, some acicular αs phases in V-EST4 and T-EST4 began to transform into β phases (elliptical area), depicted in Figure 5c,g, and its length decreased and width increased [37]. It can be concluded that the acicular αs phase gradually transforms into β phase with the increase of EST time. As depicted in Figure 5d,h, it can be found that a large number of needle-like αM phases are precipitated in V-EST6 and T-EST6. The precipitation area of αM phase is mainly distributed in the αp phase area. Comparing Figure 5d,h, the precipitation density of αM phase in T-EST6 is denser than that in V-EST6. The area where αp phase was located before EST is the precipitation area of the αM phase, shown in Figure 5d with Figure 5h. However, it is found that the αp areas in T-EST6 are larger than that of V-EST6, comparing Figure 4d with Figure 4h, which provides the possibility precipitation of more αM phase. As the EST time increases to 0.06 s, the temperature rises sharply in a short time (resulting in the temperature over that of the β phase transition). After cooling in the air, the fine needle-like αM is precipitated [38].
Phase transition is accompanied by the diffusion of elements [38]. The element distribution of specimens is characterized via EDS under different EST directions. Because V-EST0 and T-EST0 are carried out before EST and the characterization sections are the same, the results of the specimen element distribution are similar. As shown in Figure 6, the specimen mainly contains Ti, Al, Mo, Zr, and Si elements, in which Al is the stable element of α phase, Mo is the stable element of β phase, and Zr and Si are neutral elements. Less Mo elements and more Al elements are distributed in the αp phase area, and more Mo elements and fewer Al elements are in the β phase area. The Zr and Si elements are evenly distributed. The clear dividing line (marked by a dotted line) between Mo and Al elements at the α/β phase interface can be observed. To further explore the element distribution of specimens under different EST directions, the distributions of Mo and Al in V-EST2, V-EST4, V-EST6 and T-EST2, T-EST4, T-EST6 are shown in Figure 7. As an EST time of 0.02 s applied, the distribution of Mo and Al elements in V-EST2 and T-EST2 show no obvious variation (Figure 7a,b), mainly because the temperature of EST is not enough to promote the obvious phase transformation in the T-EST2 and V-EST2. When EST time increased to 0.04 s, the temperature in V-EST4 and T-EST4 exceeded the temperature of α phase transition due to energy concentration. The Mo and Al elements in V-EST4 and T-EST4 begin to diffuse, as shown in Figure 7c,d, and form an element transition area at the interface (marked with a dotted rectangle). The result is consistent with some αp phase in V-EST4 and T-EST4 transforming into β phase, shown in Figure 4c,g. Increasing EST time to 0.06 s, a higher temperature formed in V-EST6 and T-EST6 during EST which promoted the drastic phase transformation between α and β phases. The Mo and Al elements diffuse, as depicted in Figure 7e,f, and the clear element distribution dividing line becomes blurred, which cannot be observed at the αp/β interface (marked with a dotted rectangle). The study has shown that the diffusion of Mo from β phase to α phase promotes the precipitation of αM phase [29] and that the addition of Mo promotes the precipitation of a nano-martensite phase, increasing the volume fraction of martensite [39]. Different from the V-EST6, the diffusion phenomenon in T-EST6 is more obvious. The phenomenon can be confirmed in Figure 4d,h; the number of αM phases precipitated in T-EST6 is more than that in V-EST6, and the distribution of αM phases is more uniform than V-EST6 which indicates the phenomenon of element diffusion accompanied by phase transformation is more obvious in T-EST6. The results indicate that the phase transformation of TC11 alloy under different direction EST is accompanied by different degrees of element diffusion.

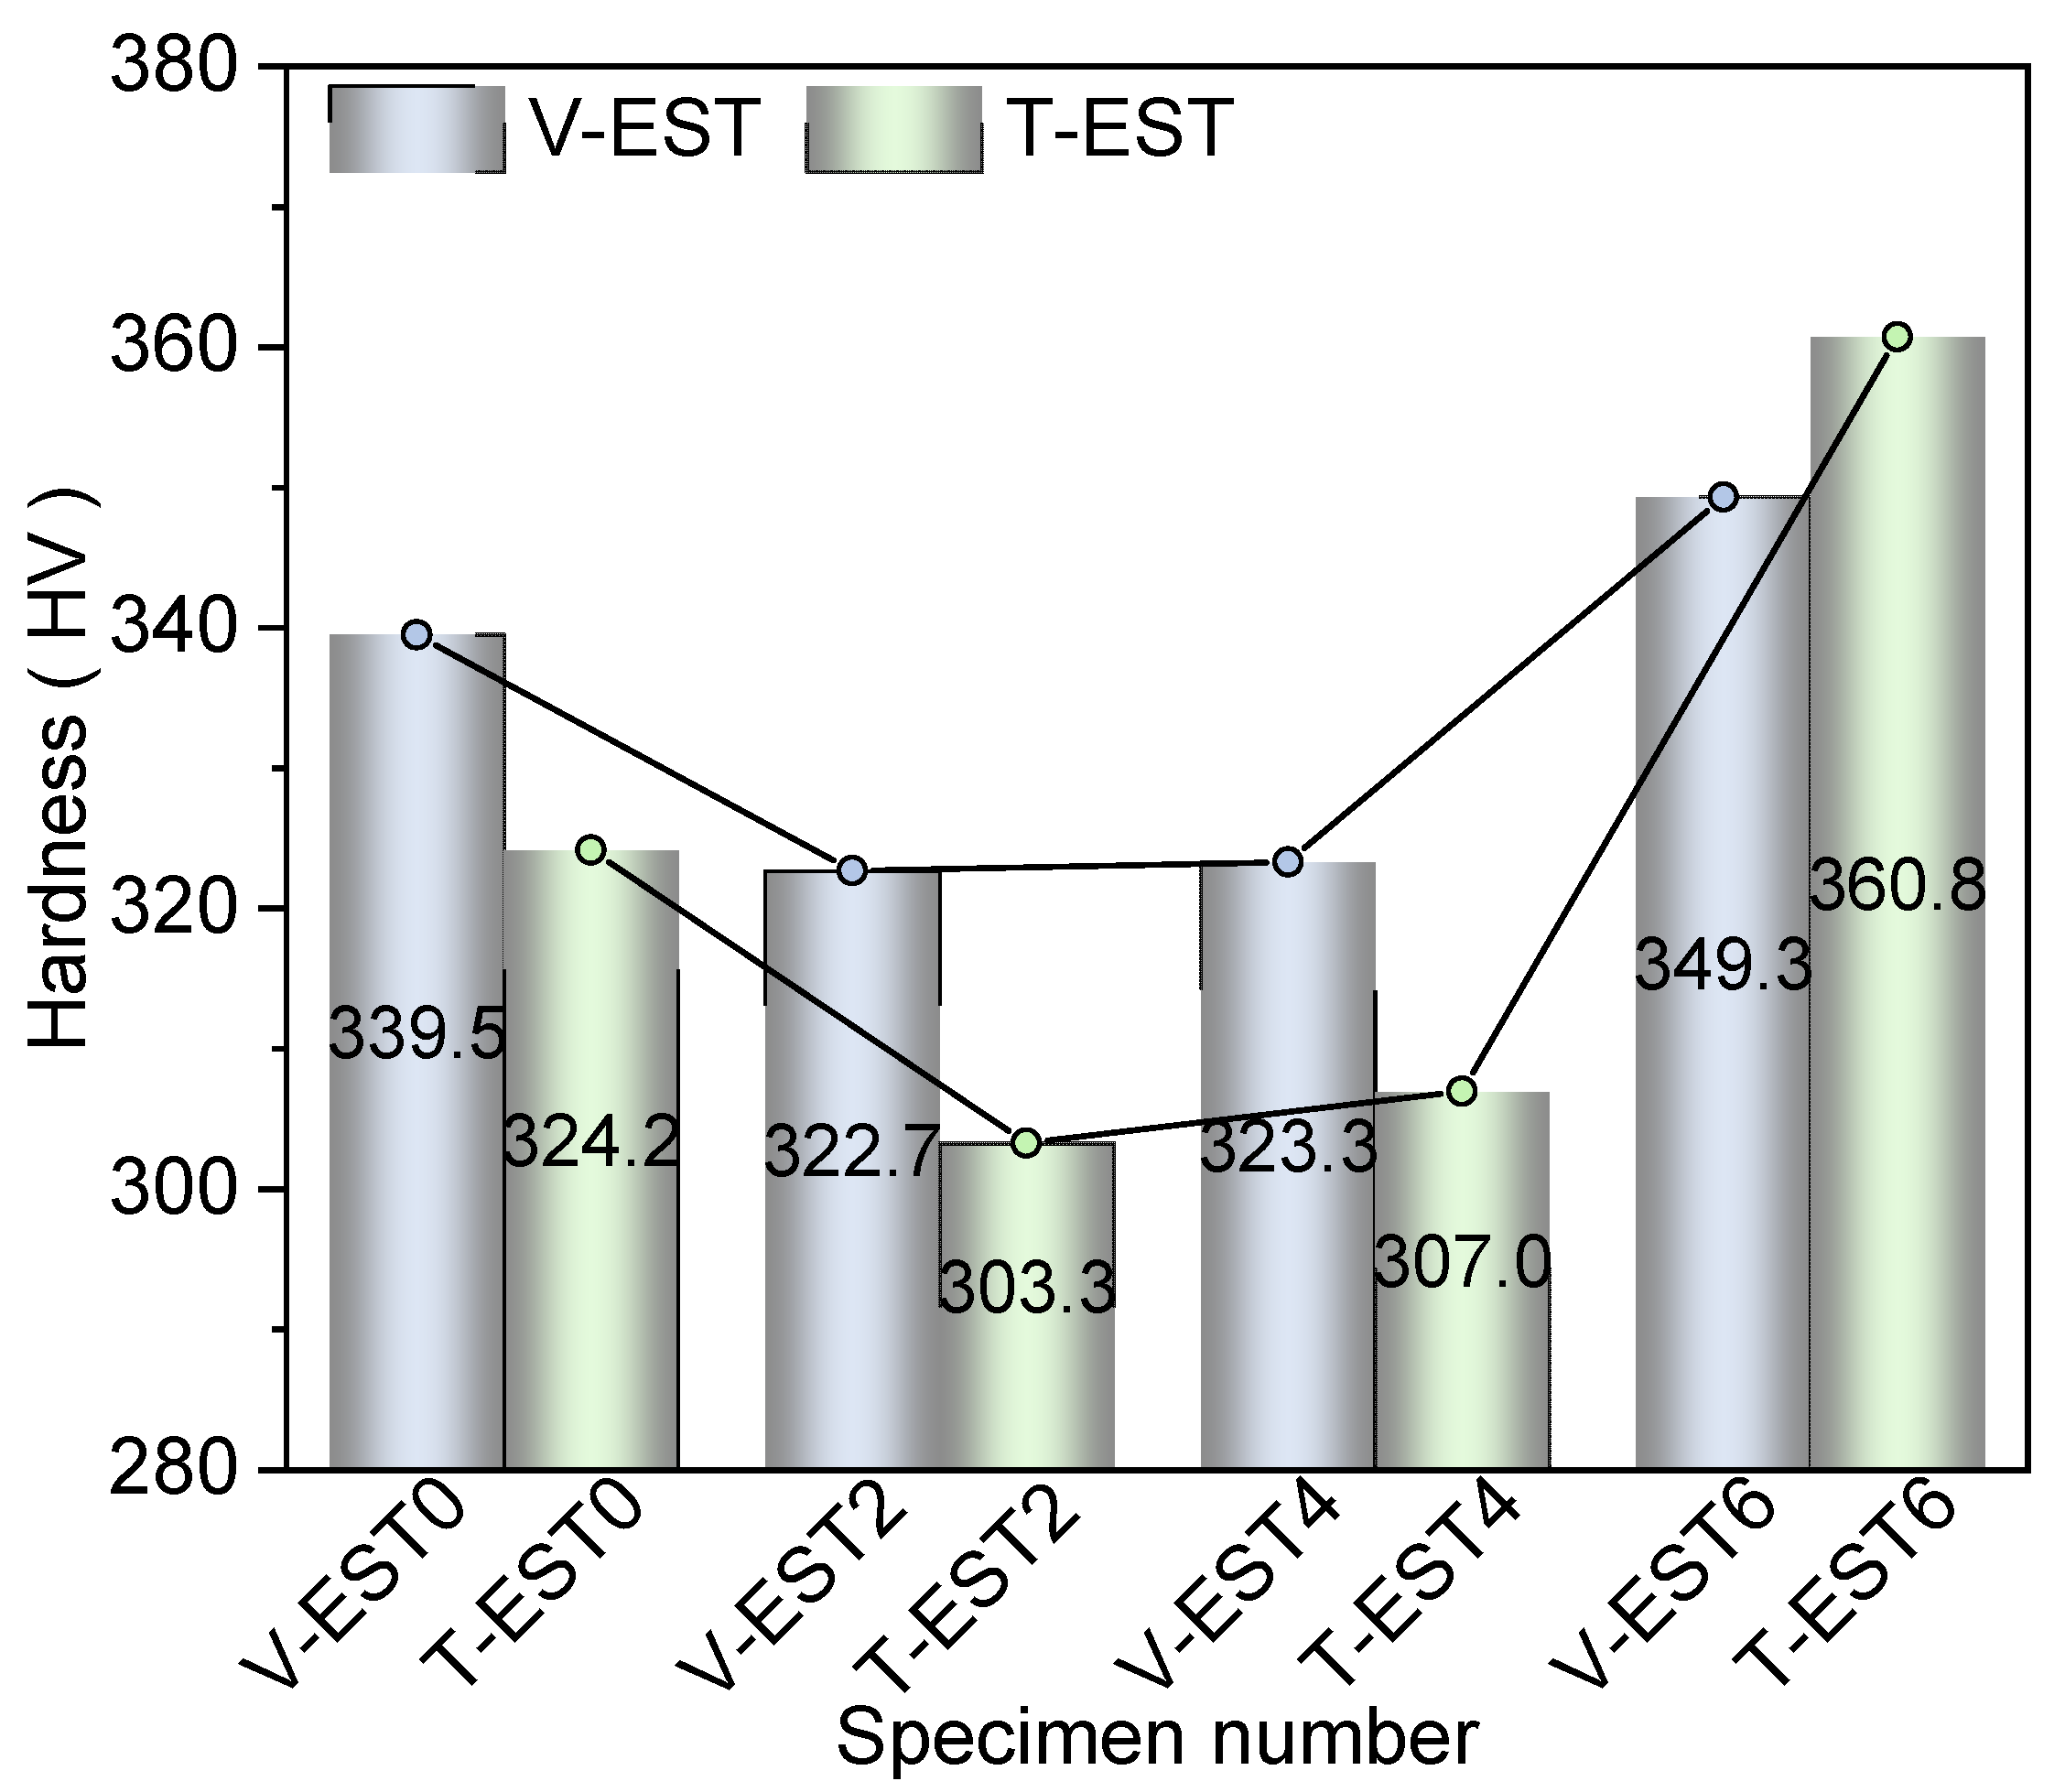
3.3. Hardness Variation

To explore the influence of different EST directions on the mechanical properties of TC11 alloy, the Vickers hardness of specimens under different direction EST was tested. The four points in the middle area (shown in Figure 1c,d) are used to conduct the Vickers hardness test. As shown in Figure 8, the average Vickers hardness (calculated as the average value of four points) of V-EST0, V-EST2, V-EST4, and V-EST6 are 339.5 HV, 322.7 HV, 323.3 HV, 349.3 HV, respectively, and the average Vickers hardness of T-EST0, T-EST2, T-EST4, and T-EST6 are 324.2 HV, 303.3 HV, 307.0 HV, 360.8 HV, respectively. As shown in Figure 8, the microstructure transformation in V-EST2, T-EST2, V-EST4, and T-EST4 is not obvious compared to V-EST0 and T-EST0, but the variation of phase constitution still exists [37]. The average Vickers hardness of V-EST2, T-EST2, V-EST4, and T-EST4 show a slight drop which is attributed to the obvious phase transition of the acicular αs to β. As the EST time increased to 0.06 s, the grains are refined. The Hall–Petch relation states that the material’s yield strength increases with decreasing average grain size, and the study shows that the strength of titanium alloy may be increased by reducing the grain size [40]. The average Vickers hardness of V-EST6 and T-EST6 is improved. The precipitated fine needle-like αM phase plays the role of dispersion strengthening.
By comparing the average Vickers hardness values of specimens under different direction EST, it can be found that the decrease in average Vickers hardness values of T-EST2 and T-EST4 is 20.9 HV and 17.2 HV compared to T-EST0, and the decrease in average Vickers hardness values of V-EST2 and V-EST4 is 16.8 HV and 16.2 HV compared to V-EST0. The decrease in average Vickers hardness values of T-EST2 and T-EST4 is more than that of V-EST2 and V-EST4, correspondingly, indicating that the transformation of α to β phase in T-EST2 and T-EST4 is more intense than that of V-EST2 and V-EST4. This phenomenon is consistent with the microstructure described in Figure 4. It can be observed that the content of α phase (black area) in T-EST2 and T-EST4 is less than those of V-EST2 and V-EST4, indicating that more α phase undergo phase transformation. The decrease of acicular αs phase leads to the weakening of the strengthening effect. In Figure 8, the average Vickers hardness value of T-EST6 is higher than that of V-EST6, which is closely related to the microstructure. As shown in Figure 4d,h, more αp area for the precipitation of αM phase in T-EST6 can be observed. The needle-like αM phase in T-EST6 is more dispersed compared to V-EST6. It can be found that more precipitation of αM phase is shown in T-EST6, which are distributed discretely. The result leads to more αM phase precipitation and uniform distribution in T-EST6. Therefore, the dispersion strengthening effect of αM in T-EST6 (increase of 36.6 HV) is more obvious than that of V-EST6 (increase of 9.8 HV) which leads to a higher average Vickers hardness.
The obvious differences in Vickers hardness (Figure 8) and microstructure (Figure 4d,h) between V-EST6 and T-EST6 can be observed, and the mechanism diagram of αM phase transformation under the action of different EST directions is illuminated. The resistivity of α phase is greater than that of β phase, and the resistivity decreases when the transformation of α to β phase occurs [41,42,43]. Therefore, a different EST direction will cause different temperature variations on TC11 specimens. As shown in Figure 9a,b, the blocking effect (red area in αp phase) of acicular αp phase on the current in the specimen under T-EST is more obvious than that of the specimen under V-EST due to the difference of the first action area of different direction EST, resulting in a higher specimen temperature than that of a specimen under V-EST with the same EST time. The result is consistent with Figure 2 and Figure 3, and the temperatures of T-EST2, T-EST4, and T-EST6 are higher than that of V-EST2, V-EST4, and V-EST6, respectively. Moreover, the αp area in the T-EST6 (Figure 4h) is more than that of V-EST6 (Figure 4d) due to the different EST direction, and the αp area in the T-EST6 is equiaxed. With the increase of EST time, the α phase is gradually equiaxed under the action of V-EST, as shown in Figure 9c, while the α phase decomposed into a small α area phase under the action of T-EST depicted in Figure 9d. When the temperature of EST exceeds the β phase transition point, the αp area is the location where the αM phase precipitates in the process of rapid cooling. More αp area in T-EST6 makes it possible for more αM phase precipitation. As the temperature of EST exceeds the β phase transition point, the precipitation density of αM phase in T-EST is higher, and the distribution is more uniform compared to that of V-EST (in Figure 9e,f) which results in the specimen’s average Vickers hardness of T-EST being higher than that of V-EST. Different phase transformation occurs inside the specimen as EST is only different in the direction applied, which results in a different microstructure and mechanical property.

4. Conclusions

The effect of different EST directions on microstructure and hardness of TC11 alloy were investigated. Some important results were obtained.
(1) The temperature variation of the specimens under T-EST is higher than that of V-EST with the same EST time, which results in the transformation of αs to β phase after T-EST and V-EST with 0.04 s and the precipitation of massive αM phases as the T-EST and V-EST time increases to 0.06 s.
(2) The number of αM phases precipitated in a specimen with T-EST for 0.06 s is greater and the distribution is more uniform compared with that of a specimen with V-EST for 0.06 s. The main reason is that T-EST direction promotes the formation of equiaxed αp areas which results in the precipitation of a large number of αM phases with uniform distribution.
(3) The average Vickers hardness of specimens under T-EST and V-EST with 0.06 s increases from 339.5 HV and 324.2 HV to 349.3 HV and 360.8 HV, which were ascribed to the dispersion strengthening effect of a needle-like αM phase. The dispersion strengthening effect of a specimen under T-EST with 0.06 s is more obvious due to the large number and uniform distribution of precipitated αM phase.
(4) As EST with the same time acted on a specimen, the blocking effect of αp phase relative to T-EST is higher than that of V-EST which results in a higher Joule heat and more intense transformation of αp to β phase. When Joule heat exceeds the temperature of β phase transition, more equiaxed αp phase areas under T-EST lead to a precipitation of a large number of αM phases which distributes uniformly.
This work indicates that the effect of EST on TC11 alloy cannot be simply attributed to the influence of temperature which proves that EST is directional and different from traditional heat treatment. A different EST direction can promote the formation of different microstructures of TC11 titanium alloy, which provides a new idea for manipulating the microstructure and properties of titanium alloys and theoretical guidance for other studies on the influence of EST direction on the microstructure of titanium alloys.

Author Contributions

C.L., Y.W. and H.W.: conceptualization, experiment, analysis, methodology, writing—original draft.; F.Y. and D.Q.: analysis, writing—review and editing.; L.W.: writing—review and editing.; L.X.: equipment debugging, data curation, investigation.; L.H.: conceptualization, resources, supervision, writing—review and editing. All authors have read and agreed to the published version of the manuscript.

Funding

This work was financially supported by the National Natural Science Foundation of China (Grant No. 51975441, No. 52271135), the Major Research Plan of the National Natural Science Foundation of China (Grant No. 92266102), the Natural Science Foundation of Hubei Province (Grant No. 2022CFB492), the Knowledge Innovation Program of Wuhan—Basic Research (No. 2022010801010174), the Application Foundation Frontier Project of Wuhan (No. 2020010601012171), the “Chu Tian Scholar” project of Hubei Province (CTXZ2017-05), the Overseas Expertise Introduction Project for Discipline Innovation (B17034), and the Innovative Research Team Development Program of the Ministry of Education of China (IRT_17R83).

Data Availability Statement

The raw/processed data required to reproduce these findings cannot be shared at this time as the data also forms part of an ongoing study.

Conflicts of Interest

The authors declare no conflict of interest.

References

  1. Cui, Y.-W.; Chen, L.-Y.; Chu, Y.-H.; Zhang, L.; Li, R.; Lu, S.; Wang, L.; Zhang, L.-C. Metastable pitting corrosion behavior and characteristics of passive film of laser powder bed fusion produced Ti–6Al–4V in NaCl solutions with different concentrations. Corros. Sci. 2023, 215, 111017. [Google Scholar] [CrossRef]
  2. Gupta, A.; Khatirkar, R.K.; Dandekar, T.; Mahadule, D. Texture development during multi-step cross rolling of a β titanium alloy: Experiments and simulations. J. Alloys Compd. 2021, 850, 156824. [Google Scholar] [CrossRef]
  3. Kaseem, M.; Choe, H.-C. Simultaneous improvement of corrosion resistance and bioactivity of a titanium alloy via wet and dry plasma treatments. J. Alloys Compd. 2021, 851, 156840. [Google Scholar] [CrossRef]
  4. Morita, M.; Suzuki, S.; Kato, Y.; Li, W.; Umezawa, O. Tensile deformation of texture-controlled titanium with high oxygen content at room temperature. Mater. Sci. Eng. A 2020, 793, 139660. [Google Scholar] [CrossRef]
  5. Wang, L.; Xie, L.; Lv, Y.; Zhang, L.C.; Chen, L.-Y.; Meng, Q.; Qu, J.; Zhang, D.; Lu, W. Microstructure evolution and superelastic behavior in Ti-35Nb-2Ta-3Zr alloy processed by friction stir processing. Acta Mater. 2017, 131, 499–510. [Google Scholar] [CrossRef] [Green Version]
  6. Xie, B.; Yu, Z.; Jiang, H.; Xu, B.; Wang, C.; Zhang, J.; Sun, M.; Li, D.; Li, Y. Effects of surface roughness on interfacial dynamic recrystallization and mechanical properties of Ti-6Al-3Nb-2Zr-1Mo alloy joints produced by hot-compression bonding. J. Mater. Sci. Technol. 2022, 96, 199–211. [Google Scholar] [CrossRef]
  7. Zhang, L.-C.; Chen, L.-Y. A Review on Biomedical Titanium Alloys: Recent Progress and Prospect. Adv. Eng. Mater. 2019, 21, 1801215. [Google Scholar] [CrossRef] [Green Version]
  8. Devaraj, A.; Joshi, V.V.; Srivastava, A.; Manandhar, S.; Moxson, V.; Duz, V.A.; Lavender, C. A low-cost hierarchical nanostructured beta-titanium alloy with high strength. Nat. Commun. 2016, 7, 11176. [Google Scholar] [CrossRef] [Green Version]
  9. Erdakov, I.; Glebov, L.; Pashkeev, K.; Bykov, V.; Bryk, A.; Lezin, V.; Radionova, L. Effect of the Ti6Al4V alloy track trajectories on mechanical properties in direct metal deposition. Machines 2020, 8, 79. [Google Scholar] [CrossRef]
  10. Feng, J.; Wei, D.; Zhang, P.; Yu, Z.; Liu, C.; Lu, W.; Wang, K.; Yan, H.; Zhang, L.; Wang, L. Preparation of TiNbTaZrMo high-entropy alloy with tunable Young’s modulus by selective laser melting. J. Manuf. Process. 2023, 85, 160–165. [Google Scholar] [CrossRef]
  11. Huang, H.; Zhang, T.; Chen, C.; Hosseini, S.R.E.; Zhang, J.; Zhou, K. Anisotropy in the tensile properties of a selective laser melted Ti-5Al-5Mo-5V-1Cr-1Fe alloy during aging treatment. Materials 2022, 15, 5493. [Google Scholar] [CrossRef] [PubMed]
  12. Modina, I.M.; Dyakonov, G.S.; Stotskiy, A.G.; Yakovleva, T.V.; Semenova, I.P. Effect of the Texture of the Ultrafine-Grained Ti-6Al-4V Titanium Alloy on Impact Toughness. Materials 2023, 16, 1318. [Google Scholar] [CrossRef]
  13. Zhang, C.; Liu, S.; Zhang, J.; Zhang, D.; Kuang, J.; Bao, X.; Liu, G.; Sun, J. Trifunctional nanoprecipitates ductilize and toughen a strong laminated metastable titanium alloy. Nat. Commun. 2023, 14, 1397. [Google Scholar] [CrossRef]
  14. Yumak, N.; Aslantaş, K. Effect of Heat Treatment Procedure on Mechanical Properties of Ti-15V-3Al-3Sn-3Cr Metastable β Titanium Alloy. J. Mater. Eng. Perform. 2021, 30, 1066–1074. [Google Scholar] [CrossRef]
  15. Zhao, P.; Wei, C.; Li, Y.; Tao, J.; Zhang, C.; Xiao, X.; Zhang, M. Effect of heat treatment on the microstructure, microhardness and impact toughness of TC11 and TC17 linear friction welded joint. Mater. Sci. Eng. A 2020, 803, 140496. [Google Scholar] [CrossRef]
  16. Wen, Y.; Liu, P.; Xie, L.; Wang, Z.; Wang, L.; Lu, W.; Jiang, C.; Ji, V. Evaluation of Mechanical Behavior and Surface Morphology of Shot-Peened Ti-6Al-4V Alloy. J. Mater. Eng. Perform. 2020, 29, 182–190. [Google Scholar] [CrossRef]
  17. Pan, X.; Wang, X.; Tian, Z.; He, W.; Shi, X.; Chen, P.; Zhou, L. Effect of dynamic recrystallization on texture orientation and grain refinement of Ti6Al4V titanium alloy subjected to laser shock peening. J. Alloys Compd. 2020, 850, 156672. [Google Scholar] [CrossRef]
  18. Sun, Q.; Hua, L. Micro texture of titanium alloys excited nonlinearly by electromagnetic pulse. Scr. Mater. 2021, 200, 113828. [Google Scholar] [CrossRef]
  19. Song, Y.; Wang, Z.; Yu, Y.; Wu, W.; Wang, Z.; Lu, J.; Sun, Q.; Xie, L.; Hua, L. Fatigue life improvement of TC11 titanium alloy by novel electroshock treatment. Mater. Des. 2022, 221, 110902. [Google Scholar] [CrossRef]
  20. Wu, W.; Song, Y.; Lu, J.; Yu, Y.; Hua, L. Novel strategy of electroshock treatment for improving mechanical performances of Al–Zn–Mg–Cu alloy by edge dislocation increment. Mater. Sci. Eng. A 2022, 854, 143805. [Google Scholar] [CrossRef]
  21. Zhao, S.; Zhang, R.; Chong, Y.; Li, X.; Abu-Odeh, A.; Rothchild, E.; Chrzan, D.C.; Asta, M.; Morris, J.W.; Minor, A.M. Defect reconfiguration in a Ti–Al alloy via electroplasticity. Nat. Mater. 2020, 20, 468–472. [Google Scholar] [CrossRef]
  22. Konovalov, S.; Komissarova, I.; Ivanov, Y.; Gromov, V.; Kosinov, D. Structural and phase changes under electropulse treatment of fatigue-loaded titanium alloy VT1-0. J. Mater. Res. Technol. 2019, 8, 1300–1307. [Google Scholar] [CrossRef]
  23. Zhao, Z.; Wang, G.; Zhang, Y.; Wang, Y.; Hou, H. Fast recrystallization and phase transformation in ECAP deformed Ti–6Al–4V alloy induced by pulsed electric current. J. Alloys Compd. 2019, 786, 733–741. [Google Scholar] [CrossRef]
  24. Ma, R.; Zhang, X. Refining the microstructure to strengthen casting titanium alloy by electric pulse. Mater. Sci. Eng. A 2022, 849, 143519. [Google Scholar] [CrossRef]
  25. Gao, L.; Liu, J.; Cheng, X.; Li, S.; Luo, Y.; Guo, Q. Effects of short time electric pulse heat treatment on microstructures and mechanical properties of hot-rolled Ti–6Al–4V alloy. Mater. Sci. Eng. A 2014, 618, 104–111. [Google Scholar] [CrossRef]
  26. Lu, Z.; Guo, C.; Li, P.; Wang, Z.; Chang, Y.; Tang, G.; Jiang, F. Effect of electropulsing treatment on microstructure and mechanical properties of intermetallic Al3Ti alloy. J. Alloys Compd. 2017, 708, 834–843. [Google Scholar] [CrossRef]
  27. Yan, X.; Xu, X.; Wu, C.; Zhao, Y.; Li, D.; Zhou, Y.; Wu, Z.; Wei, L. A novel electropulsing treatment to improve the surface strength and repair the pore of additively manufactured Ti-6Al-4V alloy. Surf. Coat. Technol. 2023, 458, 129364. [Google Scholar] [CrossRef]
  28. Li, Y.; Wang, F.; Sun, Q.; Qian, D.; Song, Y.; Hua, L. Study on the microstructure and impact toughness of TC11 titanium alloy by a novel electromagnetic shocking treatment. Mater. Sci. Eng. A 2023, 876, 145149. [Google Scholar] [CrossRef]
  29. Liu, C.; Xie, L.; Qian, D.; Hua, L.; Wang, L.; Zhang, L.-C. Microstructure evolution and mechanical property response of TC11 titanium alloy under electroshock treatment. Mater. Des. 2020, 198, 109322. [Google Scholar] [CrossRef]
  30. Xie, L.; Guo, H.; Song, Y.; Liu, C.; Wang, Z.; Hua, L.; Wang, L.; Zhang, L.-C. Effects of electroshock treatment on microstructure evolution and texture distribution of near-β titanium alloy manufactured by directed energy deposition. Mater. Charact. 2020, 161, 110137. [Google Scholar] [CrossRef]
  31. Xie, L.; Guo, H.; Song, Y.; Hua, L.; Wang, L.; Zhang, L.-C. Novel approach of electroshock treatment for defect repair in near-β titanium alloy manufactured via directed energy deposition. Met. Mater. Trans. A 2021, 52, 457–461. [Google Scholar] [CrossRef]
  32. Xie, L.; Wu, Y.; Yao, Y.; Hua, L.; Wang, L.; Zhang, L.-C.; Lu, W. Refinement of TiB reinforcements in TiB/Ti-2Al-6Sn titanium matrix composite via electroshock treatment. Mater. Charact. 2021, 180, 111395. [Google Scholar] [CrossRef]
  33. Liu, C.; Yin, F.; Xie, L.; Qian, D.; Song, Y.; Wu, W.; Wang, L.; Zhang, L.-C.; Hua, L. Evolution of grain boundary and texture in TC11 titanium alloy under electroshock treatment. J. Alloy. Compd. 2022, 904, 163969. [Google Scholar] [CrossRef]
  34. Wen, Y.; Liu, P.; Guo, H.; Tian, L.; Wang, L.; Wang, Z.; Hua, L.; Xie, L. Effect of electroshocking treatment on the microstructure and mechanical properties of laser melting deposited near-β Ti-55531 thin-wall. J. Alloys Compd. 2023, 936, 168187. [Google Scholar] [CrossRef]
  35. Guo, H.; Liu, P.; Qin, X.; Song, Y.; Qian, D.; Xie, L.; Wang, L.; Zhang, L.-C.; Hua, L. Electroshock treatment dependent microstructural evolution and mechanical properties of near-β titanium alloy manufactured by directed energy deposition. Mater. Des. 2021, 212, 110286. [Google Scholar] [CrossRef]
  36. González-Fernández, L.; Risueño, E.; Pérez-Sáez, R.B.; Tello, M.J. Infrared normal spectral emissivity of Ti–6Al–4V alloy in the 500–1150 K temperature range. J. Alloys Compd. 2012, 541, 144–149. [Google Scholar] [CrossRef]
  37. Xie, L.; Liu, C.; Song, Y.; Guo, H.; Wang, Z.; Hua, L.; Wang, L.; Zhang, L.-C. Evaluation of microstructure variation of TC11 alloy after electroshocking treatment. J. Mater. Res. Technol. 2020, 9, 2455–2466. [Google Scholar] [CrossRef]
  38. Fan, Z.; Jian, J.; Liu, Y.; Chen, Y.; Song, M.; Jiao, L.; Wang, H.; Zhang, X. In situ studies on superior thermal stability of bulk FeZr nanocomposites. Acta Mater. 2015, 101, 125–135. [Google Scholar] [CrossRef] [Green Version]
  39. Rizi, M.S.; Minouei, H.; Lee, B.J.; Toroghinejad, M.R.; Hong, S.I. Effects of carbon and molybdenum on the nanostructural evolution and strength/ductility trade-off in Fe40Mn40Co10Cr10 high-entropy alloys. J. Alloy. Compd. 2022, 911, 165108. [Google Scholar] [CrossRef]
  40. Dirras, G.; Tingaud, D.; Ueda, D.; Hocini, A.; Ameyama, K. Dynamic Hall-Petch versus grain-size gradient effects on the mechanical behavior under simple shear loading of β-titanium Ti-25Nb-25Zr alloys. Mater. Lett. 2017, 206, 214–216. [Google Scholar] [CrossRef]
  41. Ames, S.; McQuillan, A. The resistivity-temperature-concentration relationships in the system niobium-titanium. Acta Met. 1954, 2, 831–836. [Google Scholar] [CrossRef]
  42. Ho, J.C.; Collings, E.W. Anomalous electrical resistivity in titanium-molybdenum alloys. Phys. Rev. B 1972, 6, 3727–3738. [Google Scholar] [CrossRef]
  43. Ouchi, C.; Iizumi, H.; Mitao, S. Effects of ultra-high purification and addition of interstitial elements on properties of pure titanium and titanium alloy. Mater. Sci. Eng. A 1998, 243, 186–195. [Google Scholar] [CrossRef]
Figure 1. (a) Schematic diagram of EST; (b) Machining schematic diagram of group No. 1 and No. 2; (c,d) Characterization area of group No. 1 and No. 2; the square of 1 × 1 mm in the middle area is selected for SEM characterization (rectangle area), and the red points are selected for hardness test (red point).
Metals 13 01396 g001
Figure 2. Temperature variation of specimens under different direction EST for different emissions: (a) 0.15; (b) 0.23. (c) The voltage signal of different specimens received by the oscilloscope. (d) The maximum temperature figures for 0.15 (left) and 0.23 (right) emissions of different specimens.
Metals 13 01396 g002
Figure 3. Temperature distribution in the space around the specimens at the maximum temperature of different emissions during EST: (af) 0.15 emission; (a1f1) 0.23 emission.
Metals 13 01396 g003
Figure 4. SEM images of specimens with low magnification under different EST directions: (a) V-EST0; (b) V-EST2; (c) V-EST4; (d) V-EST6; (e) T-EST0; (f) T-EST2; (g) T-EST4; (h) T-EST6.
Metals 13 01396 g004
Figure 5. High magnification SEM images of specimens under different ESTs: (a) V-EST0; (b) V-EST2; (c) V-EST4; (d) V-EST6; (e) T-EST0; (f) T-EST2; (g) T-EST4; (h) T-EST6.
Metals 13 01396 g005
Figure 6. EDS analysis of a specimen of middle area before EST; (a) SEM image; (bf) the elements distribution (in (a)) of Ti, Al, Mo, Zr, and Si, respectively.
Metals 13 01396 g006
Figure 7. EDS analysis (distribution of Al and Mo elements in middle area) of specimen under different ESTs; (a) V-EST2; (b) T-EST2; (c) V-EST4; (d) T-EST4; (e) V-EST6; (f) T-EST6.
Metals 13 01396 g007
Figure 8. The average Vickers hardness variation of specimens under different direction EST, and the points represent the hardness values.
Metals 13 01396 g008
Figure 9. Diagram of the phase transformation mechanism in different EST directions: (ac) V-EST; (df) T-EST; the red arrows represent current direction in EST.
Metals 13 01396 g009
Table 1. The chemical composition of TC11 alloy (wt.%).
AlMoZrSiTi
5.8–7.02.8–3.80.8–2.00.20–0.35others
Table 2. EST time and specimen number.
MaterialEST TimeSpecimen Number
Group No. 10 sV-EST0
Group No. 20 sT-EST0
Group No. 10.02 sV-EST2
Group No. 20.02 sT-EST2
Group No. 10.04 sV-EST4
Group No. 20.04 sT-EST4
Group No. 10.06 sV-EST6
Group No. 20.06 sT-EST6
Disclaimer/Publisher’s Note: The statements, opinions and data contained in all publications are solely those of the individual author(s) and contributor(s) and not of MDPI and/or the editor(s). MDPI and/or the editor(s) disclaim responsibility for any injury to people or property resulting from any ideas, methods, instructions or products referred to in the content.

