Article

Process Setup and Boundaries of Wire Electron Beam Additive Manufacturing of High-Strength Aluminum Bronze

1
Fraunhofer Institute for Production Systems and Design Technology (IPK), Pascalstraße 8-9, 10587 Berlin, Germany
2
Department Joining Technology, Institute of Machine Tools and Factory Management (IWF), Technical University Berlin, Pascalstraße 8-9, 10587 Berlin, Germany
3
Federal Institute for Materials Research and Testing (BAM), Unter den Eichen 87, 12205 Berlin, Germany
*
Author to whom correspondence should be addressed.
Metals 2023, 13(8), 1416; https://doi.org/10.3390/met13081416
Submission received: 26 June 2023 / Revised: 29 July 2023 / Accepted: 1 August 2023 / Published: 8 August 2023

Abstract

:
In recent years, in addition to the commonly known wire-based processes of Directed Energy Deposition using lasers, a process variant using the electron beam has also developed to industrial market maturity. The process variant offers particular potential for processing highly conductive, reflective or oxidation-prone materials. However, for industrial usage, there is a lack of comprehensive data on performance, limitations and possible applications. The present study bridges the gap using the example of the high-strength aluminum bronze CuAl8Ni6. Multi-stage test welds are used to determine the limitations of the process and to draw conclusions about the suitability of the parameters for additive manufacturing. For this purpose, optimal ranges for energy input, possible welding speeds and the scalability of the process were investigated. Finally, additive test specimens in the form of cylinders and walls are produced, and the hardness profile, microstructure and mechanical properties are investigated. It is found that the material CuAl8Ni6 can be well processed using wire electron beam additive manufacturing. The microstructure is similar to a cast structure, the hardness profile over the height of the specimens is constant, and the tensile strength and elongation at fracture values achieved the specification of the raw material.

1. Introduction

Currently, the additive manufacturing of copper alloys is possible using various processes. In this context, processes based on powder bed fusion using lasers as a heat source (PBF-LB) have been extensively investigated, which proved to be particularly advantageous for the production of complex components made of pure copper [1] but also of conventional bronzes [2]. Since pure copper and low alloy Cu materials almost completely reflect laser radiation in the infrared as well as near-infrared range due to their physical properties, various workarounds had to be developed [3]. Usually, green [4] or blue [5] lasers are used to increase the absorption coefficient, or beam pulsing is performed in combination with high powers.
Compared to PBF-LB, laser-based Directed Energy Deposition (DED-LB) processes enable significantly higher deposition rates in the processing of copper alloys [6]. However, since the material is fed in powder or wire form via a nozzle, only certain alloys can be used without restrictions due to the previously mentioned problem of reflection. Thus, with common solid-state lasers, adapted process control is possible for various bronzes in powder form [7] since the increased surface area and alloying of other elements improve the absorption behavior [8]. The study by Siva et al. shows that low-alloy copper can be processed with laser powder DED using a green laser. However, only a small part of the laser power used is actually available to the process due to reflections and high thermal conductivity, which means that only rather low working speeds are possible [4].
Arc-based DED processes (DED-Arc), often referred to as wire arc additive manufacturing, have also been tested for application to Cu alloys. As the work of Wang et al. shows using the example of a Cu-Al bronze, processing is possible in principle [9]. However, in the case of aluminum bronze, an anisotropy of mechanical properties is shown compared to other processes [10]. Similar observations were made by Guo et al. for the application to Cu-Ni alloys, where the strength values were found to be good overall [11]. However, in some cases, significant limitations are shown with regard to the quality and achievable accuracy of the fabricated structures [12].
The above-mentioned difficulties in the processing of copper can be overcome by using the electron beam as a heat source [13]. This is evident from work in the field of Electron Beam Powder Bed Fusion (PBF-EB) [14]. For low-alloyed or pure Copper, PBF-EB enables high component qualities as well as a high electrical conductivity, as demonstrated by the study of Megahed et al. [15].
A process that combines the advantages of the electron beam for the processing of Cu with higher deposition rates is the DED-EB. In this process, a wire-shaped filler material is melted inside a vacuum chamber using a focused electron beam. A schematic illustration of the process is shown in Figure 1. The beam is usually stationary during the welding process, while the welding feed is realized by moving the component on CNC-controlled work tables or fixtures. Due to the characteristics of the beam source, the wire feed is usually lateral to the beam direction. Therefore, rotating fixtures are often used to overcome the directionality of the manipulation, e.g., for rotation-symmetrical components [16]. Here, the electron beam creates a melt pool on the surface of the component or substrate as well as on the wire tip itself. By slightly offsetting the intersection between the electron beam and wire axis and the surface of the component, a stable bridge of molten material is obtained. The continuous movement of the table thus allows the production of two-dimensional coatings and three-dimensional components. In DED-EB, in line with other AM or coating technologies, energy input [17], hardness [16], dilution or bonding, and favorable track geometry are usually considered essential quality characteristics for the suitability of a parameter set for additive buildup [18].
The process has been investigated in the past primarily for use on reactive materials, such as titanium alloys, due to the excellent protection against oxidation within the working vacuum [18]. However, studies have also been carried out in the field of steel materials [17] as well as corrosion-resistant nickel-based alloys [19]. As far as the practical application of components manufactured by means of DED-EB is considered, initial findings have already been made on various materials. For example, in the work of Baufeld et al., it was shown for the stainless steel 316L that the tensile strengths achievable by DED-EB are approximately at the base material level [20]. Recent studies also demonstrate the good workability of Cu wires for large-volume rotating parts using the example of a rocket engine [21]. The potential of DED-EB has also been illustrated in the field of aluminum bronze by initial test series. The work of Khoroshko et al. uses the case of a single-phase Cu-Al alloy to investigate the microstructure achieved as well as mechanical characteristics on the basis of tensile and compression tests [22]. This showed a pronounced anisotropy in the microstructure, which also manifested itself in the mechanical properties of the samples. Recent investigations by Zykova et al. on the alloy CuAl9Mn2 confirm this behavior [23]. In particular, the control of energy input is of special importance in DED-EB in order to favor the formation of advantageous microstructures and to exploit the potential of high-strength aluminum bronzes. The anisotropic distribution of material properties and microstructure, which requires a profound understanding of the process for further optimization, proved to be particularly problematic [24].

2. Materials and Methods

2.1. Experimental Setup

The experiments were carried out on an EBG15-150 K30 electron beam system (pro-beam GmbH & Co. KGaA, Gilching, Germany) which was equipped with a DIX WDE 515 wire feeding device (Dinse GmbH, Norderstedt, Germany). A constant accelerating voltage of 120 kV was set for all experiments. The vacuum quality during the experiments varied between 0.5 × 10⁻⁴ mbar and 1 × 10⁻³ mbar. The experimental setup is shown in Figure 1. The alignment between the wire feeder, electron beam and substrate is critical to the process [17]. The optimal settings for this were determined empirically in preliminary experiments and kept constant. The angle of inclination α of the wire conveyor was 30° with a distance of the wire tip to the surface H of 4.3 mm. The intersection point between the wire axis and the electron beam is referred to as the working point, which had an offset from the substrate surface h of 2 mm. The working distance between the deflection coil and the working point was 880 mm. As a welding figure, concentric circles with an amplitude in X as well as Y direction of 2–4 mm, depending on the parameter set, were used in the surface focus of the workpiece.
As substrate material for the welding tests, square plates of the material 1.4404 with a side length of 100 mm and a thickness of 6 mm were used. Test welds were performed on these in the form of circular sections with a diameter of 40 mm and a size of circular section of 35° for preliminary tests and in the form of cylinders and walls for additive welding tests. The experiments were carried out with a filler wire made of CuAl8Ni6 and a diameter of 1.0 mm. The chemical composition of the alloy is shown in Table 1.

2.2. Experimental Procedure and Process Parameters

2.2.1. Tests on Energy Input

Initially, the process limits for the material were determined. In particular, the optimum energy input had to be identified. The volume energy indicates how much power is available per amount of wire fed into the process. It was calculated according to the following formula:
V o l u m e   e n e r g y = A c c e l e r a t i o n   v o l t a g e   ·   b e a m   c u r r e n t W i r e   f e e d   ·   π   ·   w i r e   r a d i u s 2
This was carried out on the basis of 9 test welds with different welding parameters. An overview of the parameters used is shown in Table 2. Subsequently, the track geometry and the wetting angle were measured optically by means of focus variation using the Alicona Infinite Focus measuring system to evaluate the deposition quality. All target values at the cross-sections can be seen in Figure 2. The different types of samples are shown in Figure 3.

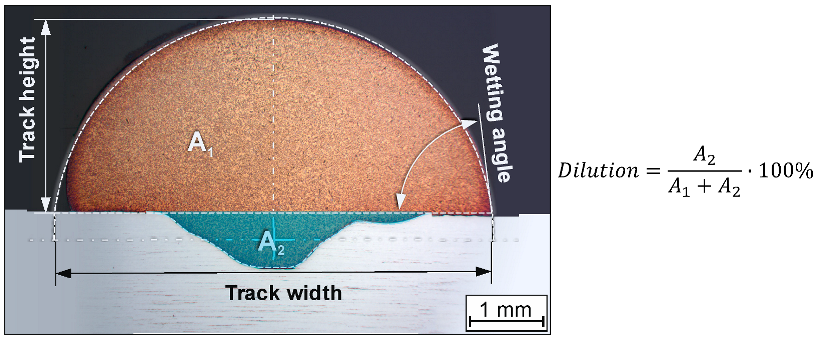
2.2.2. Tests on Welding Speed and Dilution

In the second step, the influence of the welding speed on the process is examined. In particular, it was investigated whether this has an influence on the dilution between the base material and the filler material at constant energy input. The volumetric energy was defined based on the findings of the previously conducted tests. A constant wire feed rate of 3.5 m/min and a constant volumetric energy of 23.6 J/mm3 are set, while the welding speed increases track by track. For this purpose, 4 test tracks for each of the two alloys are welded, cut up for evaluation by means of wet cut-off grinders and prepared to form metallographic cross-sections of the weld. Afterwards, the dilution is measured using ImageJ software.

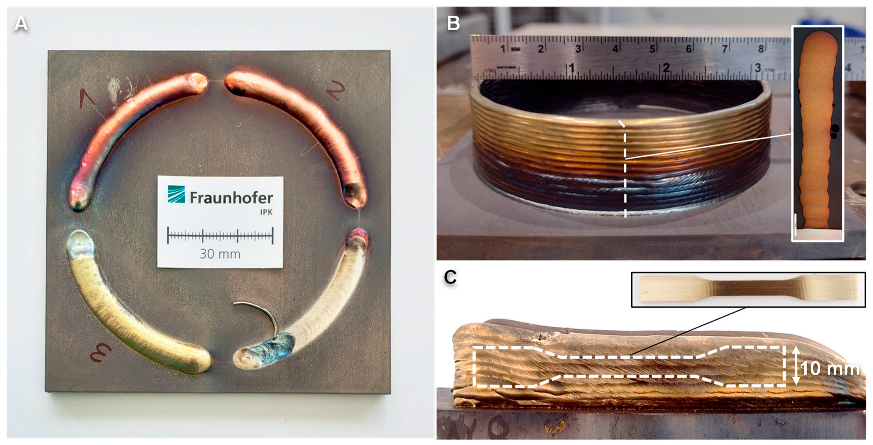
2.2.3. Test on Scalability

After determining suitable values for energy input and welding speed, the scalability of the process is investigated by changing the beam current and the wire feed rate. The tests are carried out on 4 test welds. The energy input is set constant at 23.6 J/mm3, and the welding speed is adjusted to 6 mm/s. The beam current and wire feed rate are incrementally increased by the same factor. The track width and track height are then measured on a polished cross-section of the specimens using a digital microscope, and hardness measurements are carried out. The average of at least four evenly distributed hardness measurement points per sample is used for further evaluation. The hardness measurement is carried out according to Vickers in the small load range with HV1.

2.2.4. Hardness Profile Measurements and Microstructure

To estimate the achievable microstructure and hardness values for the material CuAl8Ni6, hollow cylinders with a diameter of 80 mm and a height of 20 mm were additively manufactured. The strategy for the additive buildup was a continuous helix. The final thickness of the cylinder wall was realized via one track in multiple layers. An example of a cylinder fabricated in this way, as well as the position of the specimen extraction for the analysis of microstructure and hardness profile, is shown in Figure 3B. Again, the constant volume energy approach is followed, and the values determined at the beginning are considered as the basis for the combination of beam current and wire feed. Two cylinders are manufactured with different parameter sets. The parameter combinations are selected in such a way that one variant each lies at the lower end of the stable process range and at the upper end. This is intended to demonstrate the possibilities of the DED-EB on the existing equipment for the production of fine structures with low deposition rates as well as large structures with high deposition rates. In order to evaluate microstructure and possible defects, a part of the wall of each of the additively manufactured test cylinders Z1 and Z2 is taken over the entire height of the cylinder and a cross-section is made. The hardness profile is measured along a line starting from the top of the specimens into the material of the substrate plate. The measurement is carried out according to the Vickers method in the HV1 variant. The spacing of the measuring points is selected according to the recommendations of ISO 6507 for the selected test method under the assumption of ductile material behavior.

2.2.5. Tensile Testing

In order to be able to perform tensile tests, wall structures were additively manufactured. The tensile specimens were taken in the horizontal direction from these walls, which consisted of several layers of tracks on top of each other. The wall thickness corresponds to the width of a single track. The walls are built up analogously to the cylinders in a unidirectional process. For each material, 3 identical specimen walls are set up to ensure statistical validation of the results. Figure 3C shows an example of one of the fabricated walls and the position of the tensile specimens. As a guideline value for the height, 20 mm is specified to ensure sufficient room for subsequent machining. The optimum range for the volume energy in the preliminary tests and a constant welding speed are used as the basis for parameter selection. The tensile specimens were cut horizontally from the additively built walls by means of machining on a CNC machining center under cooling. The geometry of the specimens corresponds to a flat tensile specimen of the variant E2 × 6 × 20 according to DIN 50125. The tensile testing was carried out in accordance with the above-mentioned DIN standard using method A, which means that the test speed was strain-controlled. Here, the output signal of the extensometer is used to measure the actual elongation of the specimen and to adapt the testing speed in a closed loop. Tensile strength, elongation at break and the stress–strain curves are thus determined via the software of the testing machine. The test is carried out at room temperature until total fracture.

3. Results and Discussion

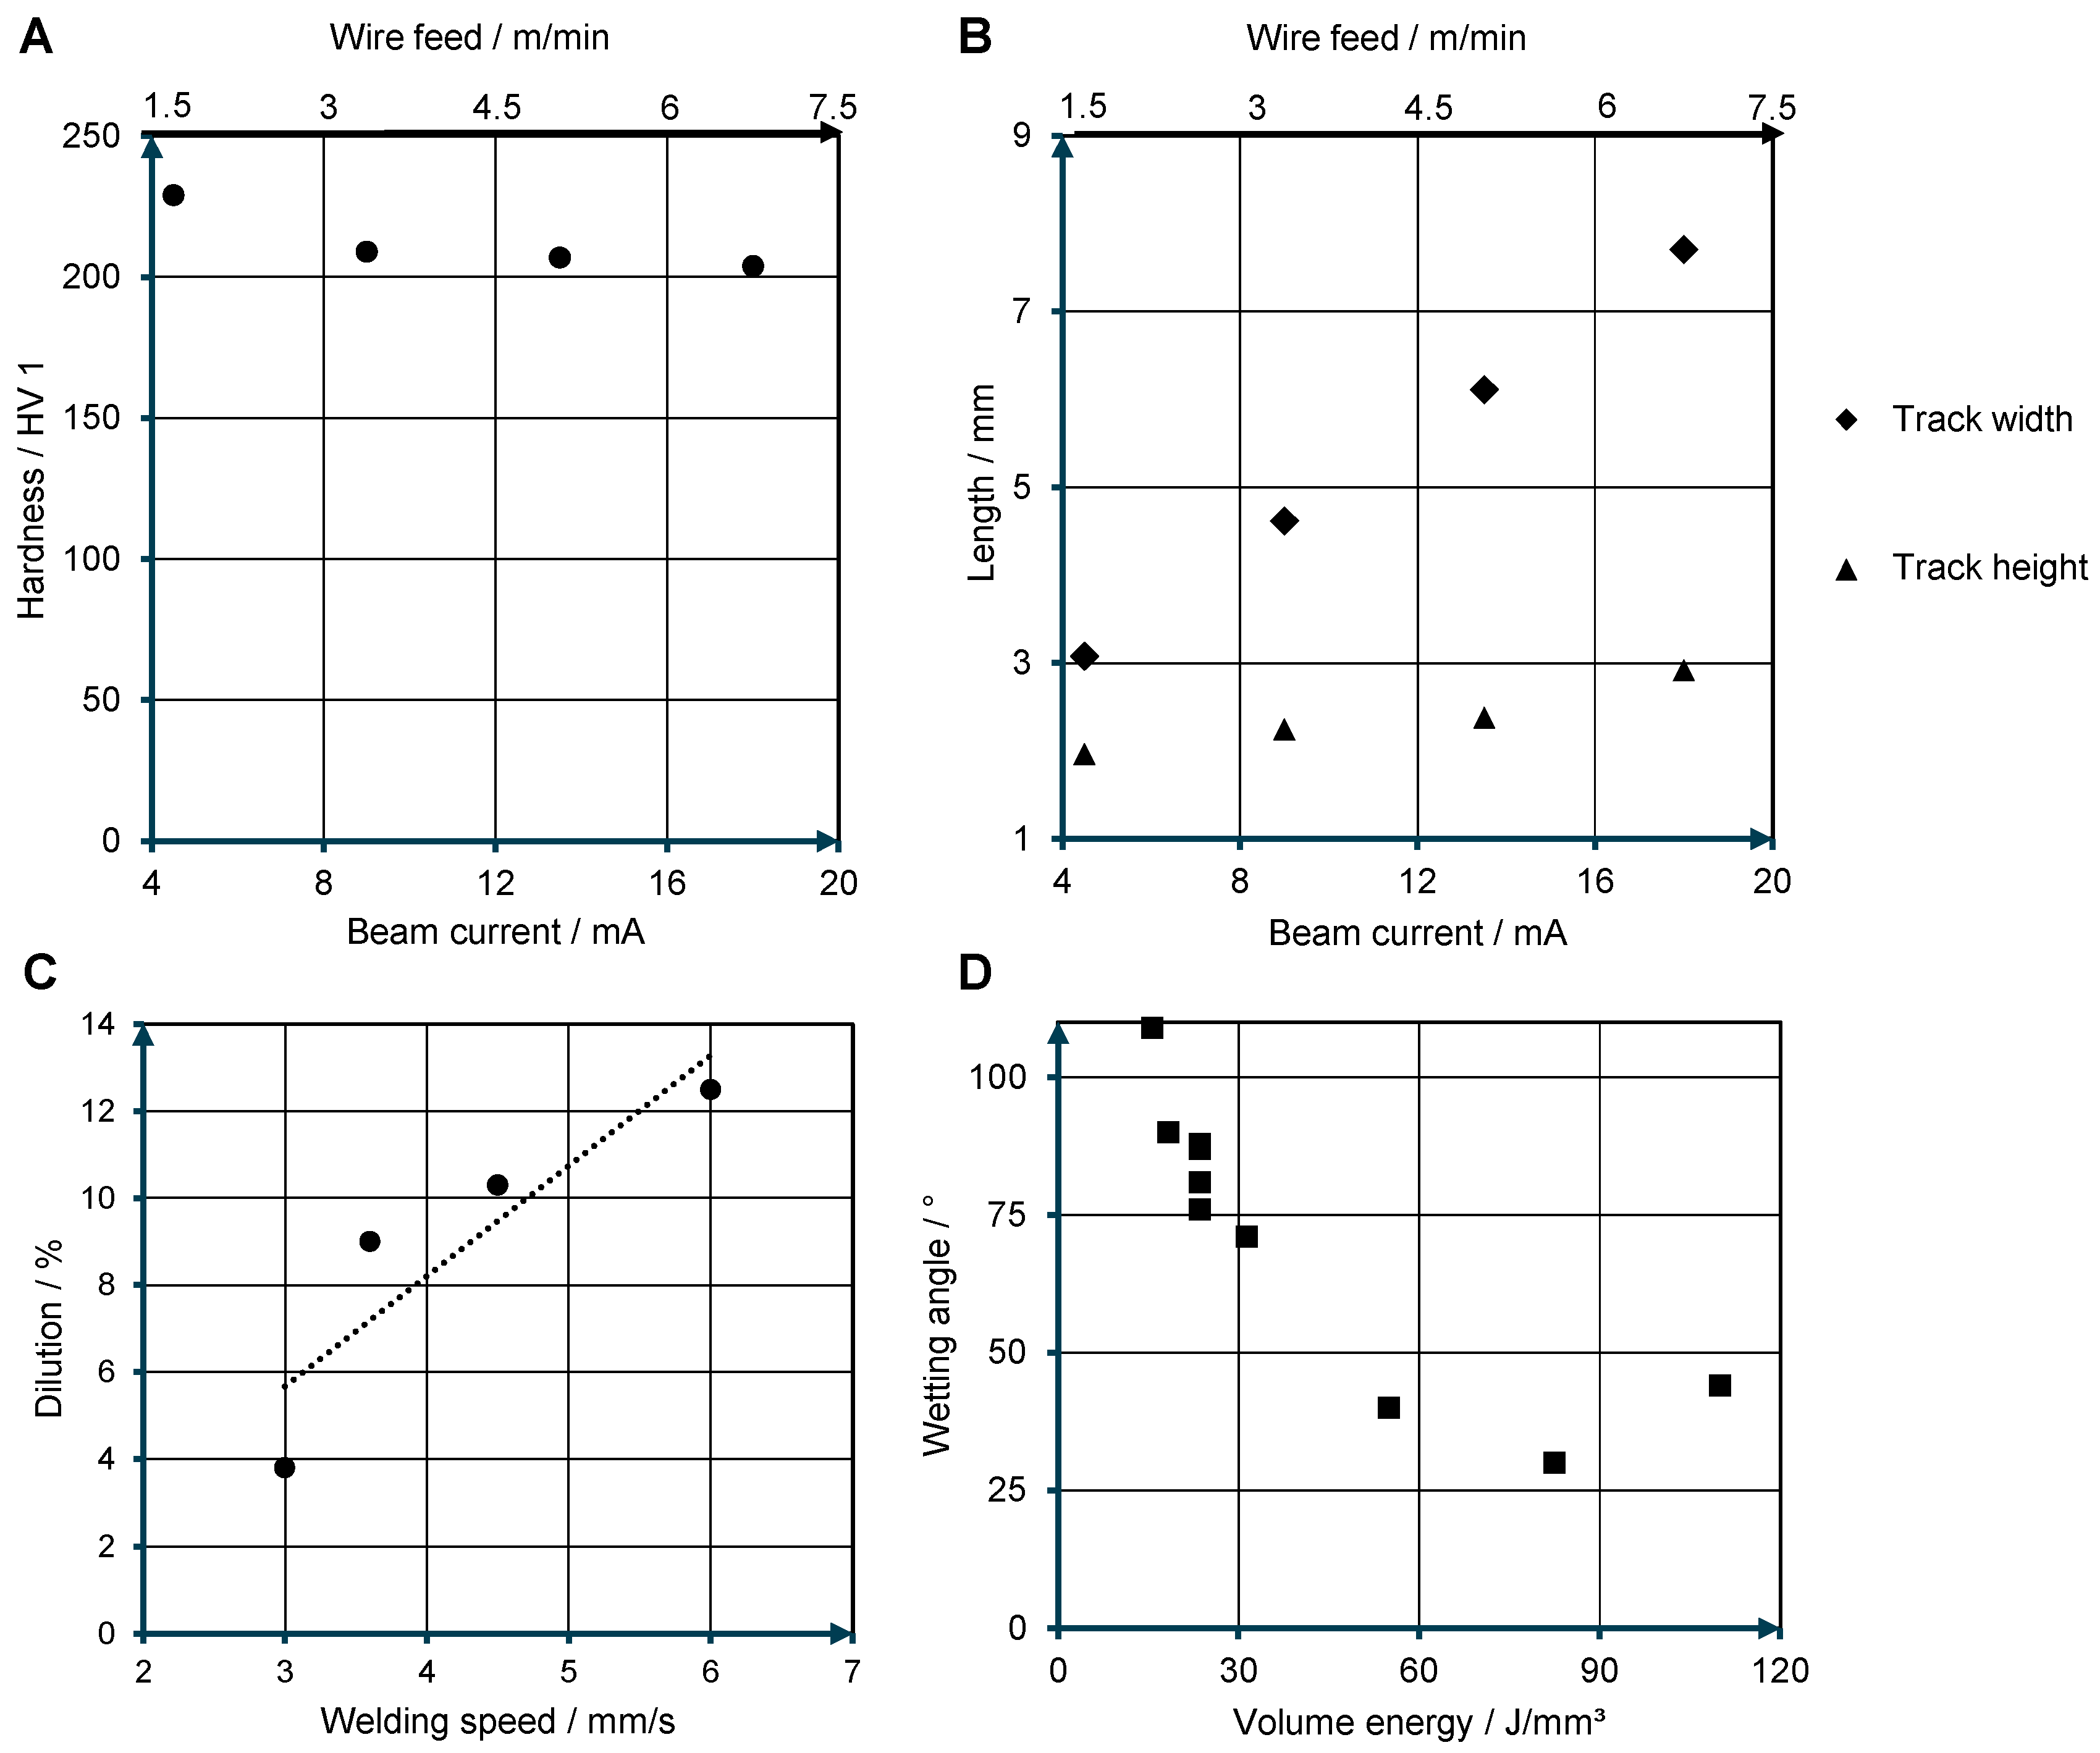
3.1. Tests on Energy Input

The experiments were carried out in a multi-stage series with different objectives. The first objective was to find an optimum range for the volumetric energy with the tests on energy input. The deposited test tracks were welded with different volumetric energies and evaluated optically. Here, the wetting angle provides information on the behavior of the melt. This angle, in combination with the achieved track geometry, is used to evaluate the suitability of the tracks for additive manufacturing. Figure 4D shows the change in wetting angle with increasing energy input.
In general, a certain volumetric energy is required to melt the supplied wire as well as to deposit it on the base material. If the volumetric energy is too low, the process becomes unstable, and wire movement disturbances or insufficient melting occur. This behavior could already be observed for the material used at a volume energy of 15.7 J/mm3 for parameter set No. 7. If the supplied energy is even lower, as in parameter set No. 4, no material can be deposited at all. The lower limit of the optimum range of the volumetric energy is therefore set at parameter set No. 2 since here there was still a stable process with sufficiently good track qualities.
The volumetric energy is also limited in the upward direction. For example, large energy inputs cause the melt to deviate strongly. The track width increases sharply while the track height decreases since the wetting behavior changes due to the overheating of the melt. This can be easily seen from the measured wetting angle in Figure 4D.
With increasing volumetric energy, the angle decreases exponentially, which can be attributed to a strong tendency of the melt to spread. The effect is already apparent above a volumetric energy of 31.4 J/mm3, for example, with parameter set No. 9 at 55 J/mm3. If the energy is increased further, as in the case of parameter sets No. 8 and No. 3, spattering and strong penetration into the base material are observed. Due to the high energy input, these parameters are not suitable for additive manufacturing, as there is a risk of the molten material spreading in the multilayer structure and the track height becoming too low. Good track qualities for additive manufacturing are shown at wetting angles between approximately 90° and 60°, in the range of volume energies from 18.3 J/mm3 to 31.4 J/mm3. For the further test series, the parameter set No. 1 with a volumetric energy of 23.6 J/mm3 is used. This parameter set was located in the middle of the optimal range for the energy input, and a good track quality could be observed on the basis of the wetting angle and optical evaluation.

3.2. Tests on Welding Speed and Dilution

To evaluate the dilution, three measurements of the same sample for each welding speed were taken into account. The relationship between welding speed and dilution can be seen in Figure 4C. It shows a trend towards increasing dilution with higher welding speed. The stability of the material transition from the wire tip to the substrate may be used as an explanation. For constant values of beam current and wire feed, increasing the welding speed causes the same amount of molten material to be spread over a longer section, making the transition of melted material between the wire end and the substrate more unstable. This might cause the electron beam at constant power to penetrate deeper into the base material during phases of temporarily reduced deposition rate.
In the literature on DED-EB, the relationship between beam current and dilution is already known [18]. Nevertheless, the welding speed is mostly neglected as an influencing variable since the beam current is often considered as the main factor for controlling the dilution. This approach has some disadvantages in the process design. If, for example, the method of constant volume energy is used to ensure specific microstructures or mechanical properties, the value of the beam current is fixed to the amount of wire feed and can only be varied within small limits to set desired values of the dilution. If a certain degree of dilution is required due to technological specifications, this can only be achieved by adjusting the welding speed. In the literature, the dilution of DED-EB has already been investigated for other materials. For low-alloy steels [17] or titanium materials [18], minimum values of approx. 17% and 28%, respectively, were found. However, the measured dilutions in the present work for aluminum bronze were significantly lower at values of approx. 4–12%.

3.3. Test on Scalability
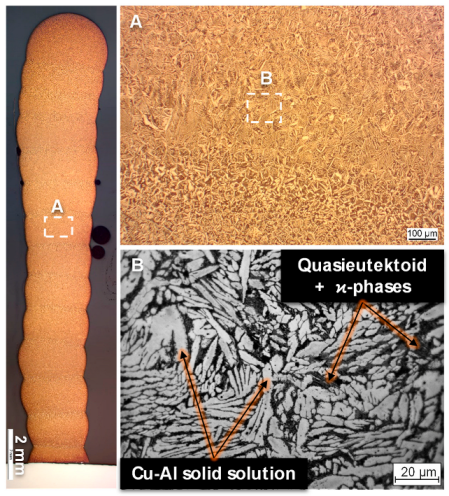
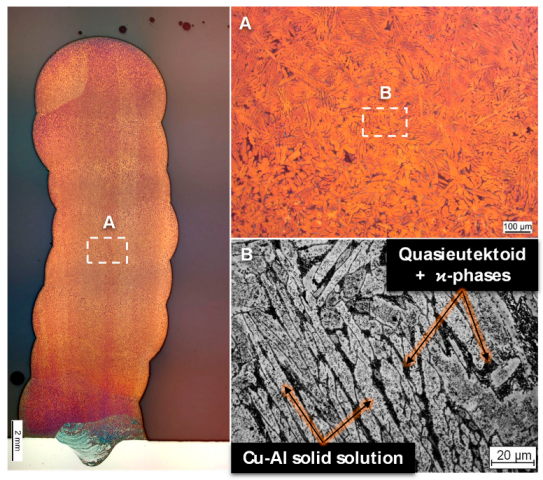
After suitable ranges for volume energy and welding speed have been determined, the next step is to test the scalability of the process in order to ensure individual influencing of the track geometry while maintaining the same component properties for the additive buildup. For this purpose, the parameters of wire feed and beam current were increased stepwise by the same factor while welding speed and volume energy remained constant. An overview of the development of the track geometry with a stepwise increase in the deposition rate is shown in Figure 5 on the cross-sections of the samples. Deposition rates of 0.6–2.5 kg/h can be realized for the alloy CuAl8Ni6. In the literature, deposition rates for comparable Cu alloys at DED-EB are about 1.9 kg/h and thus within the investigated range [20]. For pure copper and low-alloy copper materials, Baufeld et al. achieved values for the DED-EB of 1.5 kg/h to 3.3 kg/h, although the higher density of the material must be taken into account here [21]. In order to obtain a rough estimation of the influence of the scaling on mechanical parameters, hardness measurements are carried out. The result of these measurements, as well as the development of the track geometry, are shown in the form of diagrams in Figure 4A and in relation to wire feed and beam current. There is a slight decrease in hardness with a gradual increase in beam current and wire feed. The hardness values achieved above 200 HV1 are within a normal range for the material. They thus correspond to qualities achievable by other AM processes for Al bronzes, such as DED-Arc [12]. The course of the hardness is relatively constant over the increase in beam current and wire feed. Only the hardness value of the lowest setting is slightly above the other samples.
Figure 4B shows the change in track width and track height when the process is scaled via a stepwise adjustment of the beam current and wire feed. In addition to the measured values, Figure 4 shows the evolution of the track geometry on cross-sections. The measured width and height of the tracks in Figure 4B change when the process is scaled. It is noticeable that the track width increases more than the track height.
The plots are nearly linear, indicating good scalability and stability of the process in the identified parameter range.
The present results on the scaling of the process at constant volumetric energy based on wire feed and beam current confirm the behavior known for mild steel in the case of DED-EB, as observed by Fuchs et al. [17]. There, a significantly stronger increase in the track width compared to the height was shown, too.

3.4. Microstructure

The use of a rotating clamping system for the production of the cylinders proved to be favorable for a homogeneous process and to avoid internal defects. Thus, both cylinders show no pores, inclusions or cracks above the base plate. A major advantage of using a rotary table is that it compensates for the directionality of the DED-EB’s single-sided wire feed. This offers the possibility to fix wire and electron beam in the optimal alignment and to work in a continuous manner. This conclusion was already formulated by the work of Kalashnikov et al., which dealt with different manufacturing strategies for titanium components at the DED-EB [16]. The microstructure is evaluated on the basis of images taken using a digital microscope on etched cross-sections.
Figure 6 shows the microstructure of the thin-walled cylinder Z1. The macroscopic overview image of the section shows a roughly uniform and fine-grained microstructure over the entire height of the cylinder. The individual layers can be identified on the basis of dark regions of partially remelted material. The detailed images show a dendritic shape of the grains with segregations of other phases at the grain boundaries. These phases are most likely Fe- and Ni-rich phases, so-called ϰ-phases. Such microstructures are common in aluminum bronzes of similar composition and correspond to the microstructure of die castings. The visible bright needle-shaped grains are, therefore, dendritic solid solutions of Cu and Al embedded in a quasieutectoid matrix [25].
The microstructure of the thick-walled cylinder Z2 in Figure 7 is very similar to the appearance of the first sample. However, the layer transitions are less sharp due to the remelting of a larger area because of the high beam power. The microstructure also shows a finer expression of the striped dark areas around the bright Cu-Al solid solutions. The gray-colored inclusions on the solid solutions are probably precipitated ϰ-phases. The increased occurrence of these phases on the grains compared to the thin cylinder indicates a slower cooling rate. As with the thin cylinder, the dark quasieutectoid matrix of the different ϰ-phases is clearly visible and finely distributed in the interstices of the bright solid solutions. Such microstructures are promoted in Cu-Al alloys, especially by high temperatures above 800 °C in combination with slow cooling, e.g., in a furnace [8].
The microstructure observed in the additively manufactured components is in agreement with the results of other studies on DED-EB, as long as a two-phase alloy with a correspondingly high aluminum content was used, such as in the work by Zykova et al. with the material CuAl9Mn2 [23]. In contrast, other works with lower alloyed or single-phase aluminum bronzes show different behavior. For example, Khoroshko et al. were able to observe a significantly coarser microstructure with pronounced grain growth over the entire component height during additive manufacturing of a copper alloy with an aluminum content of 7.5% [22], which is usually known from the field of low-alloyed copper materials [21].
In the case of DED-EB, due to the vacuum, heat transfer can only take place via the fixtures as well as thermal radiation. To avoid surface oxidation, the specimens are removed from the high vacuum only after a certain cooling time. Since more heat is introduced in the case of the thick-walled cylinder, but the cooling conditions remain unchanged, the increased occurrence of such phases is plausible. In order to achieve a consistent microstructure and geometry despite changes in heat dissipation, a reduction of the energy input over the height of the components is necessary. Other works also show the necessity of adjusting the beam power during DED-EB, as already postulated by Baufeld et al. for titanium alloys [20], Fuchs et al. for steel [17], and Gurianov et al. using nickel-based materials as an example [19]. This reduction in the energy input depended on the material as well as the geometry and was empirically determined in the case of the additive test cylinders and realized by lowering the beam current. The reduction amounts to 30% over the height of the specimens. Of this, 15% was reduced linearly over the first three layers and the remaining 15% linearly until the final height was reached. Comparable investigations on aluminum bronze in the DED-EB range reduced the beam current over the height by approx. 40% [23].
At the base of the cylinder, a distinctive penetration into the base plate can be seen. Due to the limited possibility of mixing the two alloys, a large portion of the segregated steel is re-deposited at the bottom of the cylinder. However, the dilution is limited to a tolerable area of the first layer, which would have to be removed anyway in an additive manufacturing process when the base plate is cut off.

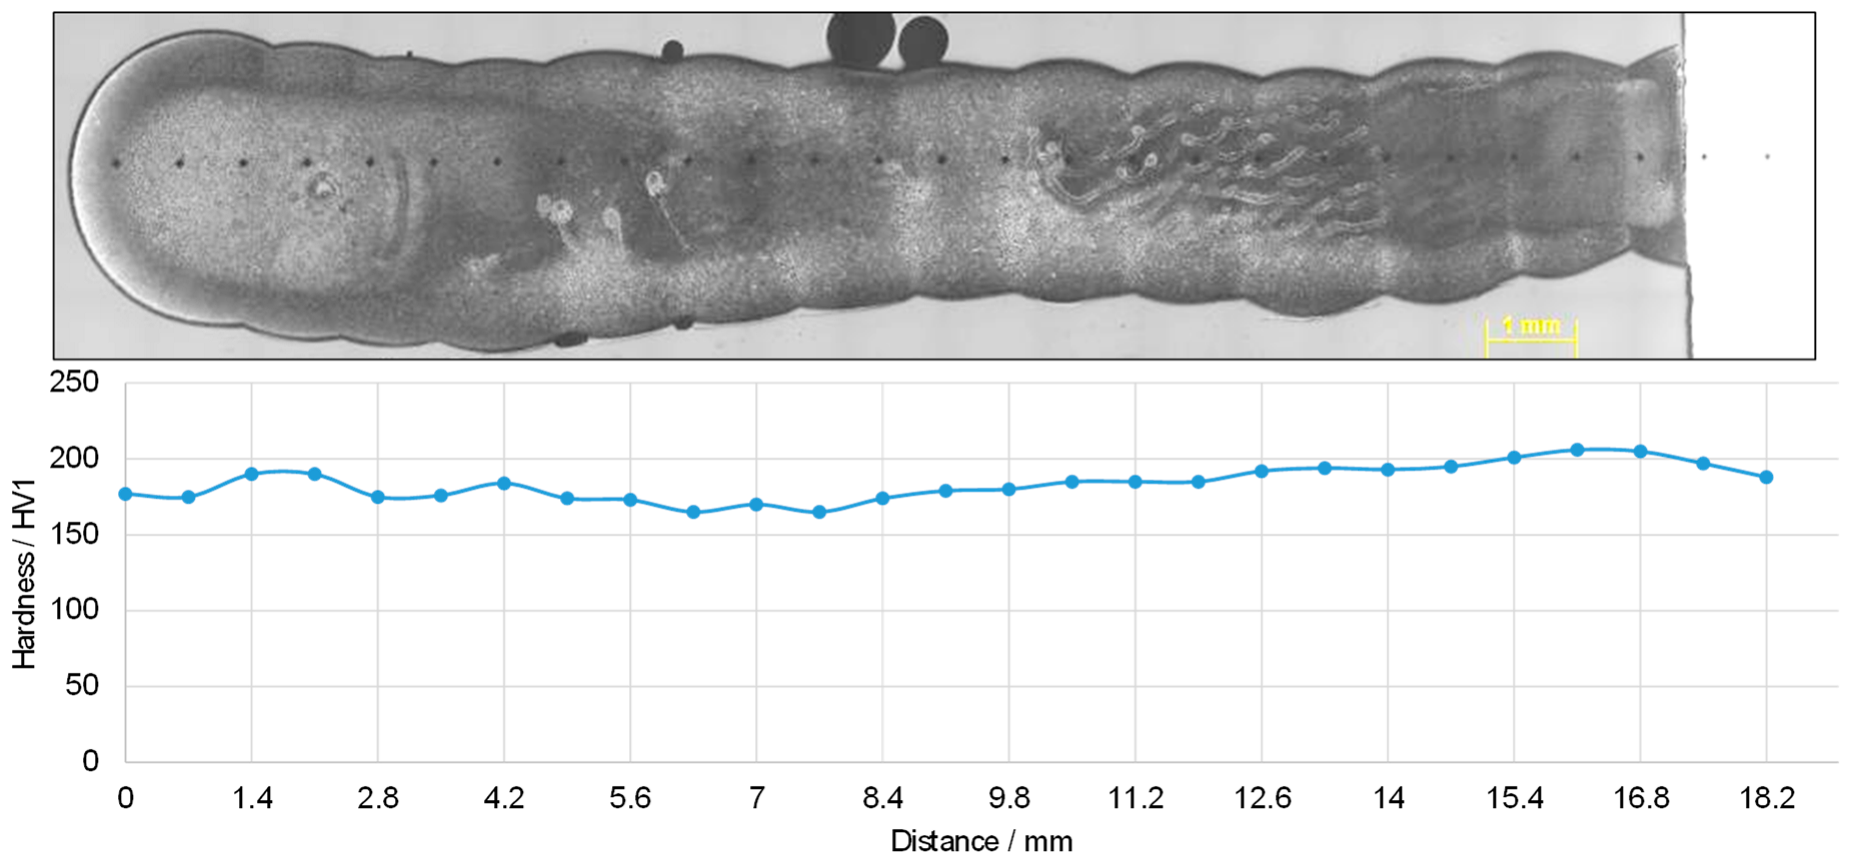
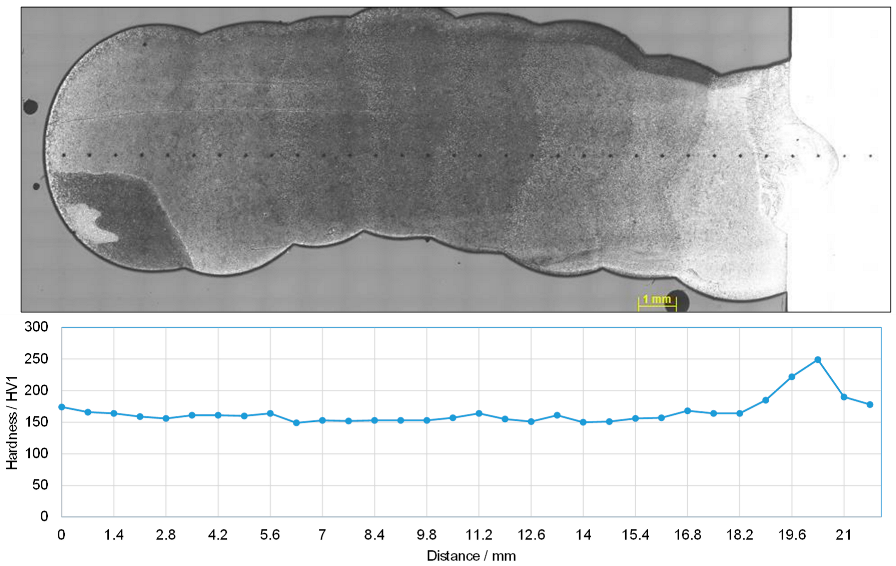
3.5. Hardness Profile Measurements

Figure 8 shows the hardness profile of specimen Z1. The plot of the graph shows slight local variations of the hardness value over the height of the cylinder wall. The measured hardnesses are in the range of approx. 160 HV1 to 210 HV1. At the lower end of the specimen, in the right area of the graph, there is a slight trend towards an increase in hardness, which can be attributed to the faster cooling and the changed heat dissipation at the beginning of the build process on the cold plate. The hardness trend over the height of the specimen is relatively uniform overall and shows no significant deviations.
Figure 9 shows the hardness profile on cylinder Z2 with the maximum tested deposition rate for the material CuAl8Ni6. In this case, again, the hardness profile is almost uniform over the entire height of the cylinder. The increased hardness values at the base of the cylinder can be attributed to the fact that measurements were already taken in the dilution area of the first layer and in the base material. In contrast to cylinder Z1 with its lower deposition rate, cylinder Z2 shows a slight decrease in the measured hardness in the range of approx. 150 HV1 to 170 HV1. However, the measured values for both specimens are within the specification of the material and are comparable with conventional aluminum bronze castings from the shipbuilding and marine engineering sectors [8].

3.6. Tensile Testing

The results of the tensile tests for yield strength, tensile strength and elongation at fracture are listed in Table 3. The three samples were manufactured and tested with the same parameters in order to statistically evaluate the variation of the results. The graphs for the tensile tests of the individual specimens are shown in Figure 10. The evaluation of the tensile tests for the alloy CuAl8Ni6 shows average values for the yield strength of approx. 369 MPa, for the tensile strength approx. 693 MPa and an average elongation at a break of 18%. While specimens W1 and W2 show a good agreement of the material behavior, and the values of specimen W3 are somewhat below the others. On average, however, the values achieved meet the material specifications of the wire manufacturer. Thus, the data sheet specifies a yield strength of approx. 380 MPa, a tensile strength of 600 MPa and an elongation at break of 16%. In the case of specimens W1 and W2, the values for tensile strength and elongation at break are even significantly exceeded for the specimens manufactured by DED-EB. One reason for this could be the special cooling conditions of the buildup process carried out in a vacuum. In the case of the alloy used, this favors the formation of a ductile microstructure of Cu-Al solid solutions. Due to the contents of Ni and Fe, the alloy exhibits a fine microstructure despite the high heat input in the buildup process [3]. Considering the known alloy behavior, it can be assumed that the reheating in the continuous buildup process, in combination with the slow cooling by the vacuum, also suppresses the precipitation of brittle β-phases in favor of the solid solutions and produce an accumulation of finely divided ϰ-phases [8].
Although this slightly decreases the hardness compared to samples with faster cooling, as shown by the comparison of the hardness profile measurement on thin-walled cylinders, tensile strength and elongation at break are improved.
The values are thus even higher than the qualities achieved for other copper materials in the DED-LB. For example, the work of Wang et al. on the copper–nickel alloy CuNi15Sn8 shows good elongations at break, but the tensile strengths achieved of approx. 327 MPa are significantly below the expected values of the material, which reach approx. 500 MPa for usual semi-finished products in strip form [6]. Similar behavior is also seen in the DED-Arc process, as suggested by the study of Chen et al. There, the material CuAl8Ni2 also showed a pronounced grain growth over the height of the additively manufactured samples as well as a lower tensile strength compared to the expected values of conventional manufacturing processes [10].
For a more detailed assessment of the results, the work of Khoroshko et al. can be consulted [22]. There, the mechanical properties of a Cu-Al alloy with 7.5% aluminum processed using DED-EB were investigated. A strong anisotropy is found in the material, which can probably be attributed to the pronounced grain growth of the single-phase alloy used as well as the heat conduction in the process. In the tensile specimens taken horizontally, tensile strengths of 245–359 MPa are achieved with a very ductile material behavior. However, it should be noted that comparable standardized alloys such as CuAl8, depending on the product form and heat treatment condition, usually achieve much higher tensile strengths of at least 412 MPa [8]. Recent work by Zykova et al. has enabled tensile strengths of 483 MPa [23], which is close to the lower limit of the material specification of the CuAl9Mn2 material used via in situ control of heat input and optimized process control [8].
Accordingly, the achievement and partial surpassing of the material specification in the area of yield strength, tensile strength and, at the same time, sufficiently good elongation at break in the present work can be assessed as an important step for the processing of high-strength aluminum bronzes by means of DED-EB. It should be noted that anisotropic behavior was observed in other copper alloys processed by means of DED-EB, depending on the position of the specimens relative to the buildup direction [24]. The values determined, therefore, only apply to the horizontal specimen orientation. The evaluation of anisotropy in the material CuAl8Ni6 will be the subject of future experiments.

4. Conclusions

The present project focused on an analysis of the suitability of the DED-EB for application on copper alloys using the example of high-strength aluminum bronze. The following conclusions can be drawn:
  • It was found that the dilution is increased at constant volume energy by increasing the welding speed, but the values with a maximum dilution < 12% are not problematic for the parameters investigated.
  • The wetting angle decreases sharply with increasing volume energy, resulting in track geometries unsuitable for additive manufacturing. A consideration of the volumetric energy proved to be effective in controlling the process. The stable process range was between 18 J/mm3 and 32 J/mm3 for CuAl8Ni6.
  • The scalability of the process was found to be good by varying the beam current and wire feed in steps. However, when increasing the deposition rate, the change in the seam profile must be considered since the track width increases much faster than the track height.
  • The results of the hardness measurements confirm the constant volumetric energy approach used for scaling the process. Despite increasing the application rate by a factor of four, there are no noticeable changes in hardness within the manufactured tracks. Even the additively manufactured cylinders show an approximately uniform hardness profile along the height.
  • The mechanical properties of the additive manufactured test samples show good agreement with the material specification. For the alloy CuAl8Ni6, even higher tensile strengths of approx. 690 MPa could be realized compared to the specified value at the same elongation at fracture with around 18%.
  • Overall, the DED-EB is shown to be suitable for processing high-strength aluminum bronze with good component quality. Within the stable process range investigated, track widths of 2.6 mm and 8.4 mm and track heights between 1.4 mm and 2.9 mm could be achieved in a single track using welding wire of diameter 1.0 mm. The deposition rates achieved range from 0.6 kg/h to 2.5 kg/h, depending on the parameter settings.

Author Contributions

Conceptualization, J.R.; methodology, J.R.; formal analysis, J.R.; investigation, J.R.; resources, J.R.; data curation, J.R.; writing, original draft preparation, J.R.; writing, review and editing, M.B. and M.R.; visualization, J.R.; supervision, M.B. and M.R.; project administration, J.R. and M.B.; funding acquisition, J.R. and M.B. All authors have read and agreed to the published version of the manuscript.

Funding

This research was funded by Dobeneck-Technologie-Stiftung (c/o honert + partner mbB, Theatinerstr. 14, 80333 München, Germany); project title: “Prozessevaluierung und Erweiterung der Einsatzmöglichkeiten beim WEBAM von Cu-Werkstoffen”.

Data Availability Statement

The data presented in this study are available on request from the corresponding author. The data are not publicly available due to corporate privacy restrictions.

Conflicts of Interest

The authors declare no conflict of interest. The funders had no role in the design of the study; in the collection, analyses, or interpretation of data; in the writing of the manuscript; or in the decision to publish the results.

References

  1. Constantin, L.; Wu, Z.; Li, N.; Fan, L.; Silvain, J.-F.; Lu, Y.F. Laser 3D printing of complex copper structures. Addit. Manuf. 2020, 35, 101268. [Google Scholar] [CrossRef]
  2. Yang, P.; Guo, X.; He, D.; Shao, W.; Tan, Z.; Fu, H.; Zhou, Z.; Zhang, X. Microstructure Twinning and Mechanical Properties of Laser Melted Cu-10Sn Alloy for High Strength and Plasticity. J. Mater. Eng. Perform. 2021, 31, 2624–2632. [Google Scholar] [CrossRef]
  3. Mayer, G.; Zähr, J.; Füssel, U. Schweißen von Kupfer und Kupferlegierungen; Deutsches Kupferinstitut: Dusseldorf, Germany, 2009. [Google Scholar]
  4. Prasad, H.S.; Brueckner, F.; Volpp, J.; Kaplan, A.F.H. Laser metal deposition of copper on diverse metals using green laser sources. Int. J. Adv. Manuf. Technol. 2020, 107, 1559–1568. [Google Scholar] [CrossRef] [Green Version]
  5. Hori, E.; Sato, Y.; Shibata, T.; Tojo, K.; Tsukamoto, M. Development of SLM process using 200 W blue diode laser for pure copper additive manufacturing of high density structure. J. Laser Appl. 2021, 33, 012008. [Google Scholar] [CrossRef]
  6. Wang, J.; Zhou, X.; Li, J.; Zhu, J.; Zhang, M. A comparative study of Cu–15Ni–8Sn alloy prepared by L-DED and L-PBF: Microstructure and properties. Mater. Sci. Eng. A 2022, 840, 142934. [Google Scholar] [CrossRef]
  7. Yao, C.-L.; Kang, H.-S.; Lee, K.-Y.; Zhai, J.-G.; Shim, D.-S. A study on mechanical properties of CuNi2SiCr layered on nickel–aluminum bronze via directed energy deposition. J. Mater. Res. Technol. 2022, 18, 5337–5361. [Google Scholar] [CrossRef]
  8. Deutsches Kupferinstitut. Kupfer-Aluminium-Legierungen; Deutsches Kupferinstitut: Dusseldorf, Germany, 2010. [Google Scholar]
  9. Wang, Y.; Chen, X.; Konovalov, S.; Su, C.; Siddiquee, A.N.; Gangil, N. In-situ wire-feed additive manufacturing of Cu-Al alloy by addition of silicon. Appl. Surf. Sci. 2019, 487, 1366–1375. [Google Scholar] [CrossRef]
  10. Chen, W.; Chen, Y.; Zhang, T.; Wen, T.; Feng, X.; Yin, L. Effects of Location on the Microstructure and Mechanical Properties of Cu-8Al-2Ni-2Fe-2Mn Alloy Produced Through Wire Arc Additive Manufacturing. J. Mater. Eng. Perform. 2020, 29, 4733–4744. [Google Scholar] [CrossRef]
  11. Guo, C.; Kang, T.; Wu, S.; Ying, M.; Liu, W.M.; Chen, F. Microstructure, mechanical, and corrosion resistance of copper nickel alloy fabricated by wire-arc additive manufacturing. MRS Commun. 2021, 11, 910–916. [Google Scholar] [CrossRef]
  12. Wang, Y.; Konovalov, S.; Chen, X.; Ivanov, Y.; Jayalakshmi, S.; Singh, R.A. Research on Cu-6.6%Al-3.2%Si Alloy by Dual Wire Arc Additive Manufacturing. J. Mater. Eng. Perform. 2021, 30, 1694–1702. [Google Scholar] [CrossRef]
  13. Guschlbauer, R.; Osmanlic, F.; Körner, C. Herausforderungen bei der Additiven Fertigung von Reinkupfer mit dem selektivem Elektronenstrahlschmelzen. Metall 2017, 71, 459–462. [Google Scholar]
  14. Sharabian, E.; Leary, M.; Fraser, D.; Gulizia, S. Electron beam powder bed fusion of copper components: A review of mechanical properties and research opportunities. Int. J. Adv. Manuf. Technol. 2022, 122, 513–532. [Google Scholar] [CrossRef]
  15. Megahed, S.; Fischer, F.; Nell, M.; Forsmark, J.; Leonardi, F.; Zhu, L.; Hameyer, K.; Schleifenbaum, J.H. Manufacturing of Pure Copper with Electron Beam Melting and the Effect of Thermal and Abrasive Post-Processing on Microstructure and Electric Conductivity. Materials 2022, 16, 73. [Google Scholar] [CrossRef]
  16. Kalashnikov, K.N.; Rubtsov, V.E.; Savchenko, N.L.; Kalashnikova, T.A.; Osipovich, K.S.; Eliseev, A.A.; Chumaevskii, A.V. The effect of wire feed geometry on electron beam freeform 3D printing of complex-shaped samples from Ti-6Al-4V alloy. Int. J. Adv. Manuf. Technol. 2019, 105, 3147–3156. [Google Scholar] [CrossRef]
  17. Fuchs, J.; Schneider, C.; Enzinger, N. Wire-based additive manufacturing using an electron beam as heat source. Weld. World 2018, 62, 267–275. [Google Scholar] [CrossRef] [Green Version]
  18. Pixner, F.; Warchomicka, F.; Peter, P.; Steuwer, A.; Colliander, M.H.; Pederson, R.; Enzinger, N. Wire-Based Additive Manufacturing of Ti-6Al-4V Using Electron Beam Technique. Materials 2020, 13, 3310. [Google Scholar] [CrossRef] [PubMed]
  19. Gurianov, D.A.; Fortuna, S.V. Wire-feed electron beam additive manufacturing of nickel-based superalloy: Process stability and structure features. AIP Conf. Proc. 2020, 2310, 020120. [Google Scholar] [CrossRef]
  20. Baufeld, B.; Schönfelder, S.; Löwer, T. Wire Electron Beam Additive Manufacturing at pro-beam. In Proceedings of the International Electron Beam Welding Conference, Online, 9–10 March 2021; pp. 93–99. [Google Scholar]
  21. Baufeld, B. Wire Electron Beam Additive Manufacturing of Copper. J. Phys. Conf. Ser. 2022, 2443, 012001. [Google Scholar] [CrossRef]
  22. Khoroshko, E.; Filippov, A.; Tarasov, S.; Shamarin, N.; Kolubaev, E.; Moskvichev, E.; Lychagin, D. Study of the Structure and Mechanical Properties of Aluminum Bronze Printed by Electron Beam Additive Manufacturing. Met. Work. Mater. Sci. 2020, 22, 118–129. [Google Scholar] [CrossRef]
  23. Zykova, A.P.; Panfilov, A.O.; Chumaevskii, A.V.; Vorontsov, A.V.; Nikonov, S.Y.; Moskvichev, E.N.; Gurianov, D.A.; Savchenko, N.L.; Tarasov, S.Y.; Kolubaev, E.A. Formation of Microstructure and Mechanical Characteristics in Electron Beam Additive Manufacturing of Aluminum Bronze with an In-Situ Adjustment of the Heat Input. Russ. Phys. J. 2022, 65, 811–817. [Google Scholar] [CrossRef]
  24. Osipovich, K.; Kalashnikov, K.; Chumaevskii, A.; Gurianov, D.; Kalashnikova, T.; Vorontsov, A.; Zykova, A.; Utyaganova, V.; Panfilov, A.; Nikolaeva, A.; et al. Wire-Feed Electron Beam Additive Manufacturing: A Review. Metals 2023, 13, 279. [Google Scholar] [CrossRef]
  25. Copper Development Association Inc. Aluminum Bronzes—Overview. 2002. Available online: https://www.copper.org/resources/properties/microstructure/al_bronzes.html (accessed on 10 March 2023).
Figure 1. (A) Process scheme; (B) experimental setup.
Metals 13 01416 g001
Figure 2. Target values at the track geometry.
Metals 13 01416 g002
Figure 3. (A) Single tracks for initial tests on energy input, dilution and scalability; (B) Additively manufactured cylinder and position of sample extraction for hardness profile and microstructure; (C) Additively manufactured wall and position of the tensile specimens.
Metals 13 01416 g003
Figure 4. (A) Hardness over scaling; (B) development of track geometry over scaling; (C) dilution over welding speed; (D) dependence of the wetting angle on the volumetric energy.
Metals 13 01416 g004
Figure 5. Development of track geometry when scaling the process via wire feed and beam current.
Metals 13 01416 g005
Figure 6. Microstructure of selected areas on the etched cross-section of sample Z1. (A) the macroscopic overview image; (B) the detailed images.
Metals 13 01416 g006
Figure 7. Microstructure of selected areas on the etched cross-section of sample Z2. (A) the macroscopic overview image; (B) the detailed images.
Metals 13 01416 g007
Figure 8. Hardness profile and position of measuring points sample Z1.
Metals 13 01416 g008
Figure 9. Hardness profile and position of measuring points sample Z2.
Metals 13 01416 g009
Figure 10. Results of the tensile tests.
Metals 13 01416 g010
Table 1. Chemical composition of the materials.
Substrate Material: X2CrNiMo17-12-2 (1.4404)
ElementFeCrNiMoMnSiC
Amount/Ma%Bal.17.4110.11.971.580.360.03
Welding Wire: CuAl8Ni6
ElementFeCuNiAlMn
Amount/Ma%3.5Bal.4.59.01.3
Table 2. Overview process parameters.
Sample No.Beam Current/mAWelding Speed/mm/sWire Feed/m/minVolume Energy/J/mm3Experimental Purpose
1943.523.6Tests on energy input
2124618.3
31241110
46469.2
594613.8
61243.531.4
7643.515.7
894182.5
964155
10933.523.6Tests on welding speed and dilution
1193.63.523.6
1294.53.523.6
13963.523.6
144.561.7523.6Test on scalability
15963.523.6
1613.565.2523.6
17186723.6
Z14.561.7523.6Hardness profile measurements
Z2186723.6
W1; W2; W313.565.2523.6Tensile testing
Table 3. Overview of the achieved mechanical properties.
Sample No.Yield Strength/MPaTensile Strength/MPaElongation at Fracture/%
W138271021
W234469419.8
W337967512.4
Disclaimer/Publisher’s Note: The statements, opinions and data contained in all publications are solely those of the individual author(s) and contributor(s) and not of MDPI and/or the editor(s). MDPI and/or the editor(s) disclaim responsibility for any injury to people or property resulting from any ideas, methods, instructions or products referred to in the content.

