
DSC Investigation and Thermodynamic Modeling of the Al–Sb–Sn System

Abstract
:1. Introduction
2. Literature Review
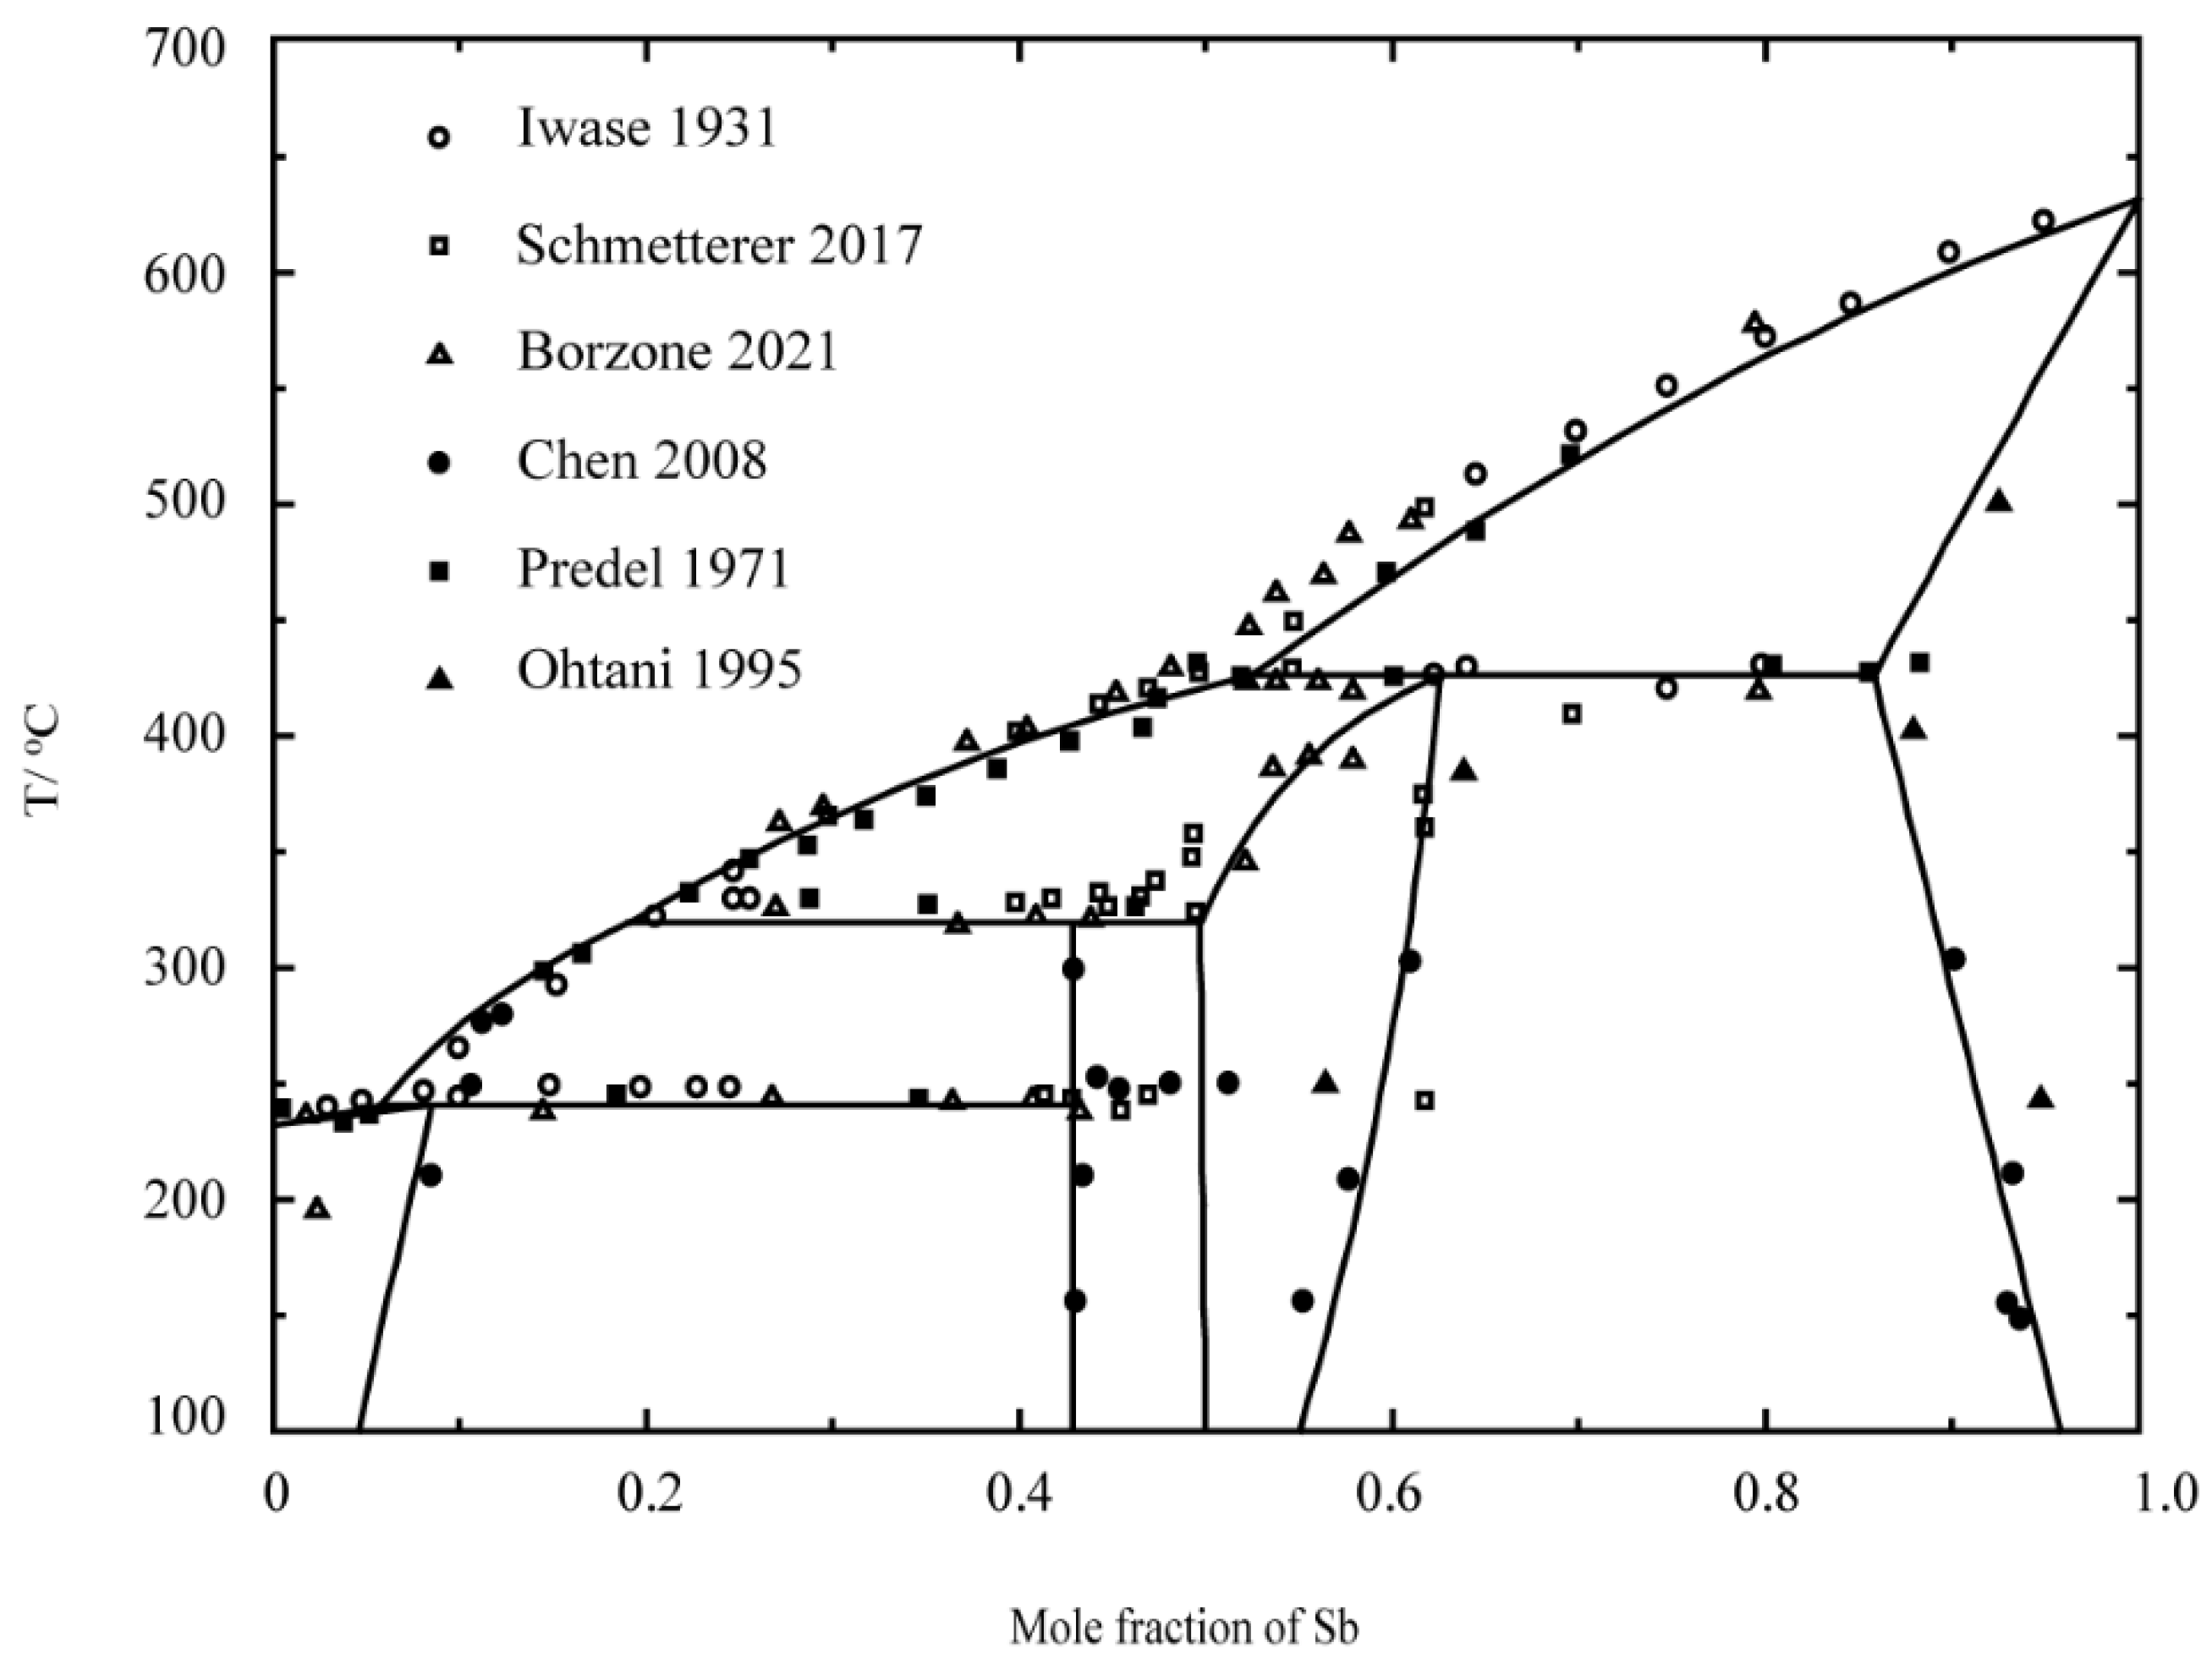
2.1. Binary System
2.2. Ternary System
3. Materials and Methods
4. Thermodynamic Model
4.1. Stoichiometric Compounds
4.2. Gas Phase
4.3. Liquid Phase
4.4. Solid Solution Phase
5. Results and Discussion
5.1. DSC Results of the Al–Sb–Sn System
- (1)
- Al–SnSb system
- (2)
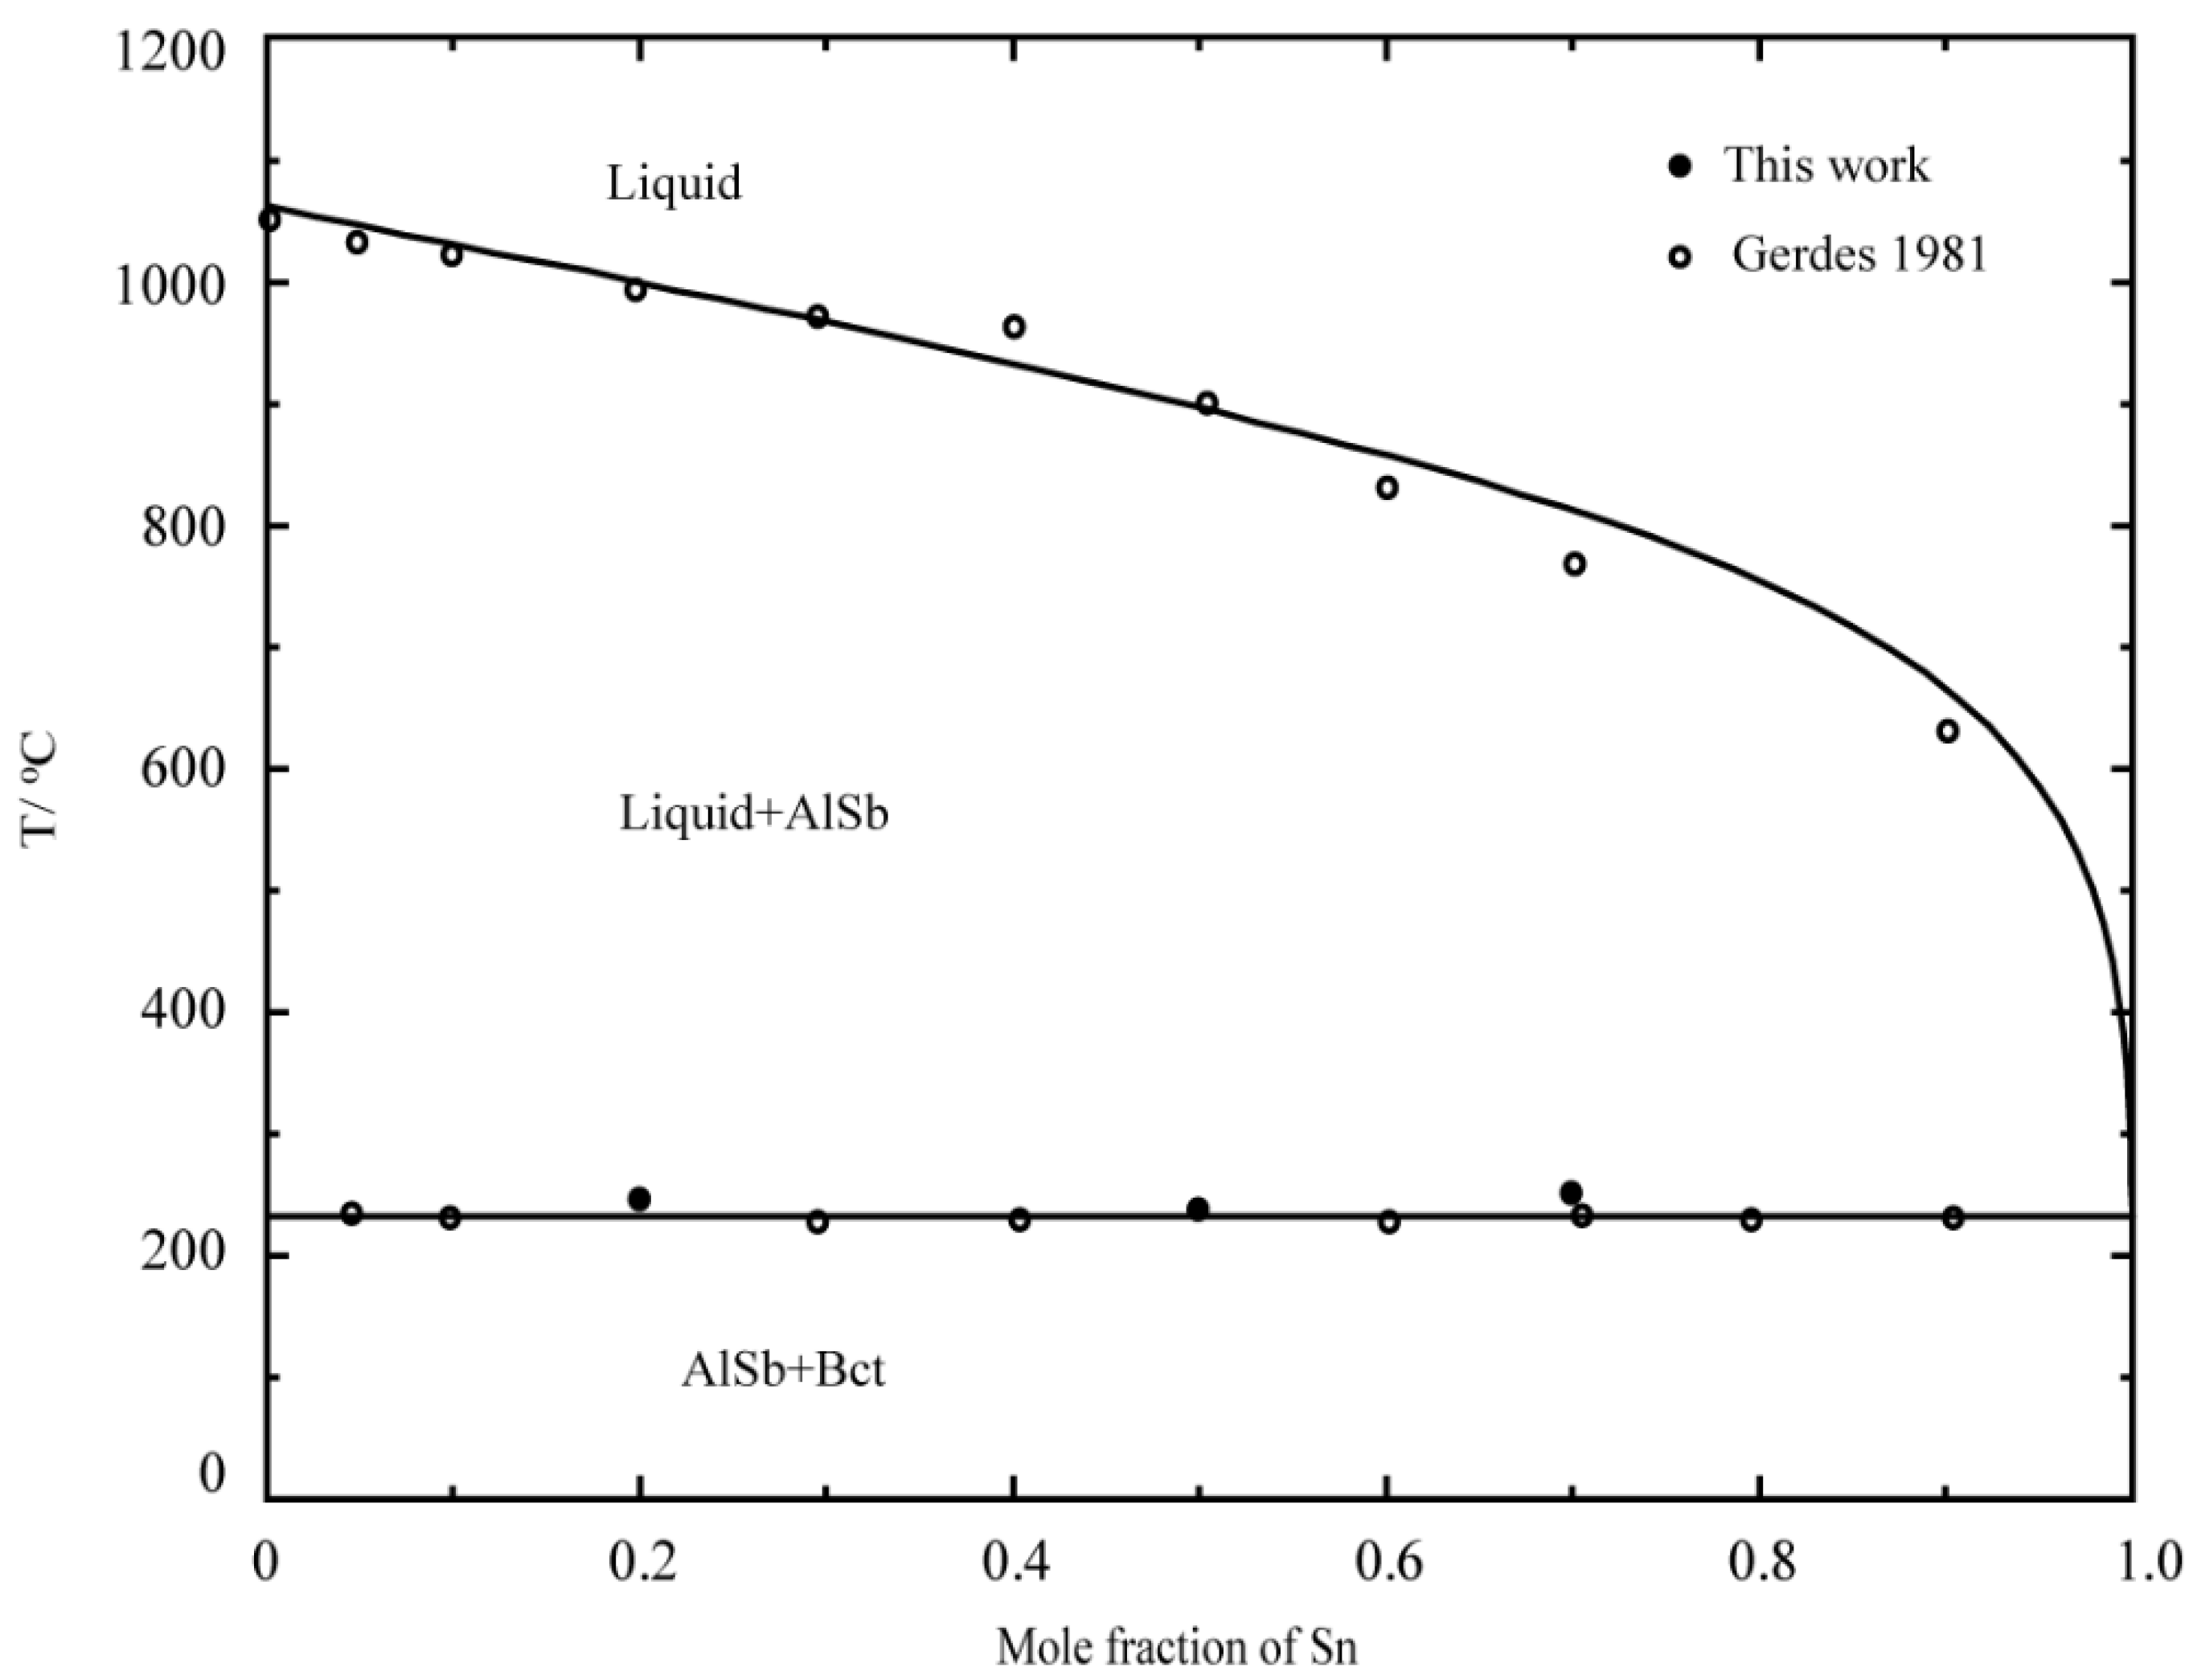
- Sn–AlSb system
- (3)
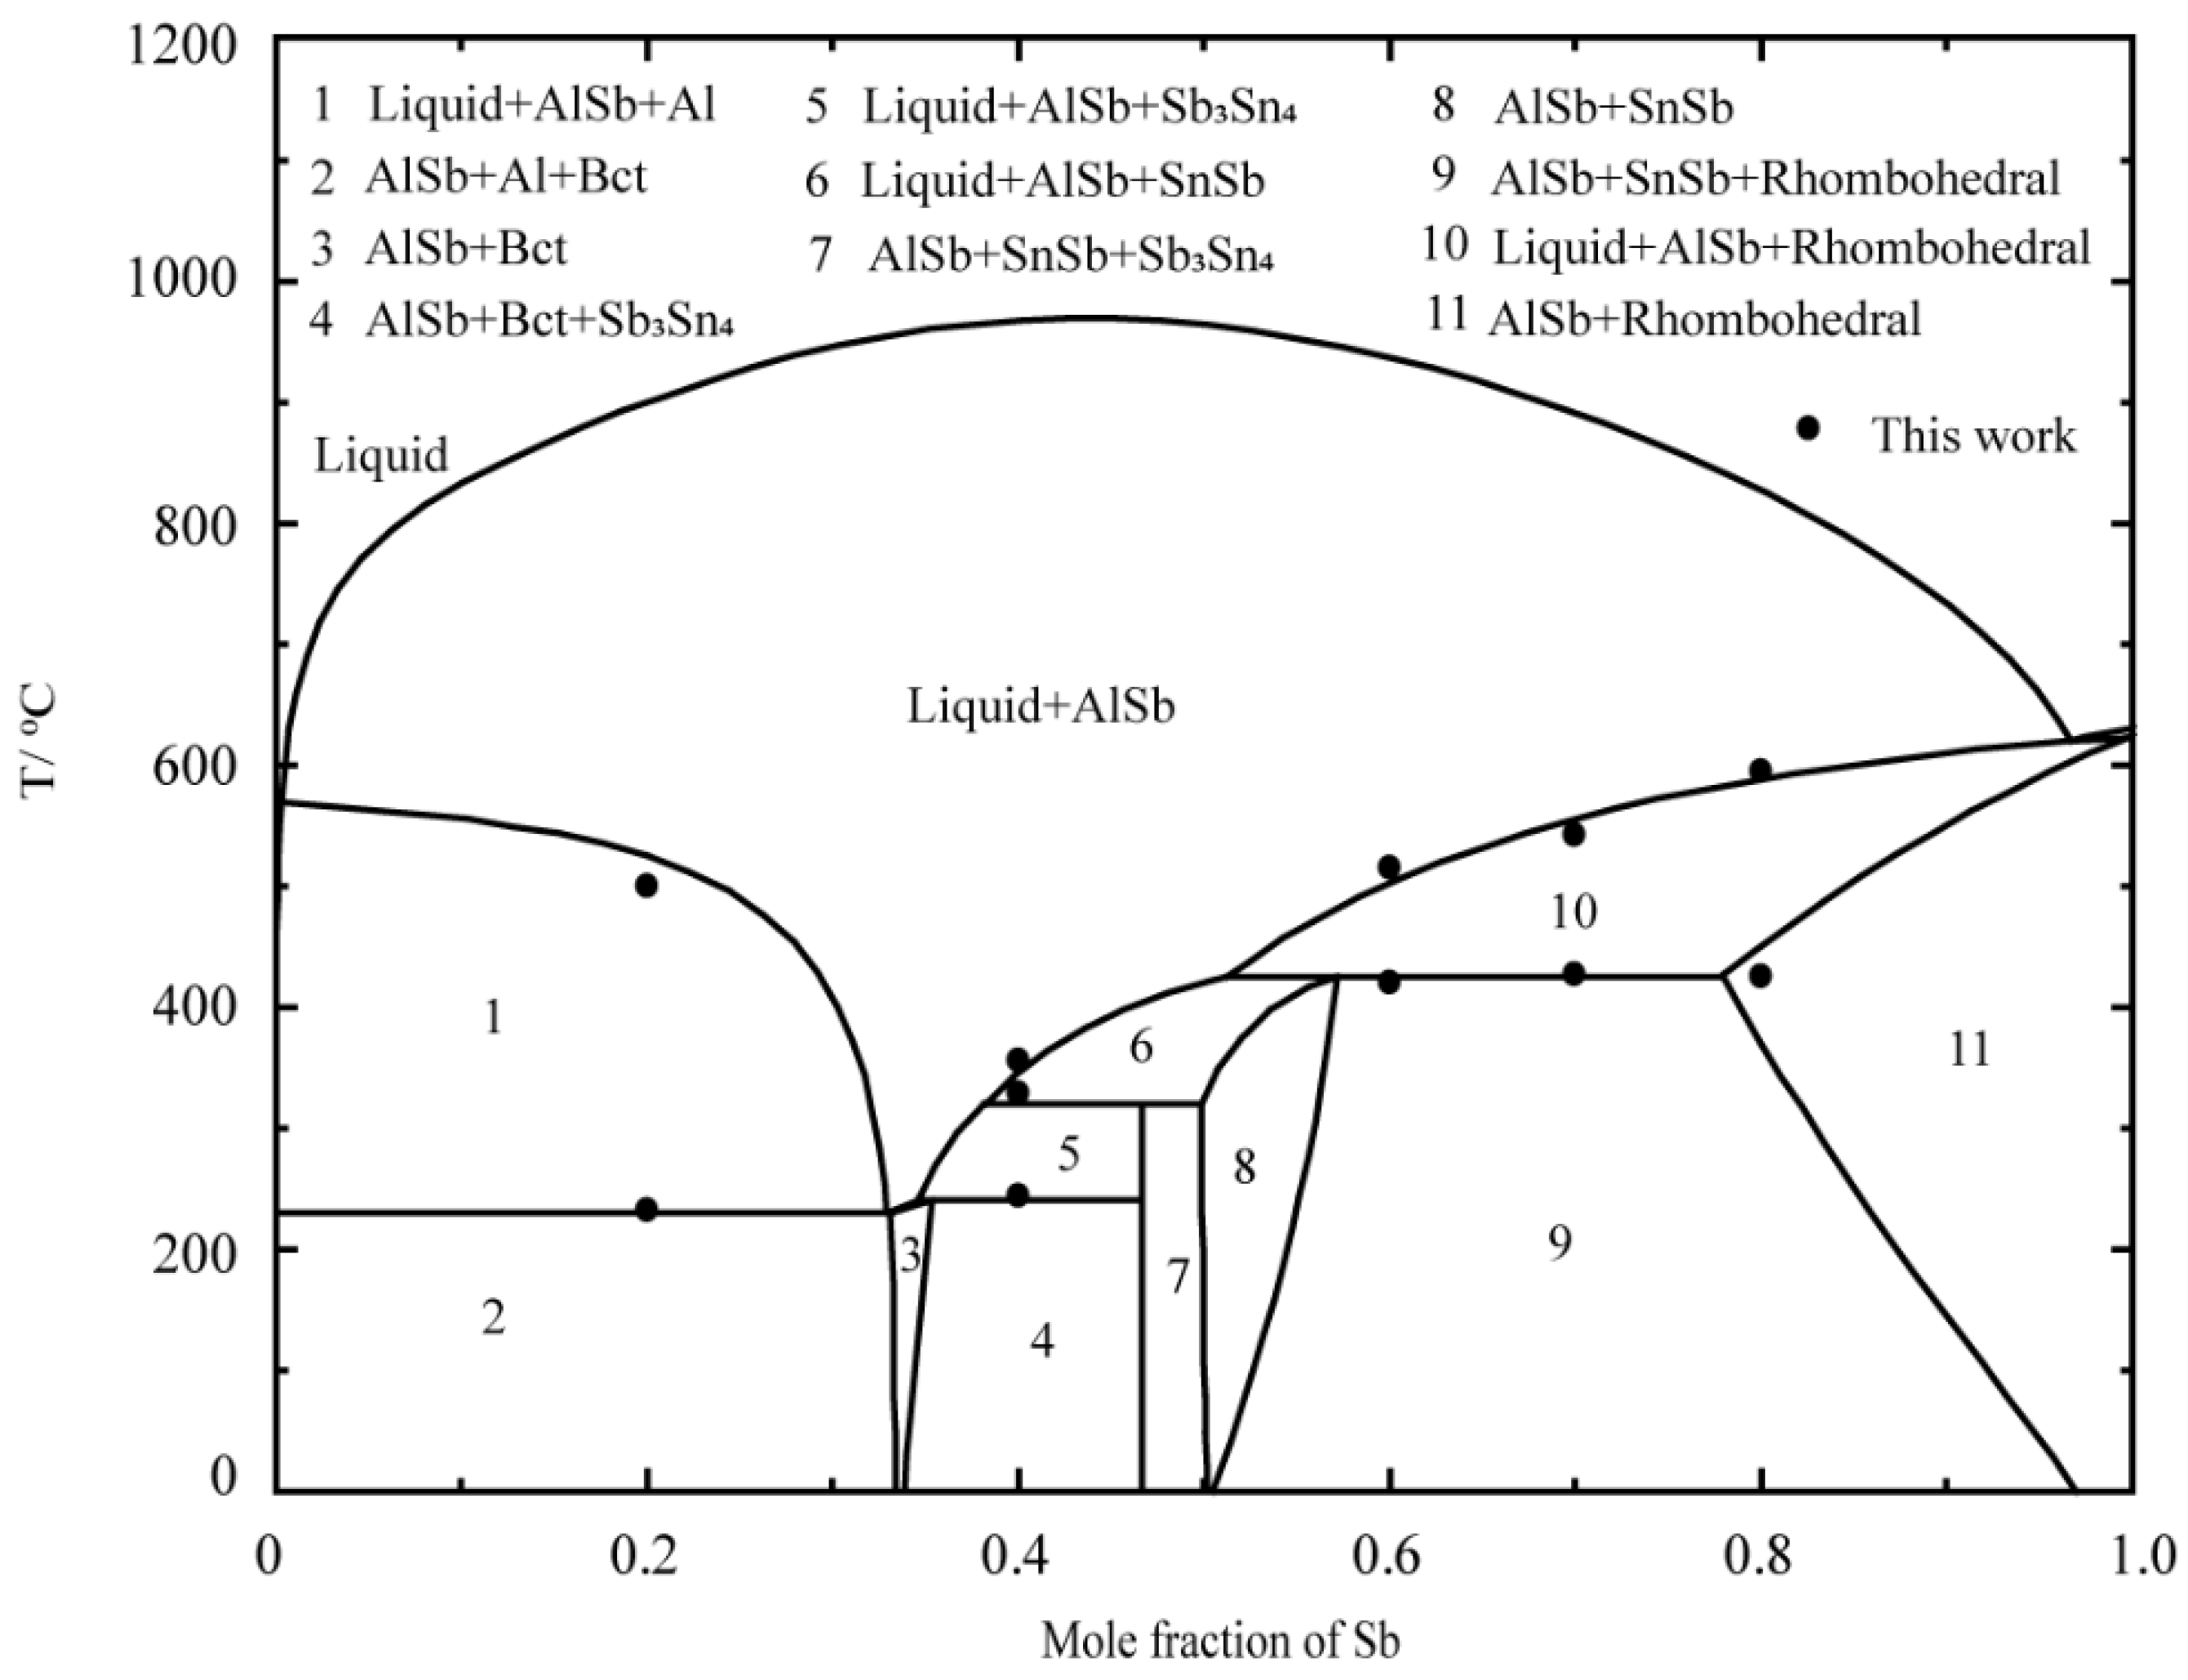
- Sb–AlSn system
5.2. Thermodynamic Modeling of the Al–Sb–Sn System
6. Conclusions
Supplementary Materials
Author Contributions
Funding
Data Availability Statement
Conflicts of Interest
References
- Zhao, X.; Hai, X. Microstructure and tribological behavior of the nickel-coated-graphite-reinforced Babbitt metal composite fabricated via selective laser melting. Int. J. Miner. Met. Mater. 2022, 29, 320–326. [Google Scholar] [CrossRef]
- Naeimian, H.; Mofid, M.A. TLP bonding of Ti−6Al−4V to Al 2024 using thermal spray Babbitt alloy interlayer. Trans. Nonferrous Met. Soc. China 2020, 30, 1267–1276. [Google Scholar] [CrossRef]
- Ni, Y.; Zhang, H.; Dong, G. Tribological Performances of Modified Babbitt Alloy Under Different Sliding Modes. J. Tribol. 2021, 143, 061402. [Google Scholar] [CrossRef]
- Wadhwa, A.S.; Chauhan, A. Fabrication and multi-performance optimization of mechanical properties of novel Babbitt-Ilmenite metal matrix composite using entropy based hybrid Taguchi—Grey relational analysis. Eng. Res. Express 2023, 5, 015051. [Google Scholar] [CrossRef]
- Stanev, L.; Kolev, M.; Drenchev, L.; Krastev, B. Fabrication Technique and Characterization of Aluminum Alloy-Based Porous Composite Infiltrated with Babbitt Alloy. J. Mater. Eng. Perform. 2020, 29, 3767–3773. [Google Scholar] [CrossRef]
- Zhao, X.; Lai, R.; Hai, X. A Study on the Microstructures and Properties of Selective Laser Melted Babbitt Metals. J. Mater. Eng. Perform. 2019, 28, 5433–5440. [Google Scholar] [CrossRef]
- Lashin, A.R.; Mossa, M.; El-Bediwi, A.; Kamal, M. Study of some physical properties of the rapidly solidified Sn–Sb–Cu–Zn alloys. Mater. Des. 2013, 43, 322–326. [Google Scholar] [CrossRef]
- Fathy, N. Interfacial Microstructure and Shear Strength Improvements of Babbitt–Steel Bimetal Composites Using Sn–Bi Interlayer via Liquid–Solid Casting. Sustainability 2023, 15, 804. [Google Scholar] [CrossRef]
- Gajmal, S.S.; Raut, D.N. An Investigation on Wear Behaviour of ASTM B23 tin-Based Babbitt Alloy Developed Through Microwave-Assisted Casting. Int. J. Met. 2022, 16, 1995–2013. [Google Scholar] [CrossRef]
- Ramadan, M.; Alghamdi, A.S.; Subhani, T.; Halim, K.S.A. Fabrication and Characterization of Sn-Based Babbitt Alloy Nanocomposite Reinforced with Al2O3 Nanoparticles/Carbon Steel Bimetallic Material. Materials 2020, 13, 2759. [Google Scholar] [CrossRef]
- Zhao, J.; Sun, K.; Liang, G.; Xu, C.; Zhao, J.; Xue, F.; Zhou, J. Effect of Zn additions on the microstructure and mechanical properties of Sn-Babbitt alloys fabricated by arc deposition. J. Mater. Res. Technol. 2021, 15, 6726–6735. [Google Scholar] [CrossRef]
- Ren, X.; Chen, N.; Zhang, G.; Xu, H.; Zhang, Y.; Shi, Z.; Zhaojie, W.; Yijun, L. Effect of Pb on microstructure and mechanical properties of Tin Babbitt alloy. J. Phys. Conf. Ser. 2023, 2478, 052007. [Google Scholar] [CrossRef]
- Zeren, A.; Feyzullahoglu, E.; Zeren, M. A study on tribological behaviour of tin-based bearing material in dry sliding. Mater. Des. 2007, 28, 318–323. [Google Scholar] [CrossRef]
- Bora, M.; Coban, O.; Sinmazcelik, T.; Günay, V.; Zeren, M. Instrumented indentation and scratch testing evaluation of tribological properties of tin-based bearing materials. Mater. Des. 2010, 31, 2707–2715. [Google Scholar] [CrossRef]
- Zeren, A. Embeddability behaviour of tin-based bearing material in dry sliding. Mater. Des. 2007, 28, 2344–2350. [Google Scholar] [CrossRef]
- Kamal, M.; El-Bediwi, A.B.; El-Shobaki, M.R. Influence of alloying elements on structure and some physical properties of quenched Sn–Sb alloy. Radiat. Eff. Defects Solids 2006, 161, 549–557. [Google Scholar] [CrossRef]
- Tasgin, Y. The Effects of Boron Minerals on the Microstructure and Abrasion Resistance of Babbitt Metal (Sn–Sb–Cu) Used as Coating Materials in Hydroelectric Power Plants. Int. J. Met. 2020, 14, 257–265. [Google Scholar] [CrossRef]
- Ramadan, M.; Hafez, K. Interfacial microstructure and hardness of Sn-Based Babbitt/C93700 Cu-Pb-Sn bimetallic materials. Mater. Today: Proc. 2021, 45, 5074–5080. [Google Scholar] [CrossRef]
- Ni, Y.; Sun, N.; Zhu, G.; Liu, S.; Liu, J.; Dong, G. Effect of different Cu6Sn5 morphology on the tribological properties of Babbitt alloy. Ind. Lubr. Tribol. 2022, 74, 580–587. [Google Scholar] [CrossRef]
- Ganiev, I.N.; Khodzhanazarov, K.M.; Khodzhaev, F.K. Effect of Sodium Additives on the Kinetics of the Solid-State Oxidation of Lead Babbitt PbSb15Sn10Na. Russ. J. Phys. Chem. A 2023, 97, 334–339. [Google Scholar] [CrossRef]
- Dawood, F.; Albawee, A.; Ibrahim, A.S. Influence of aluminum addition on the structural and physical properties of tin-antimony alloy. Mat. Sci. Ind. J. 2018, 16, 133. [Google Scholar]
- Wang, A.; Li, Y.; Yang, B.; Xu, B.; Kong, L.; Liu, D. Process optimization for vacuum distillation of Sn–Sb alloy by response surface methodology. Vacuum 2014, 109, 127–134. [Google Scholar] [CrossRef]
- Bale, C.W.; Chartrand, P.; Degterov, S.A.; Eriksson, G.; Hack, K.; Mahfoud, R.B.; Petersen, S. FactSage thermochemical software and data-bases. Calphad 2002, 26, 189–228. [Google Scholar] [CrossRef]
- Wei, W.; Zhao, W.; Liu, G.; Cao, Z. Thermodynamic description of the Ti–C–N–O system. Calphad 2023, 80, 102520. [Google Scholar] [CrossRef]
- Paliwal, M.; Jung, I.H. Thermodynamic modeling of the Al–Bi, Al–Sb, Mg–Al–Bi and Mg–Al–Sb systems. Calphad 2010, 34, 51–63. [Google Scholar] [CrossRef]
- Kang, Y.B.; Pelton, A.D. Modeling short-range ordering in liquids: The Mg–Al–Sn system. Calphad 2010, 34, 180–188. [Google Scholar] [CrossRef]
- Zhang, J.; Wang, J.; Yuan, Y. A thermodynamic assessment of the Mg–Sn–Sb ternary system. Calphad 2021, 75, 102361. [Google Scholar] [CrossRef]
- Schmid, R.; Chang, Y. A thermodynamic study on an associated solution model for liquid alloys. Calphad 1985, 9, 363–382. [Google Scholar] [CrossRef]
- Pelton, A.D.; Blander, M. Thermodynamic analysis of ordered liquid solutions by a modified quasichemical approach—Application to silicate slags. Met. Trans. B 1986, 17, 805–815. [Google Scholar] [CrossRef]
- Pelton, A.D.; Degterov, S.A.; Eriksson, G.; Robelin, C.; Dessureault, Y. The modified quasichemical model I—Binary solutions. Met. Mater. Trans. B 2000, 31, 651–659. [Google Scholar] [CrossRef]
- Pelton, A.D.; Chartrand, P. The modified quasi-chemical model: Part II. Multicomponent solutions. Met. Mater. Trans. A 2001, 32, 1355–1360. [Google Scholar] [CrossRef]
- Hirosi, K. The Al-Sb-Sn ternary system map. J. Jpn. Inst. Met. Mater. 1942, 6, 553–559. (In Japanese) [Google Scholar]
- Gerdes, F.; Predel, B. Phase Equilibria of the Pseudobinary Systems GaSb-Sn, InSb-Sn and AlSb-Sn. J. Less-Common Met. 1981, 79, 281–288. [Google Scholar] [CrossRef]
- Gerdes, F.; Predel, B. Thermodynamic Properties of the Molten Alloy Systems InSb-Sn, GaSb- Sn and AlSb-Sn. J. Less Common Met. 1981, 78, 19–28. [Google Scholar] [CrossRef]
- Tomashyk, V. Ternary Alloys based on III-V Semiconductors; CRC Press: Boca Raton, FL, USA, 2017. [Google Scholar]
- Li, J.Q.; Sun, X.Q.; Zhuang, Y.H. Room temperature Section of Al-Sb-Sn ternary alloy phase Diagram. J. Guangxi Univ. Nat. Sci. Ed. 1994, 3, 269–271. [Google Scholar]
- Yéo, D.; Hassam, S.; Boa, D.; Mikaelian, G.; Rogez, J. DSC investigation of phase equilibria in the Bi-Pb-Sb system. J. Chem. Thermodyn. 2016, 101, 316–322. [Google Scholar] [CrossRef]
- Cai, G.; Zeng, L. The isothermal section of the Cr-Pb-Sb ternary system at 500 K. J. Alloys Compd. 2005, 403, 127–130. [Google Scholar] [CrossRef]
- Wang, C.Z. Metallurgical Physicochemical Research Methods; Metallurgical Industry Press: Beijing, China, 2013. [Google Scholar]
- Dinsdale, A. SGTE data for pure elements. Calphad 1991, 15, 317–425. [Google Scholar] [CrossRef]
- Pelton, A.D. A general “geometric” thermodynamic model for multicomponent Solutions. Calphad 2001, 25, 319–328. [Google Scholar] [CrossRef]
- Hillert, M. The compound energy formalism. J. Alloys Compd. 2001, 320, 161–176. [Google Scholar] [CrossRef]
- Iwase, K.; Aoki, N.; Osawa, A. DTA measurements in Sb-Sn alloys. Sci. Rep. 1931, 20, 353. [Google Scholar]
- Schmetterer, C.; Polt, J.; Flandorfer, H. The phase equilibria in the Sb-Sn system—Part II: Experimental results. J. Alloys Compd. 2018, 743, 523–536. [Google Scholar] [CrossRef]
- Borzone, G.; Delsante, S.; Li, D.; Novakovic, R. New Insights into Phase Equilibria of the Sb-Sn System. J. Phase Equilibria Diffus. 2021, 42, 63–76. [Google Scholar] [CrossRef]
- Chen, S.-W.; Chen, C.-C.; Gierlotka, W.; Zi, A.-R.; Chen, P.-Y.; Wu, H.-J. Phase Equilibria of the Sn-Sb Binary System. J. Electron. Mater. 2008, 37, 992–1002. [Google Scholar] [CrossRef]
- Predel, B.; Schwermann, W. Constitution and thermodynamics of the antimony-tin system. J. Jpn. Inst. Met. Mater. 1971, 99, 169–173. [Google Scholar]
- Ohtani, H.; Okuda, K.; Ishida, K. Thermodynamic study of phase equilibria in the Pb-Sn-Sb system. J. Phase Equilib. Diffus. 1995, 16, 416–429. [Google Scholar] [CrossRef]
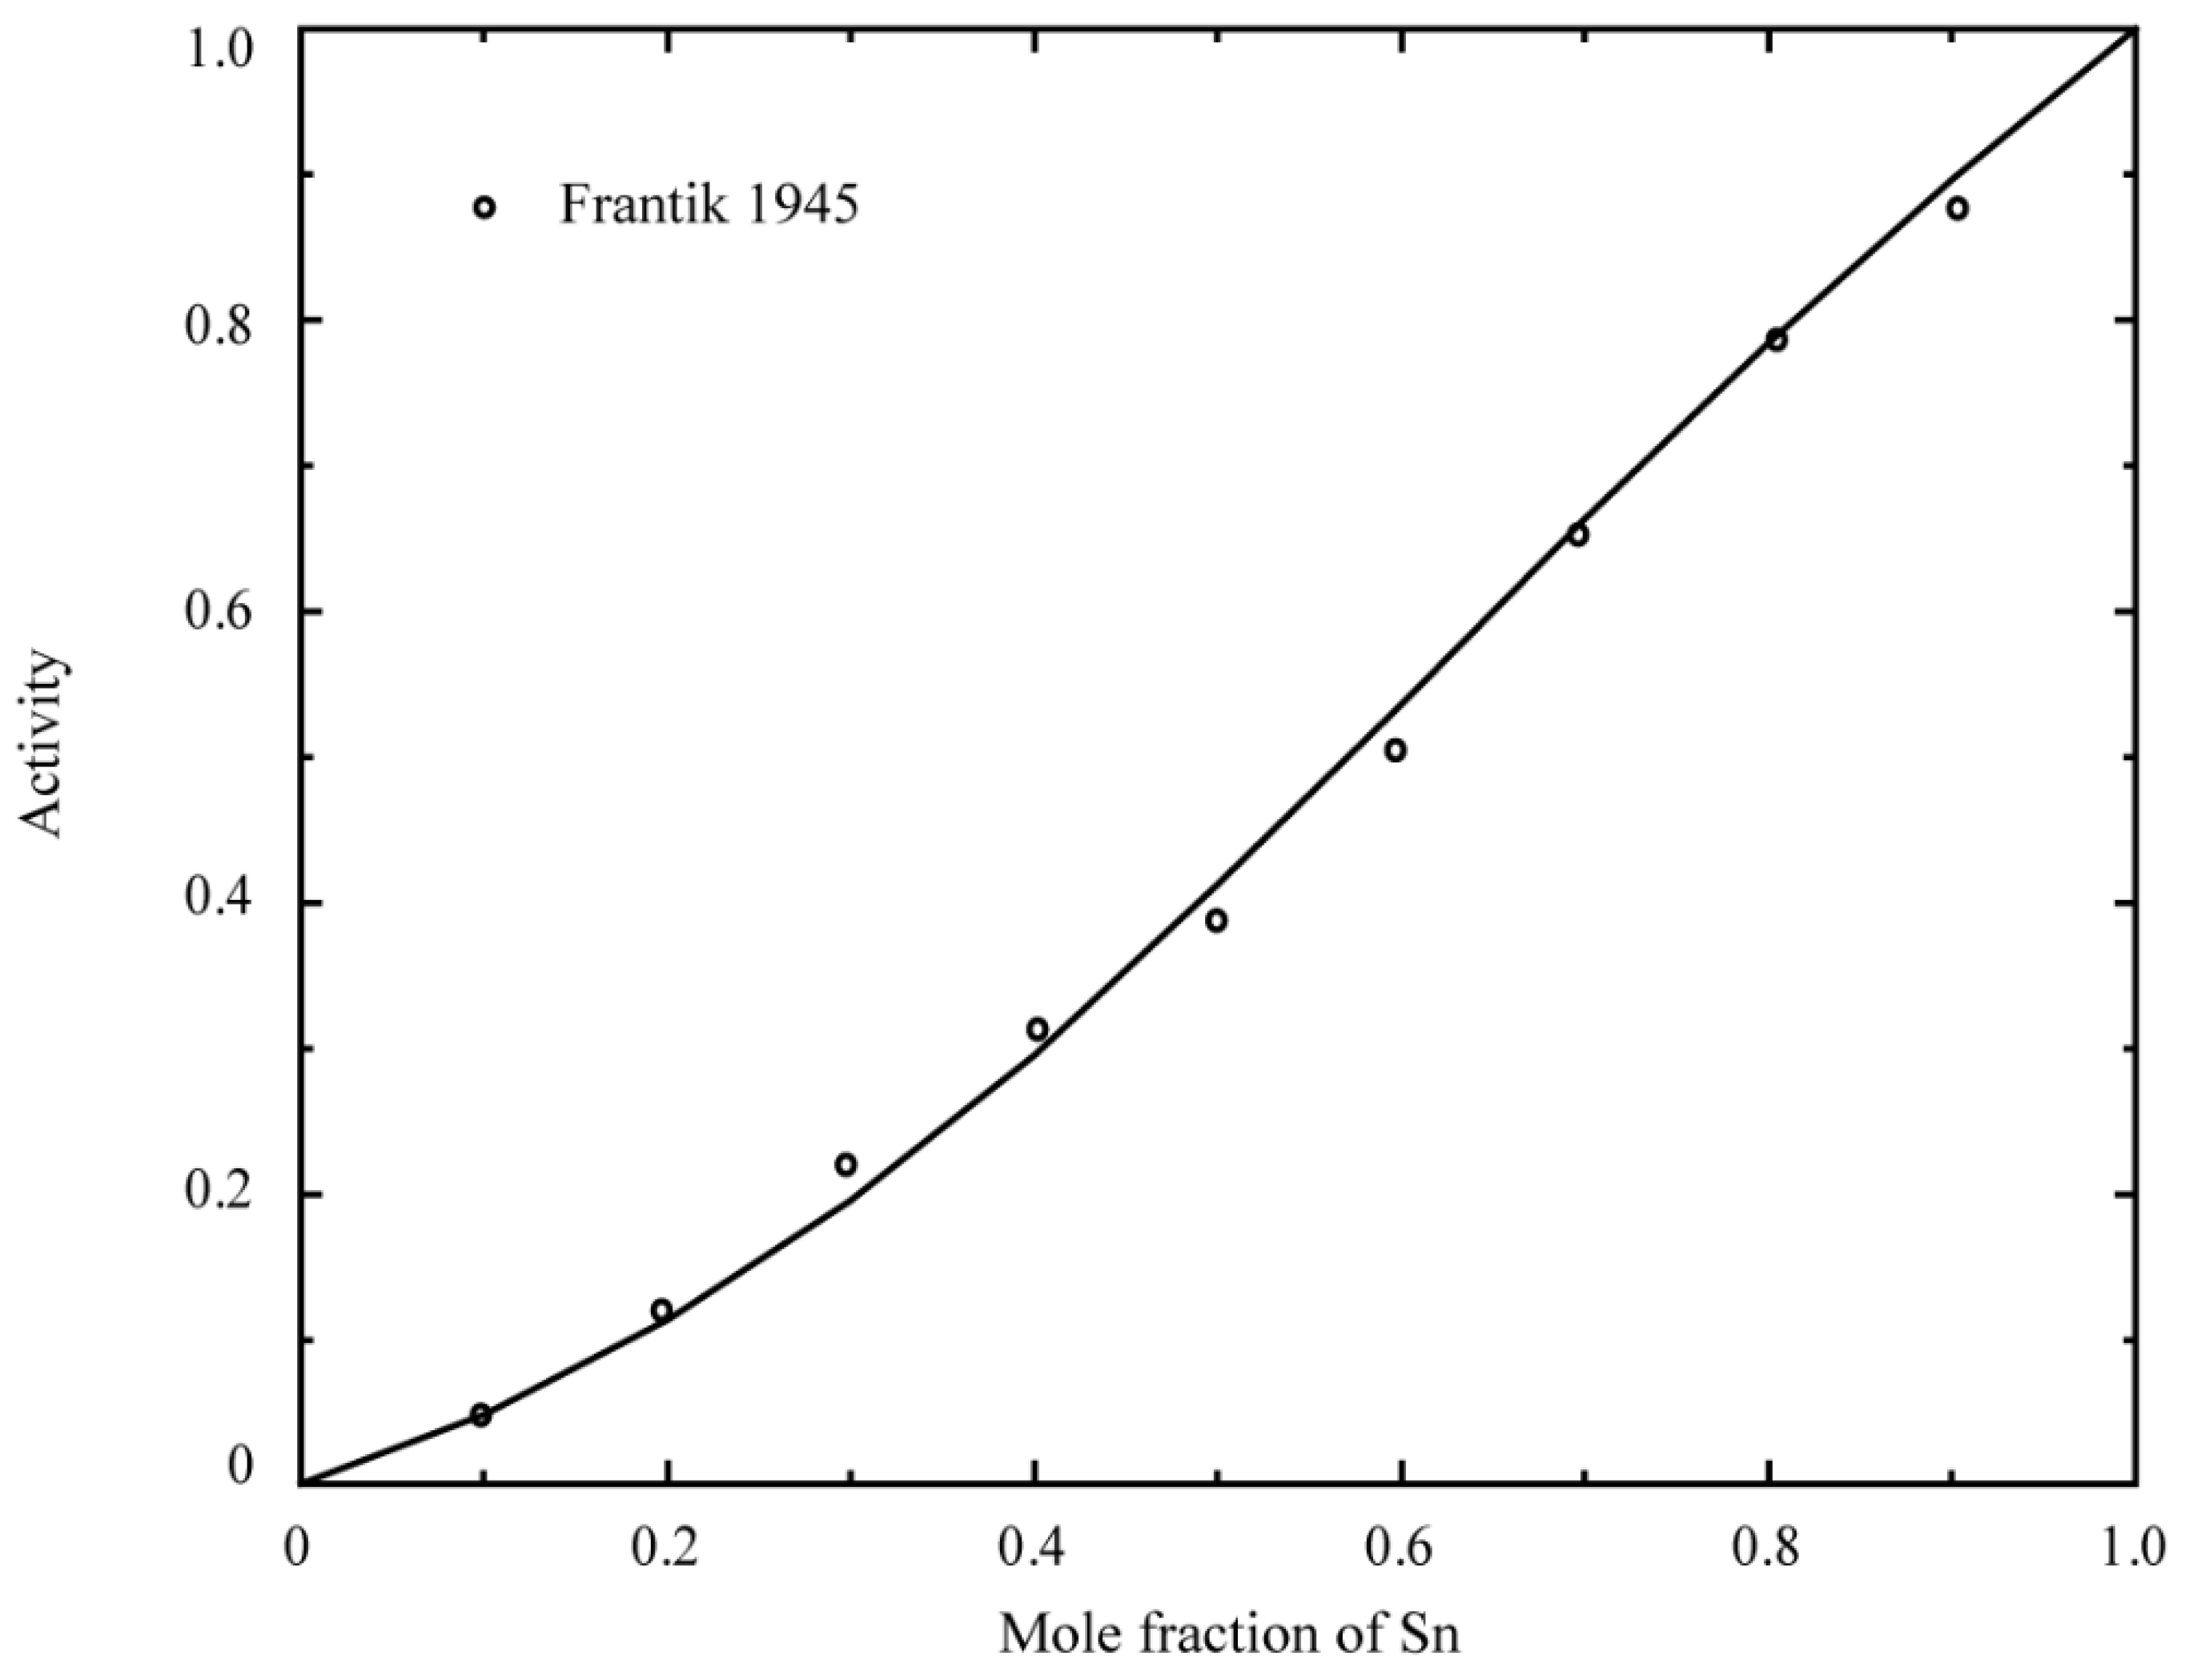
- Frantik, R.O.; McDonald, H.J. A Thermodynamic Study of the Tin-Antimony System. Trans. Electrochem. Soc. 1945, 88, 243–251. [Google Scholar] [CrossRef]
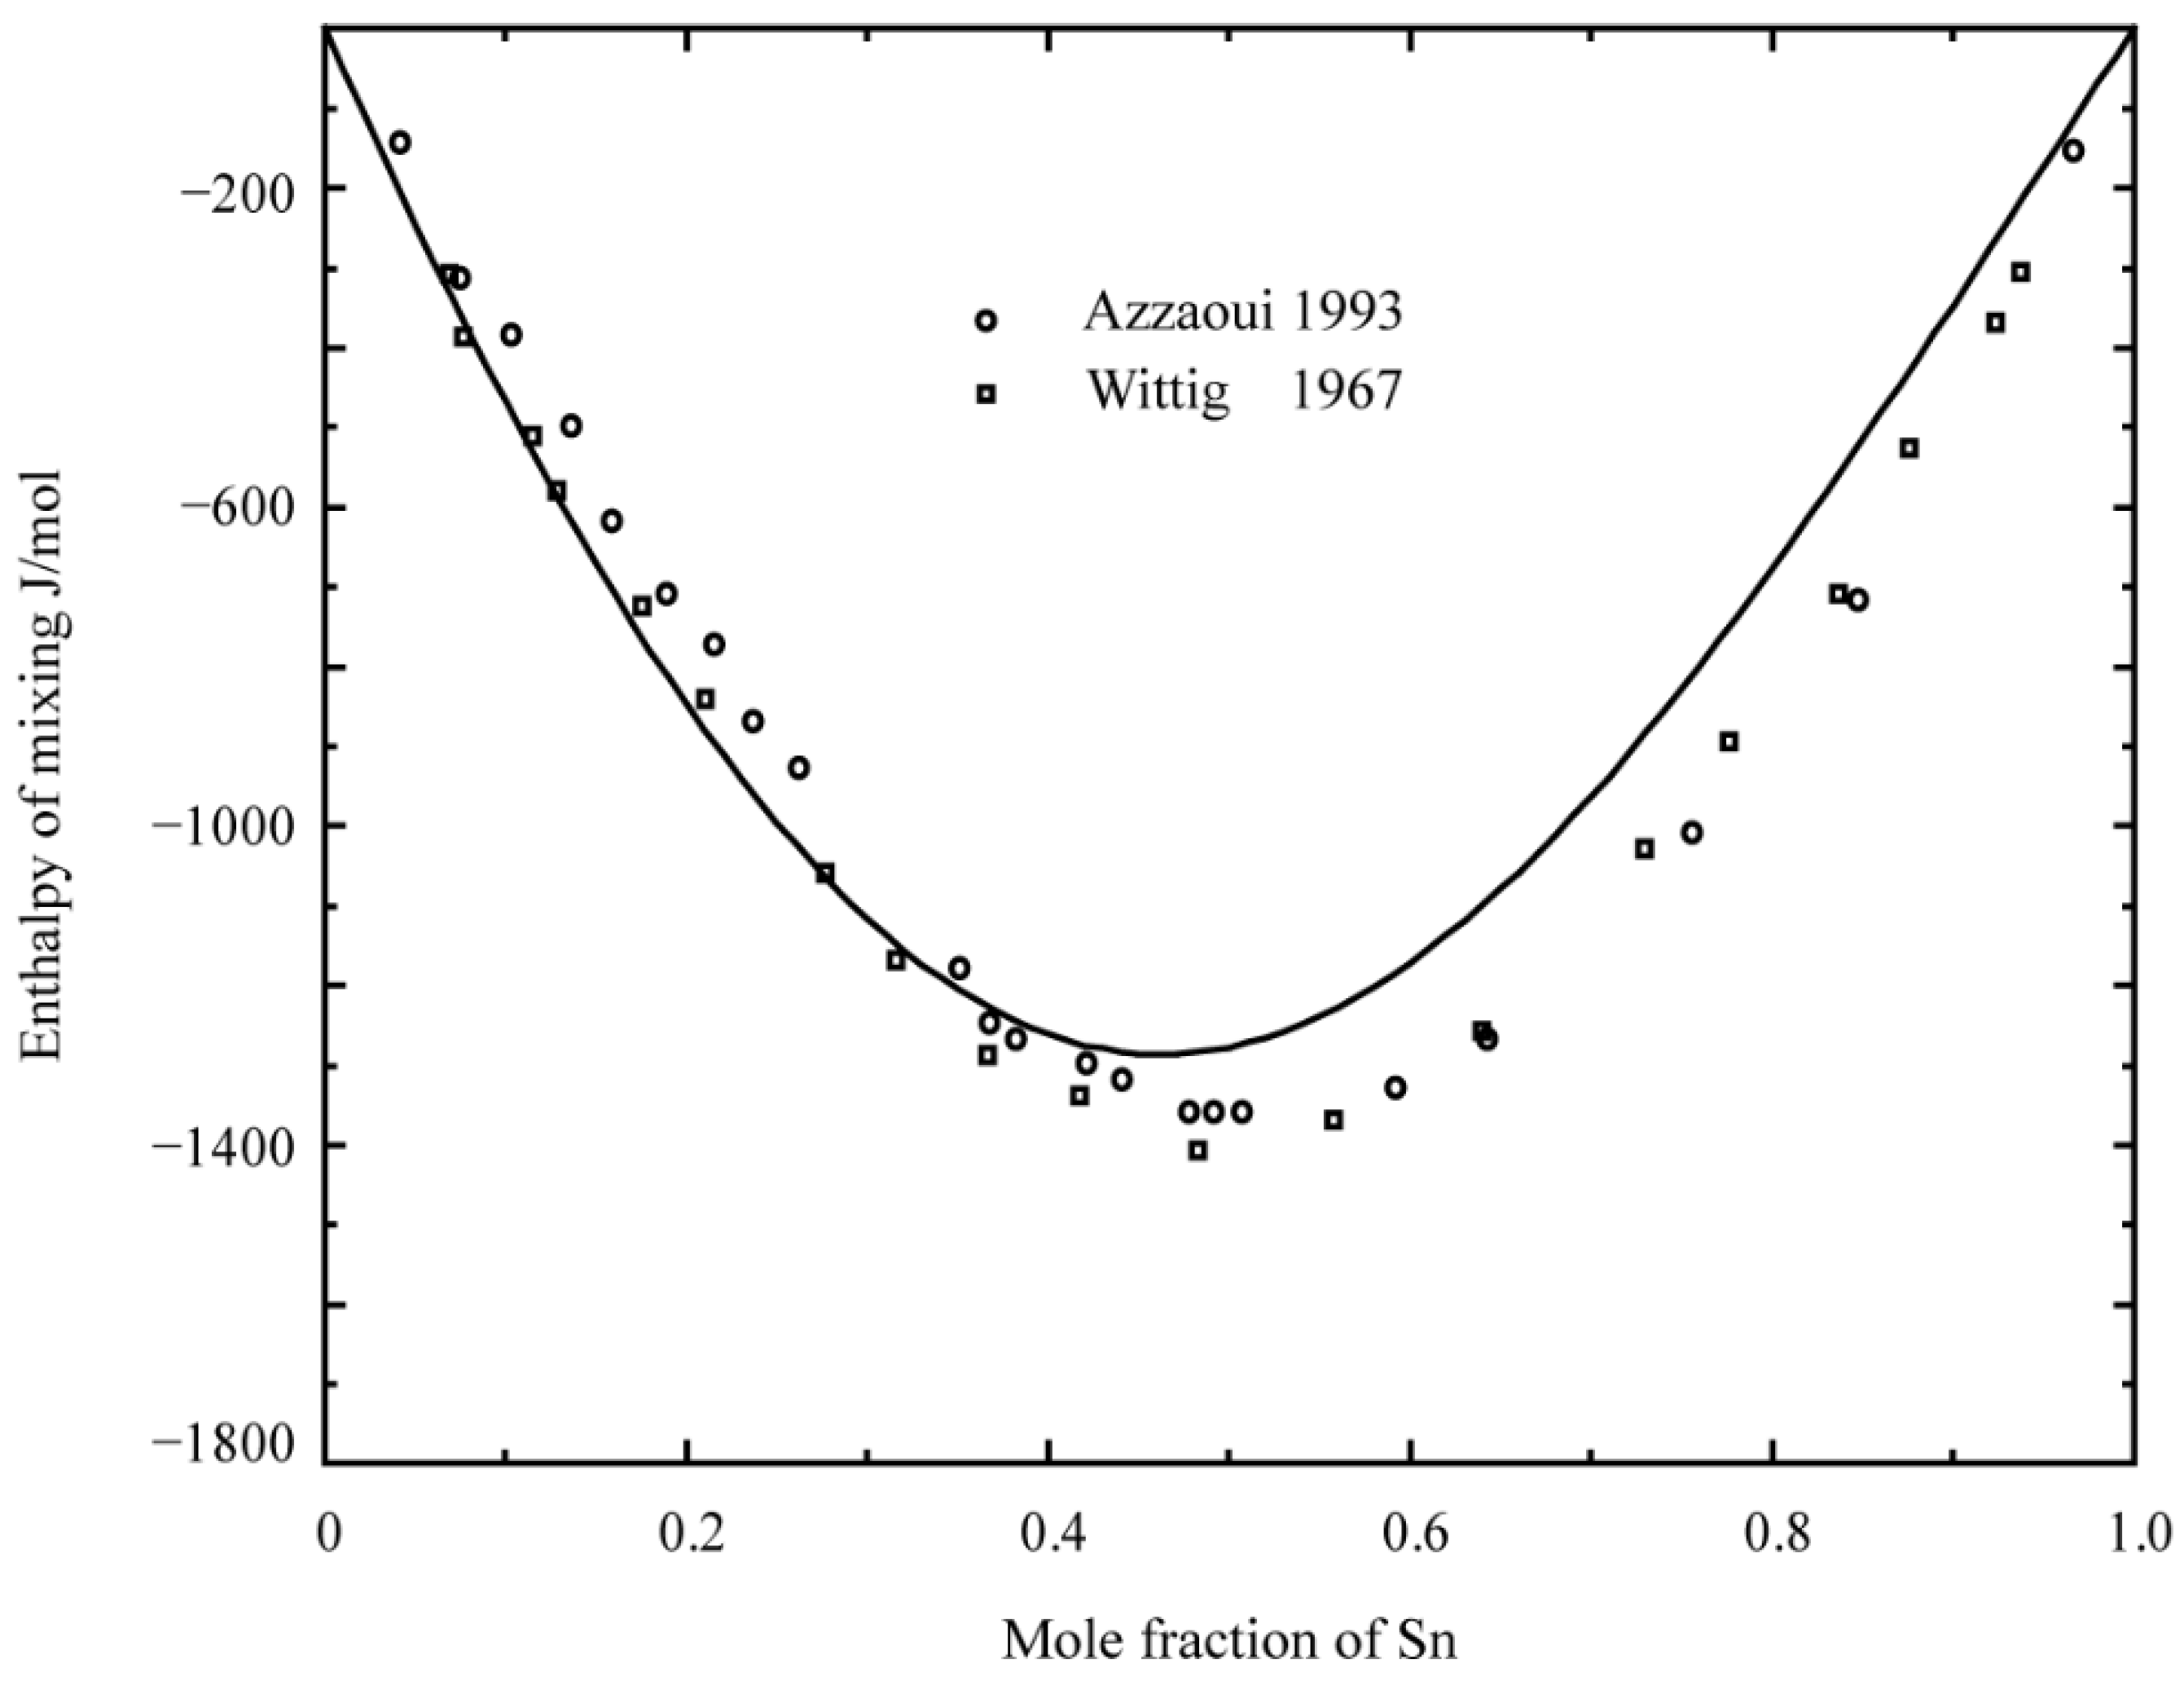
- Azzaoui, M.; Notin, M.; Hertz, J. Ternary Experimental Excess Functions by Means of High-order Polynomials: Enthalpy of Mixing of Liquid Pb-Sn-Sb Alloys. Int. J. Mater. Res. 1993, 84, 545–551. [Google Scholar] [CrossRef]
- Wittig, F.E.; Gehring, E. Die mischungswärmen des antimons mit bmetallen: III. die systeme mit zinn und blei. Ber. Bunsen-Ges 1967, 71, 372–376. [Google Scholar]


| Vertical Section | Sample Number | Elemental Composition (at.%) | ||
|---|---|---|---|---|
| Al | Sn | Sb | ||
| Al–SnSb | 1 | 5 | 47.5 | 47.5 |
| 2 | 10 | 45 | 45 | |
| 3 | 15 | 42.5 | 42.5 | |
| 4 | 20 | 40 | 40 | |
| 5 | 30 | 35 | 35 | |
| 6 | 35 | 32.5 | 32.5 | |
| 7 | 40 | 30 | 30 | |
| 8 | 45 | 27.5 | 27.5 | |
| 9 | 60 | 20 | 20 | |
| 10 | 70 | 15 | 15 | |
| 11 | 80 | 10 | 10 | |
| Sn–AlSb | 12 | 40 | 20 | 40 |
| 13 | 25 | 50 | 25 | |
| 14 | 15 | 70 | 15 | |
| Sb–AlSn | 15 | 40 | 40 | 20 |
| 16 | 30 | 30 | 40 | |
| 17 | 20 | 20 | 60 | |
| 18 | 15 | 15 | 70 | |
| 19 | 10 | 10 | 80 | |
| Vertical Section | Elemental Composition (X, Mole Fraction) | Transition Temperature (°C) | ||||
|---|---|---|---|---|---|---|
| Sn–AlSb | XAl | XSn | XSb | AlSb + L↔AlSb + BCT (I) | ||
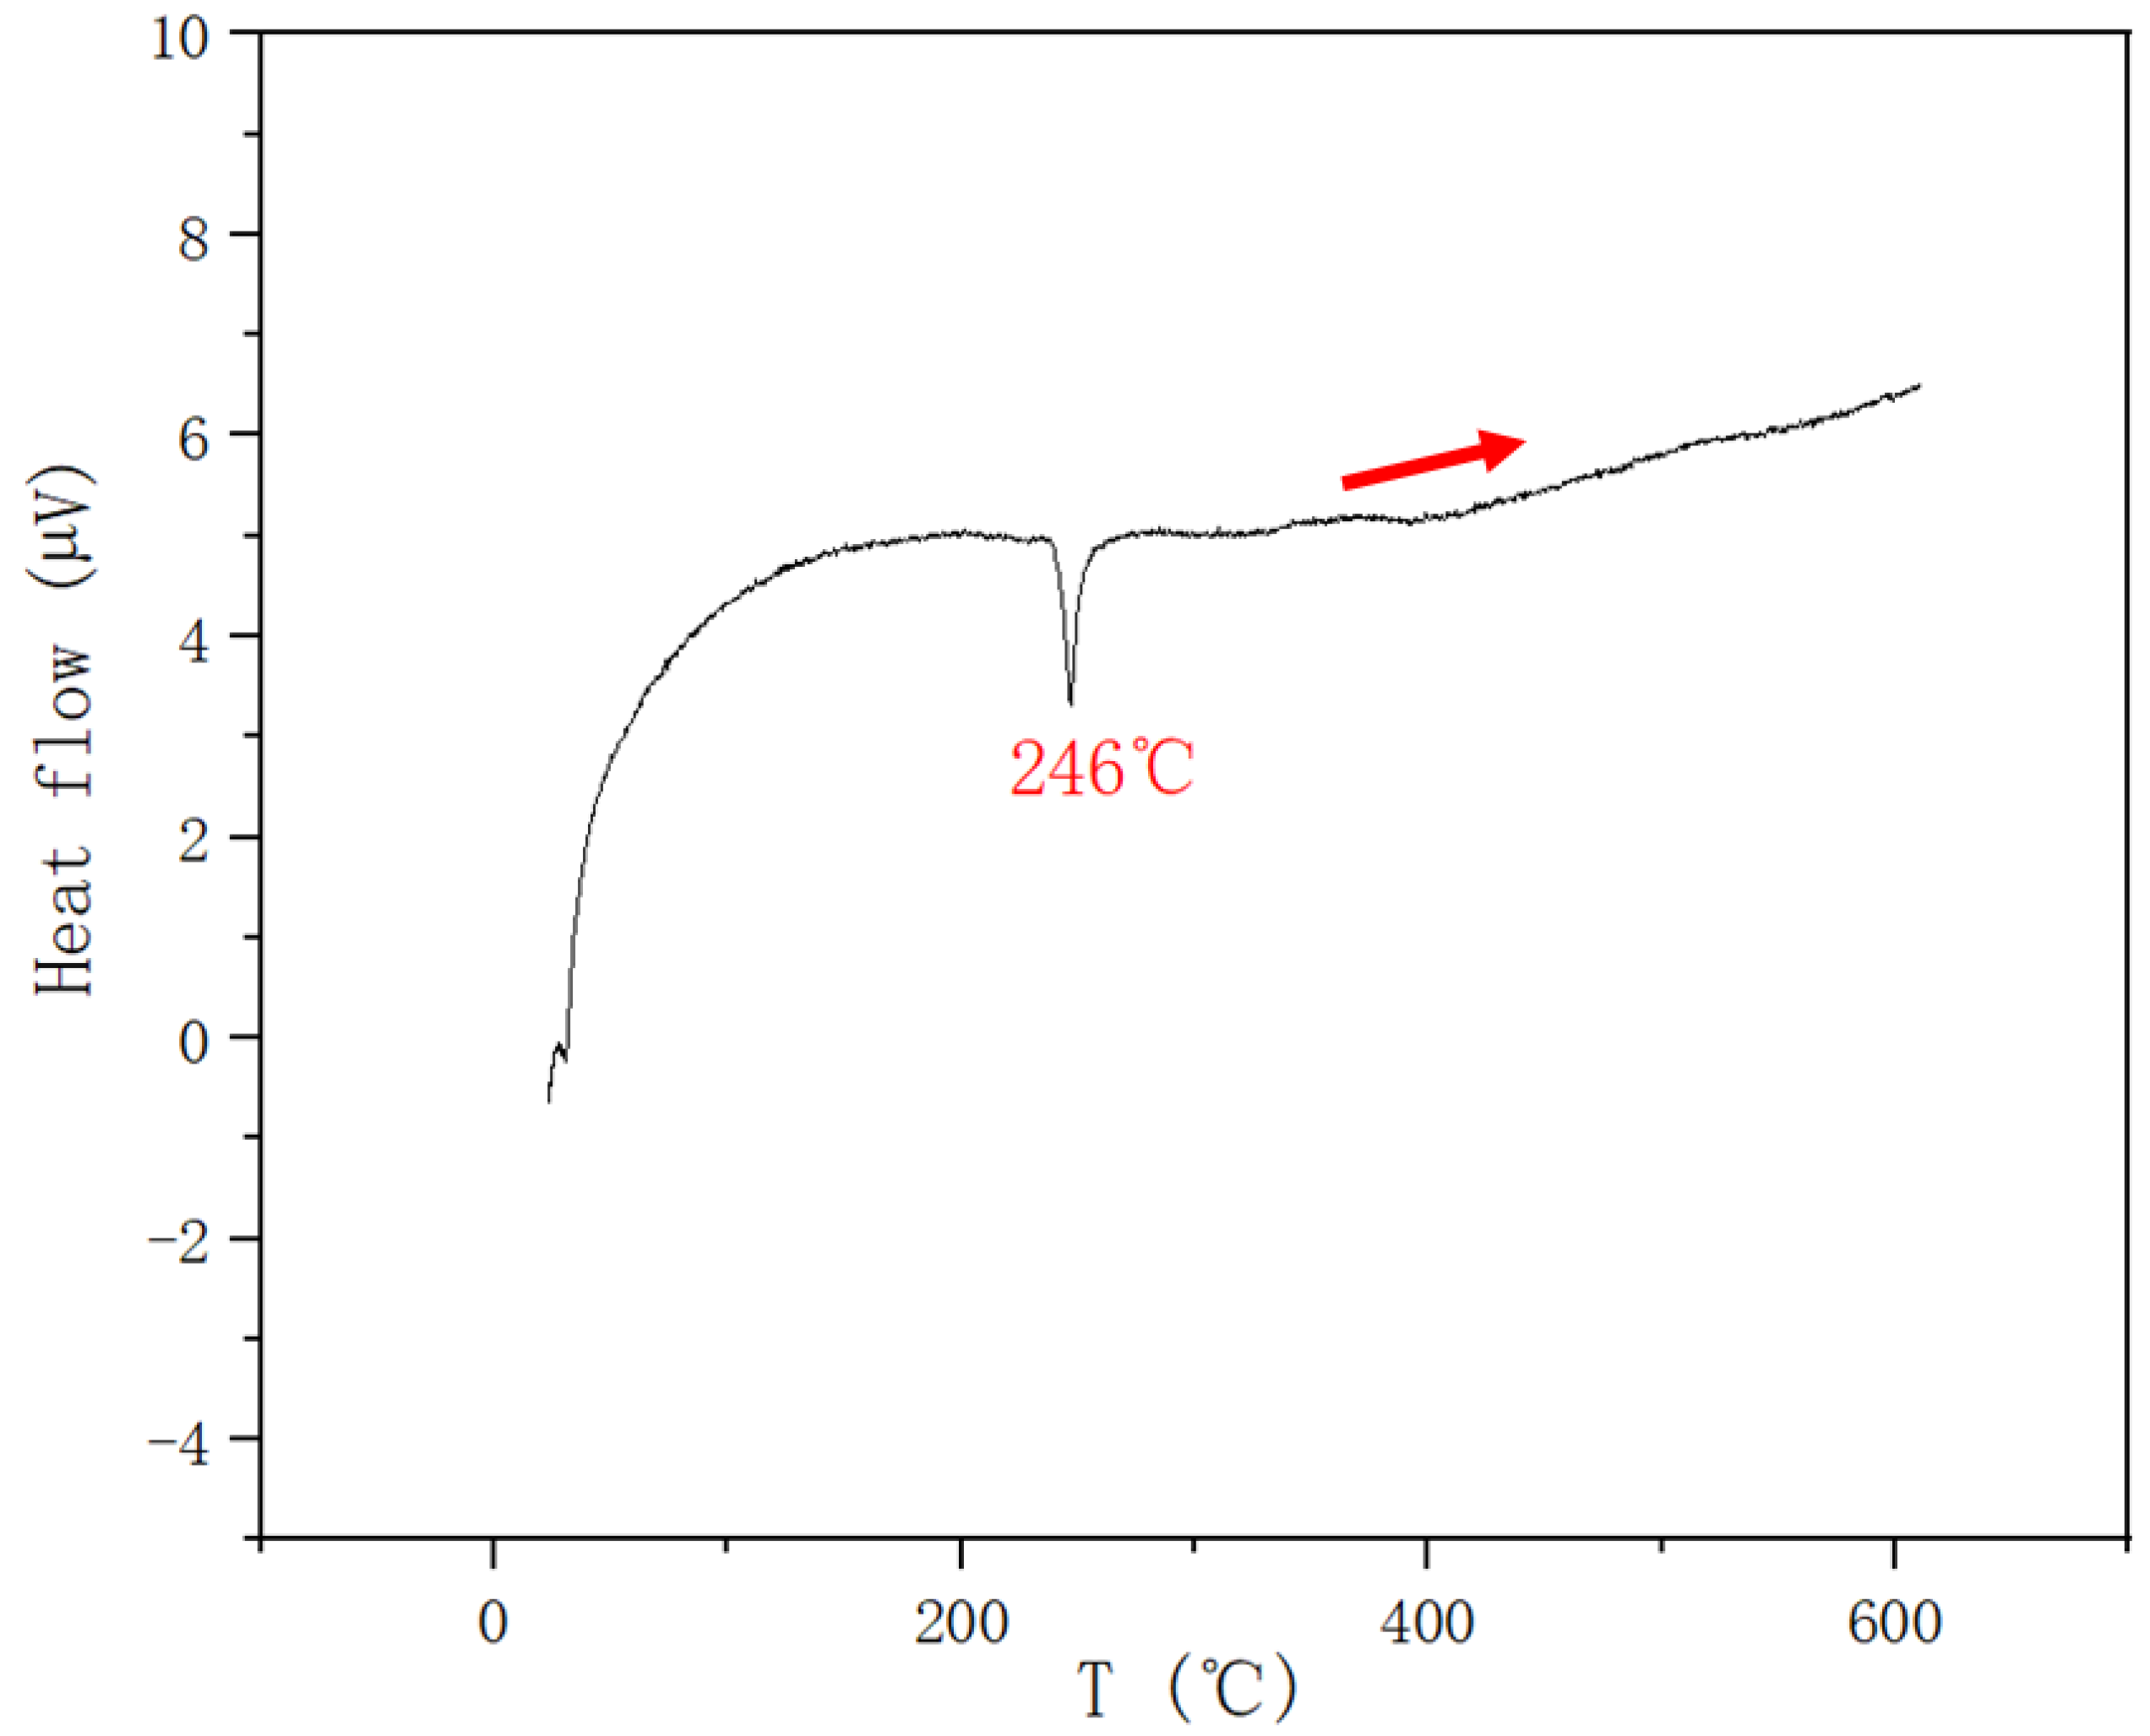
| 0.4 | 0.2 | 0.4 | 246 | |||
| 0.25 | 0.5 | 0.25 | 237 | |||
| 0.15 | 0.7 | 0.15 | 251 | |||
| Sb–AlSn | XAl | XSn | XSb | AlSb + L↔AlSb + L + Al (M) | AlSb + L + Al↔AlSb + Al + BCT (I) | |
| 0.4 | 0.4 | 0.2 | 530 | 233 | ||
| AlSb + L↔AlSb + L + SnSb (M) | AlSb + L + SnSb↔AlSb + L + Sn4Sb3 (I) | AlSb + L + Sn4Sb3↔AlSb + Sb3Sn4 + BCT (I) | ||||
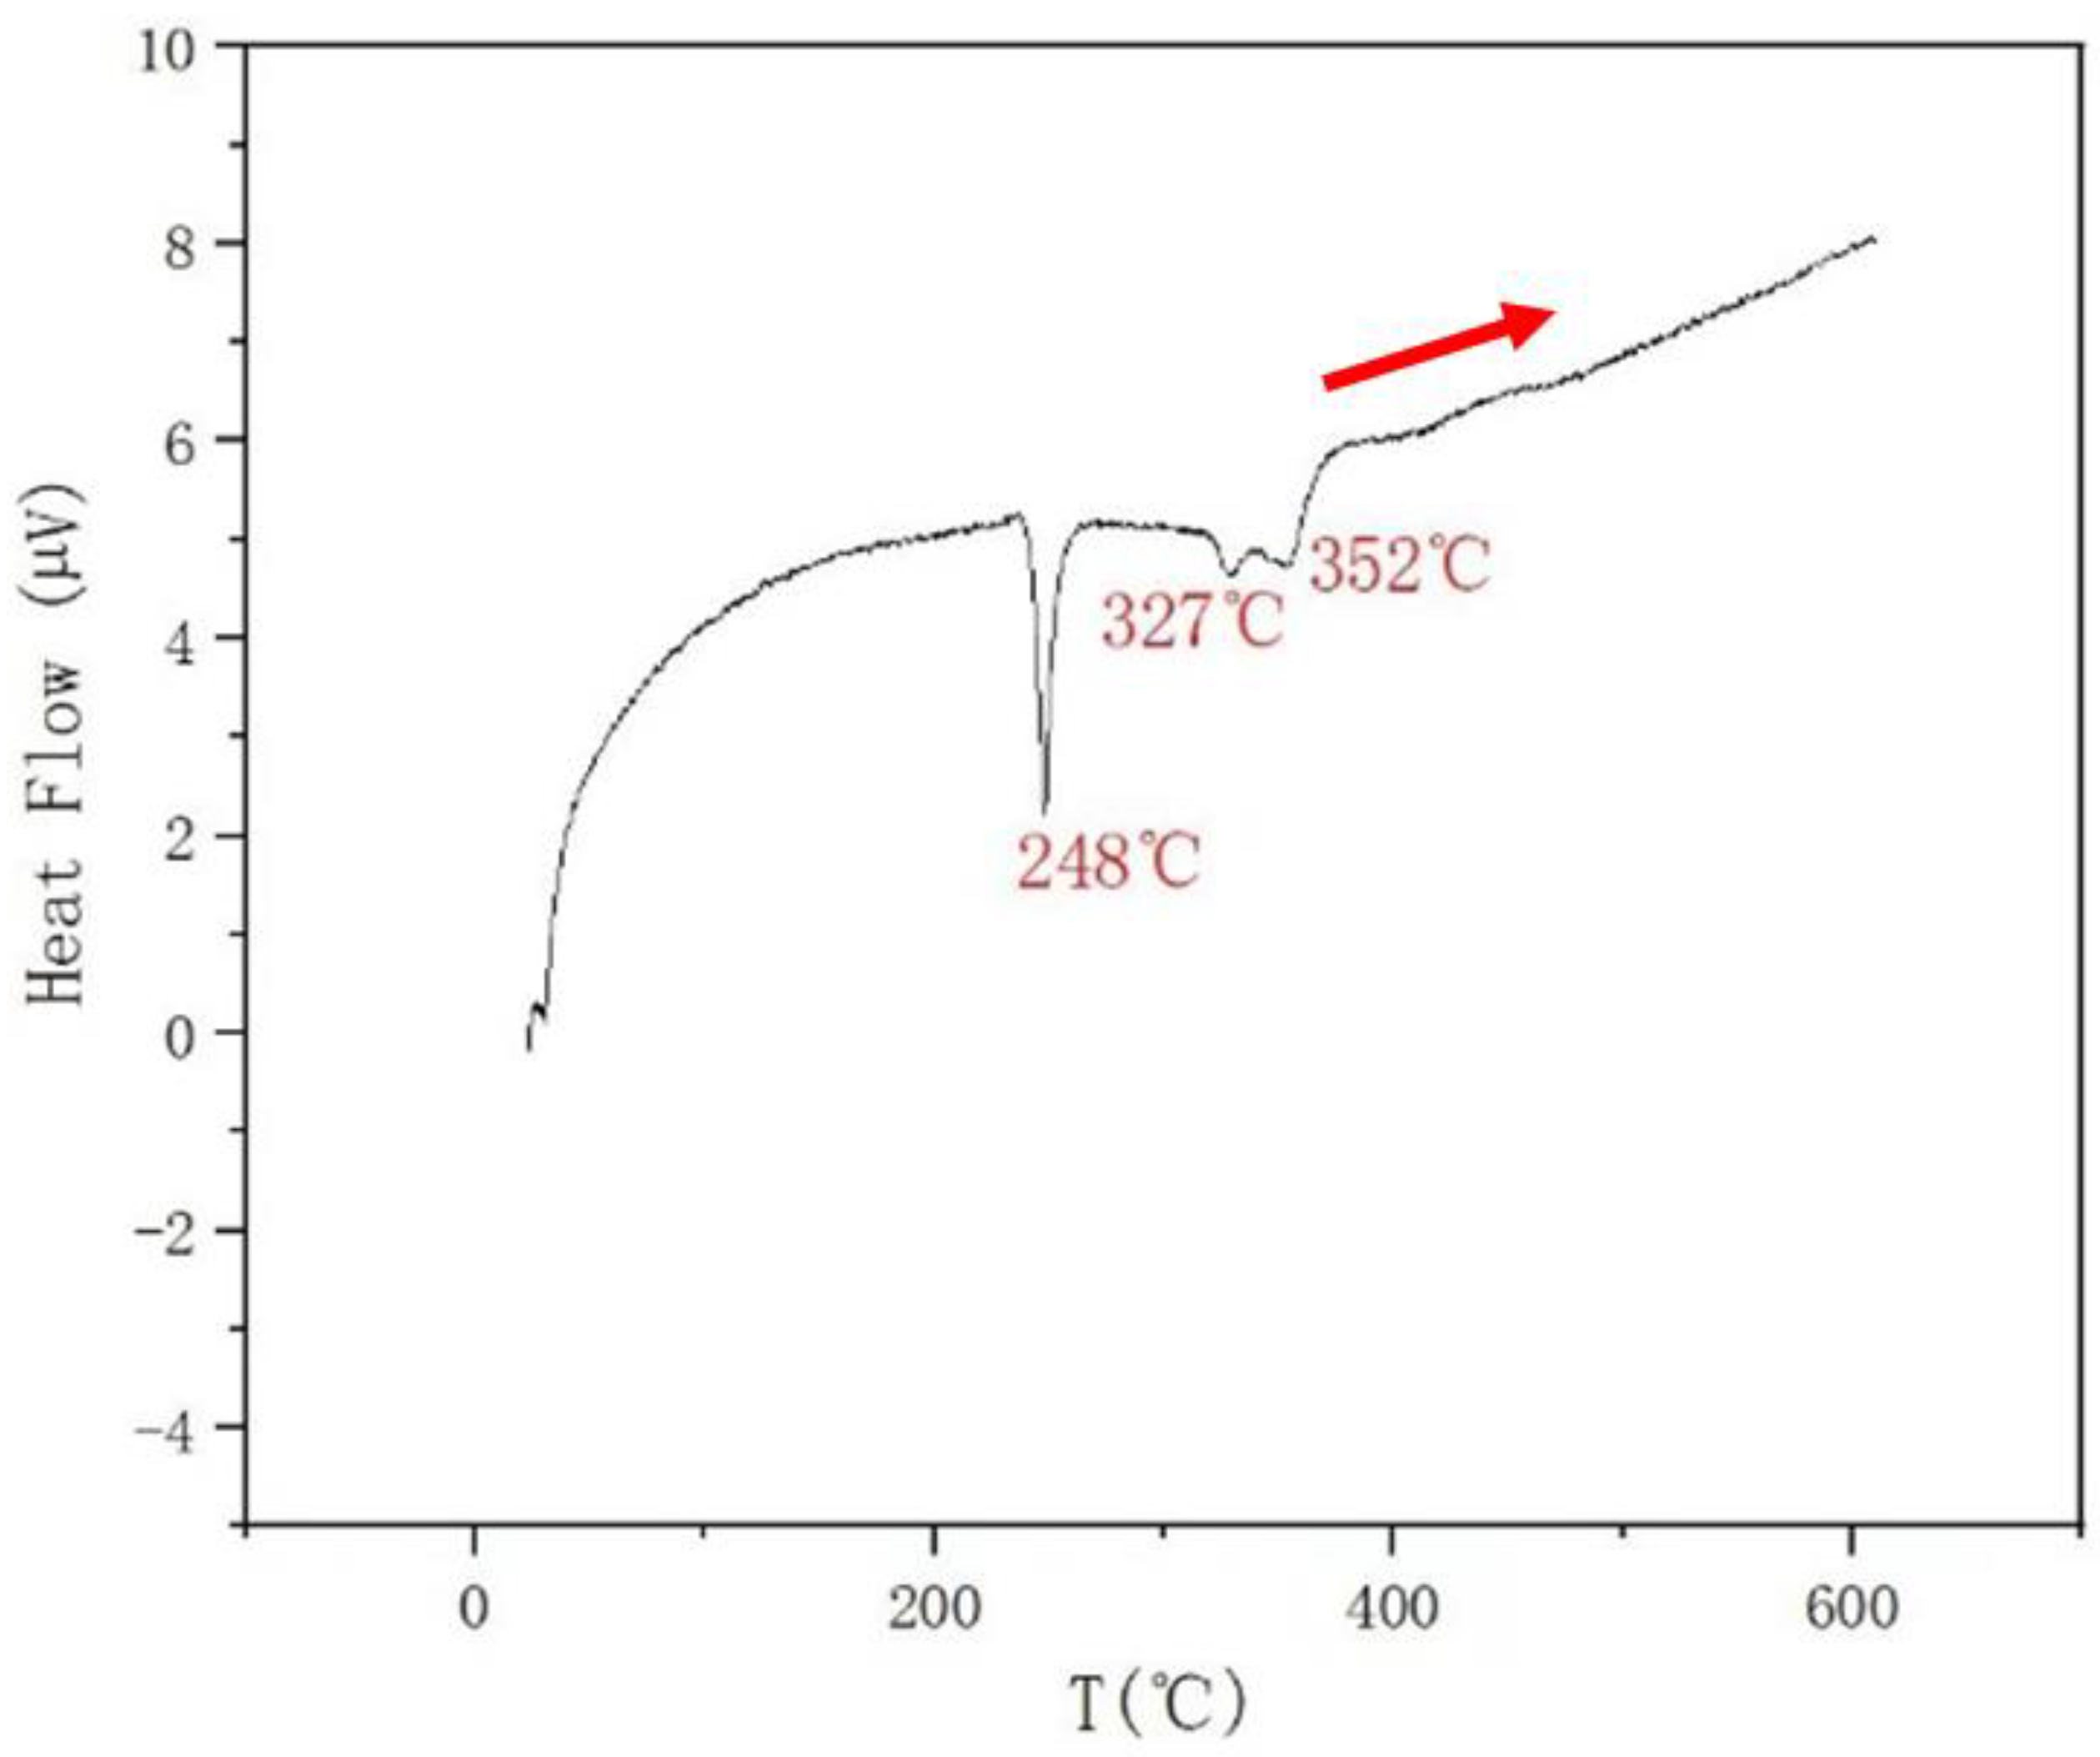
| 0.3 | 0.3 | 0.4 | 352 | 327 | 248 | |
| AlSb + L↔AlSb + RHOM + L (M) | AlSb + RHOM + L↔AlSb + SnSb + RHOM (I) | |||||
| 0.2 | 0.2 | 0.6 | 512 | 420 | ||
| 0.15 | 0.15 | 0.7 | 560 | 425 | ||
| 0.1 | 0.1 | 0.8 | 593 | 424 | ||
| Al–SbSn | XAl | XSn | XSb | AlSb + L↔AlSb + L + SnSb (M) | AlSb + L + SnSb↔AlSb + L + Sb3Sn4 (I) | AlSb + L + Sb3Sn4↔AlSb + Sb3Sn4 + BCT (I) |
| 0.05 | 0.475 | 0.475 | 422 | |||
| 0.1 | 0.45 | 0.45 | 403 | 327 | 244 | |
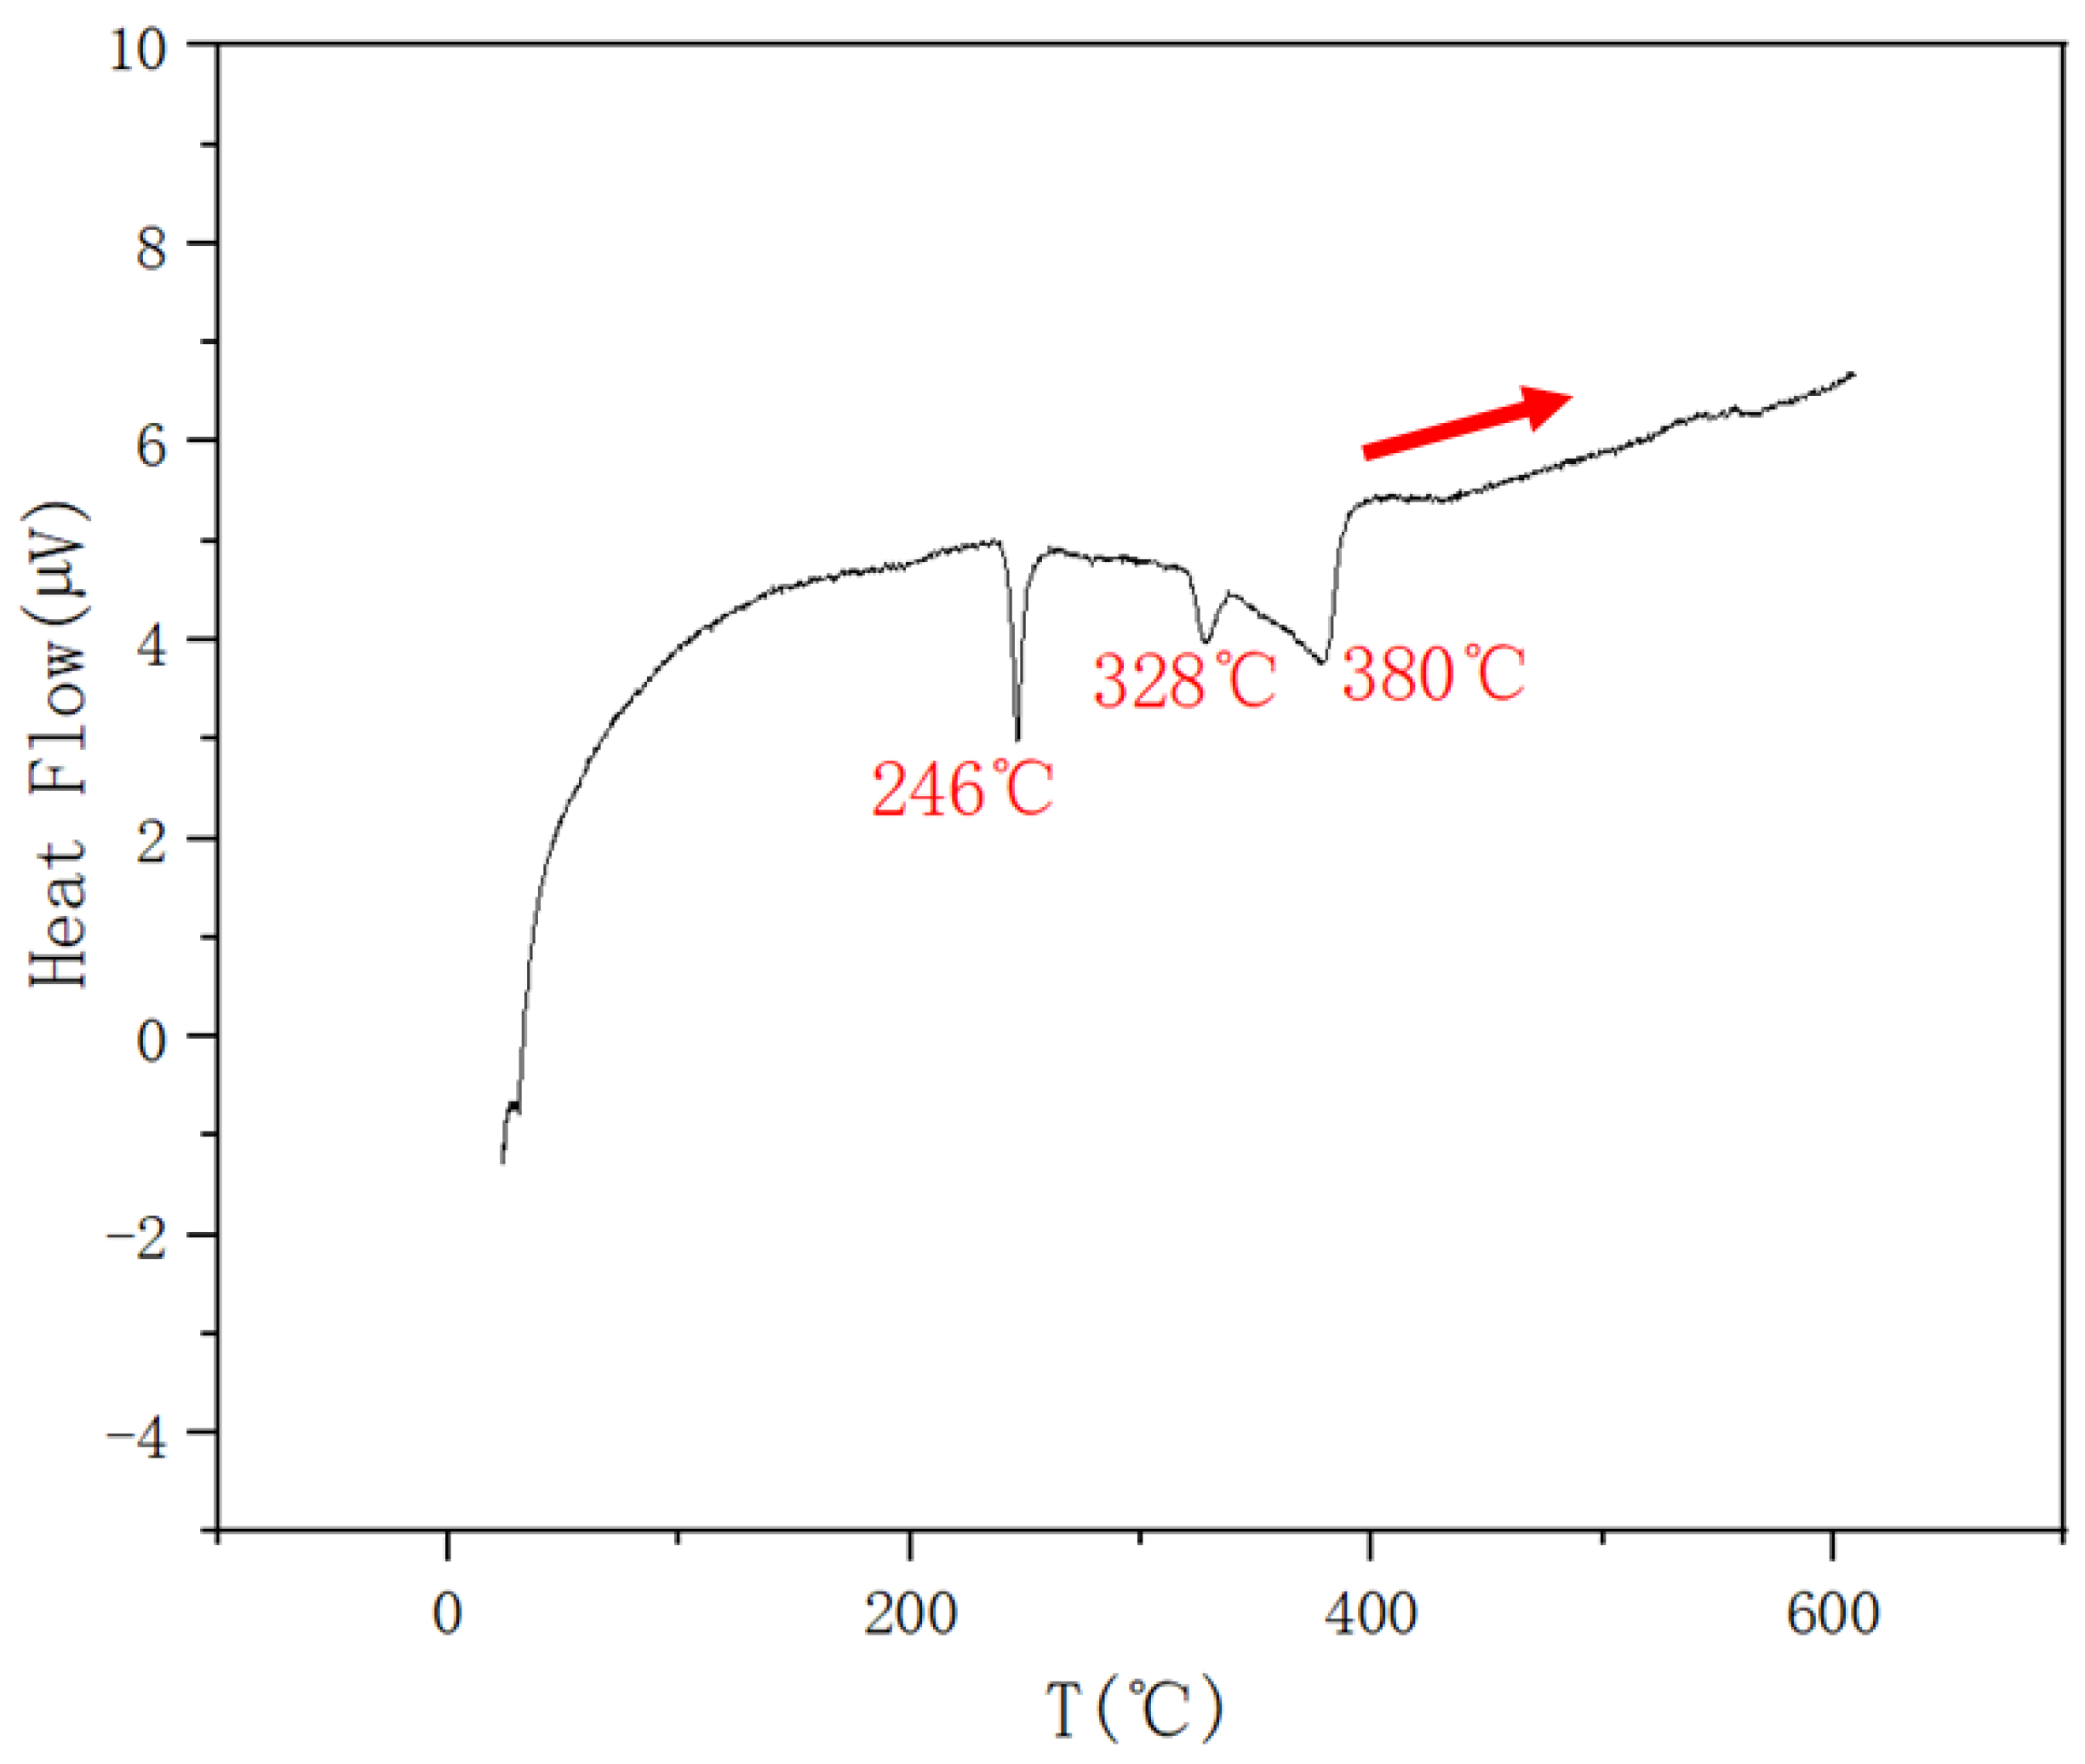
| 0.15 | 0.425 | 0.425 | 380 | 328 | 246 | |
| 0.2 | 0.4 | 0.4 | 379 | 326 | 246 | |
| AlSb + L↔AlSb + L+Sb3Sn4 (M) | AlSb + L + Sb3Sn4↔AlSb + Sb3Sn4 + BCT (I) | |||||
| 0.3 | 0.35 | 0.35 | 304 | 248 | ||
| AlSb + L↔AlSb + L + Al (M) | AlSb + L + Al↔AlSb + BCT + Al (I) | |||||
| 0.35 | 0.325 | 0.325 | 240 | |||
| 0.4 | 0.3 | 0.3 | 234 | |||
| 0.45 | 0.275 | 0.275 | 233 | |||
| 0.6 | 0.2 | 0.2 | 579 | 231 | ||
| 0.7 | 0.15 | 0.15 | 590 | 229 | ||
| 0.8 | 0.1 | 0.1 | 230 | |||
| Phase | Thermodynamic Parameters | Reference |
|---|---|---|
| Al-FCC_A1 | [40] | |
| Al-BCC_A2 | [40] | |
| Al-LIQUID | [40] | |
| Sb-BCT_A5 | [40] | |
| Sb-RHOMBO_A7 | [40] | |
| Sb-LIQUID | [40] | |
| Sn-BCT_A5 | [40] | |
| Sn-RHOMBO_A7 | [40] | |
| Sn-LIQUID | [40] | |
| Liquid (Al,Sb,Sn)(Va) | GAl:Va = GAl-LIQUID, GAl:Va = GAl-LIQUID, GAl:Va = GAl-LIQUID | [40] |
| [25] | ||
| [25] | ||
| [25] | ||
| [26] | ||
| [26] | ||
| [26] | ||
| This work | ||
| This work | ||
| This work | ||
| Bct (Al,Sb,Sn) | GAl =GAl-BCC_A2, GSb = GSb-BCT_A5, GSn = GSn-BCT_A5 | [40] |
| [26,27] | ||
| Rhombohedral (Sb,Sn) | GSb = GSb-RHOMBO_A7, GSn = GSn-RHOMBO_A7 | [27] |
| [27] | ||
| [27] | ||
| SnSb (Sn,Sb,Va)4(Sb)3 | [27] | |
| [27] | ||
| AlSb | [25] | |
| Sb3Sn4 | [27] | |
| T (°C) | Liquid Composition (X, Mole Fraction) | Reaction | ||
|---|---|---|---|---|
| XAl | XSn | XSb | ||
| 240.20 | 1.009 × 10⁻⁶ | 0.943 | 0.057 | Liquid + BctSb3Sn4 + AlSb |
| 425.38 | 2.372 × 10⁻⁴ | 0.476 | 0.524 | Liquid + SnSbRhombohedral + AlSb |
| 229.67 | 0.019 | 0.981 | 1.579 × 10⁻⁶ | LiquidAl + AlSb + Bct |
| 319.08 | 1.157 × 10⁻⁵ | 0.810 | 0.190 | Liquid + Sb3Sn4SnSb + AlSb |
Disclaimer/Publisher’s Note: The statements, opinions and data contained in all publications are solely those of the individual author(s) and contributor(s) and not of MDPI and/or the editor(s). MDPI and/or the editor(s) disclaim responsibility for any injury to people or property resulting from any ideas, methods, instructions or products referred to in the content. |
© 2023 by the authors. Licensee MDPI, Basel, Switzerland. This article is an open access article distributed under the terms and conditions of the Creative Commons Attribution (CC BY) license (https://creativecommons.org/licenses/by/4.0/).
Share and Cite
Wei, W.; Chen, W.; Wang, Y.; Cao, Z. DSC Investigation and Thermodynamic Modeling of the Al–Sb–Sn System. Metals 2023, 13, 1437. https://doi.org/10.3390/met13081437
Wei W, Chen W, Wang Y, Cao Z. DSC Investigation and Thermodynamic Modeling of the Al–Sb–Sn System. Metals. 2023; 13(8):1437. https://doi.org/10.3390/met13081437
Chicago/Turabian StyleWei, Wenjie, Wei Chen, Yaping Wang, and Zhanmin Cao. 2023. "DSC Investigation and Thermodynamic Modeling of the Al–Sb–Sn System" Metals 13, no. 8: 1437. https://doi.org/10.3390/met13081437