Abstract
The purpose of this study is to investigate the effects of semi-angle and platinum tube wall thicknesses on the first-step drawing process of platinum-clad nickel bars using finite element simulation. Three different semi-angles of die (3°, 5°, 7°) and three different platinum tube wall thicknesses (0.275 mm, 0.3 mm, 0.325 mm) were selected in the study. The effects of semi-angle and platinum tube wall thicknesses on drawing force, equivalent stress, cladding behavior and damage coefficients during the first-step drawing process were discussed in detail. The simulated results of cladding condition and damage obtained from Deform 3D V11 software are validated with experimental results, and it was found that the results were in good agreement. The results of this study may provide a reference for the practical production of platinum-clad nickel wires.
1. Introduction
Bimetallic wire is a new functional material that integrates two metals with different properties [1,2,3]. Using bimetallic wire, the respective properties of both metals may be exploited, leading to reductions in scarce-metal consumption and lower weights per unit length of wires, while usage requirements are maintained. Bimetallic wire is now widely used for communications, power cables, electromagnetic wires, signal transmission, and other purposes. Types of bimetallic wire currently used include copper-clad steel [4,5], copper-clad aluminum [6,7], aluminum-clad steel [8,9], silver-clad aluminum [10,11], silver-clad copper [12], gold-clad silver [13,14], palladium-clad copper [15,16], and platinum-clad nickel [17]. Platinum-clad nickel wire is used as electrodes, heating elements, leads, and coils for electronic devices, detection equipment, sensors, and similar products. A typical application of platinum-clad nickel wire is the lead material for thin-film platinum resistance temperature sensors, with a temperature measurement range of −70 °C~500 °C, a length of 10 mm, a platinum coating thickness of 5–8 μm, and a platinum content of 25–30%.
At present, platinum-clad nickel leads for thin-film platinum resistance temperature sensors are generally prepared by electroplating methods, which have the advantages of high production efficiency and controllable platinum layer thickness. However, the following problems exist: (1) The platinum layer is easily detached from the nickel core. This is because the platinum layer is not metallurgically bonded to the nickel core, and after repeated thermal shock, the platinum layer falls off from the nickel rod, reducing the service life. (2) The platinum layer is not dense. In high-temperature atmospheric environments, oxygen can easily penetrate the nickel core through the holes in the platinum layer, leading to oxidation of the nickel core and sensor failure. How to prepare a Pt/Ni composite wire with a dense platinum layer and a strong bond between the platinum layer and the nickel core is the key to improving the service life, stability and reliability of thin-film platinum resistance temperature sensors.
Preparation methods for bimetallic wires include rotary swaging-drawing cladding [18], extrusion cladding [19], continuous extrusion cladding [20], solid-phase rolling [21], core-filling continuous-casting cladding [22], hot-dipping cladding [23], electroplating [24], welding-drawing cladding [25], and assembling-drawing cladding. Since the platinum-clad nickel composite wires used for the lead material of thin-film platinum resistance temperature sensors have a ratio of cladding thickness to the core material radius of less than 1:10, they belong to the category of thin supertype laminated metal-matrix composite wires. In addition, the thickness of the platinum coating is required to be uniform and dense, without any leakage defects. For these reasons, cladding drawing is the most suitable method for the manufacture of platinum-clad nickel composite wires. The process is as follows: (1) raw material preparation: platinum tubes and nickel bars are prepared separately; (2) assembly: the platinum tubes and nickel bars are first cleaned with ultrasound to ensure that there are no impurities and that the platinum tubes and nickel bars are free from defects and other problems. Then, the nickel bar is inserted into the platinum tube and assembled into a composite billet; (3) head rolling: the platinum tube and nickel rod are rolled together at the aligned end using a head rolling machine to facilitate passage through the drawing die; (4) first-step drawing: the platinum-clad nickel composite billet is drawn using a linear drawing machine so that the platinum tube is tightly wrapped around the nickel bar; (5) vacuum annealed; (6) drawn and annealed. (7) product: the platinum-clad nickel wire is prepared by repeated drawing and annealing to meet the dimensional requirements.
In the process of assembly, in order to ensure that the nickel rod can be smoothly inserted into the platinum tube, the diameter of the nickel rod is at least 0.05 mm less than the inner diameter of the platinum tube; therefore, there is a gap between the platinum tube and the nickel bar without mechanical and metallurgical bonding, and the platinum tube and the nickel bar will produce relative sliding during the first-step drawing. Therefore, the first-step drawing is very critical, and if the drawing parameters are not chosen correctly, it is very easy to break the platinum tube and make the product obsolete.
The finite element method (FEM) is now widely used in the numerical simulation of drawing processes [26,27]. Shi et al. [28] performed finite element simulations to study the effect of semi-angle, deformation amount and friction coefficient on the drawing process of copper-clad aluminum wire, and they realized that the maximum stress decreased and then increased as the semi-angle increased and had a minimum value when the half cone angle is 12.5°. Due to the inconsistent metal flow of the composite billets, a large deformation could cause the rupture of the copper layer, and the deformation should be controlled to within 1.09. The friction coefficient has a very small effect on the stress value. Xiang et al. [29] presented FEM simulation on the drawing process of aluminum-clad steel composite bars prepared by the continuous extrusion cladding method and yielded similar conclusions that the optimum semi-angle is 7°, deformation should be controlled within 1.08, and the flow rate of the internal steel core needed to be lower than the flow rate of the external aluminum layer during the drawing process. Luan et al. [30] carried out numerical simulations of the high-speed drawing process of aluminum wires and found that reducing the semi-angle and increasing the length of the working zone were beneficial in reducing the equivalent force and improving the surface quality of the wire with an optimum half-die cone angle of 2°. Similarly, Hongjuan Li et al. [4] studied the drawing behavior of copper-clad steel using a half cone angle of 2–4°. As mentioned above, for single materials or composite materials with metallurgically bonded interfaces, both the semi-angle and the amount of deformation can have a significant effect on the equivalent stress and the surface quality of the wire. Nevertheless, there are virtually no reports on the numerical simulation of composite bars with gaps between cladding and core during the first-step drawing process.
The authors’ previous research [31] has used numerical simulation combined with the Taguchi method to study the effect of first-step drawing parameters (semi-angle of die α, friction coefficient between platinum tube and die μ1, friction coefficient between platinum tube and nickel rod μ2, outer diameter of the original platinum tube D) on the deformation behavior of platinum-clad nickel bar; the results showed that both the semi-angle of the drawing die and the thickness of the original platinum tube wall have a great influence on deformation behavior, and the optimal parameters’ combination is D = 7.55 mm, α = 3°, μ1 = 0.2 and μ2 = 0.3. However, the influence of these two parameters on the behavior of first-step drawing is not clearly understood.
The purpose of this study is to systematically investigate how the original platinum tube wall thicknesses and semi-angles of the die effect drawing force, equivalent stress, cladding behavior, and damage to the platinum-clad nickel bar during the first-step drawing process by the finite element method. With this work, the high-quality platinum-clad nickel rods can be prepared more easily by choosing the appropriate process parameters of first-step drawing, which provide the basis for the preparation of high-quality composite wires.
2. Materials and Methods
In our actual production process, in order to prepare a platinum-clad nickel composite wire with a diameter of 0.2 mm and a platinum layer thickness of 8 µm, we chose the following parameters for the first-step drawing process: the diameter of the nickel rod (Dn) being 6.95 mm, the inner diameter of the platinum tube (Di) being 7.00 mm, and the outer diameter (Do) of that being 7.6 mm. After inserting the nickel rod into the platinum tube, they pass through the drawing die together, which has a calibrating strap diameter(Dc) of 7.5 mm and a semi-angle of 5°; then, the platinum-clad nickel rod with an outer diameter (D)of 7.5 mm is obtained by drawing. Therefore, in this work, the parameters used for our simulations were set around the process parameters in actual production.
Geometrical Model
The first-step drawing processes for platinum-clad nickel were carried out by Deform-3D V11 (Scientific Forming Technologies Corporation, Columbus, OH, USA). A schematic diagram of the first-step drawing is shown in Figure 1. The forming conditions and material-related data required for the simulation are shown in Table 1. The diameter of the nickel bar (Dn) = 6.95 mm, and its length = 60 mm with effective deformation length of 40 mm. The inner diameter of the platinum tube (Di) = 7.00 mm, the outer diameter (Do) = 7.55–7.65 mm (the original platinum tube wall thickness (T) = 0.275–0.325 mm), and its length was 50 mm with an effective deformation length of 30 mm. The position of the drawing die was fixed. The drawing die with calibrating strap diameter (Dc) = 7.50 mm, calibrating strap length () = 3 mm and semi-angle of the die () = 3–7° were modeled. The platinum tube and nickel bar were drawn together at a constant speed (ν) of 5 mm/s. The FEM simulation conditions were as follows: (a) The nickel bar and platinum tube were defined as plastic type, and drawing die was defined as rigid. (b) In order to prevent the platinum tube and nickel bar bonding interface from being contaminated, no lubricant was used so that there was dry friction between the platinum tube and the die and between the platinum tube and the nickel bar, with assumed friction coefficients of 0.2 and 0.3, respectively. (c) The nickel bars and platinum tubes were discretized into 50,000 and 80,000 tetrahedral elements, respectively. (d) The International System of Units and the Lagrangian incremental simulation type were used. (e) Step increment was 0.04 mm/step. (f) Environment temperature was 20 °C. (g) Sparse solver, Newton–Raphson iteration method and relative interference depth were chosen. (h) The relationship between stain and stress is expressed as follows:
where is flow stress, is hardening modulus coefficient, is equivalent plastic strain, is strain exponent, and is static yield stress. The parameter value of platinum and nickel are present in Table 2.
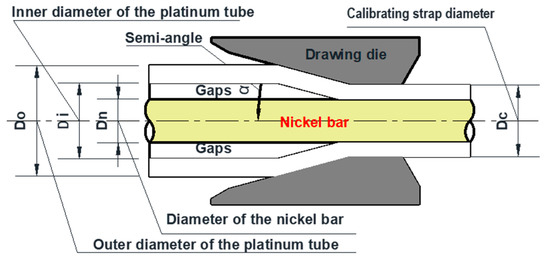
Figure 1.
Schematic diagram of first-step drawing.

Table 1.
Material conditions and forming conditions.
Table 2.
The parameter value of platinum and nickel [32,33].
The design of the simulation experiment is shown in Table 3.
Table 3.
The design of the simulation experiment.
The assumptions involved in our model:
- (1)
- The drawing dies were assumed to be rigid materials, and platinum tube and nickel bar were assumed to be plastic materials.
- (2)
- Platinum tube and nickel bar were assumed to be axisymmetric and did not have any defects. One quarter of the cross-section of the platinum tube, nickel bar and drawing die are selected to build the model for analysis.
- (3)
- The materials follow an isotropic hardening flow rule.
- (4)
- The drawing die is simplified into four areas: lubrication cone, work cone, calibrating strap and exit cone.
3. Simulation Results and Analysis
3.1. The Effect of α and T on Drawing Load
Figure 2 shows the variation in the drawing load for Simulation Experiment 3 (T = 7.65 mm, α = 3°). It can be seen that, as the composite bar passes through the die, the drawing load gradually and linearly increases. After the head of the composite bar has passed completely through the calibrating strap, the drawing load then oscillates up and down within a certain range. Finally, as the tail of the platinum tube gradually leaves the die, the drawing force gradually decreases until the drawing is completed and a zero value is recorded.
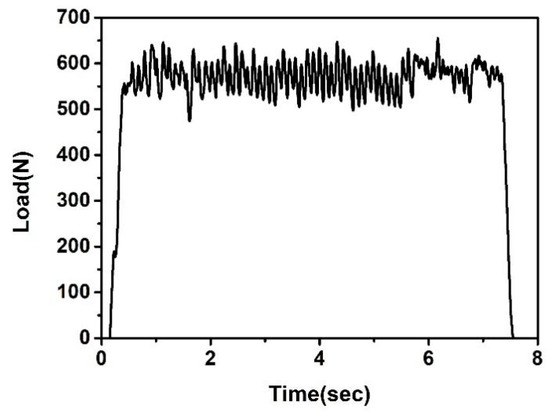
Figure 2.
Variation in the drawing load for Simulation Experiment 3.
Figure 3 shows variations in the average drawing load with increasing semi-angles of the die. It can be seen that the drawing load tends to decrease with the increase in semi-angle of the die, but differences in reduction amplitudes are also evident. For example, the average drawing load in Experiment 3 (T = 0.325 mm, α = 3°) was 560 N. In Simulation Experiment 6 (T = 0.325 mm, α = 5°), this quickly decreased to 426 N, i.e., a decrease of 24%. As the semi-angle of the die increased further, the drawing load also continued to decrease, but to a greatly reduced degree. When the wall thickness of the platinum tube is 0.275 mm and 0.3 mm, the change value of the drawing force is very small, or remains unchanged.
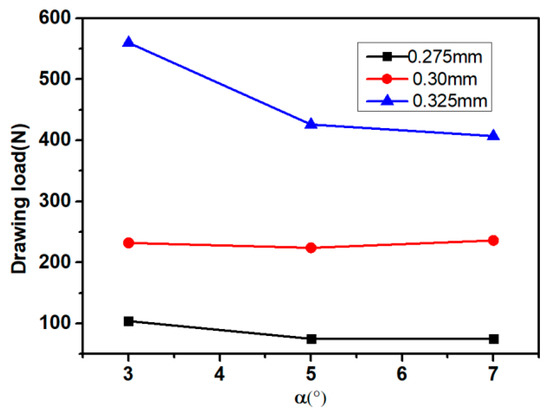
Figure 3.
Variations in drawing load with α.
During the first step drawing, the deformation zone of the platinum-clad nickel composite bar consists of three parts: a diameter reducing zone; a wall thickness reducing zone; and a calibrating zone, as shown in Figure 4. The diameter reducing zone is the zone from the contact between the outer wall of the platinum tube and the work zone of the die to the contact between the inner wall of the platinum tube and the nickel bar; the outer diameter of the platinum tube decreases, while the wall thickness remains unchanged or slightly increases. The wall thickness reduction zone is the zone from the contact between the inner wall of the platinum tube and the nickel bar to the inlet of the calibrating strap, where the platinum tube wall thickness decreases. The calibrating zone is the zone from the inlet to the outlet of the calibrating strap, whose function is to control the final diameter and surface quality of the composite bar. Under the same deformation amount (same platinum tube wall thickness), the smaller the semi-angle, the larger the contact area between the platinum tube and the work zone, increasing the friction time between the platinum tube and the work zone, thereby increasing the friction force and leading to an increase in drawing force. Conversely, the drawing force decreases. Under the same platinum tube wall thickness conditions, the larger the semi-angle, the smaller the contact area between the platinum tube and the working area, and the shorter the friction time between the platinum tube and the working area, thereby reducing the friction force and leading to a decrease in drawing force. When the wall thickness of the platinum tube is thin, the change in the semi- angle of the die has little effect on the contact area between the platinum tube and the working area. This is the reason why the drawing force changed very little or even remains unchanged with semi-angle when T = 0.275 and 0.3 mm, as shown in Figure 3.
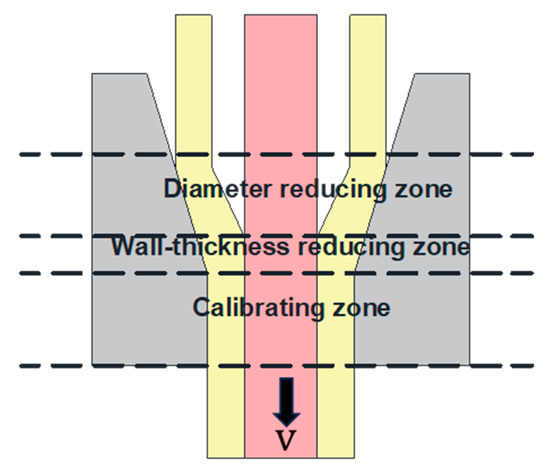
Figure 4.
Schematic diagram of the deformation zone.
Figure 5 shows variations in the drawing load with platinum tube wall thickness. It can be seen that the drawing force gradually increases as the platinum tube wall thickness increases, given the same semi-angle of the die. For example, the average drawing load for Simulation Experiment 4 (T = 0.275 mm, α = 5°) was 74 N. In Simulation Experiment 5 (T = 0.3 mm, α = 5°), this quickly increased to 224 N, i.e., an increase of 200%. The thicker the platinum tube wall, the greater the increase in drawing load. The increase in drawing load can be attributed to the following facts: (1) Under the same semi-angle condition, the thicker the platinum tube wall thickness, the larger the contact area between the platinum tube and the work zone, increasing the friction time between the platinum tube and the work zone, thereby increasing the friction force and leading to an increase in drawing force. (2) The thicker the wall thickness of the platinum tube, the greater the reduction in the platinum tube wall thickness, and the greater the deformation resistance, resulting in a greater drawing load.
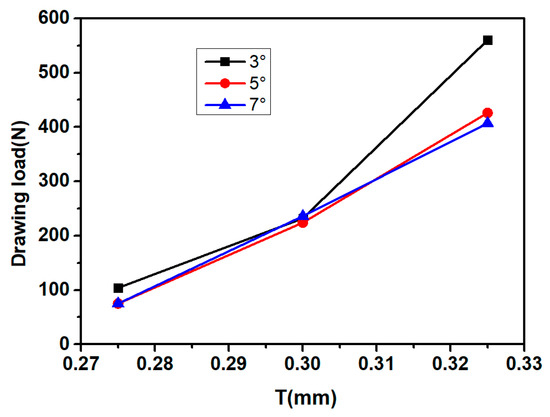
Figure 5.
Variations in drawing force with T.
3.2. The Effect of α and T on Equivalent Stress
Figure 6 shows variations in average equivalent stress on a platinum tube with different semi-angles. It can be seen that when the wall thickness of the platinum tube remains the same, the average equivalent stress on the platinum tube increases linearly with increases in the semi-angle. The increase in equivalent stress can be attributed to the fact that the larger the semi-angle, the shorter the deformation time of the platinum tube in the diameter reducing zone and the more intense the plastic deformation in the wall-thickness reducing zone, which leads to an increase in the equivalent stress. It is also observed that the increase is not significant; for example, the average equivalent stress of Simulation Experiment 1 (T = 0.275 mm, α = 3°) is 141 MPa, while that of Simulation Experiment 3 (T = 0.275 mm, α = 3°) is 149 MPa with an increase of only 5.6%. It is suggested that the semi-angle of the die has little effect upon the equivalent stress on the platinum tube.
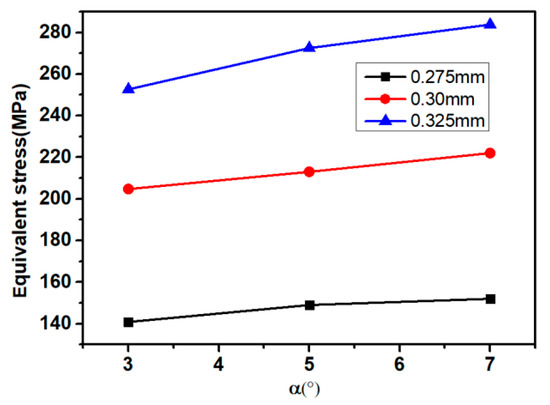
Figure 6.
Variations in average equivalent stress on a platinum tube with α.
Figure 7 shows variations in average equivalent stress on a platinum tube with different platinum tube wall thickness. It can be seen that when the semi-angle remains the same, the average equivalent stress on the platinum tube increases linearly with increases in the platinum tube wall thickness, and that the increase is significant. For example, the average equivalent stress on the platinum tube was far lower in Simulation Experiment 1 (144 Mpa) than in Simulation Experiment 3 (253 MPa); these two experiments used the same semi-angle of 3°, but with different T values of 7.55 mm and 7.65 mm, respectively. This indicates that the wall thickness of the platinum tube has a significant impact upon the equivalent stress on the tube.
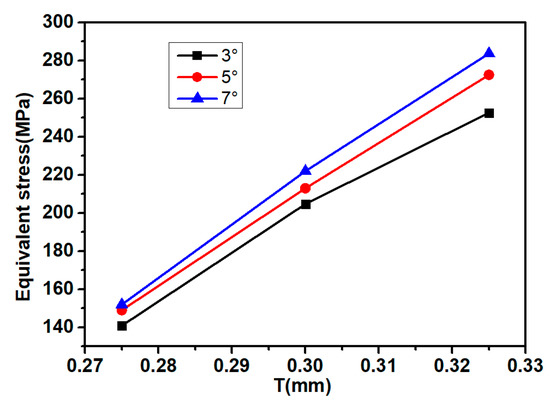
Figure 7.
Variations in average equivalent stress on a platinum tube with T.
3.3. The Effect of α and T on Axial Equivalent Stress Distribution
Figure 8 shows the distribution of equivalent stress on the platinum tube. It can be seen that when the semi-angle of die remains the same, the equivalent stress on the platinum tube rises with increases in platinum tube wall thickness, and this is consistent with the trend shown in Figure 7. At the same time, when platinum tube wall thickness increases, the area of the equivalent stress also expands. This is because the final diameter of the composite bar is determined to be 7.5 mm for the same semi-angle of the die, and the larger the diameter of the platinum tube, the larger the contact area with the work zone of the die and the larger the area of stress distribution. When the original platinum tube diameter remains the same but the semi-angle of die increases, the equivalent stress on the platinum tube increases and the area of stress distribution decreases, indicating that increasing the semi-angle of the die and the wall thickness of the original platinum tube makes the stress more concentrated, which can easily lead to excessive stress and breakage of the platinum tube.
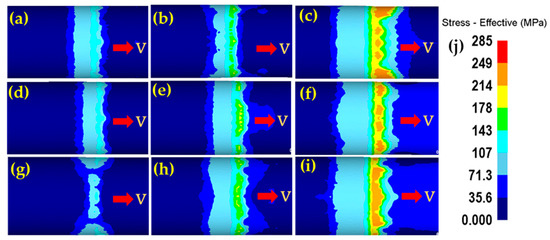
Figure 8.
Stress distribution of the platinum tube. (a) Simulation Experiment 1; (b) Simulation Experiment 2; (c) Simulation Experiment 3; (d) Simulation Experiment 4; (e) Simulation Experiment 5; (f) Simulation Experiment 6; (g) Simulation Experiment 7; (h) Simulation Experiment 8; (i) Simulation Experiment 9; (j) graduated scale.
Figure 9 shows distribution of stress on the nickel bar. Comparing and analyzing Figure 8, it can be seen that the influence of the semi-angle of the die and platinum tube wall thickness upon stress on the nickel bar is consistent with their influence on stress on the platinum tube, except that the level of equivalent stress and the area of stress distribution on the nickel rod are both lower than on the platinum tube.
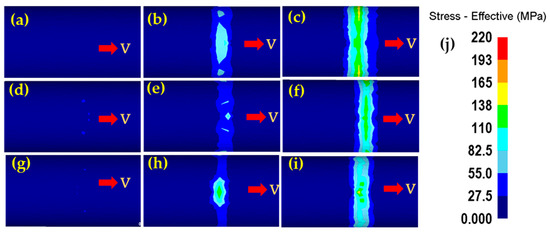
Figure 9.
Distribution of stress on the nickel bar. (a) Simulation Experiment 1; (b) Simulation Experiment 2; (c) Simulation Experiment 3; (d) Simulation Experiment 4; (e) Simulation Experiment 5; (f) Simulation Experiment 6; (g) Simulation Experiment 7; (h) Simulation Experiment 8; (i) Simulation Experiment 9; (j) graduated scale.
3.4. The Effect of α and T on Radial Equivalent Stress Distribution
Figure 10 shows the distribution of radial equivalent stress on the platinum-clad nickel composite bar during the drawing process. The results show that when the semi-angle of the die remains the same, the equivalent stress on the platinum tube and nickel bar increases as the platinum tube wall thickness increases. The equivalent stress on the nickel bar is almost zero when platinum tube wall thickness = 0.275 mm, but when the platinum tube wall thickness increases to 0.325 mm, the equivalent stress on the nickel bar penetrates the whole cross section. When the platinum tube wall thickness remains the same, the equivalent stress on both the platinum tube and the nickel bar rises with increases in the semi-angle of the die.
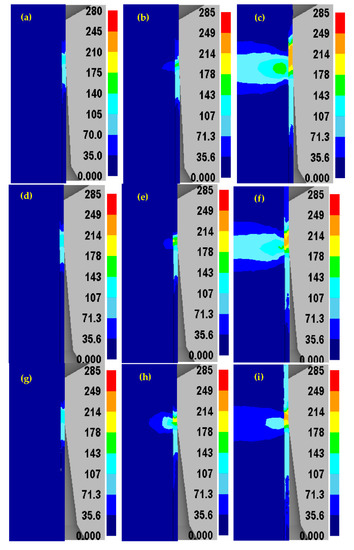
Figure 10.
Distribution of radial equivalent stress. (a) Simulation Experiment 1; (b) Simulation Experiment 2; (c) Simulation Experiment 3; (d) Simulation Experiment 4; (e) Simulation Experiment 5; (f) Simulation Experiment 6; (g) Simulation Experiment 7; (h) Simulation Experiment 8; (i) Simulation Experiment 9.
Figure 11 shows the distribution of radial-compressive and tensile stresses in the platinum-clad nickel composite bar during the stable drawing stage of Simulation Experiment 1 (T = 0.275 mm, α = 3°). According to Figure 11, the platinum tube has two stress concentration zones: at the circular arc transition of the calibrating strap and within the calibrating strap. At the circular transition, the tensile stress is applied near the inner wall, and the compressive stress is applied near the outer wall of the platinum tube. In the calibrating strap, the tensile stress gradually increases from the inner wall to the outer wall of the platinum tube. The nickel bar as a whole is subjected to tensile stress, but its value is very small (2 Mpa). Figure 12 shows the distribution of radial compressive and tensile stresses in the platinum-clad nickel composite bar during the stable drawing stage of Simulation Experiment 3 (T = 0.325 mm, α = 3°). According to Figure 12, both the platinum tube and the nickel bar have two stress concentration areas, the locations of which are the same as in Simulation Experiment 1. At the circular transition, the platinum tube is subjected to compressive stress, which gradually increases from the inner wall to the outer wall and then tends to level off; while the center of the nickel bar is subjected to tensile stress, the epidermis is subjected to compressive stress, and the area affected by the compressive stress is about 1 mm deep. Within the calibrating strap, both the platinum tube and the nickel bar are subjected to tensile stresses. The core of the nickel bar is subjected to a tensile stress of about 2.2 MPa; the tensile stress then gradually rises to 30 MPa near the epidermis. The tensile stress of the platinum tube increases gradually from inner wall to outer wall and then decreases much more dramatically than in the case of the nickel bar. Therefore, the thicker the wall of the platinum tube, the greater the compressive stress at the circular transition—which can easily lead to the drawing off of the platinum tube—and the greater the tensile stress within the calibrating strap, which can easily lead to the separation of the platinum tube from the nickel bar and the reduction in the diameter of the platinum tube.
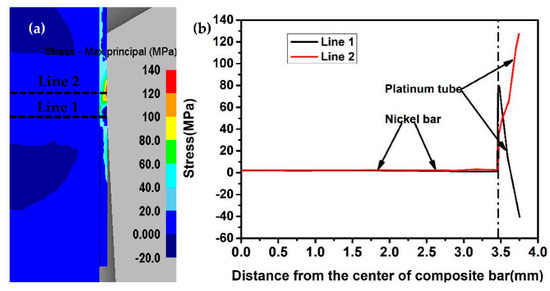
Figure 11.
Distribution of radial-compressive and tensile stresses in Experiment 1. (a) Distribution; (b) stresses.
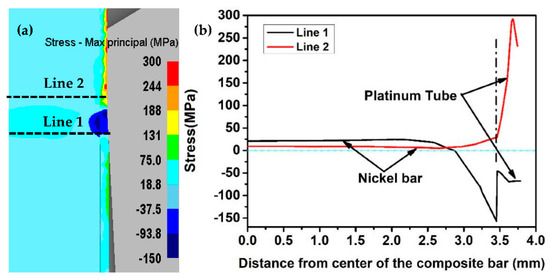
Figure 12.
Distribution of radial-compressive and tensile stresses in Experiment 3. (a) Distribution; (b) stresses.
3.5. The Effect of α and T on Cladding Condition
Figure 13 shows the cladding condition for different parameters. Figure 13a,c,e,g,i,k,m,o,q shows cross-sectional views of the platinum tube and the nickel bar within the calibrating strap, and Figure 13b,d,f,h,j,l,n,p,r show cross-sectional views after crossing the calibrating strap. Within the calibrating strap, there are discontinuous gaps between the platinum tube and the nickel tube when the platinum tube wall thickness is thin (T = 0.275 mm), indicating that a tight bond between the platinum tube and the nickel bar cannot be achieved at this level of platinum tube wall thickness, as shown in Figure 13a,g,m. This is because, during the drawing process, the platinum tube is first compressed radially to fill the gaps between the platinum tube and the nickel bar. By theoretical calculation, the amount of metal of the platinum tube is enough to fill the gaps with a slight surplus. However, due to the frictional force in the work zone, the platinum tube metal flows in the axial direction; so, that amount of metal of the platinum tube is not enough to fill the gaps. Therefore, after passing the calibrating strap, there are still gaps, but these do not have the tendency to continue to expand. When the original platinum tube wall is thicker (T = 0.3 mm and 0.325 mm), there are no gaps between the platinum tube and the nickel bar in the calibrating strap, indicating that, at these thicknesses, the platinum tube and the nickel bar achieve a tight bond, as shown in Figure 13c,e,i,k,o,q. After passing through the calibrating strap, a partial separation of the platinum tube from the nickel bar occurs and gaps appear, as shown in Figure 13d,f,j,l,p,r. This is because, the thicker the platinum tube wall thickness, the higher the tensile stress on the platinum tube in the calibrating strap, which separates the platinum tube from the nickel rod.
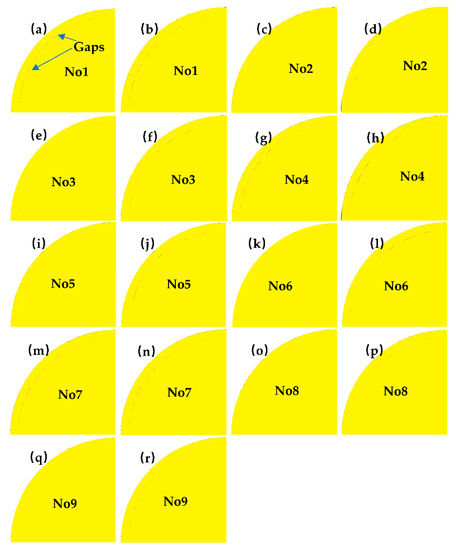
Figure 13.
Cladding condition. (a,c,e,g,i,k,m,o,q) Within the calibrating strap. (b,d,f,h,j,l,n,p,r) After crossing the calibrating strap.
3.6. The Effect of α and T on Damage
The platinum tube incurred intense plastic deformation during the first-step drawing process, ductile damages were gradually accumulated inside the platinum tube, and finally, ductile fracture occurred. The influencing factors of ductile damage mainly include the geometric shape of the material, material properties, process parameters, etc. The Crockroft–Latham ductile fracture criterion shows that the maximum tensile stress applied to the material is an important reason for its fracture. The material is destroyed when the maximum tensile stress reaches the critical void volume fraction. The fracture criterion expression can be obtained by integrating the maximum tensile stress along the plastic strain path.
where is the critical value of damage; is the principal strain of fracture tensile; is the maximum tensile stress; is equivalent stress; and is the equivalent strain increment.
Figure 14 shows the distribution of axial damage to the platinum tube for different conditions. According to Figure 14g,h,i the damage value increases significantly with increases in platinum tube wall thickness when the semi-angle of the die remains the same. When the platinum tube wall thickness remains the same, damage values rise with increases in the semi-angle of the die, as can be seen in Figure 14c,f,i. The damage value represents the probability of damage, which is determined by the energy accumulated during the drawing process and is irreversible. Increases in the damage value indicate an increased tendency for defects such as fracture, build-up and skin breakage and other defects in the composite bar, especially in the platinum layer.
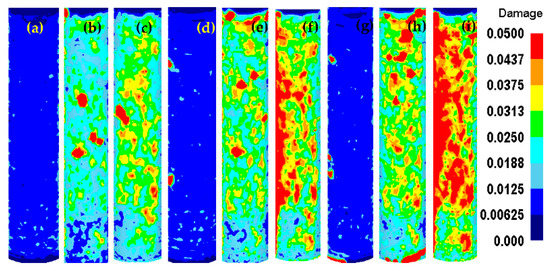
Figure 14.
Distribution of axial damage. (a) Simulation Experiment 1; (b) Simulation Experiment 2; (c) Simulation Experiment 3; (d) Simulation Experiment 4; (e) Simulation Experiment 5; (f) Simulation Experiment 6; (g) Simulation Experiment 7; (h) Simulation Experiment 8; (i) Simulation Experiment 9.
Figure 15 shows the damage values for all nodes of the platinum tube of Simulation Experiment 1 and Simulation Experiment 9 after drawing. Each element number represents a specific location on the platinum tube. It can be seen that, under the same process conditions, the damage values of most of the elements are close to each other, and the damage is relatively uniformly distributed on the platinum tube, with only a few elements reaching relatively high damage levels and most elements having relatively low such levels. For example, most of the damage values of Simulation Experiment 1 were lower than 0.03, and only a few exceeded 0.03, with a maximum value of 0.055, as shown in Figure 15a. The damage values of Simulation Experiment 1 were mostly lower than 0.1, and only a few exceeded 0.1, with two elements having damage values greater than 0.4, as shown in Figure 15b. This indicates that increasing the semi-angle and the original platinum wall thickness results in increased damage to the platinum tube. In the actual drawing process, most of the damage to the platinum tube starts in a few places, while most of the platinum tube remains in good condition and is also reflected by the results of our simulations. However, any damage to the platinum layer will seriously affect the quality of the product and may lead to the scrapping of the entire batch. Therefore, in order to ensure the product quality and reduce the damage to the platinum tube during first-step drawing, we can choose a smaller semi-angle of die (α = 3°) and a thinner-walled platinum tube (T = 0.275 mm) and thereby improve product quality and yield.
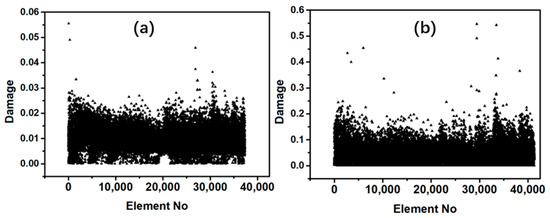
Figure 15.
Damage values of elements after drawing. (a) Simulation Experiment 1. (b) Simulation Experiment 9.
4. Confirmation Experiment
In order to verify the accuracy of simulation results, the first-step drawing experiments with the same semi-angle (3°) and different platinum tube wall thicknesses (T = 0.275 mm and 0.325 mm) were carried out. The raw materials used for the preparation of platinum-clad nickel bars are shown in Table 4.
Table 4.
The raw materials used for the preparation of platinum-clad nickel bars.
The first-step drawing process of the platinum-clad nickel bar was as follows: (1) One end of the nickel bars was rolled small so that the nickel bars could pass through the drawing die. (2) Assembly: the nickel bars were inserted into the platinum tubes and fixed. (3) Vacuum heat treated: the composite bars after assembly were heat treated at 600 °C for 30 min. (4) Drawn: the composite bars, after being heat treated, were drawn with the semi-angle of 3° and the calibrating strap diameter of 7.50 mm. The picture after the first-step drawing is shown in Figure 16. By measuring the size of the two composite bars, the diameter of the platinum tubes was 7.50 mm, and the length of the nickel bars was 25.1 mm, but the length of the platinum tubes were 12.7 mm and 14.6 mm, respectively, indicating that only the platinum tube was deformed, while the nickel bar was not deformed, which is consistent with the conclusion in the literature [32]. According to Figure 16a, when the wall thickness of the platinum tube is thin (T = 0.278 mm), the surface of the composite rod is very smooth without any defects. According to Figure 16b, when the wall thickness of the platinum tube is increased to 0.32 mm, the whole composite bar is also very smooth, but there are defects in the tai, which indirectly shows that increasing the wall thickness of the platinum tube increases the possibility of platinum tube damage.
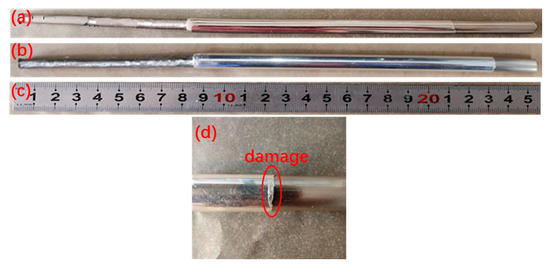
Figure 16.
The photos of experiment. (a) T = 0.278 mm (b) T = 0.32 mm (c) ruler (d) damage.
To further understand the cladding condition of the composite rod, a 10 mm long round rod was cut from the middle of the composite bar, which was prepared using a thick-walled platinum tube (T = 0.32 mm). According to Figure 17a, it can be seen that the bonding between the platinum layer and the nickel bar is very tight, and the gaps cannot be observed with the naked eye. By enlarging the interface, as shown in Figure 17b, the gaps between the platinum layer and the nickel bar can be clearly seen, but it is not continuous, which also proves the credibility of our simulation results.
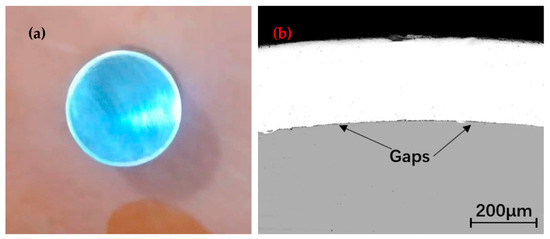
Figure 17.
The cladding condition. (a) Macroscopic. (b) Microscopic.
5. Conclusions
In the present study, the effects of the semi-angle and wall thickness of platinum tubes on drawing force, equivalent stress, cladding condition and damage during the first-step drawing process were investigated using DEFORM-3D finite element simulations, and the correctness of the simulation results was verified. The following key conclusions are drawn:
- (1)
- The influence of semi-angle on first-step drawing process: The drawing load tends to decrease and the damage value increases with the increase in semi-angle, while the semi-angle has little effect upon the equivalent stress on the platinum tube. Therefore, in order to minimize damage to the platinum tube, a smaller semi-angle (3°) should be used.
- (2)
- The influence of wall thickness of platinum tubes on first-step drawing process: The drawing load increases with the increase in the wall thickness of the platinum tubes, as does the equivalent stress and the damage value on the platinum tube. Therefore, a smaller wall thickness of platinum tubes (0.275 mm) should be used.
- (3)
- After first-step drawing, there are still gaps between the platinum tube and the nickel bar. When the platinum tube is thick, due to the high pulling force, it will cause secondary separation between the platinum layer and the nickel rod, which will cause more serious damage to the platinum tube. Therefore, a smaller wall thickness of platinum tubes (0.275 mm) should be used.
However, in the case that initial stresses exist, or when there is a large thickness difference in the wall thickness of the platinum tubes when first-step drawing, the results might be different, so the other method should be employed.
Author Contributions
Conceptualization, Y.C. and M.X.; methodology, Y.C. and M.X.; software, Y.C. and M.Y.; validation, Y.Y. and J.Z.; formal analysis, Y.C. and M.Y.; resources, Y.C. and M.X.; data curation, Y.C. and M.Y.; writing—original draft preparation, Y.C. and M.Y.; investigation, Y.Y. and J.Z.; writing—review and editing, Y.C.; visualization, Y.C. and J.H.; supervision, M.X.; project administration, Y.C. and J.H.; funding acquisition, Y.C. All authors have read and agreed to the published version of the manuscript.
Funding
This research was funded by Innovation Team Project of Yunnan Province (202105AE160027), the Plan Project of Yunnan Precious Metals Laboratory Co., Ltd. (YPML-2022050228) and the Rare and Precious Metals Material Genetic Engineering Project of Yunnan Province (202102AB080019-1).
Data Availability Statement
The data are available on request from the corresponding authors.
Conflicts of Interest
The authors declare no conflict of interest.
References
- Bhadrakali, A.S.; Ramasastry, D.V.A.; Prabhu, T.R.; Kumar, C.B.; Kumar, K.R.; Muralimohan, C. Microstructure and Mechanical Properties of the Bimetallic Wire Arc Additively Manufactured Structure (BAMS) of SS304L and SS308L Fabricated by Hybrid Manufacturing Process. Trans. Indian Inst. Met. 2022, 76, 419–426. [Google Scholar]
- Alireza, D.; Alain, G.; Clément, K.; Benoit, V. Metal Forming-Induced Residual Stresses and Rule of Mixtures’ Prediction of Tensile Behavior of Bimetallic Wires. Key Eng. Mater. 2022, 6392, 381–388. [Google Scholar]
- Irina, V.; Natalia, V.; Roman, F.; Alexandr, K. Hardening of Bimetallic Wires from Secondary Materials Used in the Construction of Power Lines. Materials 2022, 15, 3975. [Google Scholar]
- Li, H.J.; Ding, Z.M.; Tan, F.L.; Liu, B.G. Microstructural Evolution and Mechanism of Grain Refinement During Annealing of Cold-Drawn Copper Clad Steel Wires. JOM 2020, 72, 2134–2138. [Google Scholar] [CrossRef]
- Münster, D.; Hirt, G. Copper Clad Steel Strips Produced by a Modified Twin-Roll Casting Process. Metals 2019, 9, 1156. [Google Scholar] [CrossRef]
- Zhang, Z.Q.; Wu, F.Y.; Liu, Z.; Tu, Z.; He, K.l. Study on corrosion mechanism of shielding line of copper clad aluminum cable in substation terminal box. IOP Conf. Ser. Earth Environ. Sci. 2019, 310, 32018. [Google Scholar] [CrossRef]
- Moisy, F.; Gueydan, A.; Sauvage, X.; Guillet, A.; Keller, C.; Guilmeau, E.; Hug, E. Influence of intermetallic compounds on the electrical resistivity of architectured copper clad aluminum composites elaborated by a restacking drawing method. Mater. Des. 2018, 155, 366–374. [Google Scholar] [CrossRef]
- Hasanniah, A.; Movahedi, M. Welding of Al-Mg aluminum alloy to aluminum clad steel sheet using pulsed gas tungsten arc process. J. Manuf. Process. 2018, 31, 494–501. [Google Scholar] [CrossRef]
- Rahimi, S.; Movahedi, M. Resistance Spot Welding of Aluminum to Aluminum Clad Steel Sheet: Experimental and Theoretical Analysis. J. Manuf. Process. 2020, 58, 429–435. [Google Scholar] [CrossRef]
- Shi, B.B.; Liu, X.H.; Xie, J.X.; Xie, M. Preparation process of silver clad aluminum bars by vertical continuous casting composite forming. Chin. J. Eng. 2019, 41, 633–645. [Google Scholar]
- Yin, J.M.; Liu, Y.; Zhang, G.Q.; Wu, H.J.; Qin, Q.Y.; Zhu, W.X.; Wan, J.G.; Pu, E.X. Study on Preparation Process of Low Density and Ultrafine Silver Clad Aluminum Composite Soft Wire. Precious Met. 2020, 41, 65–69. [Google Scholar]
- Du, W.J.; Xie, M.; Pu, C.J.; Yang, Y.F.; Liu, H.J.; Zhang, J.M.; Chen, Y.T.; Liu, M.M.; Hu, J.Q.; Wang, S.B. Effect of Annealing Temperature on Interface and Mechanical Properties of Silver Clad Copper Wires. Rare Met. Mater. Eng. 2015, 44, 452–456. [Google Scholar]
- Kang, F.F.; Kong, J.W.; Chen, J.L.; Zhou, W.Y.; Yang, G.X.; Pei, H.Y. Enhancement of Mechanical Properties of Gold-Coated Silver Composite Bonding Wire with Palladium and Copper Elements Addition. Chin. J. Rare Met. 2019, 43, 1302–1308. [Google Scholar]
- Kang, F.F.; Zhou, W.Y.; Wu, Y.J.; Yang, G.X.; Kong, J.W.; Pei, H.Y. Microstructure and Properties of Gold-Coated Silver Composite Bonding Wire for Microelectronic Package. Semicond. Technol. 2018, 43, 702–707. [Google Scholar]
- Chang, C.Y.; Hung, F.Y.; Lui, T.S. Mechanical and Electrical Properties of Palladium-Coated Copper Wires with Flash Gold. J. Electron. Mater. 2017, 46, 4384–4391. [Google Scholar] [CrossRef]
- Du, Y.H.; Liu, Z.Q.; Ji, H.J.; Li, M.Y.; Wen, M. The mechanism of Pd distribution in the process of FAB formation during Pd-coated Cu wire bonding. J. Mater. Sci. Mater. Electron. 2018, 29, 13774–13781. [Google Scholar] [CrossRef]
- Yang, Y.K.; Yan, X.F.; Huang, G.L.; Bai, X.P. Manufacturing of Platinum-Nickel 30/70 Compound Wires. Electr. Mater. 2006, 1, 6–9+13. [Google Scholar]
- Lou, M.X.; Liu, X.H.; Jiang, Y.B.; Xie, J.X.; Xie, M. Rotary swaging-drawing formation, microstructure, and properties of copper-clad aluminum composite micro-wires. Chin. J. Eng. 2018, 40, 1358–1372. [Google Scholar]
- Sun, D.; Wang, Z.; Jiang, S.Y.; Zhang, Y.Q. Interface Compatibility During Different-Temperature Cu/NbTi Cladding Extrusion: Simulation and Experiment. Rare Met. Mater. Eng. 2023, 52, 441–447. [Google Scholar]
- Zhao, Y.; Song, B.Y.; Pei, J.Y.; Yun, X.B. Study on Metal Flow in Continuous Extrusion Cladding of Cable Aluminum Sheath Using FEM Analysis. Adv. Mater. Res. 2011, 1165, 1934–1940. [Google Scholar] [CrossRef]
- Li, H.J.; Tan, F.L.; Liu, B.G.; Wu, J.W. Study on Microstructure and Mechanical Properties of Copper Clad Steel Wire Prepared by Solid Phase Rolling Composite Method. Hot Work. Technol. 2020, 49, 86–89. [Google Scholar]
- Su, Y.J.; Liu, X.H.; Huang, H.Y.; Liu, X.F.; Xie, J.X. Interfacial Microstructure and Bonding Strength of, Copper Cladding Aluminum Rods Fabricated by Horizontal Core-Filling Continuous Casting. Metall. Mater. Trans. 2011, 42, 4088–4099. [Google Scholar] [CrossRef]
- Pilone, D.; Mondal, A.; Zortea, L. High-Temperature Oxidation Behaviour of a TiAl-Based Alloy Subjected to Aluminium Hot-Dipping. Oxid. Met. 2022, 98, 529–543. [Google Scholar] [CrossRef]
- Tran, T.Q.; Lee, J.K.Y.; Chinnappan, A.; Jayathilaka, W.A.D.M.; Ji, D.X.; Kumar, V.V.; Ramakrishna, S. Strong, lightweight, and highly conductive CNT/Au/Cu wires from sputtering and electroplating methods. J. Mater. Sci. Technol. 2020, 40, 99–106. [Google Scholar] [CrossRef]
- Osman, N.; Sajuri, Z.; Omar, M.Z. Multi-pass friction stirred clad welding of dissimilar joined AA6061 aluminium alloy and brass. J. Mech. Eng. Sci. 2018, 12, 4285–4299. [Google Scholar] [CrossRef]
- Duan, X.W.; Wang, M.; Che, X.; He, L.F.; Liu, J.C. Cellular automata coupled finite element simulation for dynamic recrystallization of extruded AZ80A magnesium alloy. J. Mater. Sci. 2023, 58, 1345–1367. [Google Scholar] [CrossRef]
- Soumyaranjan, N.; Abhishek, K.S.; Hina, G.; Prasad, M.J.N.V.; Narasimhan, K. Optimization of Ti-6Al-4V ring rolling process by FE simulation using RSM. Int. J. Solids Struct. 2023, 262–263, 112064. [Google Scholar]
- Shi, J. The Study on the Numerical Simulation On Clad-Drawing and the Performance of Copper Clad Aluminum. Master’s thesis, Jiangsu University, Zhenjiang, China, 2011. [Google Scholar]
- Xiang, Y.Y. Numerical Simulation of Continuous Extrusion Cladding and Synchronous Drawing Process and Study on Microstructure and Properties of Aluminum-Clad Steel Wire. Master’s thesis, Hefei University of Technology, Hefei, China, 2021. [Google Scholar]
- Yang, M.X.; Luan, J.T.; Zhou, T.G.; Zhang, X.F. Computer Simulation of Aluminum Conductors Drawn in High Speed. Adv. Mater. Res. 2013, 834–836, 1567–1570. [Google Scholar] [CrossRef]
- Chen, Y.T.; Chong, X.Y.; Zhao, S.Q.; Yang, Y.C.; Li, A.K.; Fang, J.H.; Hu, J.Q.; Xie, M. Optimization of the First-Step Drawing Parameters for Platinum-Clad Nickel Bar Based on FEM Simulation. Metals 2023, 13, 1201. [Google Scholar] [CrossRef]
- Ning, Y.T.; Yang, Z.F.; Wen, F. Platinum; Metallurgical Industry Press: Beijing, China, 2010. [Google Scholar]
- Zhu, G.H.; Xiao, H.F.; Sui, F.L. Flow Stress Model of Pure Al/Ni for Cold Deformation and Its Application. J. Anhui Univ. Technol. (Nat. Sci.) 2011, 28, 205–209. [Google Scholar]


Disclaimer/Publisher’s Note: The statements, opinions and data contained in all publications are solely those of the individual author(s) and contributor(s) and not of MDPI and/or the editor(s). MDPI and/or the editor(s) disclaim responsibility for any injury to people or property resulting from any ideas, methods, instructions or products referred to in the content. |
© 2023 by the authors. Licensee MDPI, Basel, Switzerland. This article is an open access article distributed under the terms and conditions of the Creative Commons Attribution (CC BY) license (https://creativecommons.org/licenses/by/4.0/).