Article

Selective Laser Melting of Al-Cu-Mn-Mg Alloys: Processing and Mechanical Properties

1
School of Materials Science and Engineering, North University of China, Taiyuan 030051, China
2
School of Mechanical Engineering, North University of China, Taiyuan 030051, China
*
Author to whom correspondence should be addressed.
Metals 2023, 13(9), 1520; https://doi.org/10.3390/met13091520
Submission received: 6 August 2023 / Revised: 23 August 2023 / Accepted: 24 August 2023 / Published: 27 August 2023

Abstract

:
Al-Cu-Mn-Mg alloys containing Zr were produced via selective laser melting (SLM). The processing parameters were analyzed via an orthogonal experiment, and the microstructure and mechanical properties of the specimens were investigated. The results showed that the laser power and scanning speed were the main factors affecting the density and hardness of the specimens. The optimal parameters for the SLM processing of Al-Cu-Mn-Mg alloy were a laser power of 300 W, scanning speed of 1100 mm/s, and hatch spacing of 0.12 mm. The microstructure of the specimen was made of fine equiaxed grains and columnar grains, and Al2Cu precipitates were found in the as-printed alloy. The alloy was isotropic, and the hardness was around 100 HV. The tensile and yield strength of the alloy were 361 MPa and 266 MPa, and the elongation was 5.4%. The superior mechanical properties can be attributed to the synergy effect of the strengthening of the grain boundary, solid solution, and precipitation.

1. Introduction

Modern science and technology require materials to be lighter to meet the demand for lightweight materials. To ensure service safety in high-power applications, it also calls for materials that are temperature-resistant. The service temperatures of some heat-resistant components in the aerospace, transportation, and other crucial fields are gradually crossing the range of 250 °C to 400 °C, but it is difficult to withstand the “high temperatures” of corresponding lightweight alloy materials due to higher requirements for their service life at high temperatures and loads [1,2,3]. Compared to other lightweight metals, aluminum alloys possess the lowest density, highest strength, and best corrosion resistance, making them the most promising light alloys for this temperature range. However, the currently available cast and wrought aluminum alloys are not suitable for use in the above high-temperature range because the nanoparticles in the matrix (Al2Cu, Mg2Zn, Mg2Si, etc.), which are the basis for the reinforcement of aluminum alloys, coarsen quickly or even dissolve at high temperatures above 250 °C [4].
In general, casting, fast solidification, and additive manufacturing are the methods that can be used to produce aluminum alloys. The most important distinction between these three methods is the cooling rate. Casting, a relatively established process, has been the subject of the most in-depth investigation of any of them. Then, as a result of the development of high-cooling-rate production techniques, rapid solidification and additive manufacturing emerged. Selective laser melting (SLM) technology in particular features tiny molten pools with a 107 K/s rate of quick heating and cooling [5,6]. The SLM technique produces complex components that can be customized, integrated, and lightweight while still having superior mechanical qualities, high densities, and dimensional precision. In recent years, aluminum alloy fabrication using the SLM technique has received extensive attention, with most studies focusing on Al-Mg-Si, Al-Cu, and Al-Cu-Mg-Mn alloys [7,8,9,10,11,12,13,14,15]. However, due to the features of aluminum alloys, such as their high thermal conductivity, laser reflectivity, and a relatively high coefficient of linear expansion, the present SLM processing of aluminum alloys still has certain limitations. Therefore, considering the high cooling rate of SLM, new aluminum alloy compositions need to be designed to reduce the thermal cracking tendency during solidification and to enhance the alloy strength.
An Al4.5Mg0.66Sc0.37Zr (wt.%) alloy fabricated using SLM [16] was investigated, and the result showed that its tensile strength at room temperature reached 520 MPa and that its elongation was around 15%. The high cooling rate of SLM, which enabled Mg, Sc, and Zr to form a supersaturated solid solution in the aluminum matrix, and the fine Al3(Sc/Zr) precipitates which precipitated during aging treatment were responsible for the superior mechanical properties of the alloy. The high strength of the alloy was realized by the synergistic effect of precipitation strengthening and solid solution strengthening. Joseph et al. [17] studied Al-Mg alloys of a similar composition formed by SLM and replaced all high-priced Sc with Zr. The primary submicron Al3Zr precipitated during solidification promoted the solidification process and the formation of equiaxial crystals, reduced the tendency of hot cracking and refined the grains, and the nanoscale secondary Al3Zr precipitated after aging played a role in the precipitation enhancement. Griffiths et al. [18] studied the high-temperature tensile properties of alloys with the same composition and found that the yield strength of the alloy decreased sharply with the increase in temperature due to the coarsening of the precipitated phase at the grain boundary during aging. The too-high aging temperature may also reduce the solid solution content of Mg and weaken the solid solution strengthening effect of Mg. Spierings [19] and Li [20] et al. studied aluminum alloys containing Sc and Zr. They found that the primary Al3(Sc/Zr) phase refined the grains during solidification, and the secondary precipitated Al3(Sc/Zr) phase had a precipitation-strengthening effect. Jia [21] prepared selective laser melted (SLMed) Al4.5Mn1.3Mg0.79Sc0.74Zr alloys and found that after heat treatment at 300 °C for 5 h, Mn and Mg were still in the solid solution state, and the secondary precipitated Al3(Sc/Zr) particles (Sc/Zr) remained in nanometer size, indicating that Mn and Mg elements still had a solid solution strengthening effect at a high temperature, and Al3(Sc/Zr) phase still had a precipitation strengthening effect at a high temperature. Shyam [8] prepared Al8.6Cu0.45Mn0.9Zr alloy by SLM. Compared with cast Al alloy with a similar composition, the elongation of the SLMed sample was 10% greater, which was 2% higher than that of cast Al alloy due to the equiaxed and cylindrical bimodal grain structure. However, due to the coarsening of the Al2Cu phase at high temperatures, the tensile strength of the alloy was much higher than that of cast Al alloy only when the temperature was below 200 °C, and the tensile strength of the two alloys tended to be equal with the further increase in temperature. Gao [22] investigated casting Al2.5Cu0.3Sc alloy and achieved a high concentration of Sc atoms in the interface of the Al2Cu particles by using three heat treatments with different conditions. The segregation of Sc atoms suppressed the coarsening of Al2Cu precipitates at high temperatures, indicating that the Sc element could improve the high-temperature strengthening effect of the Al2Cu phase.
In this study, an Al-2Cu-1Mg-3Mn-0.8Zr (wt.%) aluminum alloy was designed based on the reports above. Cu, Mg, and Mn were added as solid solution strengthening elements, and the addition of Zr was for grain refining and reducing the hot cracking tendency during solidification. The secondary Al3Zr precipitated during aging treatment may enhance the alloy strength. Solid solution and precipitation strengthening are anticipated to maintain the alloy’s strength at high temperatures. The new alloy system is expected to be used in heat-resistant components in fields such as aerospace and transportation. The service temperature of the alloy might reach 250–350 °C. The application of Al alloys can reduce costs, achieve a light weight, and save energy. This work focuses on how SLM processing parameters affect the density, hardness, and defects of the designed alloy to determine the optimal fabrication parameters and prepare for future heat treatment. A preliminary investigation of the mechanical properties of the as-built aluminum alloys was also performed.

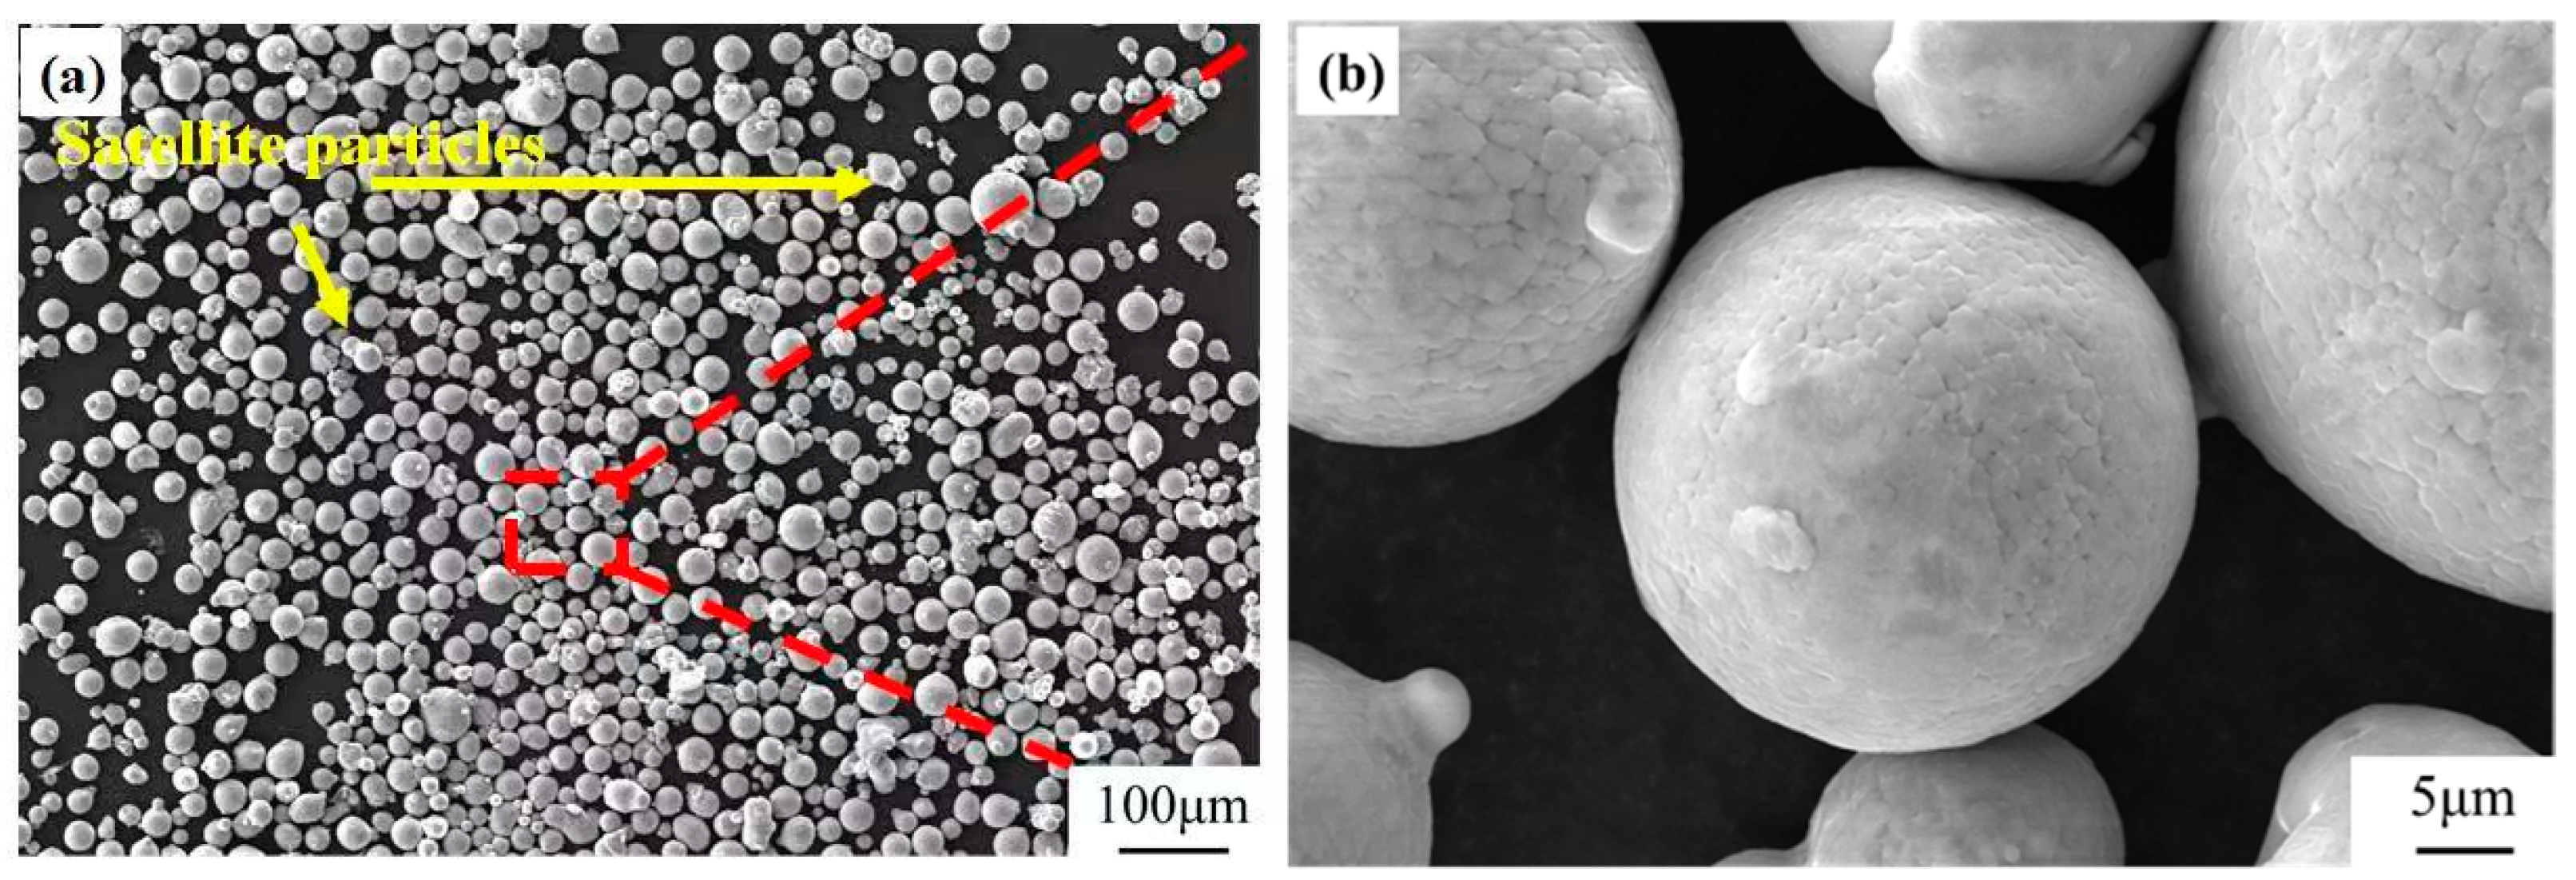
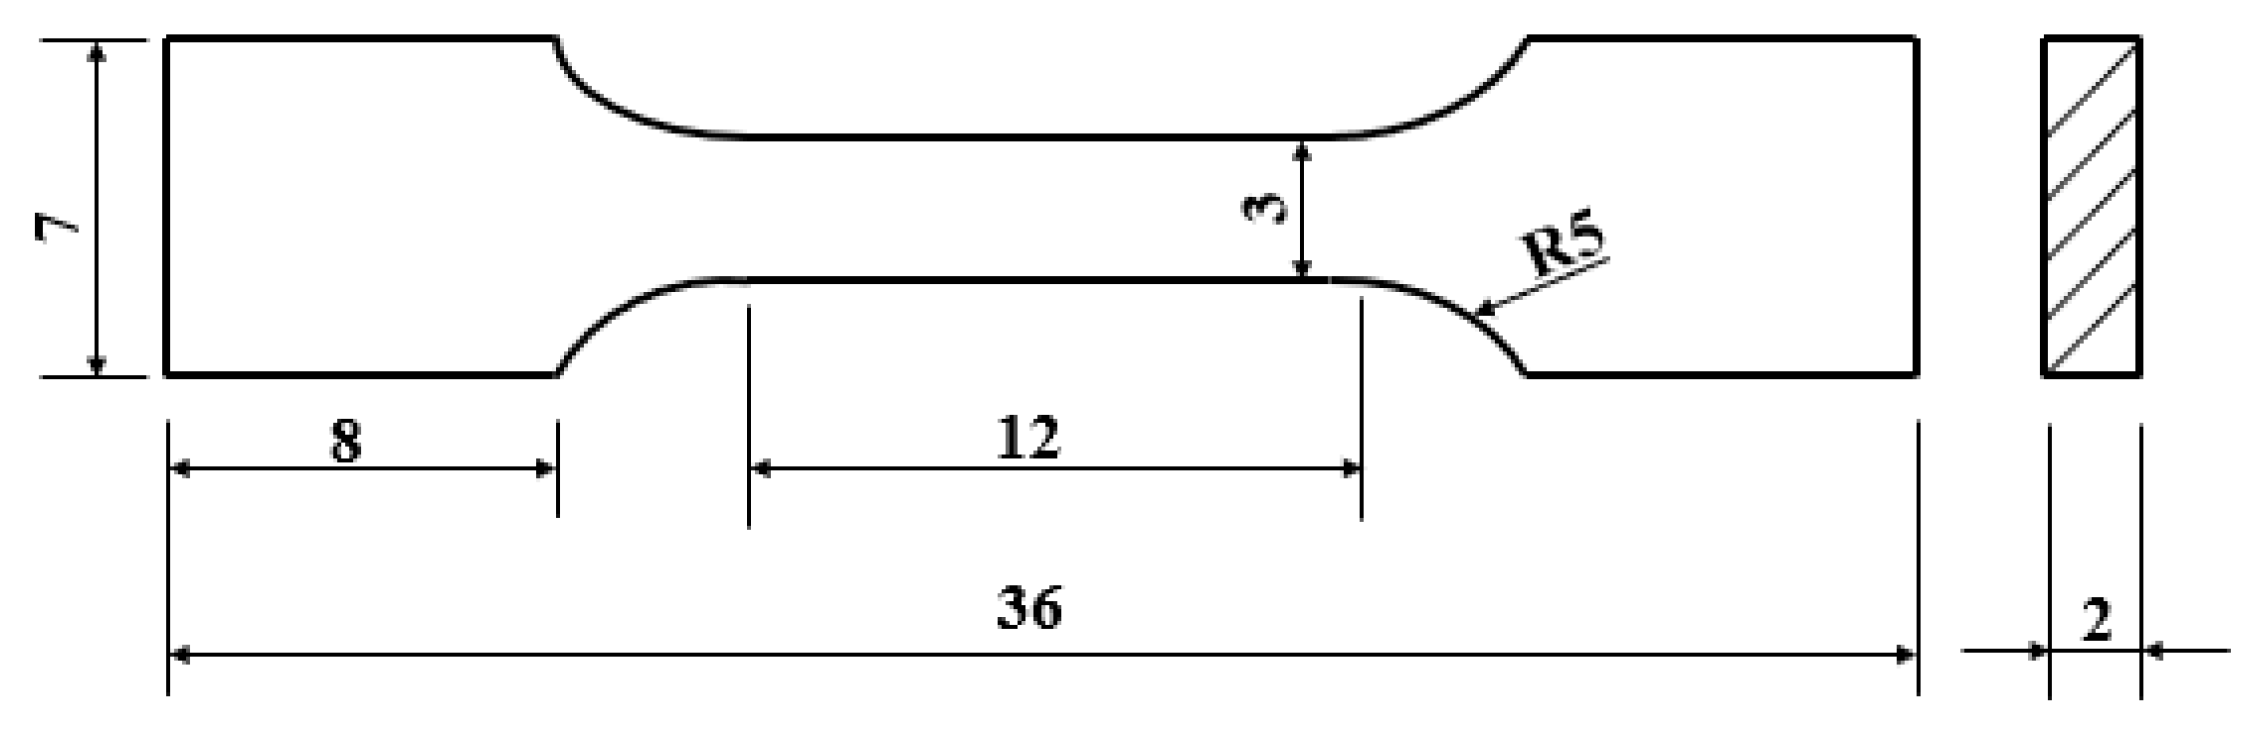
2. Experimental Methods

The raw material for the experiment was a spherical powder of the Al-2Cu-1Mg-3Mn-0.8Zr alloy that had been prepared via the vacuum atomization method. Table 1 lists its chemical composition. Figure 1 displays the microscopic morphology of the powder. The majority of the particles were spherical, with a small amount of satellite (indicated by yellow arrows) and irregular particles, as shown in Figure 1. The powder’s particle size distribution was between 19.08 and 50.11 µm, and the median particle size was 31.46 µm, which met the powder spreading requirements for SLM manufacturing. Before printing, the powder was dried for 10 h at 110 °C in a vacuum oven.
SLM experiments were carried out using an EP-M150 SLM equipment with a fiber laser (beam spot diameter, 70 µm; maximum scanning speed of 8 m/s). The cubic block specimens were built with dimensions of 10 mm × 10 mm × 10 mm. The SLM processing parameters of the samples included a laser power range of 250~400 W, a scanning speed range of 800~1000 mm/s, a hatch spacing range of 0.09–0.18 mm, and a powder thickness of 30 µm. The scanning strategy of powder layer scanning with a rotation angle of 67° was adopted, and the preheating temperature of the Al alloy substrate was 150 °C. The specimens were printed in an argon atmosphere, and the volume fraction of oxygen in the processing cabin was less than 0.1%.
The side section (plane parallel to the direction of building) of the cube was observed using an MDS 400 optical microscope to determine the number of pores/defects. Nine optical micrographs were taken for each sample and quantitative analysis was conducted by ImageJ software. The statistics and observation of pores and defects were used to evaluate the densification of specimens. The densification results were similar, and the average value of 3 sets of specimens for each parameter was calculated and presented. Keller’s reagent (1% HF, 1.5% HCl, 2.5% HNO3, 95% H2O) was used to etch the samples to observe the morphology of the grains. A Zeiss Sigma 300 model field emission scanning electron microscope (SEM) was used to characterize the micro-morphology of the powders as well as the microstructure of the side of the SLMed specimens, and the hardness of 5 sets of specimens for each parameter was tested using an HV-1000B Vickers hardness tester under a load of 0.3 kgf with a dwell time of 15 s. The tensile test was conducted by a SHIMADZU electronic universal testing machine with a tensile rate of 0.5 mm/min. The specific dimensions of the tensile specimens are shown in Figure 2.

3. Results and Discussion

3.1. Orthogonal Experiment Results and Analysis

A three-factor, four-level orthogonal table was designed, as shown in Table 2. The orthogonal experiment was designed according to the factors and levels of the orthogonal table, and the average values of densification and hardness tests of the corresponding specimens were shown in Table 3. The densification of the SLMed specimens was distributed between 94% and 99.9%, with the highest value of 99.88% for specimen No. 8. The hardness of most samples was around 90 HV, with the maximum hardness of specimen No. 8 close to 100 HV.
To compare the influence of the laser power, scanning speed, and hatch spacing on the densification and hardness of the samples, the data from the orthogonal experiment were treated with range analysis. Table 4 displays the densification range analysis results. The extremum deviations of laser power, scanning speed, and hatch spacing were 2.98, 1.7, and 1.4, respectively, as shown in Table 4. The larger the value of extreme deviation, the greater the influence of factors on the level indicators, so the influence of processing parameters on the densification in descending order was as follows: laser power, scanning speed, and hatch spacing. The influence of laser power and scanning speed on densification was more significant than that of hatch spacing. The k-value is the average densification corresponding to each factor. The change in the k-value with laser power showed that the k-value increased and then decreased with the increase in laser power. This was due to the fact that when laser power increased, input energy rose, which made the powder melt more completely and densification increased. When the laser power reached 300 W, the densification was the highest, and a further increase in laser power would lead to the volatilization of alloying elements with low melting points, resulting in a decrease in densification. In contrast to the laser power, the influence of scanning speed on densification was reversed because as scanning speed increased, the input energy reduced, which corresponded to a reduction in densification. The optimum processing parameter with the highest densification was A2B4C3 (300 W, 1000 mm/s, and 0.15 mm) according to the comprehensive analysis of the densification of k values.
Table 5 shows the range analysis of the hardness. The laser power, scanning speed, and hatch spacing corresponded to the extremum deviation of 11.15, 4.02, and 1.8, respectively, as shown in Table 5. Compared with scanning speed and hatch spacing, the effect of laser power on hardness was more significant. With an increase in laser power, the k value tended to first rise and subsequently decrease. The trend of hardness results with laser power was consistent with that of densification, indicating that higher densification corresponded to higher hardness. However, an excessive energy input generated by an excessively high laser power may cause the grain size to increase and reduce the effect of grain boundary strengthening, resulting in lower hardness. Therefore, as the laser power went above 350 W, the hardness decreased in proportion. The optimal processing parameters with the highest hardness were A2B1C3 (300 W, 800 mm/s, and 0.15 mm) according to the comprehensive analysis of the hardness k values.
The optimal processing parameter window, according to the integrated orthogonal experimental analysis of densification and hardness, was indicated to be 300–350 W for laser power, 1000–1100 mm/s for scanning speed, and 0.12–0.15 mm for hatch spacing.

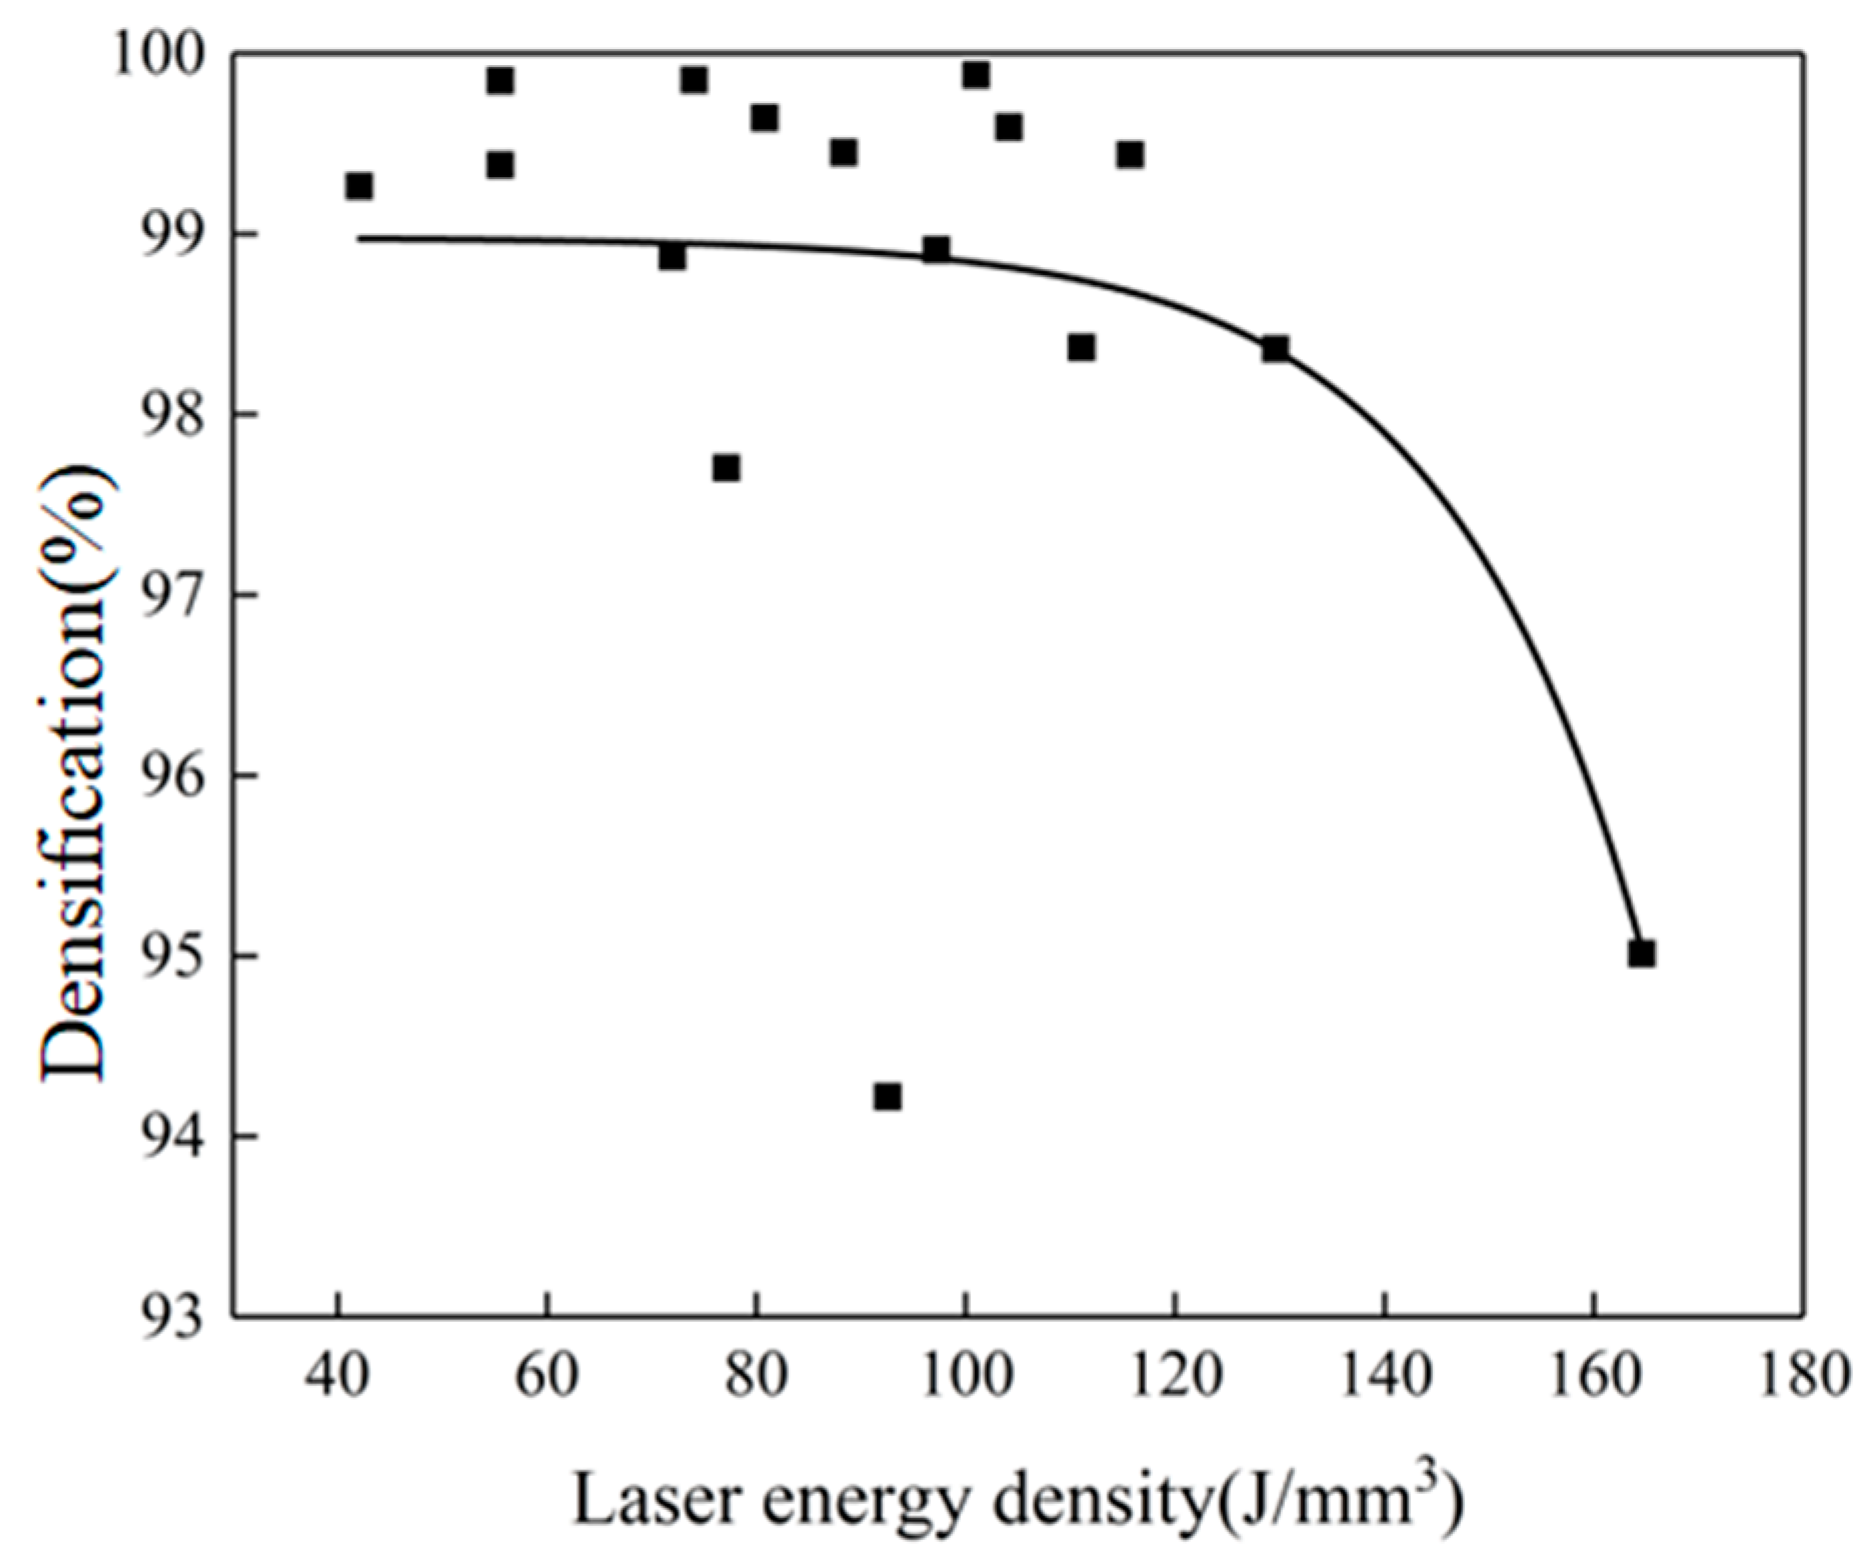
3.2. Effect of SLM Processing Parameters on Densification and Defects

The processing parameters can be comprehensively considered by volumetric energy density (VED), which is defined as the energy provided by the laser beam in unit volume as expressed in the following equation [23]:
E = P v h L
where E denotes the energy density per unit volume, J/mm3; P is the laser power, W; h is the hatch spacing, mm; v is the scanning speed, mm/s; and L is the thickness of each layer, mm.
Figure 3 depicts the variation in the densification versus VED. The densification of most samples exceeded 99% when the energy density was below 120 J/mm3. It was worth noting that the No. 13 specimen (400 W, 800 mm/s, 0.18 mm) had the lowest densification, which may be due to the high heat input caused by high laser power and a low scanning speed, even though the high hatch spacing resulted in a low VED value. When the VED exceeded 120 J/mm3, densification dropped dramatically. The densification reached its peak, 99.88%, when the VED was 101 J/mm3.
Figure 4 shows the specimens’ side section optical micrographs, which demonstrated that the main defect patterns in the specimens were pores and fractures. Specimens No.1–16 shown in Table 3 were indicated with (a)–(p). When the energy density was lower than 55.6 J/mm3, discontinuous cracks and fine irregular pores were presented, as seen in Figure 4c,d. These cracks and pores were primarily caused by the low VED, which caused the liquid phase of the molten pool to have a low temperature, high viscosity, and poor spreading, resulting in incomplete overlap in the molten pool. Additionally, the unmelt powder hindered powder inter-layer fusion, resulting in pores and micro-cracks. When the energy density exceeded 120 J/mm3, densification dramatically reduced, and larger circular pores with a diameter of around 100 µm formed in samples, as seen in Figure 4n. This was because high VED induced burnout and the evaporation of low-melting-point elements, producing more spherical pores, and they could merge to form large pores [24].
It was noticed that when the VED values were close or the same, different sorts of defects were present. As seen in Figure 4c,g, two samples had the same energy density, but Figure 4c displays continuous cracks and irregular pores while Figure 4g shows fine keyholes. The specimens shown in Figure 4b,f,j had a VED of around 75 J/mm3. However, the micrographs showed three distinct pore morphologies, including vast and irregular pores, tiny keyholes, and spherical pores with diameters of roughly 80 μm. The scanning speed was the same for the two sets of specimens mentioned above, with the only differences being laser power and hatch spacing. According to the range analysis results, hatch spacing had a minor influence on the densification of the specimens. Thus, it can be assumed that the differences in the two sets of specimens’ micrographs were due to the variations in laser power, proving that laser power was the most critical factor. The defects in Figure 4m were larger than those in Figure 4i, though they possessed a close energy density value. The densification result of specimen No. 13 (m) was abnormal, as mentioned above. The high heat input explained those phenomena. In conclusion, the laser power was the most important parameter for defect patterns in specimens, and the effect of VED on defect patterns could only be utilized as a general guideline for this study.
Figure 5 displays a histogram of the densifications of all specimens, and the line chart was made up of the average densifications of each laser power. As the laser power increased, the densifications of the specimens increased and then decreased. The densifications of the specimens were more than 99% when the laser power was 300 W. When the laser power was 250 W, the input energy was too low, which caused the low-temperature melting pool to result in cracking and unmelt powders to generate a large number of pores. High instantaneous energy produced by the laser power of 400 W led to the vaporization and evaporation of the elements with low melting points, resulting in larger-sized pores.

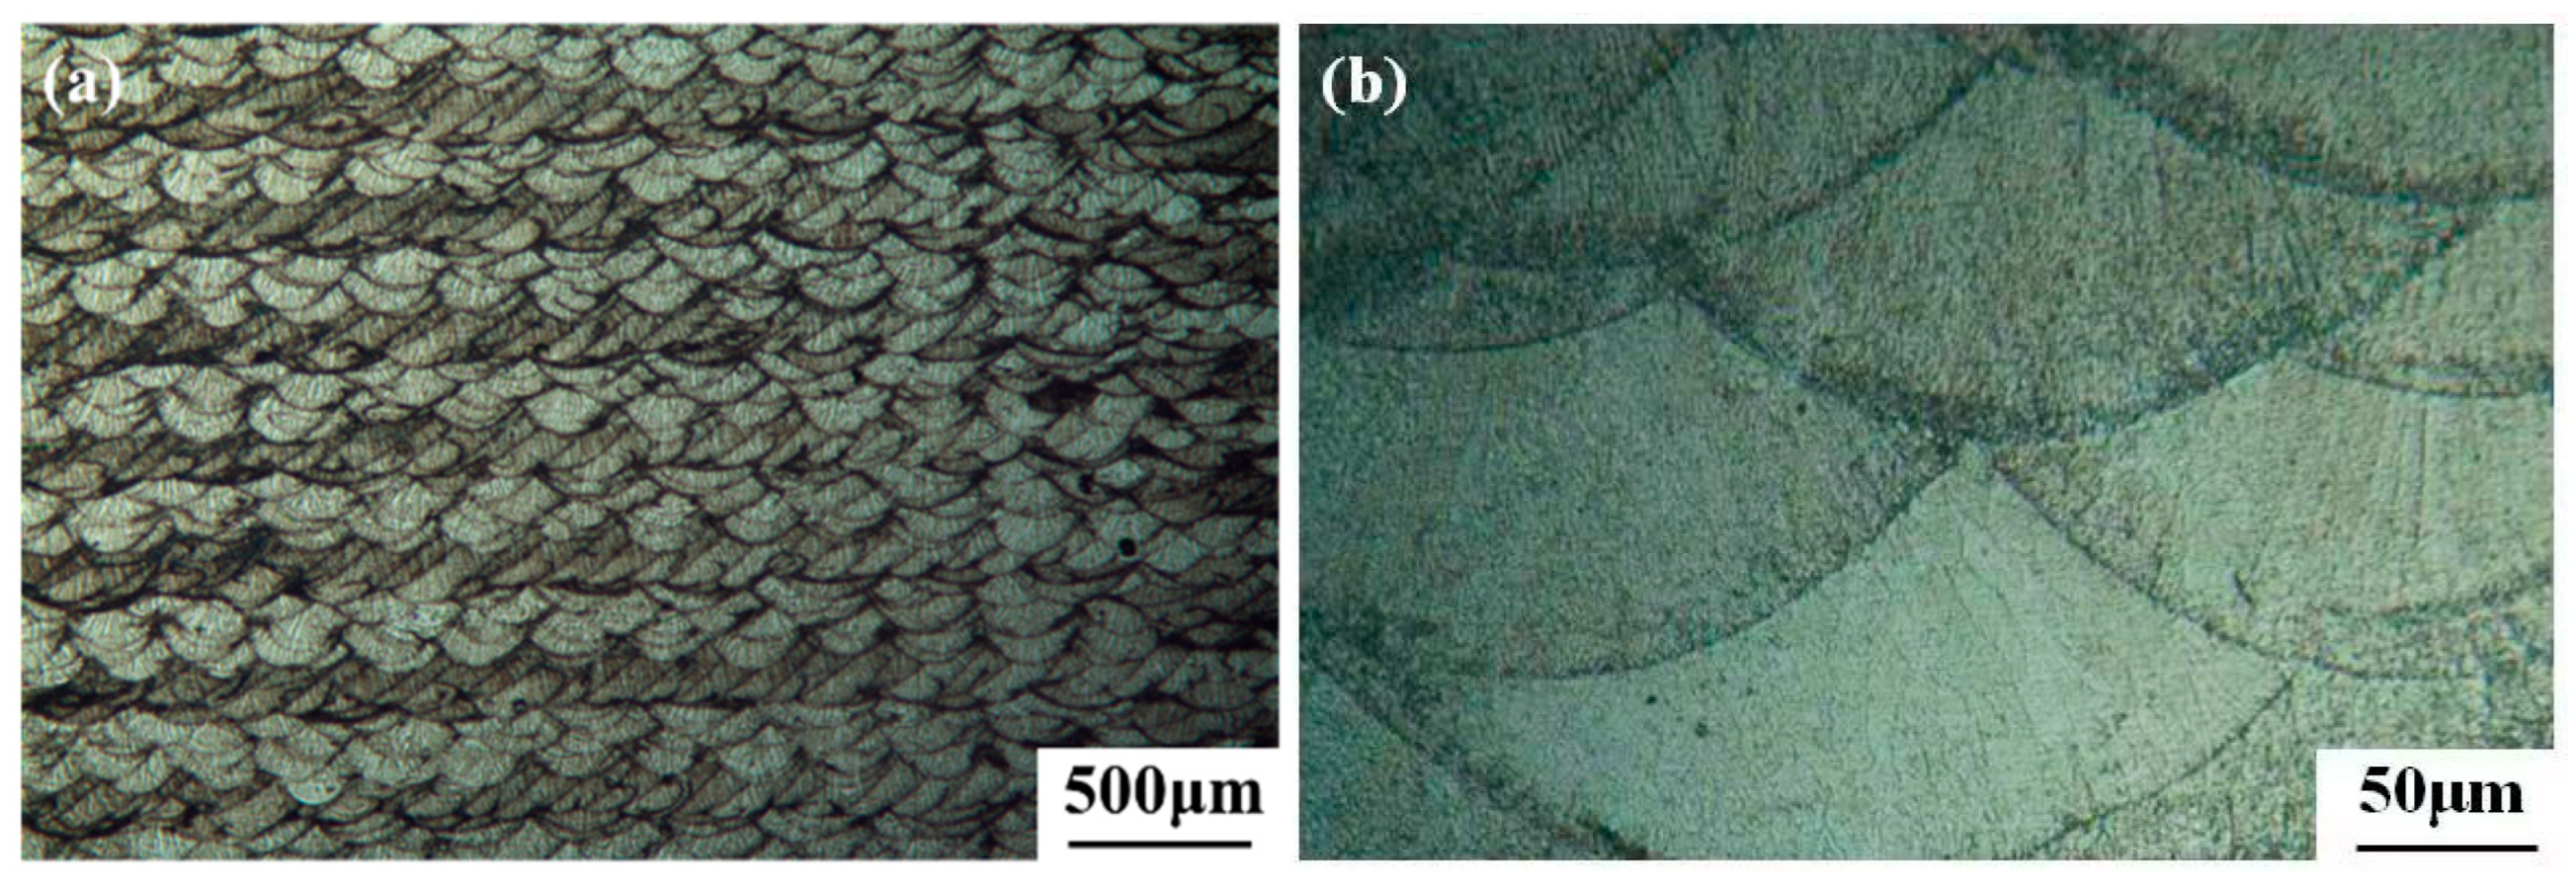
3.3. Microstructure Analysis

Generally, the thermal gradient and solidification rate determine the microstructure, which reflects the molten pool features. The microstructure of the side section of the No. 8 specimen is shown in Figure 6. The microstructure presented a typical stacking distribution of the molten pool of SLMed alloys [25]. The width of the melting pool was about 150 μm. The molten pool’s center was bright white and primarily comprised of columnar grains, as shown in Figure 6b. The growth direction of the columnar grain was perpendicular to the boundary of the molten pool. Fine equiaxed grains made up the majority of the molten pool’s edges. The dense grain boundaries formed a darker area.
Figure 7 presents the secondary electron image (SEI) of the No. 8 specimen. There were numerous white precipitates in the specimen, the majority of which were rod-shaped precipitates along the grain boundaries and granular precipitates within the grains. In Cu-containing aluminum alloys, white rod-shaped or granular Al2Cu precipitates are prevalent phases. Figure 8 shows a higher magnification of SEI and the corresponding elemental distribution of the area within the yellow box. The enrichment of Cu was found where the white precipitates were located. Therefore, the white phase in the SEI was Al2Cu precipitates.

3.4. Mechanical Performance

The hardness values of all SLM-processed specimens were shown in Figure 9. The line chart in the figure shows the average hardness changes with the laser power. The hardness was in the range of 80–100 HV. The average hardness values of the side and cross sections were 90.1 HV and 92 HV, respectively, indicating no obvious anisotropy in the alloy. Zhang et al. studied the mechanical properties of SLMed Al-Cu-Mn alloy and reported that the alloy had no anisotropy in lateral, transverse, and 45° directions. The specimens printed with 300 W laser power seemed to possess the highest hardness. Figure 10 depicts the relationship between VED and hardness. It was noted that there was no strong dependency between them, which may be because the hardness was not only in connection with densification but also related to the precipitates. The hardness reached its maximum value of 99.66 HV when the energy density was 101 J/mm3.
A tensile test was conducted for the No. 8 specimen, and Figure 11 presents the stress–strain curve. The yield strength of the specimen was 266 MPa and ultimate tensile strength was 361 MPa, and the elongation was 5.4%. The No. 8 specimen showed higher strength than the conventional as-cast Al-Cu-Mg alloys [26] and Al-Cu-Mg-Mn alloys [27,28]. This was due to the grain boundary strengthening and solid solution strengthening of elements such as Cu, Mg, and Mn. The precipitation strengthening contributed by Al3Zr and Al2Cu precipitates may also enhance the strength of the designed alloy.

4. Conclusions and Future Work

A novel Al-2Cu-1Mg-3Mn-0.8Zr (wt.%) aluminum alloy was designed and fabricated using SLM. The effect of SLM processing parameters on the densification and hardness of the alloy and defects in the specimens were investigated to determine the optimal fabrication parameters. The microstructure and mechanical properties of the as-built aluminum alloys were also assessed. The results are as follows.
(1)
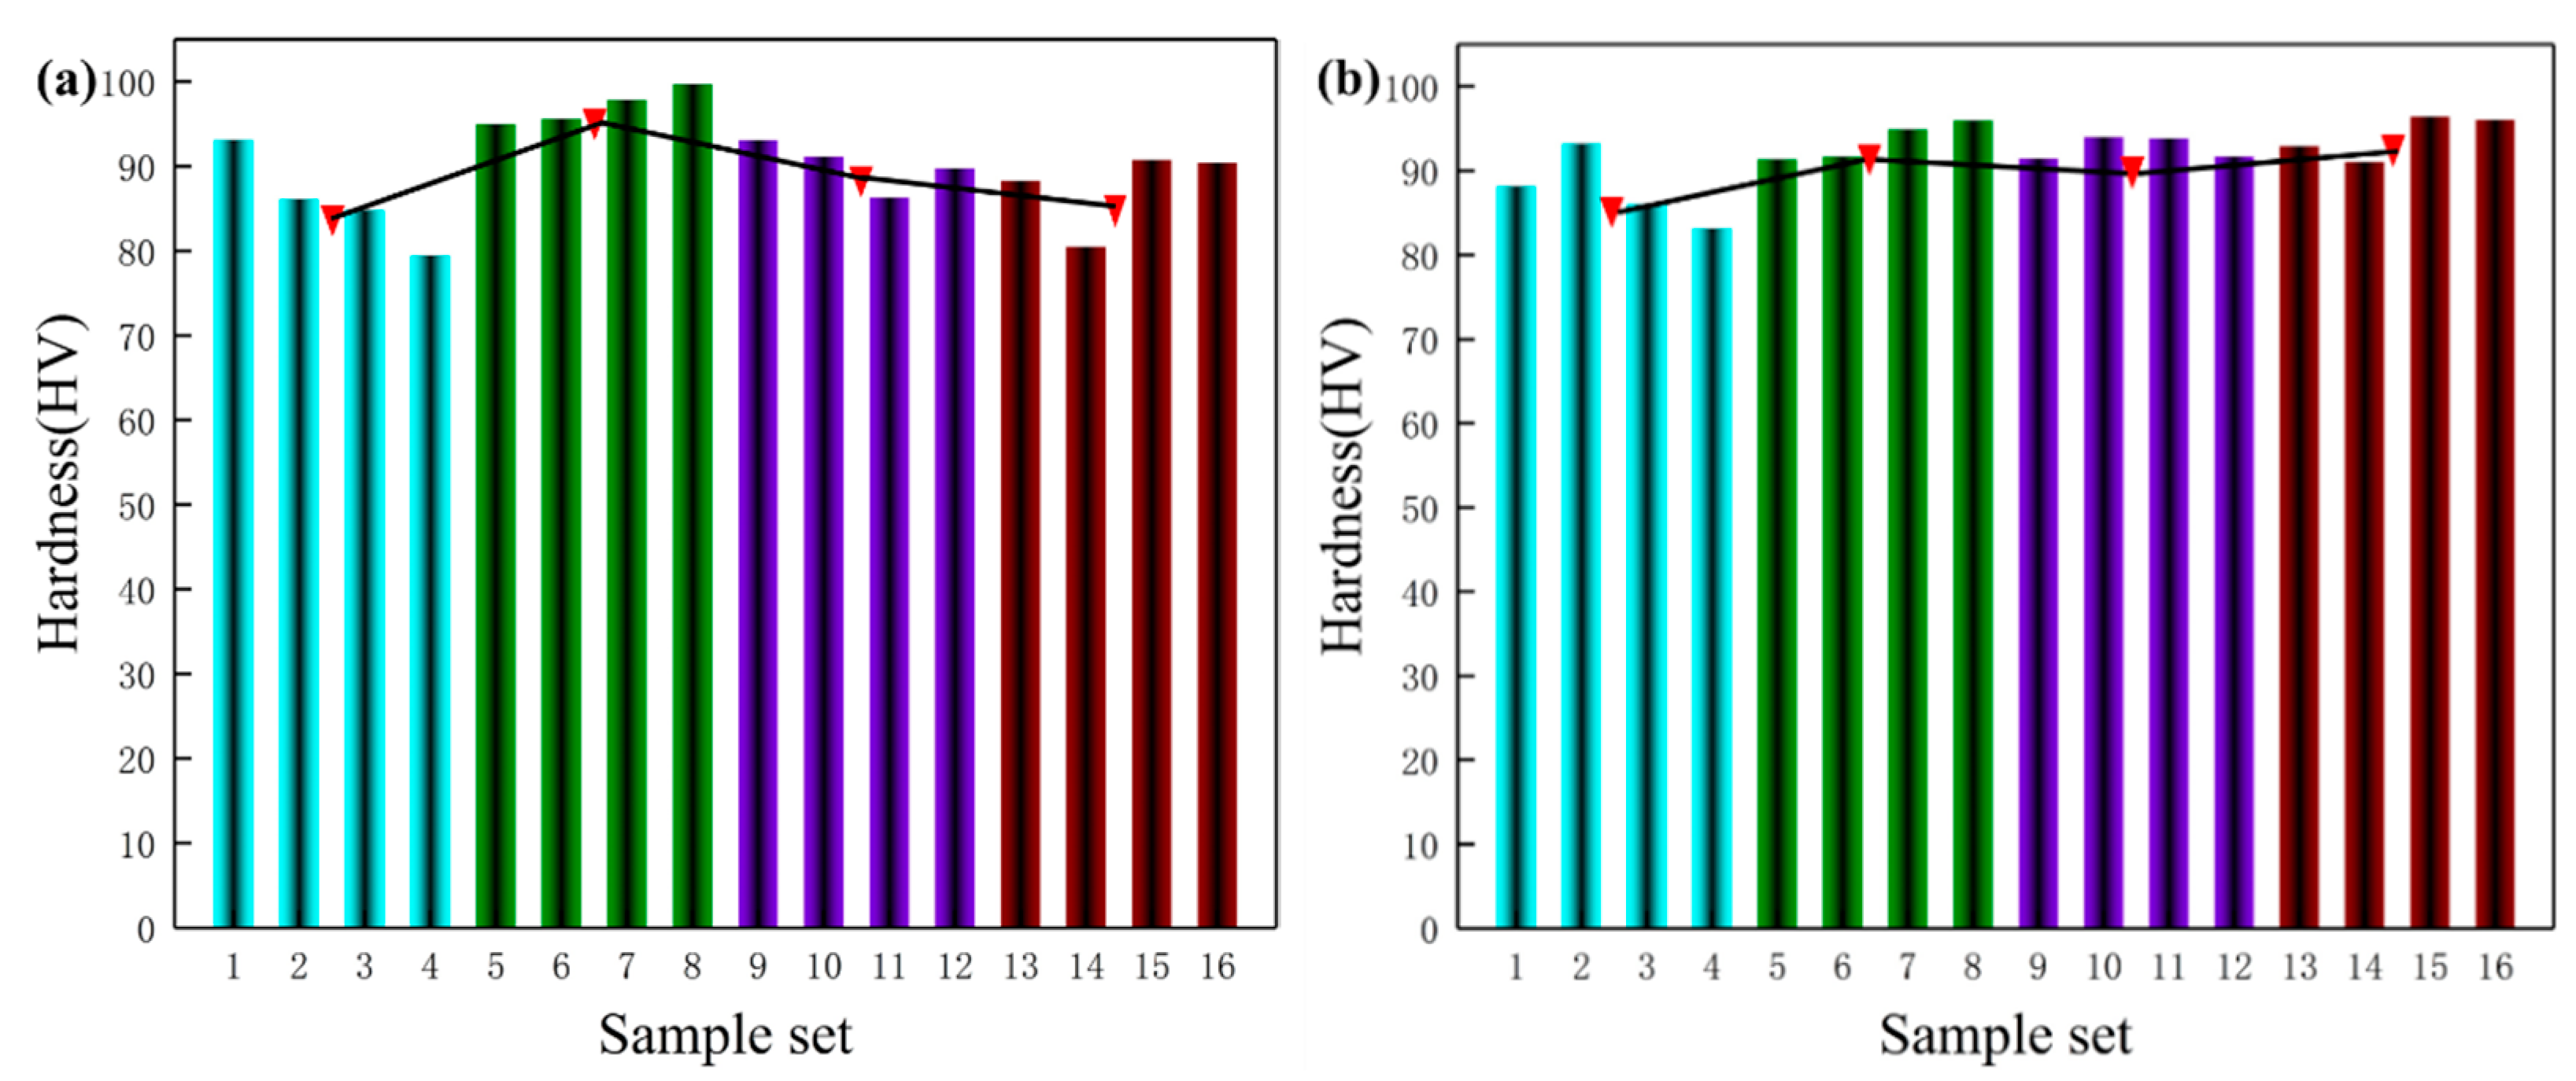
The laser power and scanning speed were the main factors affecting the densification and hardness. The specimen No. 8 (300 W, 1100 mm/s, 0.09 mm) possessed the highest densification of 99.88% and the greatest hardness of 99.66 HV. The fabricating process window was 300–350 W for laser power, 1000–1100 mm/s for scanning speed, and 0.12–0.15 mm for hatch spacing.
(2)
The main defect patterns in the specimens were pores and fractures. The laser power was the most critical parameter for the defect patterns in specimens.
(3)
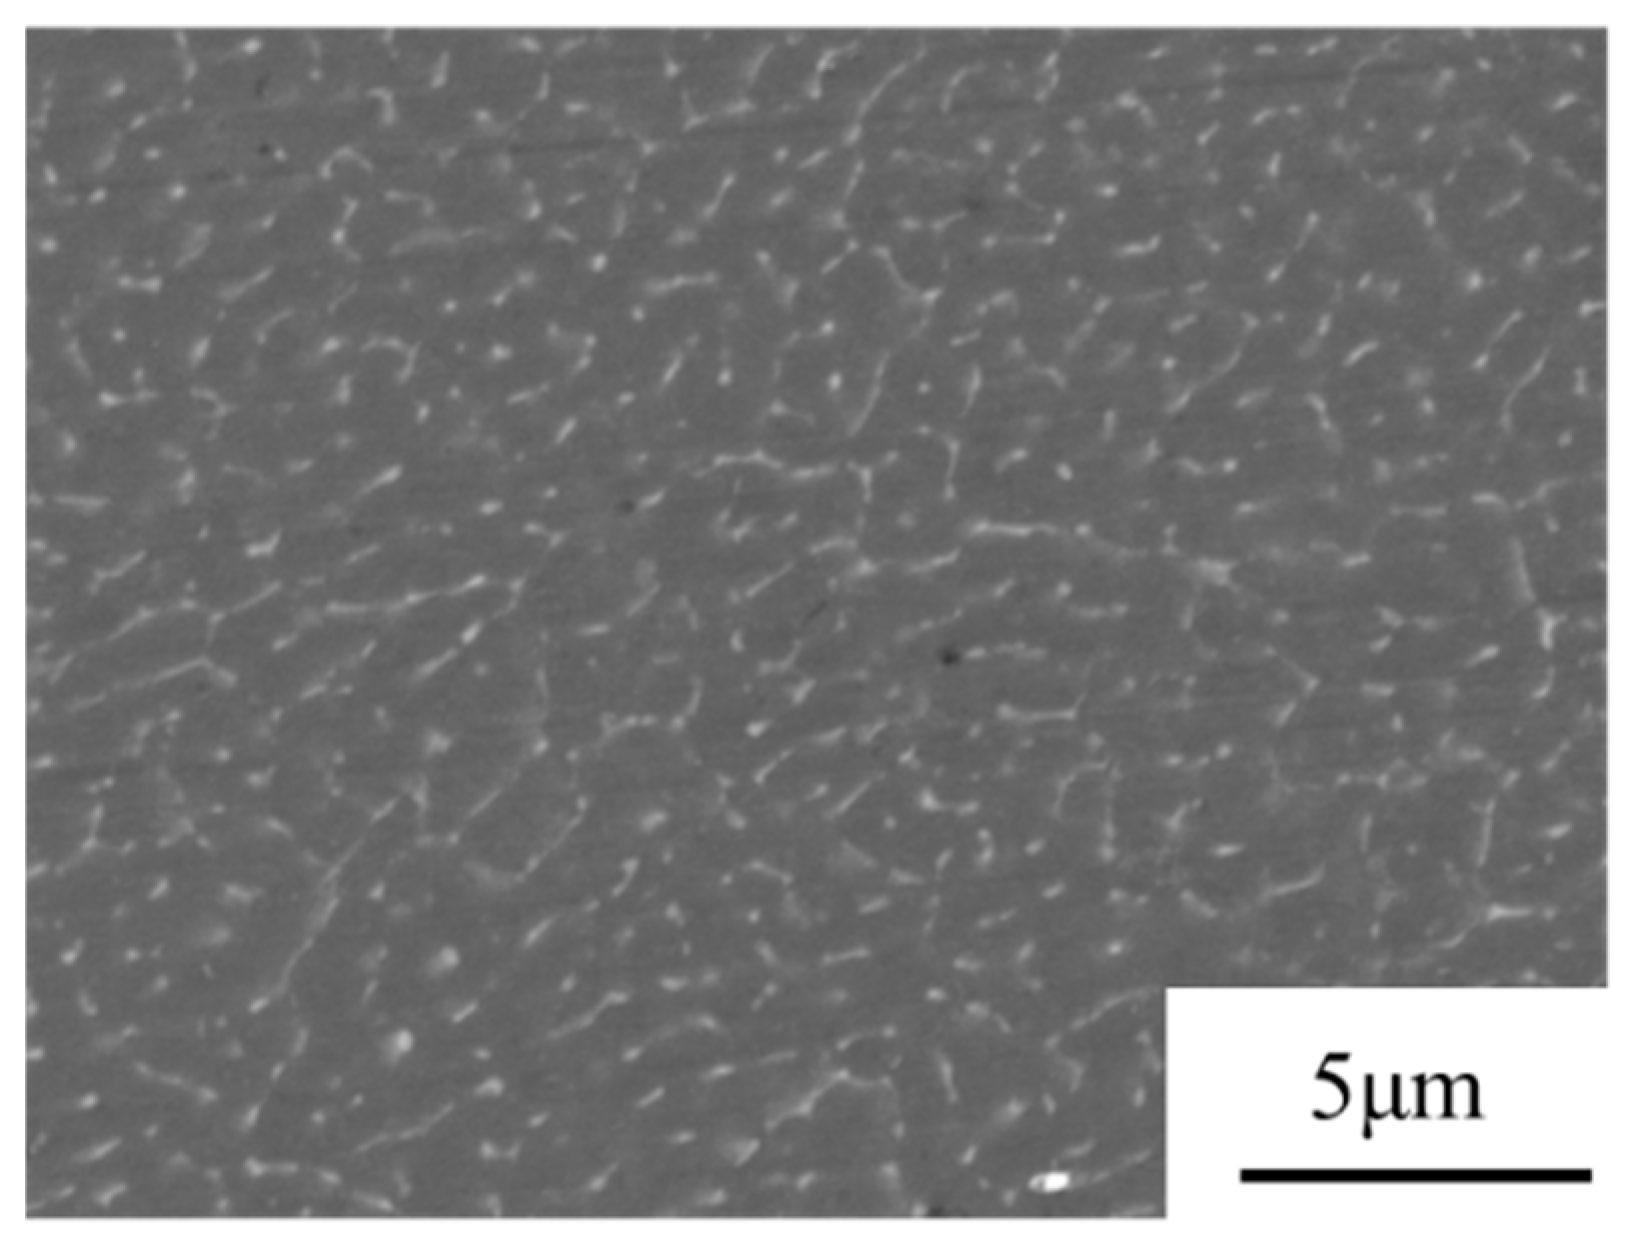
The side-section microstructure of the SLMed specimen presented a typical stacking distribution of molten pools with fine equiaxial grains at the edge of the molten pool and columnar grains in the inner part of the molten pool. The rod-shaped and granular Al2Cu precipitates were found in the SLMed alloy.
(4)
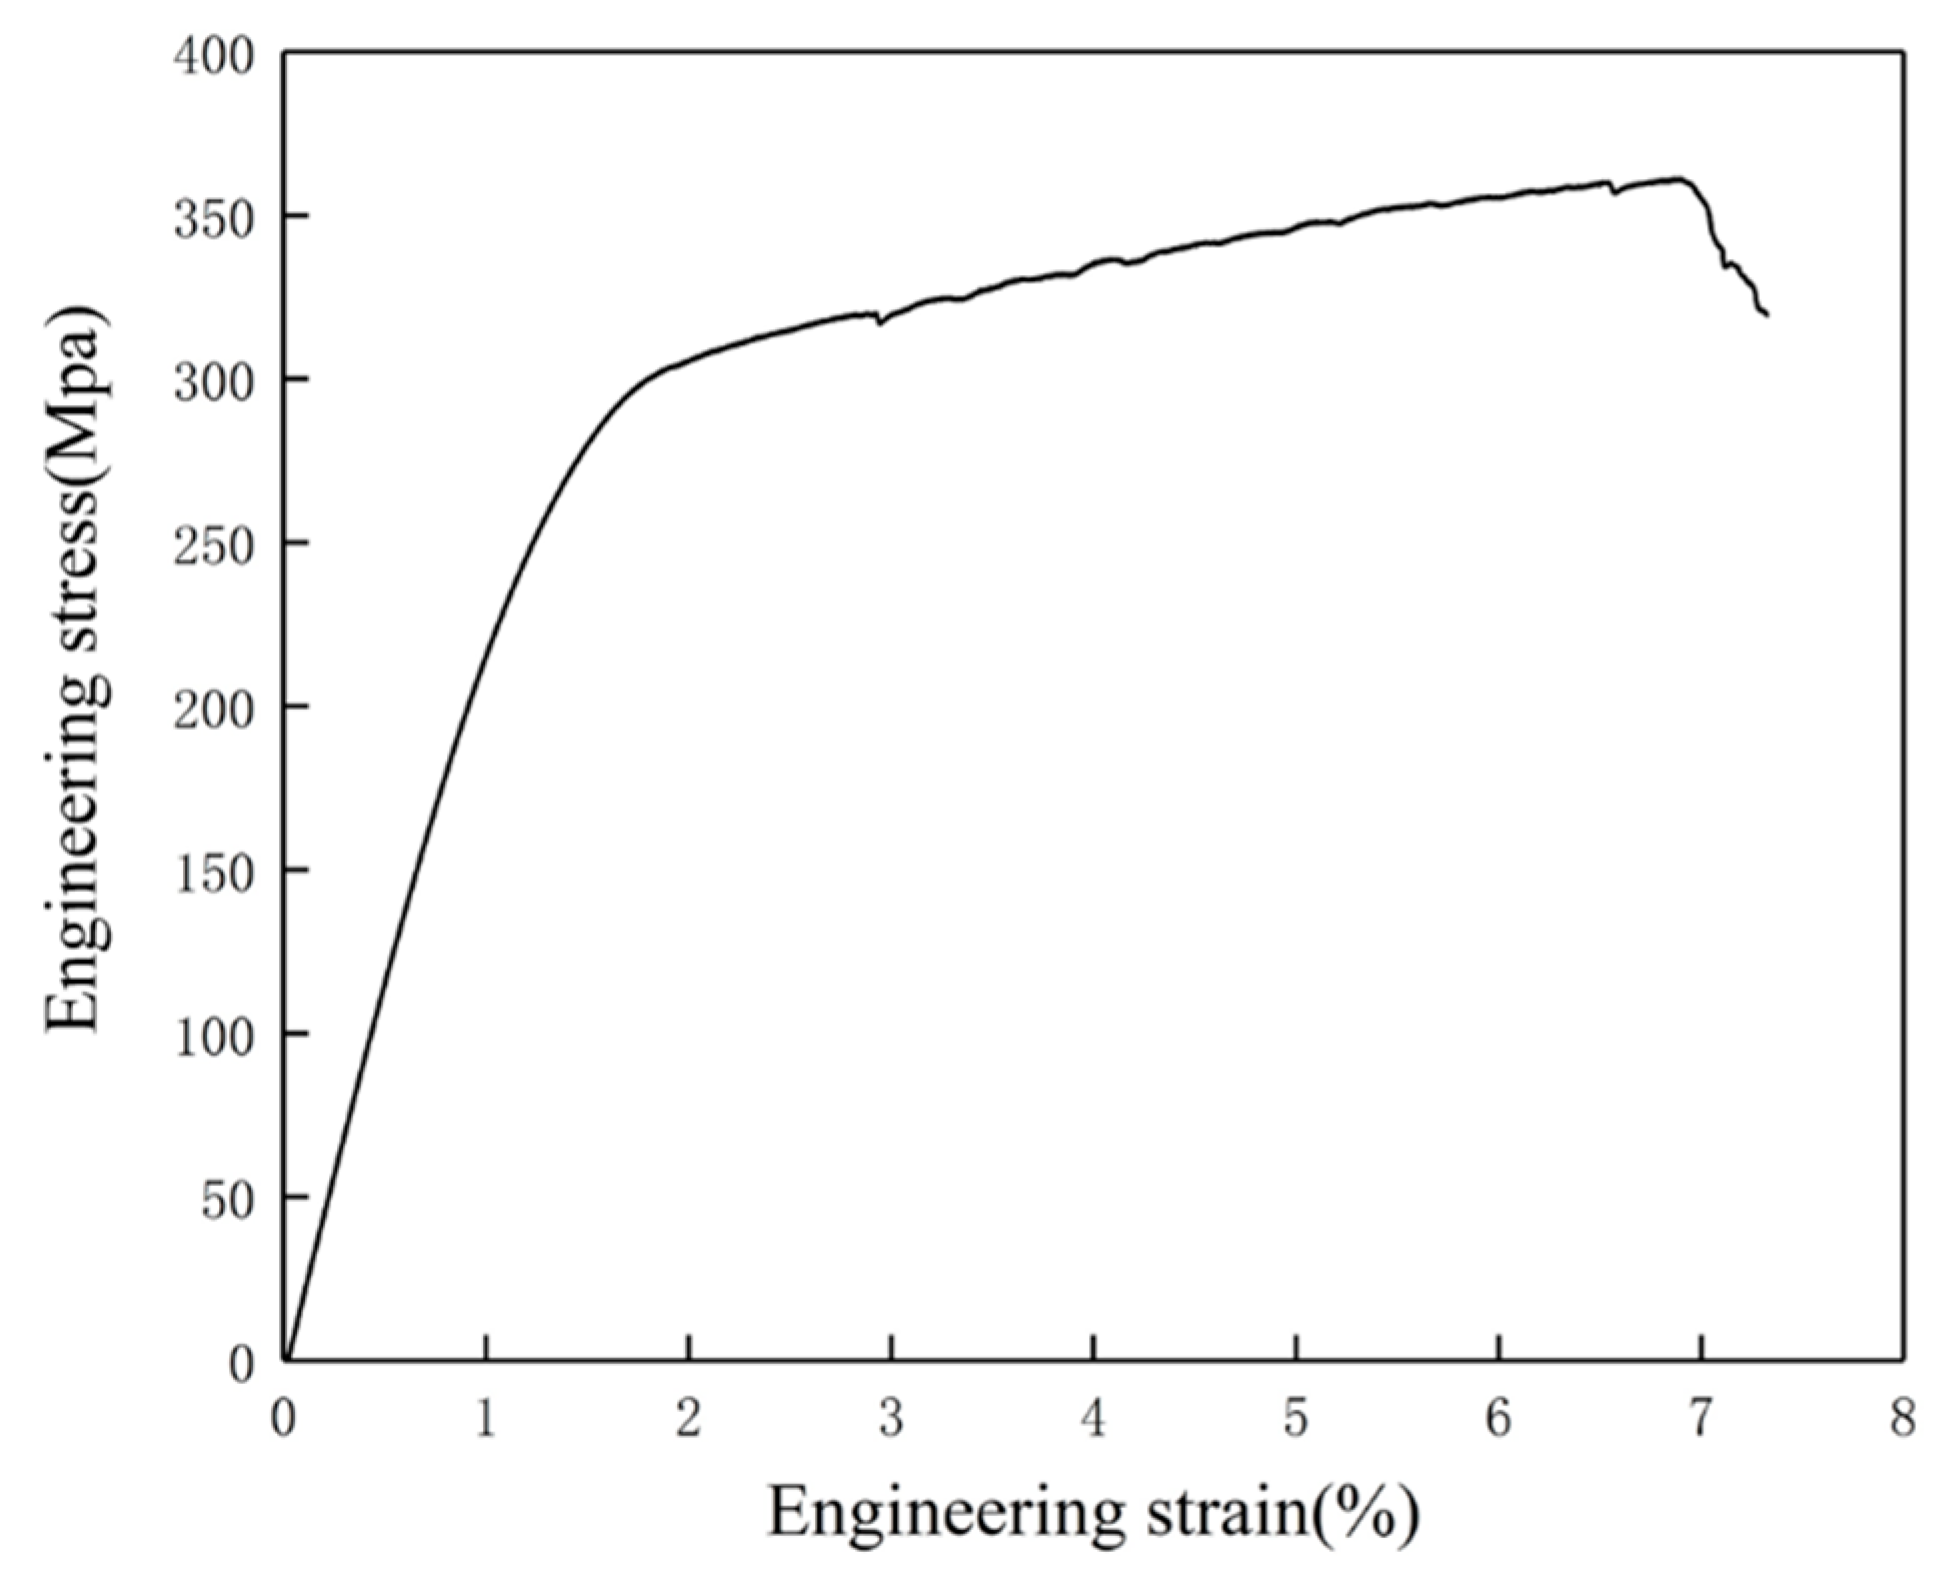
The SLMed Al-Cu-Mg-Mn alloy showed excellent and isotropy mechanical properties, with a hardness of around 100 HV. The tensile and yield strength of the alloy were 361 MPa and 266 MPa, and the elongation was 5.4%.
The size and number of precipitates in the designed alloy can be controlled by heat treatment, which plays an important role in mechanical property improvement. Thus, the influence of different heat treatment conditions on the precipitates and mechanical properties of the alloy will be studied, and the high-temperature tensile strength will be investigated in the future.

Author Contributions

Conceptualization, S.Z. (Shenghua Zhang); methodology, S.Z. (Shenghua Zhang) and Y.W.; formal analysis, S.Z. (Senming Zhang), Z.L. and Y.W.; investigation, S.Z. (Senming Zhang) and F.L.; resources, Z.L.; data curation, F.L.; writing—original draft, S.Z. (Shenghua Zhang); writing—review and editing, S.Z. (Senming Zhang) and B.L.; supervision, S.Z. (Shenghua Zhang) and B.L. All authors have read and agreed to the published version of the manuscript.

Funding

This research was funded by the Fundamental Research Program of Shanxi Province (No. 20210302124100), Research Project Supported by Shanxi Scholarship Council of China (No. 2023-142), and the High-level Talent Fund of North University of China (No. 11013102).

Data Availability Statement

Not applicable.

Conflicts of Interest

The authors declare no conflict of interest.

References

  1. Wang, X.J.; Zhang, L.C.; Fang, M.H.; Sercombe, T.B. The effect of atmosphere on the structure and properties of a selective laser melted Al-12Si alloy. Mater. Sci. Eng. A 2014, 597, 370–375. [Google Scholar]
  2. Olakanmi, E.O.; Cochrane, R.F.; Dalgarno, K.W. A review on selective laser sintering/melting (SLS/SLM) of aluminium alloy powders: Processing, microstructure, and properties. Prog. Mater. Sci. 2015, 74, 401–477. [Google Scholar]
  3. Montero Sistiaga, M.L.; Mertens, R.; Vrancken, B.; Wang, X.; Van Hooreweder, B. Changing the alloy composition of Al7075 for better processability by selective laser melting. J. Mater. Process. Technol. 2016, 238, 437–445. [Google Scholar]
  4. Michi, R.A.; Plotkowski, A.; Shyam, A. Towards high-temperature applications of aluminium alloys enabled by additive manufacturing. Int. Mater. Rev. 2022, 67, 298–345. [Google Scholar]
  5. Gu, D.; Shi, X.; Poprawe, R. Material-structure-performance integrated laser-metal additive manufacturing. Science 2021, 372, 1487. [Google Scholar]
  6. Macías, J.G.S.; Douillard, T.; Zhao, L. Influence on microstructure, strength and ductility of build platform temperature during laser powder bed fusion of AlSi10Mg. Acta Mater. 2020, 201, 231–243. [Google Scholar]
  7. Schmidtke, K.; Palm, F.; Hawkins, A. Process and mechanical properties: Applicability of a scandium modified Al-alloy for laser additive manufacturing. Phys. Procedia 2011, 12, 369–374. [Google Scholar] [CrossRef]
  8. Shyam, A.; Plotkowski, A.; Bahl, S. An additively manufactured Al-Cu-Mn-Zr alloy microstructure and tensile mechanical properties. Materialia 2020, 12, 100758. [Google Scholar] [CrossRef]
  9. Agrawal, P.; Gupta, S.; Thapliyal, S. Additively manufactured novel Al-Cu-Sc-Zr alloy: Microstructure and mechanical properties. Addit. Manuf. 2021, 37, 101623. [Google Scholar]
  10. Li, W.; Li, S.; Liu, J.; Zhang, A.; Zhou, Y.; Wei, Q.; Yan, C.; Shi, Y. Effect of heat treatment on AlSi10Mg alloy fabricated by selective laser melting. Microstructure evolution, mechanical properties and fracture mechanism. Mater. Sci. Eng. A 2016, 663, 116–125. [Google Scholar]
  11. Thijs, L.; Kempen, K.; Kruth, J.P.; Van Humbeeck, J. Fine-structured aluminium products with controllable texture by selective laser melting of pre alloyed AlSi10Mg powder. Acta Mater. 2013, 61, 1809–1819. [Google Scholar] [CrossRef]
  12. Delroisse, P.; Jacques, P.J.; Maire, E.; Rigo, O.; Simar, A. Effect of strut orientation on the microstructure heterogeneities in AlSi10Mg lattices processed by selective laser melting. Scr. Mater. 2017, 141, 32–35. [Google Scholar] [CrossRef]
  13. Han, X.; Zhu, H.; Nie, X.; Wang, G.; Zeng, X. Investigation on selective laser melting AlSi10Mg cellular lattice strut: Molten pool morphology, surface roughness and dimensional accuracy. Materials 2018, 11, 392. [Google Scholar] [CrossRef] [PubMed]
  14. Liu, S.; Zhu, H.; Peng, G.; Yin, J.; Zeng, X. Microstructure prediction of selective laser melting AlSi10Mg using finite element analysis. Mater. Des. 2018, 142, 319–328. [Google Scholar]
  15. Suryawanshi, J.; Prashanth, K.G.; Scudino, S.; Eckert, J.; Prakash, O.; Ramamurty, U. Simultaneous enhancements of strength and toughness in an Al-12Si alloy synthesized using selective laser melting. Acta Mater. 2016, 115, 285–294. [Google Scholar]
  16. Wang, J.; Zhang, S.; Lu, R. A crack-free and high-strength Al-Cu-Mg-Mn-Zr alloy fabricated by laser powder bed fusion. Mater. Sci. Eng. A 2022, 854, 143731. [Google Scholar]
  17. Croteau, J.R.; Griffiths, S.; Rossell, M.D. Microstructure and mechanical properties of Al-Mg-Zr alloys processed by selective laser melting. Acta Mater. 2018, 153, 35–44. [Google Scholar]
  18. Griffiths, S.; Croteau, J.R.; Rossell, M.D. Coarsening and creep resistance of precipitation-strengthened Al-Mg-Zr alloys processed by selective laser melting. Acta Mater. 2020, 188, 192–202. [Google Scholar] [CrossRef]
  19. Spierings, A.B.; Dawson, K.; Heeling, T. Microstructural features of Sc- and Zr-modified Al-Mg alloys processed by selective laser melting. Mater. Des. 2017, 115, 52–63. [Google Scholar]
  20. Li, R.; Wang, M.; Yuan, T. Selective laser melting of a novel Sc and Zr modified Al-6.2 Mg alloy: Processing, microstructure, and properties. Powder Technol. 2017, 319, 117–128. [Google Scholar] [CrossRef]
  21. Jia, Q.; Rometsch, P.; Kürnsteiner, P. Selective laser melting of a high strength Al-Mn-Sc alloy: Alloy design and strengthening mechanisms. Acta Mater. 2019, 171, 108–118. [Google Scholar]
  22. Gao, Y.H.; Yang, C.; Zhang, J.Y. Stabilizing nanoprecipitates in Al-Cu alloys for creep resistance at 300 C. Mater. Res. Lett. 2019, 7, 18–25. [Google Scholar] [CrossRef]
  23. Zhang, H.; Zhu, H.; Qi, T.; Hu, Z.; Zeng, X. Selective laser melting of high strength Al–Cu–Mg alloys: Processing, microstructure and mechanical properties. Mater. Sci. Eng. A 2016, 656, 47–54. [Google Scholar]
  24. Galy, C.; Le Guen, E.; Lacoste, E. Main defects observed in aluminum alloy parts produced by SLM: From causes to consequences. Addit. Manuf. 2018, 22, 165–175. [Google Scholar]
  25. Aboulkhair, N.T.; Simonelli, M.; Parry, L. 3D printing of Aluminium alloys: Additive Manufacturing of Aluminium alloys using selective laser melting. Prog. Mater. Sci. 2019, 106, 100578. [Google Scholar]
  26. Zhang, H.; Zhu, H.; Nie, X.; Yin, J.; Hu, Z.; Zeng, X. Effect of Zirconium addition on crack, microstructure and mechanical behavior of selective laser melted Al-Cu-Mg alloy. Scr. Mater. 2017, 134, 6–10. [Google Scholar] [CrossRef]
  27. Li, C.M.; Lin, Z.Y.; Zhang, C.J. Effect of homogenization treatment on microstructure and properties of Al-Cu-Mg alloy. Chin. J. Las. 2020, 41, 62–67. [Google Scholar]
  28. Bao, L. Investigation on Effect of Zr Element on Al-Cu-Mg-Mn Aluminum Alloy Texture; Shenyang Institute of Aeronautical Engineering: Shenyang, China, 2007; pp. 42–48. [Google Scholar]
Figure 1. Microscopic morphology of the Al-Cu-Mg-Mn alloy powder. (a) low magnification, (b) hiah magnification.
Metals 13 01520 g001
Figure 2. Dimensions of tensile specimens.
Metals 13 01520 g002
Figure 3. Relation between laser energy density and densification of Al-Cu-Mn-Mg alloy.
Metals 13 01520 g003
Figure 4. Side section optical micrographs of SLMed specimens.
Metals 13 01520 g004
Figure 5. Densification of SLMed samples.
Metals 13 01520 g005
Figure 6. Side section microstructure of the No. 8 specimen: (a) low magnification; (b) high magnification.
Metals 13 01520 g006
Figure 7. SEI result of No. 8 specimen.
Metals 13 01520 g007
Figure 8. Elements distribution in No. 8 specimen.
Metals 13 01520 g008
Figure 9. Vickers hardness of the SLMed specimens: (a) cross sections; (b) side sections.
Metals 13 01520 g009
Figure 10. Relation between laser energy density and hardness of all specimens.
Metals 13 01520 g010
Figure 11. Stress–strain curve of the No. 8 specimen.
Metals 13 01520 g011
Table 1. Chemical composition of Al-Cu-Mg-Mn alloy powder.
ElementCuMnMgZrAl
Mass fraction/%1.053.180.960.81Bal.
Table 2. Factors and levels orthogonal table.
FactorLaser Power
A (W)
Scanning Speed
B (mm/s)
Hatch Spacing
C (mm)
Level 12508000.09
Level 23009000.12
Level 335010000.15
Level 440011000.18
Table 3. Orthogonal test design table.
Sample No.Laser Power
A (W)
Scanning Speed
B (mm/s)
Hatch Spacing
C (mm)
Densification
(%)
Hardness
(HV)
12508000.0999.44 93.10
22509000.1297.70 86.12
325010000.1599.38 84.80
425011000.1899.26 79.44
53008000.1299.59 94.96
63009000.1599.85 95.58
730010000.1899.85 97.84
830011000.0999.88 99.66
93508000.1598.91 93.06
103509000.1898.87 91.12
1135010000.0998.36 86.26
1235011000.1299.45 89.74
134008000.1894.22 88.24
144009000.0995.01 80.48
1540010000.1298.37 90.72
1640011000.1599.64 90.40
Table 4. Densification range analysis.
No.Laser Power
A (W)
Scanning Speed
B (mm/s)
Hatch Spacing
C (mm)
K1395.78 392.16 392.69
K2399.17 391.44 395.11
K3395.59 395.96 397.79
K4387.24 398.23 392.20
k198.95 98.04 98.17
k299.79 97.86 98.78
k398.90 98.99 99.45
k496.81 99.56 98.05
Range2.98 1.70 1.40
Table 5. Hardness range analysis.
No.Laser Power
A (W)
Scanning Speed
B (mm/s)
Hatch Spacing
C (mm)
K1343.46369.36359.50
K2388.04353.30361.54
K3360.18359.62363.84
K4349.84359.24356.64
k185.8792.3489.88
k297.0188.3390.39
k390.0589.9190.96
k487.4689.8189.16
Range11.154.021.80
Disclaimer/Publisher’s Note: The statements, opinions and data contained in all publications are solely those of the individual author(s) and contributor(s) and not of MDPI and/or the editor(s). MDPI and/or the editor(s) disclaim responsibility for any injury to people or property resulting from any ideas, methods, instructions or products referred to in the content.

