Article

Intergranular Corrosion Analysis of Austenitic Stainless Steels in Molten Nitrate Salt Using Electrochemical Characterization

by
Noparat Kanjanaprayut
,
Thamrongsin Siripongsakul
and
Piyorose Promdirek
*
Department of Materials and Production Technology Engineering, Faculty of Engineering, King Mongkut’s University of Technology North Bangkok, 1518, Pracharat 1 Road, Wongsawang, Bangsue, Bangkok 10800, Thailand
*
Author to whom correspondence should be addressed.
Metals 2024, 14(1), 106; https://doi.org/10.3390/met14010106
Submission received: 4 December 2023 / Revised: 5 January 2024 / Accepted: 11 January 2024 / Published: 16 January 2024
(This article belongs to the Special Issue Electrochemical Analysis of Metal Corrosion)

Abstract

:
This study investigates the influence of molten nitrate salt exposure on the intergranular corrosion (IGC) behavior of three grades of austenitic stainless steel (namely, AISI 304, AISI 304H, and AISI 321H). Two electrochemical techniques, double loop electrochemical potentiokinetic reactivation and potentiodynamic polarization methods, are applied after stainless steel is exposed to 600 °C molten nitrate salt, 60% NaNO3, and 40% KNO3 for varying immersion durations. Corrosion morphology is examined using optical microscopy and scanning electron microscopy images to assess susceptibility to IGC. IGC is prompted by the presence of chromium carbides at grain boundaries, which leads to chromium depletion around these carbides. The findings of the experiments reveal distinct IGC behavior among stainless steel grades. For AISI 304, the degree of sensitization (DOS) increases as exposure time progresses. However, AISI 304H and AISI 321H stainless steel exhibit diminishing DOS after 100 and 10 h of exposure, respectively. This trend is attributed to desensitization or the healing effect when stainless steel is exposed to molten salt for a prolonged time. The depletion and recovery of Cr near grain boundaries are confirmed by the inverse relationship to DOS of pitting potential.

1. Introduction

Concentrated solar power (CSP) has been intensively explored to develop alternative, clean, and renewable energy sources, and it is recognized as one of the important technologies due to its high potential. The International Energy Agency (IEA) has set a power generation target for CSP technologies of 630 GW by 2050 [1,2]. The CSP system is based on the solar power principle. The irradiation is focused onto the receiver using a programmable mirror (heliostat) where heat carrier energy, also known as heat transfer fluid (HTF), collects heat. The HTF can drive a turbine directly or, more often, be coupled with a turbine to create energy. Secondary circuits and heat exchangers are used to generate steam. As a result, the CSP system includes several systems, such as HTF, thermal energy storage (TES), and HTF pipelines, among many others [3,4,5,6].
One of the solar salts is a molten nitrate salt used as an HTF by the combination of 60% NaNO3 and 40% KNO3. It has a temperature range of 400 to 600 °C [7,8]. However, when exposed to molten salt, the substance violently corrodes. As a result, durable materials with reasonable costs, such as stainless steel, are becoming increasingly demanded for CSP systems. Austenitic stainless steel is widely used in industries for materials such as boiler tubes, heat exchangers, and high-temperature components due to its excellent creep strength [9,10]. At present, molten nitrate salts and austenitic stainless steels have been applied in CSP systems that operate commercially. Moreover, the research on materials and degradation is of interest to extend the service life of CSP system components [11,12,13,14,15,16]. Wang et al. studied the corrosion of AISI 310S, AISI 316L, and AISI 321 in a quaternary molten KNO3-NaNO2-NaNO3-KCl salt at 500 °C. They reported that 316L and 321 had obvious Cr depletion regions, resulting in intergranular corrosion [11]. Federsel et al. investigated the corrosion behavior of AISI 321 and Inconel 600 exposed to HIITEC (nitrate nitrite molten salt) at 530 °C and found a dense oxide layer on the surface of AISI 321, while corrosion was observed along grain boundaries of Inconel 600 [15]. According to Ren, when exposed to ternary molten NaCl-KCl-MgCl2 salt at 700 °C, carburized AISI 316 experienced more severe IGC than uncarburized AISI 316 [16].
As carbon can potentially contribute to IGC in stainless steel due to chrome carbide formation, when stainless steel is heated to temperatures between 482 and 815 °C, susceptibility to IGC occurs. Carbon inside the grain diffuses to grain boundaries; when it is combined with chromium, it forms chrome carbide, resulting in chromium deficiency in the region around chrome carbide [17,18]. As a result, the region is prone to corrosion and is likely to develop an intergranular stress corrosion cracking (IGSCC) corrosion model, which poses a significant risk of equipment damage at the CSP plant. Double loop electrochemical potentiokinetic reactivation (DL-EPR) testing is a critical non-destructive testing approach to evaluate IGC susceptibility risk. Aydoğdu et al. reported the relationship between the step, dual, and ditch microstructures of the oxalic test and the DOS measured with DL-EPR in the analysis of IGC susceptibility of AISI 316 after sensitization in air at 650 °C and 1050 °C. The authors proposed the DL-EPR test parameters, which correlated well with the acid test results [18]. Liu et al. applied DL-EPR to quantify the IGC susceptibility of stainless steel and Ni-based alloys exposed to air or molten nitrate salts at 550–750 °C. The authors found that IN 625 had satisfying IGC resistance in air but high IGC susceptibility in molten salt. This was evaluated from DL-EPR DOS of 0% and 30.4% after exposure at 650 °C for two hours, respectively, while the DOS of AISI 321 and AISI 347 were 0.34% and 1.09%, respectively, after exposure to molten salt at 650 °C for two hours [19].
Austenitic stainless steels are likely to be a good choice for application in CSP plants. However, to date, limited research has been conducted on the IGC susceptibility of stainless steel after prolonged exposure to molten salts. This study aims to assess the IGC susceptibility of three austenitic stainless steel grades, AISI 304, AISI 304H, and AISI 321H, in such an environment for up to 300 h. The oxalic test and DL-EPR testing are used to evaluate if austenitic stainless steels are susceptible to IGC due to exposure to molten nitrate salt at 600 °C for a period of time. Furthermore, in order to validate the results of both methods regarding IGC susceptibility detection, metallographic etching and pitting potential analysis were used.

2. Materials and Methods

The experiment was conducted with three grades of austenitic stainless steel (AISI 304, AISI 304H, and AISI 321H) received from a supplier. Although AISI 304H and 321H are not well documented, they are known as high-carbon-content variants of alloys (AISI 304 and AISI 321), possibly containing some Cu. A standard spark-optical emission spectrometer was used to confirm the chemical composition. Table 1 shows the analyzed results. Although AISI 304L is more commonly applied against IGC due to its lower carbon content, in this study, AISI 304, which has a similar carbon content to AISI 304H and AISI 321H, is chosen to focus on the effects of alloying elements.
A sample is prepared in the size of 15 × 50 × 15 mm3. It was prepared by grinding it with 80 to 500 grit emery paper, washing it with DI water and acetone, and finally drying it in hot air before exposure to molten nitrate salt. The exposure times in molten salt are 1, 10, 100, and 300 h at 600 °C. Laboratory grade 60wt% NaNO3 + 40wt% KNO3 was used as the nitrate salt in this study.

2.1. Microstructure Analysis

A stainless steel sample is exposed to molten salt at 600 °C for various times before being investigated on the microstructure. In preparation, a sample surface is polished with 120- to 1200-grit emery paper and finely polished with alumina powder 0.3 µm in diameter. It is finally degreased with acetone. This process removes impurities and salt stains. To investigate the heat effect on IGC, the sample was finely polished to achieve a mirror surface. Microstructure analysis involves two experiments: carbide precipitation and IGC investigation. As described in ASTM E407, the microstructure with carbide precipitation is revealed using the Glyceregia etchant [20].
In the IGC investigation, the oxalic acid test is usually applied to materials with microstructures exhibiting ditches. This is in accordance with ASTM A262 practice A [21]. An oxalic acid test is conducted by soaking the prepared samples for 1.5 min in 10% oxalic acid with an applied current of 1 A/cm2. This approach is a rapid and simple physical examination for determining IGC susceptibility. The microstructure is then recorded by a standard optical microscope at a magnification of 200. To confirm carbide formation, a standard scanning electron microscope (SEM), TESCAN MIRA3 series, (TESCAN, Brno, Czech Republic), with energy dispersion spectroscopy (EDS) was used.

2.2. DL-EPR Measurement

In electrochemical investigations, a VSP300 potentiostat Electrochemical Workstation (BioLogic, Seyssinet-Pariset, France) is employed. Three electrodes are loaded into the test cell: a saturated calomel electrode (SCE) for the reference electrode, a platinum plate for the counter electrode, and a sample for the working electrode. The sample is exposed to solution through a 6 mm diameter circular window in the test cell. Prior to testing, samples must be prepared by grinding with 120- to 1200-grit emery paper, polishing with 0.3 µm alumina powder, and degreasing with acetone. The DOS of heat-treated samples is evaluated at room temperature in a solution of 0.5 M H2SO4 + 0.01 M KSCN using the DL-EPR test method. After 5 min, the sample has been exposed to the test solution, and its open circuit potential becomes stable. Then, the measurement starts by scanning the forward potential from the corrosion potential (Ecorr) to 0.3 V/SCE, then reverses to Ecorr at a scan rate of 60 mV/min until the corrosion potential is reached. The solution used in the test, including other parameters, is recommended in literature to achieve a consistent result [18,22]. A schematic diagram of the DL-EPR plot is shown in Figure 1. In DOS calculations, activation peak current density (Ia) and reactivation peak current density (Ir) represent the maximum current density during forward and reverse scanning, respectively, and will be used in Equation (1). In addition to DL-EPR measurements, samples are also microstructurally observed and analyzed using SEM with EDS before and after the test.
DOS = I r I a × 100 %

2.3. Pitting Potential Measurement

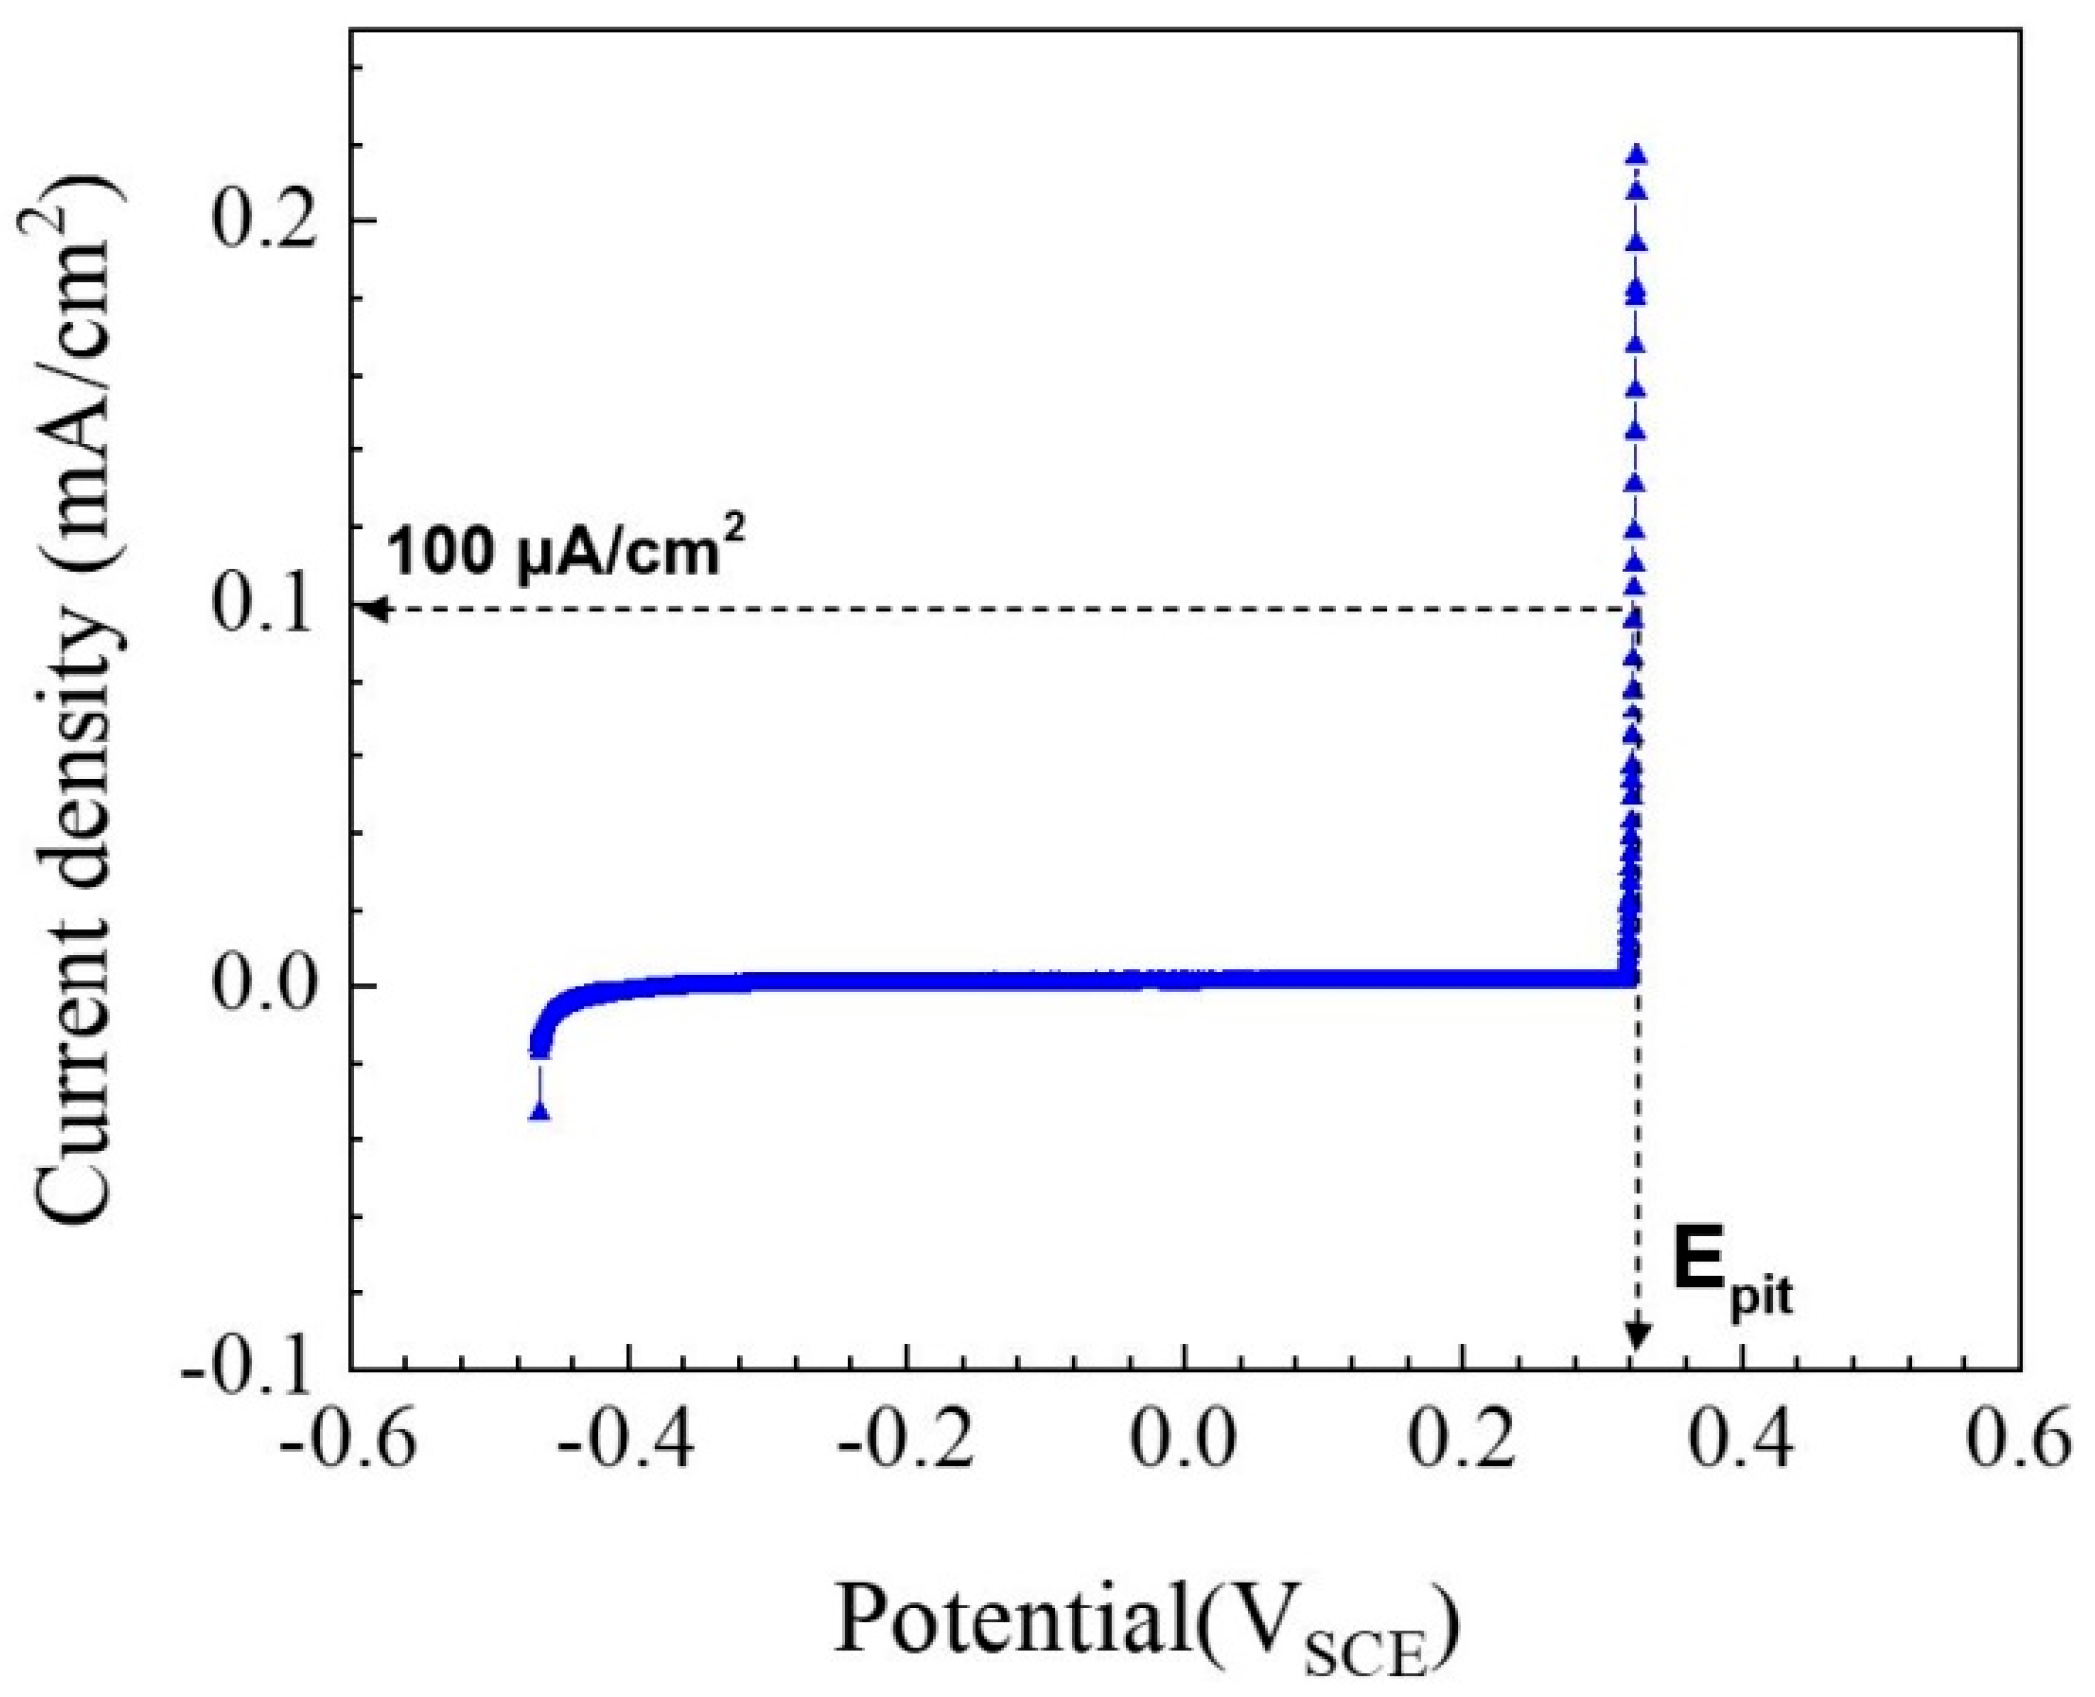
Pitting potential (Epit) is evaluated through flat-cell corrosion testing. This procedure includes a working electrode serving as the test sample, a platinum auxiliary electrode, and a reference electrode represented by the SCE. The test sample is loaded into the test cell, which provides a window 6 mm wide for exposure to solution. Testing is conducted in a solution of 3.5% sodium chloride using potentiodynamic polarization. The process is controlled by an EC-Lab program using a potentiostat model VSP300. A test begins at −150 mV relative to Ecorr and proceeds until a specified potential is reached. The current density was measured up to 200 µA/cm2, with a scan rate of 60 mV/min. The resulting data formed a polarization curve from which an Epit could be determined at a current density of 100 µA/cm2 [23,24]. Figure 2 shows a schematic representation of the potentiodynamic polarization plot.

3. Results and Discussion

3.1. Microstructure Analysis

3.1.1. Chromium Carbide Formation

Chromium carbide formation in austenitic stainless steels, AISI 304, AISI 304H, and AISI 321H, was investigated using SEM after immersion in a salt melt for 300 h at 600 °C. To facilitate the detectability of carbide phases, the sample surface was prepared using Glycerigia etchant in accordance with ASTM E407. The SEM images demonstrated the presence of chromium carbide precipitation or traces at the grain boundaries of each stainless steel. This is shown in Figure 3. Figure 3a clearly indicates the formation of chromium carbide precipitates at grain boundaries of AISI 304. For AISI 304H and AISI 321H, discontinuous precipitation of chromium carbide can be detected at higher magnification, as shown in Figure 3b,c. Figure 3d shows an EDS line scan mode showing the concentrations of chromium and carbon across the grain boundary. This reveals that all three grades of stainless steel have the highest concentrations of chromium and carbon elements at this location after exposure to the salt melt for 300 h at 600 °C. This indicates a chromium carbide formation at the grain boundary and results in chromium depletion around the precipitates due to the consumption of chromium and carbon in stainless steel. However, what the evaluation results reveal regarding the susceptibility of IGC remains unclear.

3.1.2. IGC Susceptibility Assessed by Microstructural Analysis

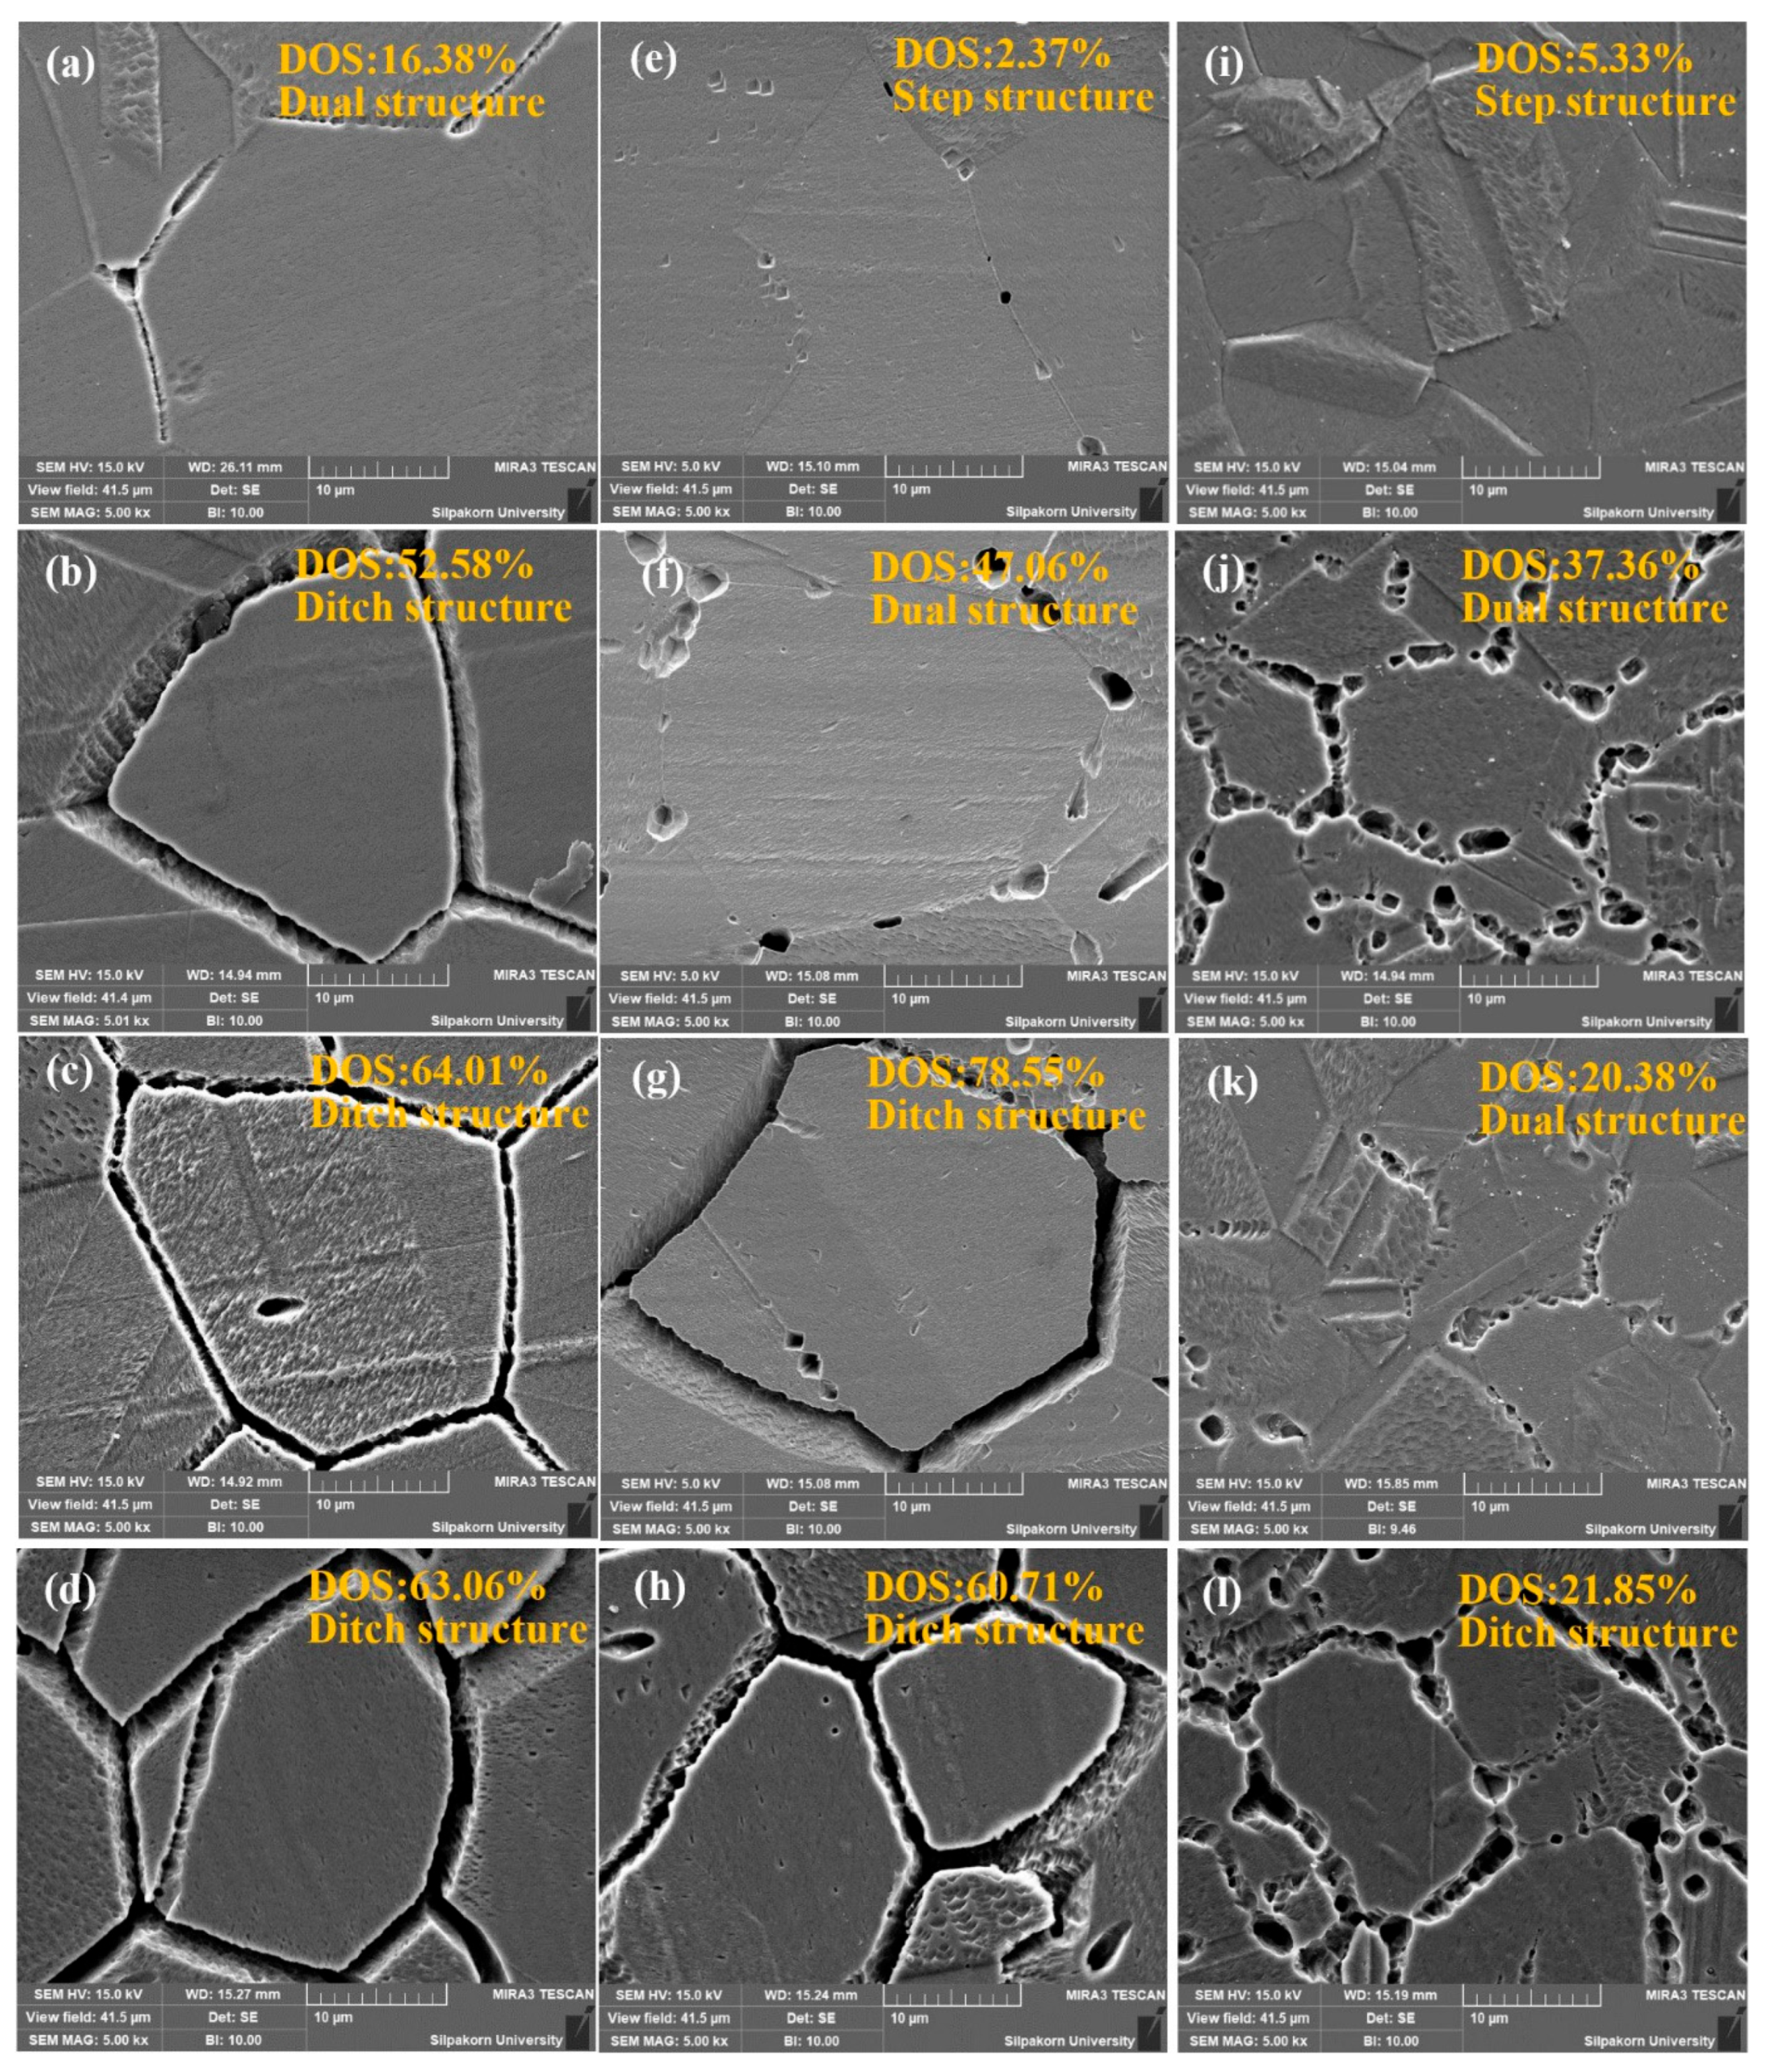
According to the ASTM A262, the oxalic test is used to assess IGC susceptibility after immersion in the salt melt at 600 °C. It is possible to reveal three types of microstructures following oxalic acid etching: a step structure form with no ditch at the grain boundary of a grain, a dual structure form containing a step and ditch co-existing around the grain, and a ditch structure form with a ditch surrounding the grain [21]. The ditch structure indicates a high degree of IGC susceptibility [19,23]. Figure 4a,e reveal that a dual structure can be formed at the first hour of immersion in the salt melt for AISI 304 and AISI 304H. In contrast, for AISI 321H, only the step structure is shown in Figure 4i. AISI 304H seems to have better tolerance to IGC than AISI 304 as its structure changes to a ditch structure within 100 h of immersion (Figure 4g), while AISI 304 evolves within 10 h of immersion (Figure 4b). It is quite interesting to note that for AISI 321H, although its structure changes to a ditch within 10 h of immersion, it recovers to a dual structure within 100 h (Figure 4i–k). Including the recovery effect, AISI 321H takes up to 300 h to conform to the ditch structure (Figure 4l). The step structure of AISI 321 after 2 h exposure was reported by Liu et al. [19]. As far as the authors are aware, this is the only study that has been conducted on microstructure using the oxalic test for exposure to molten salt, and the results are quite reproducible. Moreover, the oxalic test revealed a smaller grain size after immersion in the salt melt for AISI 304 and AISI 304H for 10 h and 100 h, while for AISI 321H, the refinement is unclear.

3.2. DL-EPR Measurement

The DL-EPR is the technique that assesses a quantitative measure of IGC susceptibility in terms of DOS. This technique was used to test stainless steel grades AISI 304, AISI 304H, and AISI 321H after exposure to molten salt at 600 °C for 1, 10, 100, and 300 h. When DL-EPR is conducted, the material undergoes dynamic polarization from Ecorr toward the anodic zone, passing through the passive region, where a stable passive film, such as a chromium oxide film, is formed. The potential scan then reverses to its original Ecorr value. During the subsequent anodic scan, this leads to the maximum current Ia, representing general corrosion behavior. Different alloying elements produce distinct passive films on the surface, which result in varying Ia values. Moreover, Ia can vary depending on the surface conditions or surface preparation. It is important to note, however, that Ia is independent of the DOS [24,25]. On the other hand, during the reverse potential scan, sites on the surface oxide film without stable oxide components or lacking stability due to sensitization experience corrosion. This leads to the reactivation peak current Ir. In this context, high-impact areas such as grain boundary areas exhibit elevated Ir values, resulting in higher DOS values, as defined by Equation (1).
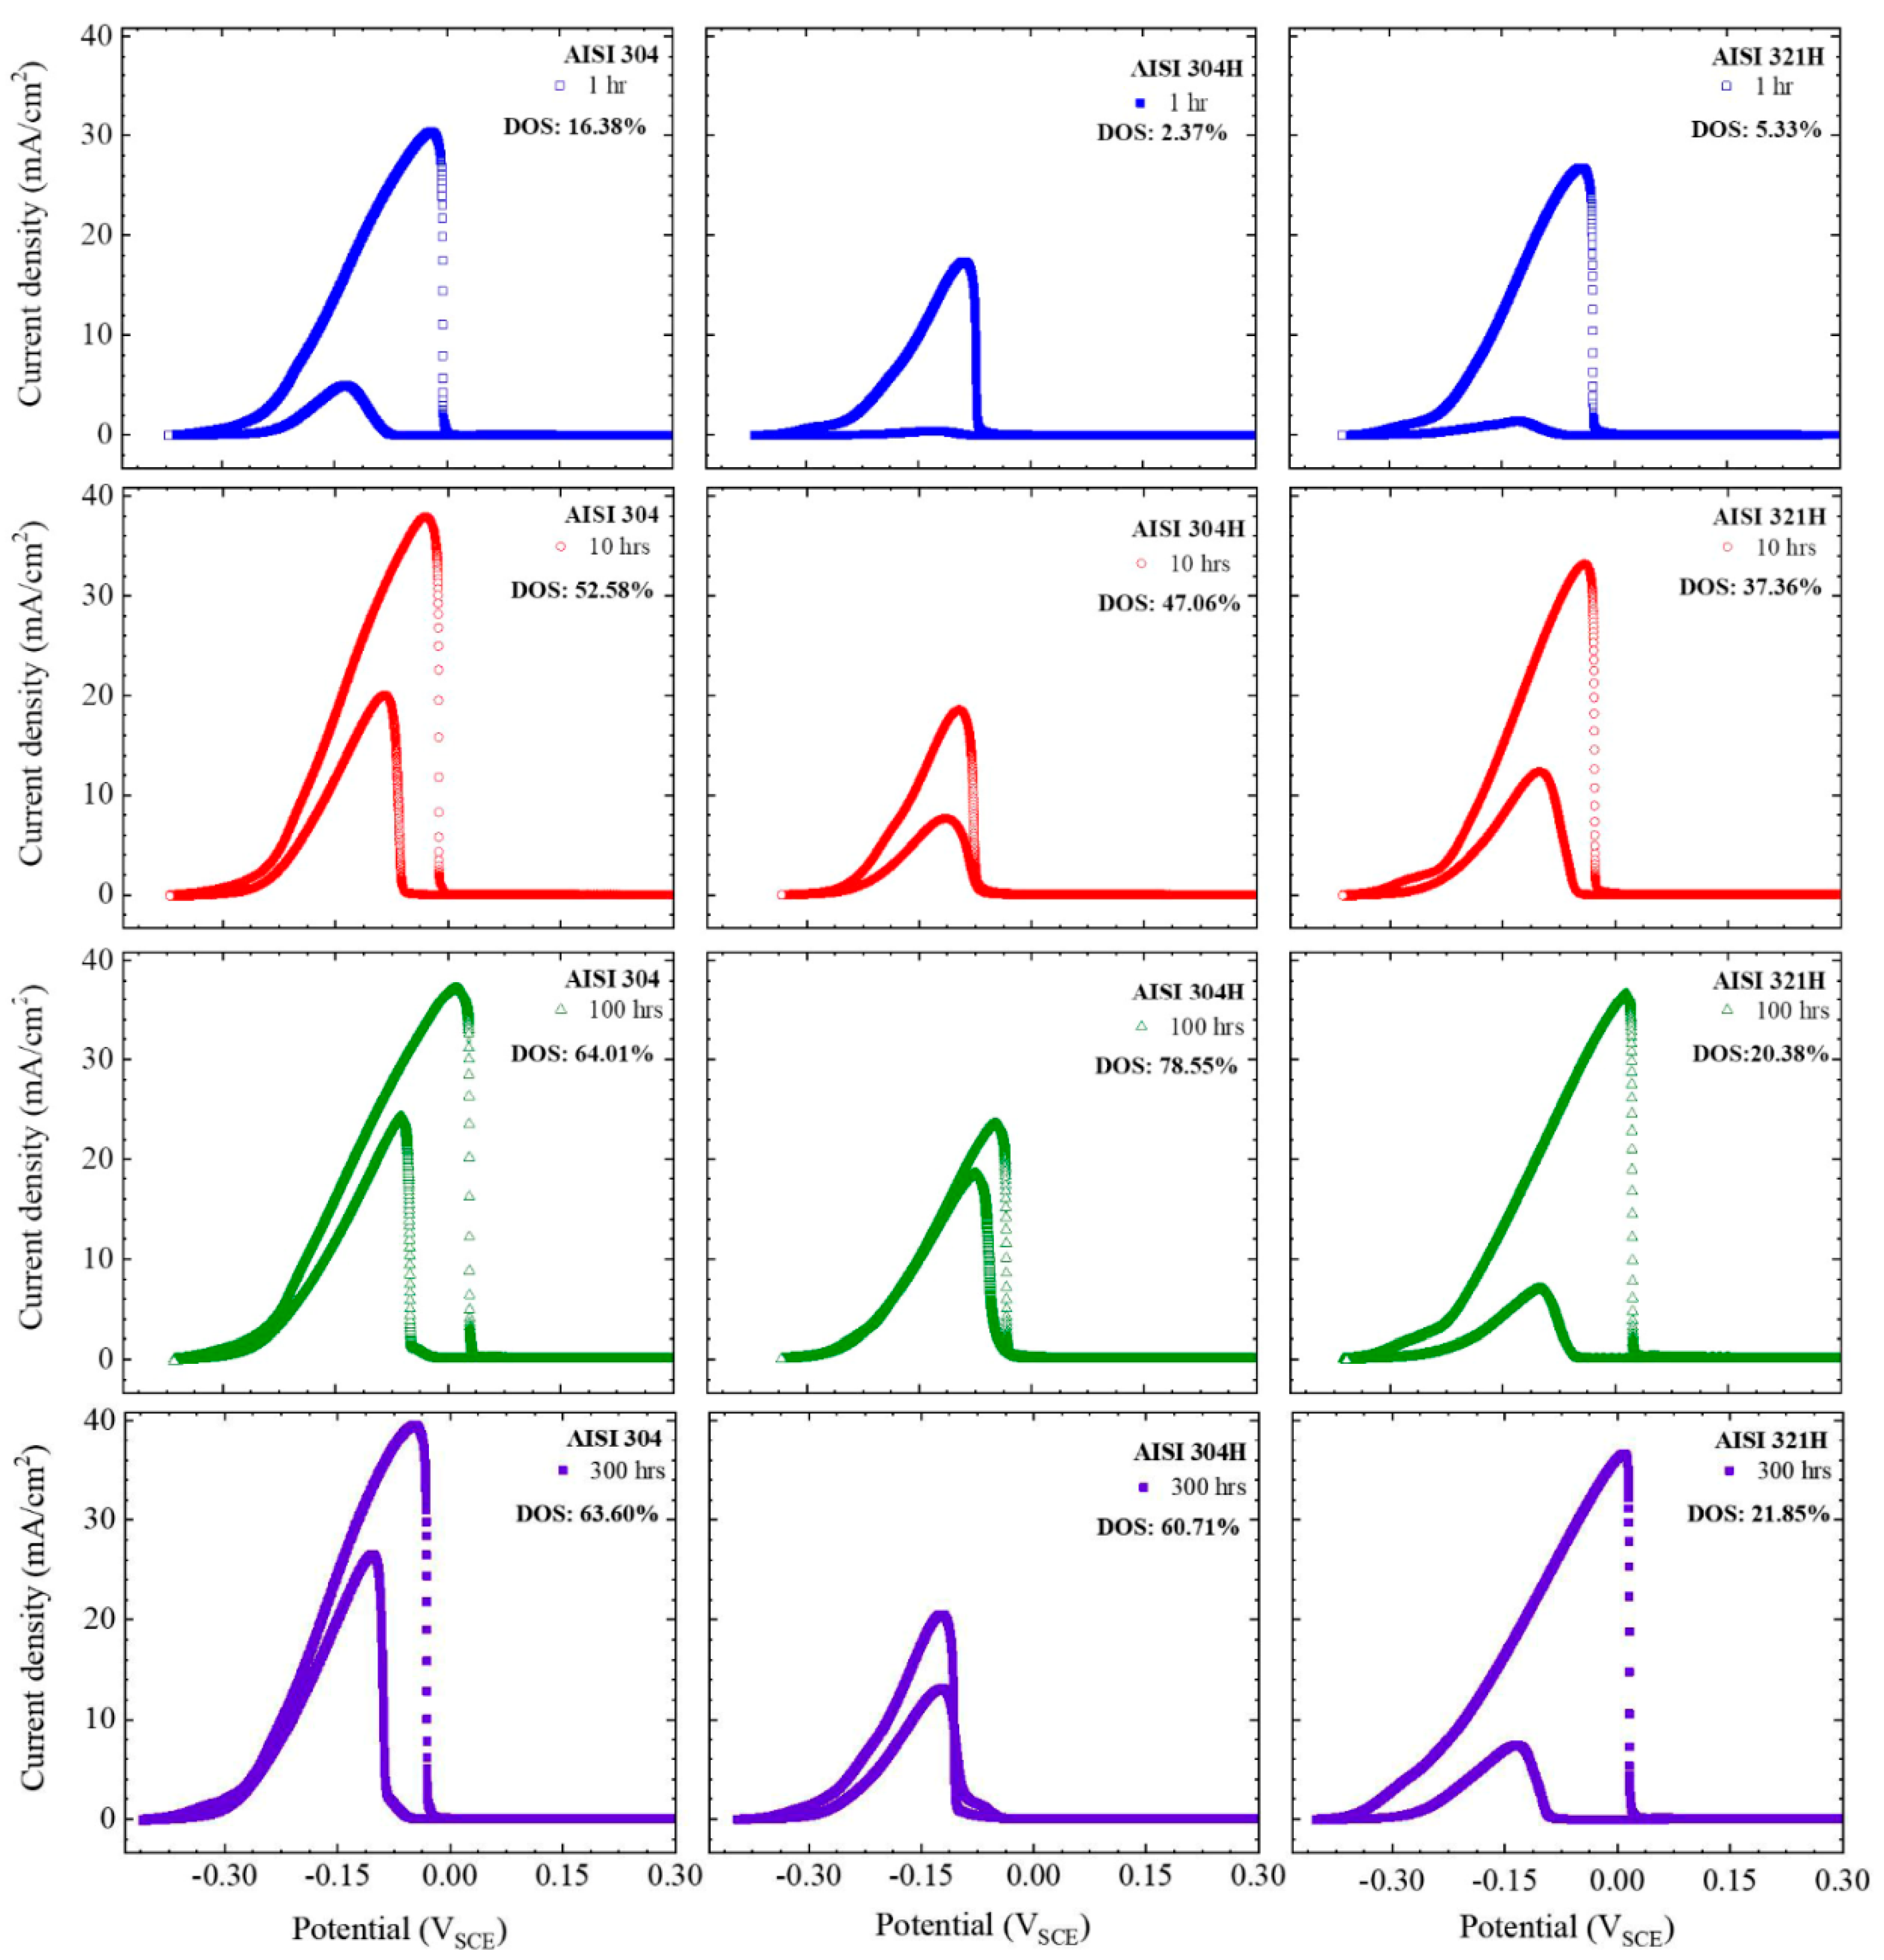
Figure 5 shows the DL-EPR loops of all samples. The detailed results of the DL-EPR measurement can also be found in Table 2. AISI 304H has lower Ia values than AISI 304, as depicted in Figure 5 in the center column. This result agrees with the lower corrosion rates of AISI 304H than AISI 304 due to the Cu addition reported by Pardo et al. [26]. Using the DL-EPR technique to investigate the sensitization of AISI 316L with a Cu addition, Parvathavarthini et al. also reported a decrease in Ia [27]. These confirm the consistency of the DL-EPR measurement. Furthermore, Table 2 shows mostly the increased trend of Ia after prolonged immersion time in molten nitrate salt. The maximum increase in Ia after an hour of exposure is less than 40% (27.8%, 34.9%, and 37.3% for AISI 304, AISI 304H, and AISI 321H, respectively). Compared to Ir after an hour of exposure, Ir can increase more than 300% (396%, 3340%, and 635% for AISI 304, AISI 304H, and AISI 321H, respectively). Additionally, Ir can decrease after 100 h, as seen with AISI 321H. The large Ir deviation indicates that IGC significantly impacts austenitic stainless steels in molten nitrate salts.
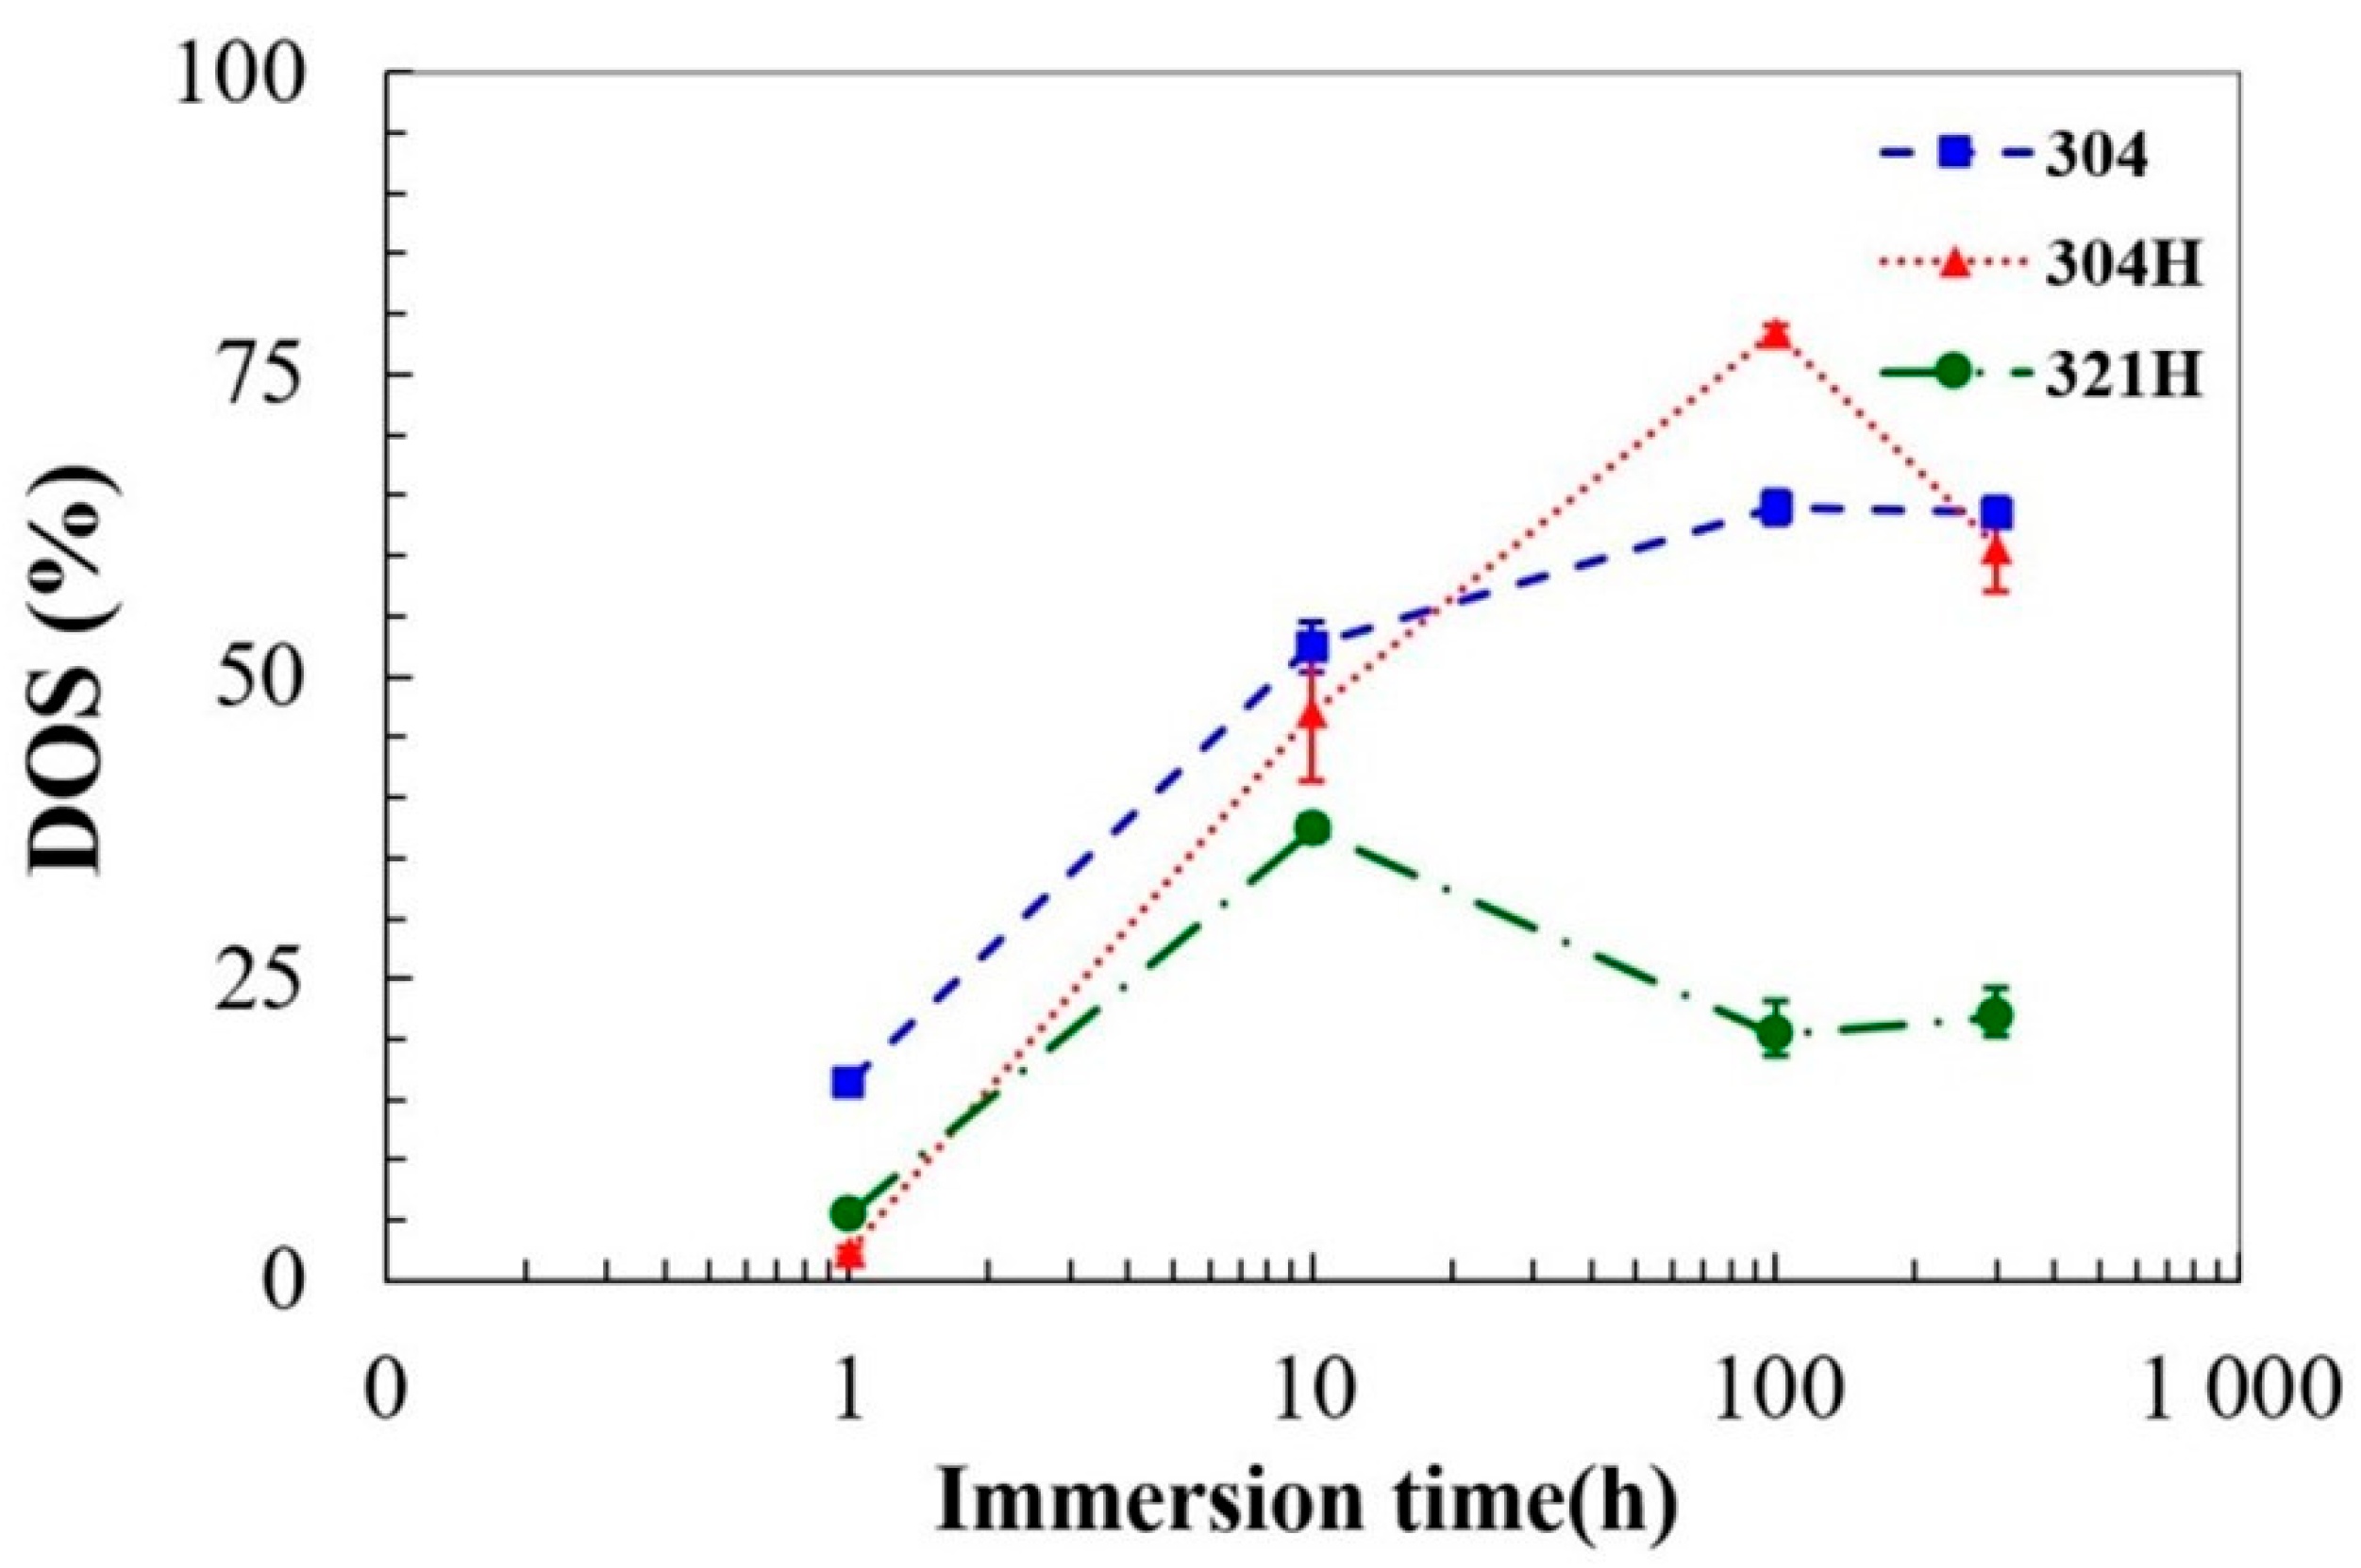
When comparing the DOS values of all three grades of stainless steel after exposure to molten salt at 600 °C for different times, Figure 6 shows the summarized DOS values. Several trends of DOS are observed.
AISI 304: In the first hour, the DOS value is low, approximately 16%. It increased dramatically from 16% to 53% within 10 h of exposure. Within 100 h, DOS reaches 64%, its maximum level. DOS remains high at nearly the same level at 300 h exposure. This agrees with the oxalic test results, which show the evolution of a dual structure to a ditch structure.
AISI 304H: Initially, the DOS value at 1 h is relatively the lowest among the three grades at approximately 2.4%. However, DOS increases dramatically, reaching its peak at 100 h with a value of approximately 79%. It then decreases to around 61% for 300 h of exposure. The DOS values show a closed trend compared to the oxalic test results, although a ditch structure appeared later within 100 h.
AISI 321H: Initially, DOS is low at approximately 5.3% after one hour of exposure. DOS increases, reaching its peak at 10 h with a value of approximately 37%. Within 100 h, DOS recovers to 20%, and within 300 h, it recovers to 21%. The recovery from a ditch structure to a dual structure corresponded to a decrease in DOS from 37% to 20% within 100 h of exposure.
The results indicate that high levels of DOS are present in materials such as AISI 304 and AISI 304H that have been exposed to 600 °C for a prolonged time. DOS recovery can be observed at exposure times of 300 h and 100 h for AISI 304H and AISI 321H, respectively. As compared to the oxalic test results, the recovery for AISI 321H appears to be quite consistent with DOS values, while for AISI 304H, the recovery of DOS values from 79% to 61% is hardly determined by the oxalic test microstructure due to its high DOS levels.
After DL-EPR testing, without additional surface preparation, samples were investigated for surface morphology using SEM. SEM images are not required to show the same results as the oxalic test due to the different methods. However, they do reveal remarkable signs of IGC over grain boundaries because of exposure to molten salt at 600 °C. Figure 7 illustrates this. In ASTM A262-15 practice A, SEM images can also be classified into three types of microstructures: step, dual, and ditch. Based on the microstructures observed in Figure 7a–d, for AISI 304 stainless steel, a dual structure evolves into a ditch structure after immersion for 10 h. Figure 7e–h demonstrate AISI 304H stainless steel microstructures, where a step structure is transformed into a dual and a ditch structure after immersion for 10 and 100 h, respectively. There is a similar evolution of microstructure from step to dual after the exposure of AISI 304H and AISI 321H for 10 h. The recovery of dual structures begins within 100 h, whereas ditch structures appear within 300 h of exposure for AISI 321H (see Figure 7k,l). The appearance of a ditch structure in AISI 304 indicates a higher susceptibility to IGC than in AISI 304H. A ditch structure is shown in Figure 7l for AISI 321H after up to 300 h of exposure. Accordingly, AISI 321H has the highest tolerance for IGC susceptibility of three grades of austenitic stainless steel.
The results of this test are mostly in accordance with those of the oxalic test. As the exposure time increased from 10 h to 100 h, the discontinuous trenches became shallower, as shown in Figure 7j,k for 321H. Based on the oxalic test and the DL-EPR method, the ditch microstructure has recovered to a dual structure. There is a possibility that the recovery phenomenon is due to the healing process. On the other hand, grain refinement after exposure up to 10 h and 300 h for 304 and 304H can also be observed. The results confirm the grain refinement phenomenon previously observed by the oxalic test after exposure to molten salt at 600 °C. The oxalic test or SEM analyses suggest that martensitic transformation is responsible for grain refinement. In general, martensitic transformation begins upon cooling below the martensitic starting temperature (Ms), which is approximately 280–400 °C [28,29]. Takaya explained that when 304 stainless steel was sensitized at temperatures of 500–800 °C, the chromium was depleted by about 4% or more near grain boundaries where the Ms became above room temperature, and the martensite phase would appear [30]. In such a case, the martensitic transformation is induced by sensitization. Thus, the Ms of AISI 321H is lower than that of 304 and 304H, owing to the higher alloying and lower Cr depletion of AISI 321H. Therefore, it is more difficult for the martensitic transformation to occur.

3.3. Pitting Potential Measurement

After sensitization in molten nitrate salt at 600 °C for both AISI 304 and AISI 304H, DOS monitored by DL-EPR generally increases with sensitization time. A healing effect, however, can result in a decrease in DOS, as seen in the case of AISI 321H. It is well known that stainless steel sensitization is due to chromium diffusion near the grain boundaries. This allows chromium to combine with carbon and precipitate as chromium carbides, leading to a higher risk of high levels of DOS or IGC [31,32]. In spite of the fact that chromium diffusion results in chromium depletion at grain boundaries, this depletion can be recovered by extending the sensitization time [33]. This leads to new passive film layers. Consequently, the Ir decreases, and the DOS value decreases as well. For DL-EPR testing, this phenomenon is called desensitization or the healing effect [24,34,35].
Taji et al. found that sensitization had a significant correlation with pitting corrosion behavior [36]. In the reverse view, if chromium recovery or the healing effect occurs, passive films will be enhanced, leading to an increase in Epit and a decrease in DOS. Hernández et al. reported the relation between Epit and DOS, where Epit declined as DOS increased [37]. Therefore, the pitting test was conducted on AISI 304, AISI 304H, and AISI 321H samples exposed to molten salt at 600 °C for up to 300 h. Figure 8a–c show polarization curves of AISI 304, AISI 304H, and AISI 321H, respectively. Likewise, the values of Epit at different exposure times plotted along with DOS assessed by DL-EPR are shown in Figure 8d–f. The data of Epit are also summarized in Table 3. It can be seen that the Epit values of all samples are greater than 400 mV/SCE for one hour of exposure to molten salt. After 10 h of exposure, they decline dramatically. The AISI 304 Epit values monotonically decline with the exposure duration (Figure 8d). It is worth noting that in response to sensitization, Epit declines rapidly within ten hours as a result of carbide precipitates; furthermore, the extended exposure time slows this decline with a healing effect [24]. In contrast, AISI 304H and AISI 321H exhibit Epit values that increase after sensitization for 100 and 10 h (Figure 8e,f), respectively. For both grades, the chromium content in the chromium-depleted zone also increases, confirming the healing effect due to chromium depletion recovery. Epit values vary with exposure times and exhibit an inverse relationship with DOS. For AISI 304H, after 100 h, exposure to molten salt resulted in DOS and Epit recovery. This result aligns with the self-healing of AISI 304H after annealing at 800 °C in air for 1 h and aging at 750 °C in air for 10 h reported by Abou-Elazm et al. [38] and Kannan et al. [23], respectively. However, as previously reported, the DOS of AISI 304H after exposure to molten salt at 600 °C is still high. This indicates that chromium recovery is still not fast enough to keep up with carbide formation.

3.4. The Healing Effect after Exposure to Molten Nitrate Salt

The significant IGC resistance of AISI 321H is often explained by the stabilization due to Ti, which is a carbide-forming element. To confirm this, microstructure analysis was carried out using SEM. The SEM and EDS mapping images of AISI 321H after exposure to molten nitrate salt at 600 °C for 10 h are shown in Figure 9. There are identical bright spots in the Ti and C mapping images where titanium carbide precipitates. The precipitation of titanium carbide can be observed partially at the grain boundary. As reported by Liu et al., there was such a precipitation of titanium carbide in AISI 321 after exposure to molten salt for two hours [19]. Thorvaldsson et al. reported that when Ti stabilizes, austenitic stainless steel is sensitized at 750 °C in air and chromium carbide dominates, while (Ti,C) is partially present in the carbide phase. (Ti,C) can be detected immediately after 5 min at 750 °C, and the volume fraction of (Ti,C) increases with increased aging time, whereas (Cr,C) phase decreases [39]. This may be the reason for the dramatic increase in DOS after exposure to molten salt for 10 h of AISI 321H. This is when chromium carbide precipitates dominantly form. Later binding of carbon to Ti results in chromium recovery and the healing effect.

4. Conclusions

IGC is a crucial corrosion mode for stainless steel exposed to molten nitrate salt. The IGC behavior of three grades of austenitic stainless steel, AISI 304, AISI 304H, and AISI 321H, after exposure to molten nitrate salt for a prolonged time was investigated using the oxalic test and DL-EPR testing. In the oxalic test, AISI 304 and 304H were highly susceptible to IGC. This was revealed by the appearance of ditch structures after exposure to molten salt for 10 and 100 h, in addition to the DOS values of over 60%. As a result of prolonged exposure time, the two stainless steels underwent grain refinement due to intergranular attack caused by sensitization-induced martensitic transformation. For AISI 321H, however, the recovery can be clearly observed within 100 h of exposure through the evolution of the dual structure from the ditch structure. These oxalic test results were consistent with DL-EPR DOS results. The pitting potential measurement was also applied to confirm the DOS values and to assess chromium depletion and recovery as a result of the healing process. According to the findings of this study, the healing effect is largely due to precipitates of Ti carbide that increase with increasing exposure time to molten salt, which allows chromium to be recovered.

Author Contributions

Conceptualization: N.K., T.S. and P.P.; Methodology: N.K., T.S. and P.P.; Formal Analysis: N.K., T.S. and P.P.; Writing—Original Draft: N.K., T.S. and P.P.; Writing—Review and Editing: N.K., T.S. and P.P.; Funding Acquisition: T.S.; Resources: T.S., P.P. and N.K.; Supervision: P.P. All authors have read and agreed to the published version of the manuscript.

Funding

This research was funded by National Science, Research and Innovation Fund (NSRF), and King Mongkut’s University of Technology North Bangkok with Contract no. KMUTNB-FF-65-31.

Data Availability Statement

The data presented in this study are available upon request from the corresponding author.

Acknowledgments

Noparat Kanjanaprayut thanks Siriporn Daopiset for the fruitful discussion.

Conflicts of Interest

The authors declare no conflicts of interest.

References

  1. Belgasima, B.; Aldali, Y.; Abdunnabi, M.J.R.; Hashem, G.; Hossin, K. The potential of concentrating solar power (CSP) for electricity generation in Libya. Renew. Sustain. Energy Rev. 2018, 90, 1–15. [Google Scholar] [CrossRef]
  2. Ummadisingu, A.; Soni, M.S. Concentrating solar power–technology, potential and policy in India. Renew. Sustain. Energy Rev. 2011, 15, 5169–5175. [Google Scholar] [CrossRef]
  3. Baharoon, D.A.; Rahman, H.A.; Omar, W.Z.W.; Fadhl, S.O. Historical development of concentrating solar power technologies to generate clean electricity efficiently–A review. Renew. Sustain. Energy Rev. 2015, 41, 996–1027. [Google Scholar] [CrossRef]
  4. Ziuku, S.; Seyitini, L.; Mapurisa, B.; Chikodzi, D.; van Kuijk, K. Potential of concentrated solar power (CSP) in Zimbabwe. Energy Sustain. Dev. 2014, 23, 220–227. [Google Scholar] [CrossRef]
  5. Lovegrove, K.; Stein, W. Concentrating Solar Power Technology: Principles, Developments and Applications; Woodhead Publishing: Cambridge, UK, 2012. [Google Scholar]
  6. Modi, A.; Bühler, F.; Andreasen, J.G.; Haglind, F. A review of solar energy based heat and power generation systems. Renew. Sustain. Energy Rev. 2017, 67, 1047–1064. [Google Scholar] [CrossRef]
  7. Khorsand, S.; Sheikhi, A.; Raeissi, K.; Golozar, M.A. Hot corrosion behavior of Inconel 625 superalloy in eutectic molten nitrate salts. Oxid Met. 2018, 90, 169–186. [Google Scholar] [CrossRef]
  8. Dorcheh, A.S.; Durham, R.N.; Galetz, M.C. Corrosion behavior of stainless and low-chromium steels and IN625 in molten nitrate salts at 600 °C. Sol. Energy Mater. Sol. Cells 2016, 144, 109–116. [Google Scholar] [CrossRef]
  9. Maziasz, P.J. Developing an austenitic stainless steel for improved performance in advanced fossil power facilities. JOM 1989, 41, 14–20. [Google Scholar] [CrossRef]
  10. Tanaka, H.; Murata, M.; Abe, F.; Irie, H. Microstructural evolution and change in hardness in type 304H stainless steel during long-term creep. Mater. Sci. Eng. A 2001, 319, 788–791. [Google Scholar] [CrossRef]
  11. Wang, W.; Guan, B.; Li, X.; Lu, J.; Ding, J. Corrosion behavior and mechanism of austenitic stainless steels in a new quaternary molten salt for concentrating solar power. Sol. Energy Mater. Sol. Cells 2019, 194, 36–46. [Google Scholar] [CrossRef]
  12. Encinas-Sánchez, V.; Lasanta, M.I.; De Miguel, M.T.; García-Martín, G.; Pérez, F.J. Corrosion monitoring of 321H in contact with a quaternary molten salt for parabolic trough CSP plants. Corros. Sci. 2021, 178, 109070. [Google Scholar] [CrossRef]
  13. Zhang, X.; Zhang, C.; Wu, Y.; Lu, Y. Experimental research of high temperature dynamic corrosion characteristic of stainless steels in nitrate eutectic molten salt. Sol. Energy 2020, 209, 618–627. [Google Scholar] [CrossRef]
  14. Li, H.; Wang, X.; Yin, X.; Yang, X.; Tang, J.; Gong, J. Corrosion and electrochemical investigations for stainless steels in molten Solar Salt: The influence of chloride impurity. J. Energy Storage 2021, 39, 102675. [Google Scholar] [CrossRef]
  15. Federsel, K.; Wortmann, J.; Ladenberger, M. High-temperature and Corrosion Behavior of Nitrate Nitrite Molten Salt Mixtures Regarding their Application in Concentrating Solar Power Plants. Energy Procedia 2015, 69, 618–625. [Google Scholar] [CrossRef]
  16. Ren, S.; Chen, Y.; Ye, X.X.; Jiang, L.; Yan, S.; Liang, J.; Yang, X.; Leng, B.; Li, Z.; Chen, Z.; et al. Corrosion behavior of carburized 316 stainless steel in molten chloride salts. Sol. Energy 2021, 223, 1–10. [Google Scholar] [CrossRef]
  17. Wilson, F.G. Mechanism of intergranular corrosion of austenitic stainless steels—Literature review. Br. Corros. J. 1971, 6, 100–108. [Google Scholar] [CrossRef]
  18. Aydoğdu, G.H.; Aydinol, M.K. Determination of susceptibility to intergranular corrosion and electrochemical reactivation behaviour of AISI 316L type stainless steel. Corros. Sci. 2006, 48, 3565–3583. [Google Scholar] [CrossRef]
  19. Liu, Q.; Qian, J.; Barker, R.; Wang, C.; Neville, A.; Pessu, F. Application of double loop electrochemical potentio-kinetic reactivation for characterizing the intergranular corrosion susceptibility of stainless steels and Ni-based alloys in solar nitrate salts used in CSP systems. Eng. Fail. Anal. 2021, 129, 105717. [Google Scholar] [CrossRef]
  20. ASTM E407-07; Standard Practices for Microetching Metals and Alloys. ASTM International: West Conshohocken, PA, USA, 2015.
  21. ASTM A262-15; Standard Practices for Detecting Susceptibility to Intergranular Attack in Austenitic Stainless Steels. ASTM International: West Conshohocken, PA, USA, 2021.
  22. ISO 12732:2006(E); Corrosion of Metals and Alloys—Electrochemical Potentiokinetic Reactivation Measurement Using the Double Loop Method (Based on Čihal’s Method). International Organization for Standardization: Geneva, Switzerland, 2006.
  23. Kannan, P.R.; Muthupandi, V.; Devakumaran, K.; Sridivya, C.; Arthi, E. Effect of grain size on self-healing behaviour of sensitized S304HCu stainless steel. Mater. Chem. Phys. 2018, 207, 203–211. [Google Scholar] [CrossRef]
  24. Kauss, N.; Heyn, A.; Halle, T.; Rosemann, P. Detection of sensitisation on aged lean duplex stainless steel with different electrochemical methods. Electrochim. Acta 2019, 317, 17–24. [Google Scholar] [CrossRef]
  25. Lopez, N.; Cid, M.; Puiggali, M.; Azkarate, I.; Pelayo, A. Application of double loop electrochemical potentiodynamic reactivation test to austenitic and duplex stainless steels. Mater. Sci. Eng. A 1997, 229, 123–128. [Google Scholar] [CrossRef]
  26. Pardo, A.; Merino, M.C.; Carboneras, M.; Coy, A.E.; Arrabal, R. Pitting corrosion behaviour of austenitic stainless steels with Cu and Sn additions. Corros. Sci. 2007, 49, 510–525. [Google Scholar] [CrossRef]
  27. Parvathavarthini, N.; Mulki, S.; Dayal, R.K.; Samajdar, I.; Mani, K.V.; Raj, B. Sensitization control in AISI 316L (N) austenitic stainless steel: Defining the role of the nature of grain boundary. Corros. Sci. 2009, 51, 2144–2150. [Google Scholar] [CrossRef]
  28. García-Junceda, A.; Capdevila, C.; Caballero, F.G.; De Andrés, C.G. Dependence of martensite start temperature on fine austenite grain size. Scr. Mater. 2008, 58, 134–137. [Google Scholar] [CrossRef]
  29. Yang, H.S.; Bhadeshia, H.K.D.H. Austenite grain size and the martensite-start temperature. Scr. Mater. 2009, 60, 493–495. [Google Scholar] [CrossRef]
  30. Takaya, S.; Suzuki, T.; Matsumoto, Y.; Demachi, K.; Uesaka, M. Estimation of stress corrosion cracking sensitivity of type 304 stainless steel by magnetic force microscope. J. Nucl. Mater. 2004, 327, 19–26. [Google Scholar] [CrossRef]
  31. Lima, A.S.; Nascimento, A.M.D.; Abreu, H.F.G.D.; de Lima-Neto, P. Sensitization evaluation of the austenitic stainless steel AISI 304L, 316L, 321 and 347. J. Mater. Sci. 2005, 40, 139–144. [Google Scholar] [CrossRef]
  32. Gajjar, P.K.; Khatri, B.C.; Siddhpura, A.M.; Siddhpura, M.A. Sensitization and Desensitization (Healing) in Austenitic Stainless Steel: A Critical Review. Trans. Indian Inst. Met. 2022, 75, 1411–1427. [Google Scholar] [CrossRef]
  33. Tokunaga, T.; Ohtani, H.; Ågren, J. Evaluation of sensitization and self-healing in austenitic stainless steels based on simulations of Cr-depleted zones. ISIJ Int. 2011, 51, 965–968. [Google Scholar] [CrossRef]
  34. Wang, R.; Zheng, Z.; Zhou, Q.; Gao, Y. Effect of surface nanocrystallization on the sensitization and desensitization behavior of Super304H stainless steel. Corros. Sci. 2016, 111, 728–741. [Google Scholar] [CrossRef]
  35. Kolli, S.; Ohligschläger, T.; Kömi, J.; Porter, D. Sensitization and self-healing in austenitic stainless steel: Quantitative prediction considering carbide nucleation and growth. ISIJ Int. 2019, 59, 2090–2097. [Google Scholar] [CrossRef]
  36. Taji, I.; Moayed, M.H.; Mirjalili, M. Correlation between sensitisation and pitting corrosion of AISI 403 martensitic stainless steel. Corros. Sci. 2015, 92, 301–308. [Google Scholar] [CrossRef]
  37. Calderón-Hernández, J.W.; Hincapie-Ladino, D.; Filho, E.B.M.; Magnabosco, R.; Alonso-Falleiros, N. Relation between pitting potential, degree of sensitization, and reversed austenite in a supermartensitic stainless steel. Corrosion 2017, 73, 953–960. [Google Scholar] [CrossRef] [PubMed]
  38. Abou-Elazm, A.; Abdel-Karim, R.; Elmahallawi, I.; Rashad, R. Correlation between the degree of sensitization and stress corrosion cracking susceptibility of type 304H stainless steel. Corros. Sci. 2009, 51, 203–208. [Google Scholar] [CrossRef]
  39. Thorvaldsson, T.; Dunlop, G.L. Effect of stabilizing additions on precipitation reactions in austenitic stainless steel. Met. Sci. 1982, 16, 184–190. [Google Scholar] [CrossRef]
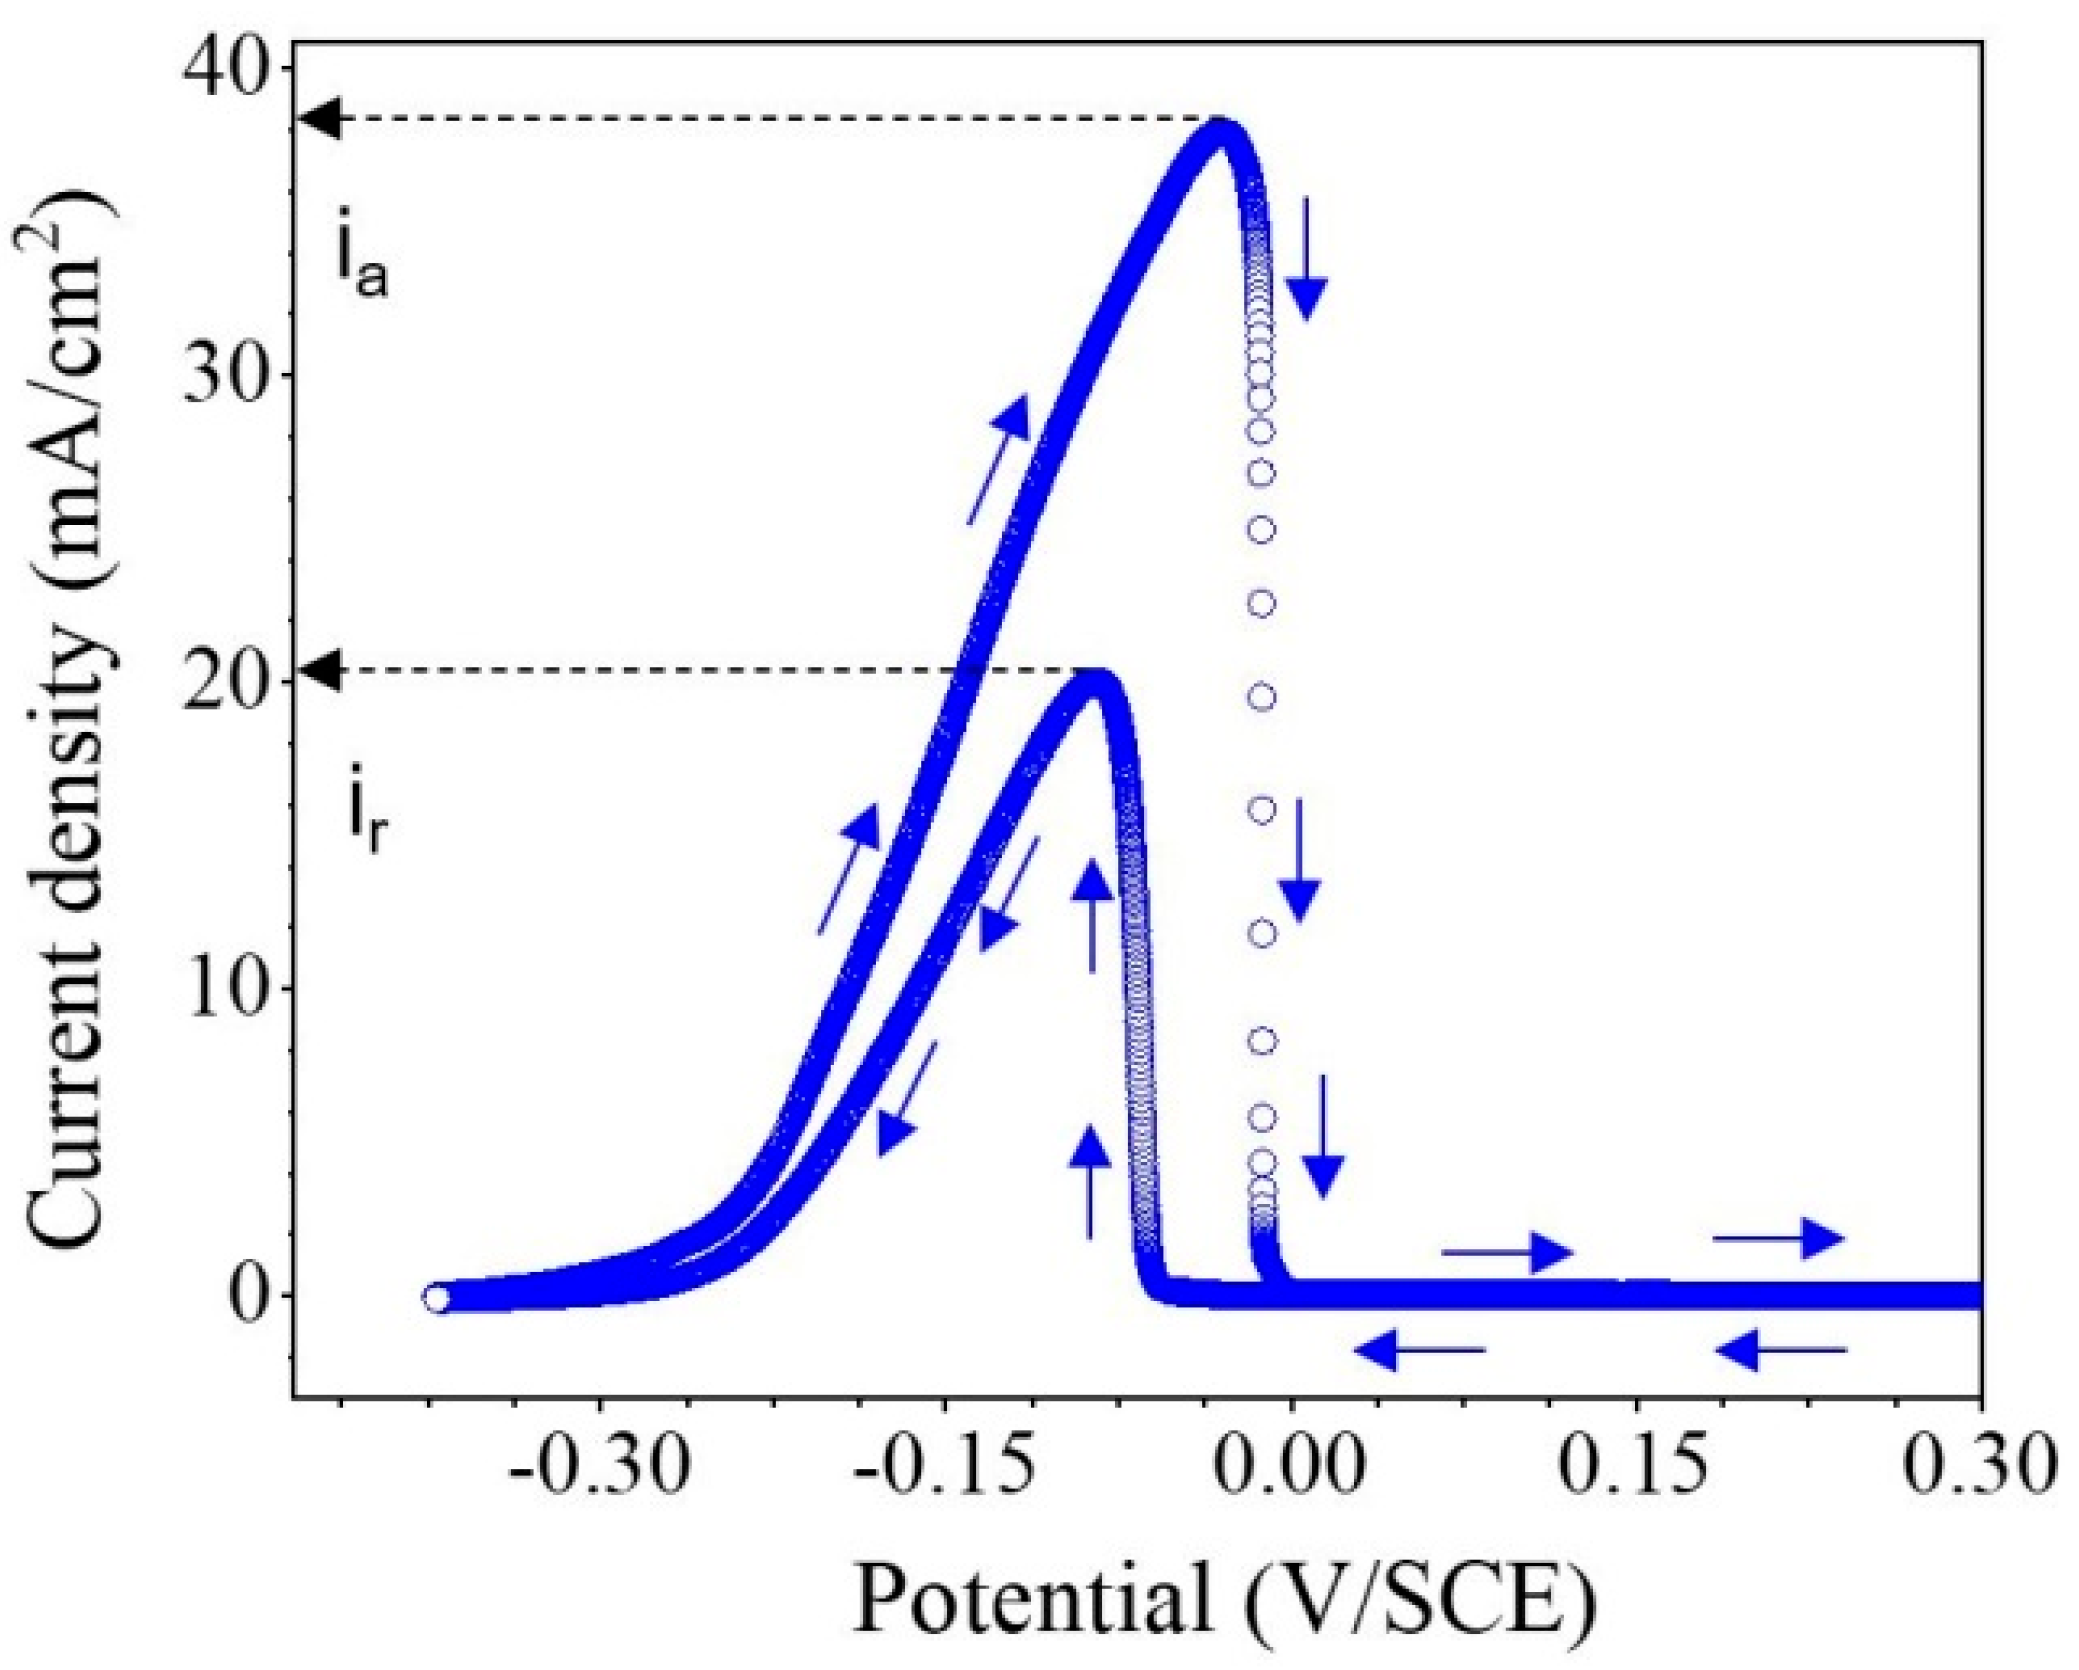
Figure 1. Schematic DLEPR curve showing Ia and Ir.
Metals 14 00106 g001
Figure 2. Schematic potentiodynamic polarization curve showing Epit at 100 µA/cm2.
Metals 14 00106 g002
Figure 3. SEM images of the stainless steel samples with EDS scan red lines (a) AISI 304, (b) AISI 304H, and (c) AISI 321H after exposure to molten salt at 600 °C for 300 h. (d) EDS line scan across grain boundaries showing quantitative counts of Cr and C for AISI 304, 304H, and 321H.
Metals 14 00106 g003
Figure 4. Microstructure images of austenitic stainless steels after the oxalic test of AISI 304 (ad), AISI 304H (eh), and AISI 321H (il) after exposure to molten salt at 600 °C for 1, 10, 100, and 300 h.
Metals 14 00106 g004
Figure 5. DL-EPR curves of AISI 304 (in the left column), AISI 304H (in the center column), and AISI 321H (in the right column) after being sensitized at 600 °C for 1, 10, 100, and 300 h in molten salt.
Metals 14 00106 g005
Figure 6. DOS values evaluated by DL-EPR measurement for austenitic stainless steels AISI 304, AISI 304H, and AISI 321H after immersion in salt melt at 600 °C for 1, 10, 100, and 300 h.
Metals 14 00106 g006
Figure 7. SEM images after DL-EPR testing of all stainless steels after exposure to molten salt at 600 °C for 1, 10, 100, and 300 h. These images are for AISI 304 (ad), AISI 304H (eh), and AISI 321H (il).
Metals 14 00106 g007
Figure 8. Polarization curves of pitting corrosion testing using potentiodynamic polarization in 3.5% NaCl solution (ac) for AISI 304, AISI 304H, and AISI 321H after sensitization in salt melt at 600 °C, respectively. Likewise, the values of Epit (round markers with blue broken lines) at different exposure times plotted along with DOS (square markers with red broken lines) assessed by DL-EPR (df).
Metals 14 00106 g008
Figure 9. The SEM and EDS mapping mapping images of AISI 321H after exposure to molten nitrate salt at 600 °C for 10 h.
Metals 14 00106 g009
Table 1. Chemical composition of austenitic stainless steels.
MaterialsNiCMoMnPSSiCrTiNCuNbFe
AISI 3048.2620.0470.0491.0260.025<0.0010.40618.4<0.0010.0440.040.007Bal.
AISI 304H8.0650.0460.2981.4740.060.0020.4418.41<0.0010.0460.4980.015Bal.
AISI 321H9.1590.0550.2001.5270.0250.0040.5517.280.3910.0430.3320.014Bal.
Table 2. Activation peak current density (Ia), reactivation peak current density (Ir), and DOS of AISI 304, AISI 304H, and AISI 321H after exposure to molten salt at 600 °C for various immersion times.
MaterialsImmersion
Time (h)
Ia (mA/cm2)Ir (mA/cm2)DOS (%)
AISI 304131.26 ± 1.335.12 ± 0.2116.38 ± 0.01
1038.99 ± 2.1720.50 ± 1.8952.58 ± 2.08
10036.84 ± 0.4823.58 ± 0.3664.01 ± 1.80
30039.96 ± 0.3325.42 ± 0.2163.60 ± 0.01
AISI 304H117.66 ± 0.260.42 ± 0.062.37 ± 0.31
1018.63 ± 0.688.79 ± 1.3347.06 ± 6.05
10016.54 ± 0.4512.99 ± 0.2678.55 ± 0.59
30023.82 ± 0.4514.46 ± 1.0660.71 ± 3.47
AISI 321H126.68 ± 0.401.70 ± 0.516.37 ± 1.80
1033.46 ± 0.4612.50 ± 0.2537.36 ± 1.12
10036.62 ± 0.197.46 ± 0.9120.38 ± 2.49
30036.62 ± 0.208.00 ± 0.7321.85 ± 2.07
Table 3. Pitting potentials (Epit) of AISI 304, AISI 304H, and AISI 321H sensitized in molten salt at 600 °C for various immersion durations, using potentiodynamic polarization in 3.5% NaCl solution.
MaterialsPitting Potential (mV/SCE)
Sensitization Time in Molten Salt at 600 °C (h)
110100300
AISI 304421.95332.64302.70303.16
AISI 304H435.32357.44308.78337.50
AISI 321H411.35331.09388.76363.46
Disclaimer/Publisher’s Note: The statements, opinions and data contained in all publications are solely those of the individual author(s) and contributor(s) and not of MDPI and/or the editor(s). MDPI and/or the editor(s) disclaim responsibility for any injury to people or property resulting from any ideas, methods, instructions or products referred to in the content.